")
Back to Journals » International Journal of Nanomedicine » Volume 20
Acid-Unlocked Two-Layer Ca-Loaded Nanoplatform to Interfere With Mitochondria for Synergistic Tumor Therapy
Authors Zheng Y, Williams GR, Hu R, Tong S, Xu J, Wang T , Zhang Y, Wu J, Li F, Cai Y, Zhu LM
Received 28 October 2024
Accepted for publication 16 January 2025
Published 12 February 2025 Volume 2025:20 Pages 1899—1920
DOI https://doi.org/10.2147/IJN.S503248
Checked for plagiarism Yes
Review by Single anonymous peer review
Peer reviewer comments 3
Editor who approved publication: Prof. Dr. RDK Misra
Yilu Zheng,1 Gareth R Williams,2 Ran Hu,1 Sen Tong,3 Jianxiang Xu,1 Tong Wang,1 Yanyan Zhang,1 Junzi Wu,3 Fan Li,4 Yingyu Cai,4 Li-Min Zhu1
1College of Biological Science and Medical Engineering, Shanghai Engineering Research Center of Nano-Biomaterials and Regenerative Medicine, Donghua University, Shanghai, 201620, People’s Republic of China; 2UCL School of Pharmacy, University College London, London, WC1N 1AX, UK; 3The Key Laboratory of Microcosmic Syndrome Differentiation, Education Department of Yunnan, Yunnan University of Chinese Medicine, Kunming, 650500, People’s Republic of China; 4Department of Ultrasound, Shanghai General Hospital, Shanghai Jiao Tong University School of Medicine, Shanghai, 201620, People’s Republic of China
Correspondence: Yingyu Cai, Department of Ultrasound, Shanghai General Hospital, Shanghai Jiao Tong University School of Medicine, Shanghai, 201620, People’s Republic of China, Email [email protected] Li-Min Zhu, College of Biological Science and Medical Engineering, Shanghai Engineering Research Center of Nano-Biomaterials and Regenerative Medicine, Donghua University, Shanghai, 201620, People’s Republic of China, Email [email protected]
Background: The development of selective formulations able to target and kill tumor cells without the application of external energy has shown great promise for anti-tumor therapy.
Methods: Here, we report a “nanobomb” that explosively increases Ca content within cells. It can selectively release Ca2+ and generate H2O2 in the tumor microenvironment (TME) by acid-triggered degradation of the two-layer protective shell (ie, unlocking the “double-lock”). This material, termed CaO2@ZIF8:CUR@PAA, comprises a CaO2 core coated with the ZIF-8 framework, which was then loaded with curcumin (CUR) and coated again with polyacrylic acid (PAA).
Results: Under the slightly acidic conditions of the TME, the PAA shell (first lock) breaks down first exposing CaO2@ZIF8 and CUR inside the cell. Then, ZIF8 (second lock) is degraded in response to acid to deposit Ca2+, and H2O2. CUR can promote the release of Ca2+ from the endoplasmic reticulum to the cytoplasm, inhibit the outflow of Ca2+, and accumulates a large amount of Ca2+ intracellularly together with exogenous Ca2+ (calcium storms). The powerful calcium storm that causes mitochondrial dysfunction. The presence of a large amount of exogenous H2O2 causes further oxidative damage to tumor cell membranes and mitochondria where intracellular ROS production far exceeds clearance. CaO2@ZIF8:CUR@PAA NPs can induce cell S cycle arrest and apoptosis to inhibit tumor multiplication and growth. Oxidative damage-triggered immunogenic cell death (ICD) in turn leads to the polarization of macrophages to the M1 phenotype, inducing immunogenic cell death and inhibiting tumor cell proliferation and metastasis.
Discussion: The acid two-step unlocking nanoplatform is a therapeutic modality that combines calcium storm and oxidative damage. The mode triggers apoptosis leading to ICD of tumor cells. The material induces cycle blockade during treatment to inhibit cell proliferation. Robust in vitro and in vivo data demonstrate the efficacy of this approach and CaO2@ZIF8:CUR@PAA as an anticancer platform, paving the way for nanomaterials in immune-triggered cancer therapy.
Highlights: - A new calcium accumulation nanoplatform plays a role in activate antitumor immunity.- Double-locked structure slows down the premature decomposition of CaO2.- The platform allows Ca2+ and H2O2 to accumulate in tumor cells.- This leads to mitochondrial dysfunction, apoptosis, and M1 macrophage polarization.- Potent anti-tumor effects are seen both in vitro and in vivo.
Keywords: Calcium ion load, controlled-release nanomaterials, two-layer protective shell, pH responsive drug release, reactive oxygen species, anti-cancer
Graphical Abstract:
Introduction
Traditional chemotherapy and radiotherapy can induce tumor cell apoptosis and inhibit growth, achieving the goal of treating cancer. However, such treatment methods have extensive side effects and rather low efficacy. In order to overcome the shortcomings of traditional therapies and more effectively inhibit tumor growth, the “precise tumor therapy” model targeting specific organelles has been developed. Drugs that functions in specific organelles can trigger organelle-mediated apoptosis.1 Nanoformulations can target and disrupt the functions of organelles, including the nucleus, mitochondria, lysosomes, and endoplasmic reticulum.2–7 Mitochondria are the energy supply centers of cells, but also affect a range of other phenomena such as migration and metastasis, and a cell’s ability to overcome exogenous stress (eg chemotherapy). They play a crucial role in tumor proliferation and cell apoptosis.8 Cancer therapy targeting mitochondria can directly inhibit the energy provided to cells, leading to cell death. Therefore, interfering with mitochondrial function and inducing mitochondrial mediated cell death is an emerging strategy that can improve therapeutic efficacy.
Nanotechnology has been extensively developed for tumor therapy due to its high efficiency and ability to give precisely controlled release.9 Although nanotechnology is promising, the biocompatibility and selectivity of nanoscale formulations need to meet stringent requirements; anti-tumor biological mechanisms need to be studied in depth;10 and the lack of comprehensive toxicology studies presents challenges in clinical translation.11 Metal-based nanomaterials need to be extensively and intensively investigated due to the aforementioned challenges. Among these, the development of calcium-based nanomaterials has attracted great interest from researchers due to their biocompatibility and ease of metabolism in the human body.
In recent years, CaO2 has often been used for ion interference and targeting mitochondria in tumor therapeutic due to its excellent Ca2+ and H2O2 release ability.12 The severe water instability of CaO2 rapidly releases Ca2+ and H2O2 without any protection, resulting in its inability to function in tumors. Therefore, to prevent premature release of Ca2+ and H2O2 from CaO2, it needs to be protected by a shell. The complex tumor microenvironment (TME) promotes tumor angiogenesis and metastasis and helps tumors to develop drug resistance.13 However, specific TME features (hypoxia, acidic pH, excess H2O2, etc.) can be used to trigger nanoplatforms to respond intelligently and deliver drugs to improve therapeutic efficacy.14
The most prominent TME feature is its acidic pH. Common acid-responsive shells include: hyaluronic acid,15 chitosan,16 micelle17 and lipids.18 The pH sensitive hyaluronic acid modified calcium peroxide nanoparticles can effectively induce calcium overload.19 However, hyaluronic acid is prone to natural decomposition, limiting the effective release of CaO2. And metal organic framework (MOF) materials with good stability, variable porosity and easy modification to impart stimuli-responsive properties may be a better choice for CaO2 delivery.20 A single MOF shell would still face some challenges: co-delivery of two or more active substances may accelerate MOF disintegration,21 and the porous surface is prone to adsorb small molecules but leakage occurs before reaching the site of action.22 A dual-layer protection system could be a solution, where different active substances are encapsulated in different layers, avoiding the shortcomings of a single-layer protection system to enhance therapeutic efficacy.
The production of Ca2+ and H2O2 causes a decrease in mitochondrial membrane potential, ie, a drastic reduction in mitochondrial activity. For better therapeutic outcomes, ion-interference therapy is often combined with other therapeutic methods. The combination of ion interference therapy induced by CaO2 nanoparticles modified with human serum albumin (HSA) and radiotherapy can induce radiosensitization for in situ treatment of oral cancer.23 However, externally applied energies such as radiation, infrared,24 and ultrasound25 used to increase the therapeutic effect of CaO2 are often not selective. In the calcium ion interference method, calcium ions in mitochondria may be naturally excreted through Ca2+ channels, and the concentration of calcium ions quickly returns to normal levels, which cannot affect calcium homeostasis. By utilizing the natural extract curcumin (CUR) to inhibit the increase in Ca efflux, a material could potentially exert sufficient therapeutic effects without the need for interfacial energy. The double-layer acid-responsive shell firmly locks in CaO2, allowing it to slowly release effective substances. A series of previous studies surface-modified CaO2 in order to reduce the side effects caused by intravenous administration of CaO2.26 While a double-lock should which more effectively protect CaO2 and deliver it to the tumor site to reduce dose and healthy tissue toxicity, there is still a need to explore the risks posed by two combined therapeutic modalities and the therapeutic effects on other tumor cells.
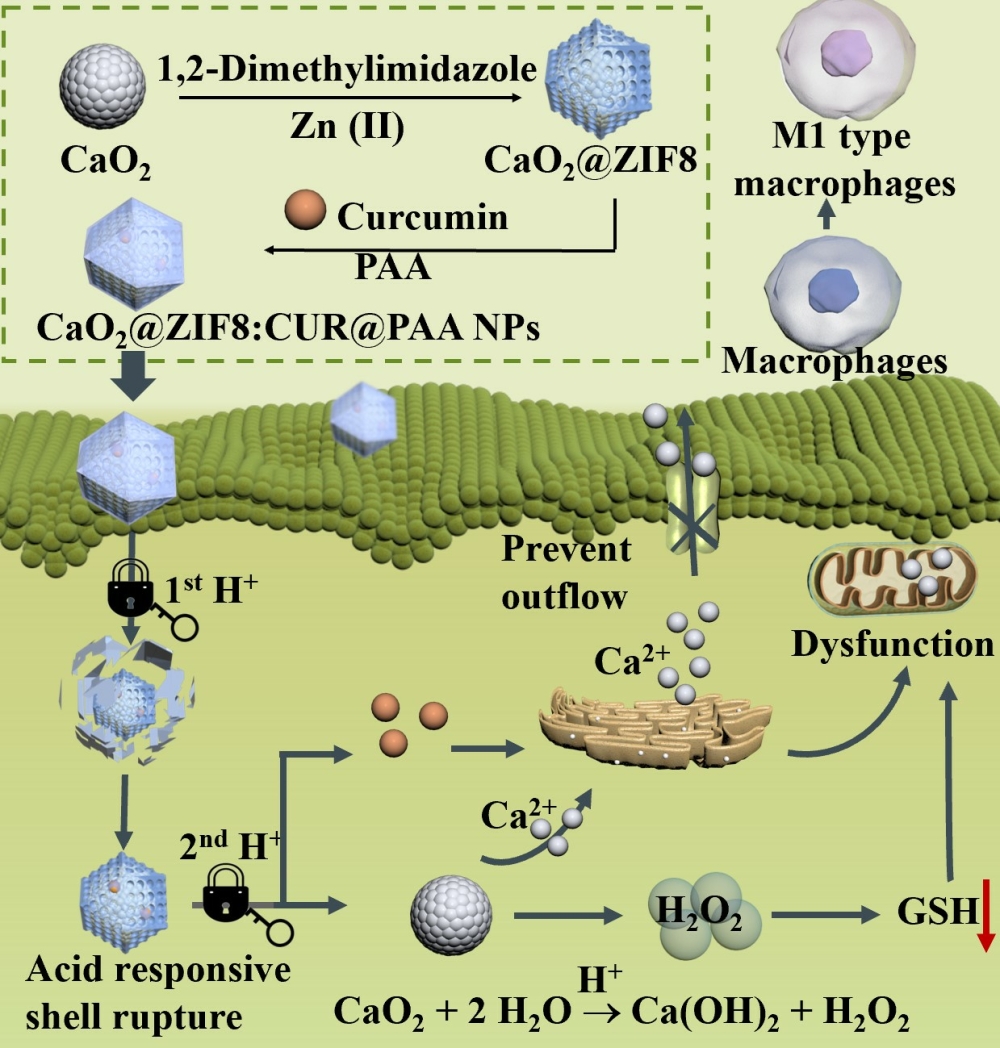
We sought in this work to exploit those dual processes, designing a system that can trigger initial intracellular calcium elevation and subsequent H2O2 production. CaO2 nanoparticles were first prepared, and embedded into the acid responsive protective shell Zeolitic Imidazolate Framework-8 (ZIF8, the first lock). The drug curcumin (CUR, reported to have anti-cancer properties) was loaded into the pores of ZIF8, and finally a second protective shell polyacrylic acid layer (PAA), the second lock) deposited on the surface to yield CaO2@ZIF8:CUR@PAA nanoparticles (NPs). This is shown in Scheme 1, the pH in intracellular controls two protective layers, eg PAA and ZIF8, which are opened like two locks by a key. The simultaneous release of CUR can further promote the release of Ca2+ from the endoplasmic reticulum to the cytoplasm, inhibit the outflow of Ca2+ from the cell, set off a calcium storm, cause cancer cell apoptosis, and activate anti-tumor immunity by promoting the polarization of macrophages to the M1 phenotype. In summary, this study established a new model of acid responsive dual unlocking enhanced ion interference and oxidative damage combined to enhance immunogenic cell death (ICD) was developed, which will provide new inspiration for tumor immunotherapy.
 |
Scheme 1 The experimental design for the CaO2@ZIF8:CUR@PAA NPs and the mechanism behind their ability to destroy tumor cells. |
Experimental
Materials
CUR (98%) and PAA (MW 2000) were bought from Aladdin Biochemical Technology Co., Ltd. Zn(NO3)2·6H2O (99%) and concentrated ammonia were provided by Shanghai Titan Co., Ltd. Polyethylene glycol 200 (98%), 2-methylimidazole (97%), 3.3′,5,5′ - tetramethylbenzidine (TMB, 99%), Ti(SO4)2 and methanol were purchased from China National Pharmaceutical Group Chemical Reagent Co., Ltd. Dimethyl sulfoxide (DMSO) and glutaraldehyde (25%) were provided by Aladdin Biochemical Technology Co., Ltd. Indocyanine green (75%) was provided by Beijing Innochem Science & Technology Co., Ltd. Phosphate-buffered saline (PBS) and 2′,7′-Dichlorodihydrofluorescein diacetate (DCFH-DA) were provided from Biosharp Co., Ltd. Dulbecco’s Modified Eagle Medium (DMEM) and Minimum Essential Medium (MEM) culture were purchased from Wuhan Servicebio Technology Co., Ltd. Calcein acetoxymethyl ester/propidium iodide (Calcein-AM/PI) reagent kit, 3-(4,5-dimethylthiazole-2)-2,5-diphenyltetrazolium bromide (MTT), and 4′,6-diamino-2-phenylindole (DAPI) were sourced from Jiangsu Kaiji Biotechnology Co., Ltd. Rhod-2-AM calcium ion fluorescence probe was provided by Shanghai Baishun Biotechnology Co., Ltd. Mito-Tracker Red CMXRos was purchased from Beijing Solarbio Science & Technology Co., Ltd. Interleukin-6 (IL-6) and tumor necrosis factor-alpha (TNF-α) ELISA kits were sourced from Jiangsu Meibiao Biotechnology Co., Ltd. Catalase (CAT), reduced glutathione (GSH) and dialysis tubing (MWCO = 7000 Da, 1 kDa) was purchased from Shanghai Yuanye Bio-Technology Co., Ltd. Alanine aminotransferase (AST), glutamic transaminase (ALT), creatinine (CRE), urea nitrogen (BUN) test kits were purchased from Nanjing Jiancheng Biological Engineering Research Institute. 143B cells and HUVEC cells were purchased from iCell Bioscience Inc (Shanghai). All water used was ultra- pure and obtained from a Milli-Q Plus 185 water purification system.
Analytical Equipment
Transmission electron microscope (TEM) images were recorded on a JEM-2100 instrument (JEOL Corporation). UV-vis spectra were obtained with the aid of a UV3600 spectrophotometer (Shimadzu Corporation) and particle size and zeta potential values on a Zetasizer Nano ZS90 instrument (Malvern Instruments). The elemental composition and chemical valence state of the material are determined by X-ray photoelectron spectroscopy (XPS, EscaLab 250Xi). A D/Max-2550 PC X-ray diffractometer (XRD, Rigaku) was employed to explore material composition, in addition to inductively coupled plasma - optical emission spectroscopy (ICP-OES) measurements undertaken using an Agilent Technologies 5100 instrument. Intracellular fluorescence was observed on confocal laser scanning microscope (CLSM, LSM700, Zeiss). Inverted fluorescence microscopy was performed on a DM IL LED type microscope (Leica), flow cytometry on a FACS Canto II instrument (BD), and a BioTek Synergy LX (Agilent Technologies) plate reader was employed for plate-based assays.
Material Synthesis
Preparation of CaO2 NPs
CaO2 was prepared following a literature method27 as follows: aqueous ammonia (15 mL, 1 mol/L) and polyethylene glycol 200 (120 mL) solutions were added sequentially to 30 mL of a 0.1 g/mL aqueous CaCl2 solution. Under stirring, 30% hydrogen peroxide solution (w/v, 15 mL) was added dropwise and the resultant mixture stirred at room temperature for 2 h. Sodium hydroxide solution (0.1 M) was added until the pH of the solution reached 11.5. The precipitate comprised CaO2 NPs and was separated by centrifugation (10,000 r/min, 5 min) before being washed three times with sodium hydroxide (25 mL, 0.1 M) and twice with distilled water, until the pH of the filtrate reached 8.4. The samples were dried under vacuum at 80°C for 2 h.
Preparation of CaO2@ZIF8 NPs
Reference to previous literature wrapping ZIF8 enclosure.28 Under ultrasound (SCQ-5201C1 bath, Shanghai Shengyan Ultrasonic Instrument Co., Ltd), 80 mg of CaO2 NPs were dispersed in 20 mL of methanol, and 1.32 g of 2-methylimidazole was added. 0.6 g of Zn(NO3)2·6H2O was separately dissolved in 20 mL of methanol. The zinc nitrate solution was rapidly poured into the 2-methylimidazole/CaO2 solution with constant stirring at 300 rpm for 10 min. The precipitate was separated by centrifugation (6000 rpm, 6 min) at 25°C for 24 h and washed three times with excess methanol. The precipitated product was dried under vacuum at 50°C for 4 h to obtain CaO2@ZIF8 NPs.
Preparation of CaO2@ZIF8:CUR@PAA NPs
100 mg of CaO2@ZIF8 NPs was dispersed in 10 mL of methanol, and 7.5 mL of CUR solution (2 mg/mL in methanol) was added. After stirring at room temperature for 24 h, the sample was centrifuged at 5000 rpm and washed several times with 10 mL of methanol to completely remove any free CUR. The sample was then freeze-dried (FD-1D-50 instrument, Beijing Boyekang Experimental Instrument Co., Ltd) to obtain CaO2@ZIF8:CUR NPs. The supernatants were collected and used to determine the drug loading.
100 mg of CaO2@ZIF8:CUR NPs was dispersed in 10 mL of ultrapure water under rapid stirring. 1 mL of 10 mg/mL aqueous PAA solution was added dropwise and the mixture stirred at room temperature for 10 h. The resultant CaO2@ZIF8:CUR@PAA NPs were separated from the solution by centrifugation and washed several times in methanol to remove any residual PAA.
100 mg of CaO2@ZIF8 NPs was dispersed in 10 mL of methanol, 1 mL of 10 mg/mL aqueous polyacrylic acid (PAA) solution was added dropwise and the mixture stirred at room temperature for 10 h. The resultant CaO2@ZIF8@PAA NPs were separated from the solution by centrifugation and washed several times in methanol to remove any residual PAA.
Functional Performance
Release of Active Substances From CaO2@ZIF8:CUR@PAA
Drug Loading
The calcium content in CaO2@ZIF8:CUR@PAA was determined using ICP-OES. For this, 1.5 mg CaO2@ZIF8:CUR@PAA NPs were dissolved in 20 μL aqua regia, and the volume then made up to 10 mL with ultrapure water. This solution was then subject to ICP-OES analysis.
For CUR content determination, CUR solutions with concentrations of 10, 8, 6, 4 and 2 μg/mL were prepared in methanol, and used to construct a calibration curve based on absorbance at 425 nm. This was then used to determine the concentration of CUR in the supernatant after drug loading. The drug loading (LC) and encapsulation efficiency (EE) of the materials were calculated according to the following equations:


Where m0 is the input mass of CUR, m1 is the mass of CUR in the supernatant, and m is the mass of CaO2@ZIF8:CUR@PAA.
Stability
CaO2@ZIF8:CUR NPs were dispersed in MEM, MEM medium containing 10% (v/v%) fetal bovine serum (FBS), and PBS at a concentration of 0.5 mg/mL, and their hydrodynamic dimensions were determined by dynamic light scattering at 0, 4, 6, 12 and 24 h after dispersion.
Ca2+ Release
CaO2@ZIF8:CUR NPs or CaO2@ZIF8:CUR@PAA NPs were charged into a PBS buffer (pH 5.0, 6.8, 7.4) at a concentration of 1 mg/mL. 1 mL of each suspension was loaded into a dialysis bag (MWCO = 7000 Da), and the bag then immersed in a centrifuge tube filled with 30 mL of PBS (at the same pH as the NP suspension: 5.0, 6.8, or 7.4). The solutions were placed in a shaker at 37°C and shaken at 100 rpm. 10 mL samples were removed at multiple time points, and replaced with 10 mL of fresh PBS buffer. Ca concentration was quantified by ICP-OES. The experiment was repeated three times.
CUR Drug Release
5 mg of CaO2@ZIF8:CUR@PAA or and CaO2@ZIF8:CUR NPs were dispersed in 5 mL of PBS buffer at different pH (5.0, 6.8, 7.4), sealed in dialysis bags (MWCO = 7000 Da), and then the bags were immersed in 20 mL of PBS buffer at the same pH value (5.0, 6.8, or 7.4). The bags were placed in a shaker at 37°C and shaken at 100 rpm. 1 mL of the solution was removed at periodic intervals and replenished with 1 mL of the corresponding PBS buffer. The OD value of solution was measured on a UV-vis spectrophotometer at 425 nm, and the amount of CUR released at different time points calculated based on a predetermined calibration curve. Each set of experiments was repeated three times.
Release of H2O2 and Depletion With Reduced GSH
1 mL of disodium citrate-hydrogen phosphate at pH 5.0 contained 0.1 M Ti(SO4)2, 0.1 mg/mL of material (CaO2, CaO2@ZIF8, CaO2@ZIF8@PAA). Control group does not contain material. After 3 h of reaction at room temperature, the supernatant was taken to record the changes in UV-Vis absorption spectra.
1 mL of disodium citrate-phosphate at different pH (5.0, 6.8, 7.4) contained 0.1 M of Ti(SO4)2 at different concentrations of CaO2@ZIF8@PAA (0.03125, 0.0625, 0.125, 0.25, 0.5 mg/mL). After 3 h of reaction at room temperature, the supernatant was taken to record the changes in UV-Vis absorption spectra.
To determine the ability of CaO2@ZIF8@PAA to release H2O2, TMB colorimetric method was used for observation. In short, 1 mL of citric acid - disodium hydrogen phosphate (pH = 5.0) contains 0.05 mg/mL CAT and 0.25 mg/mL CaO2@ZIF8@PAA at different times (0, 1, 2, 3, 6, and 12 h). The UV visible absorption spectra of TMB at 350–800 nm were recorded at different times. 1 mL of citric acid - disodium hydrogen phosphate (pH = 5.0) containing different concentrations CaO2@ZIF8@PAA (0, 0.25, 0.50, 1.00, 1.50 mg/mL), 0.05 mg/mL CAT, 2 mm TMB, and the UV visible absorption spectrum changes of TMB at 350–800 nm were recorded at 3 hours.
1 mL of citric acid - disodium hydrogen phosphate at pH 5.0 contained 0.8 mg/mL of GSH, different concentrations of CaO2@ZIF8@PAA (0.5, 0.25, 0.125, 0.0625, 0.03125, 0 mg/mL). After 3 h of reaction at room temperature, 200 µL of 4 mg/mL DTNB solution was added for 10 min, and the changes of UV-Vis absorption spectra were recorded.
In vitro Experiments
Cellular Uptake
The uptake of CaO2@ZIF8:CUR@PAA NPs by 143B cells was examined by CLSM. 143B cells were inoculated in 35 mm glass-bottom dishes containing 2 mL of complete MEM medium (containing 10% v/v FBS and 1% v/v 100× penicillin-streptomycin solution). The density of cells in each dish was 1 × 10⁵ cells/mL. The culture dishes were placed in an incubator (37°C, 5% CO2). After 24 h, the medium was removed and the cells washed three times with PBS (pH 7.4, 1 mL). Subsequently, 2 mL of MEM complete culture medium containing the test materials was added as follows (all test CUR concentrations were 3.2 µg/mL): (1) control group (complete media, no CUR); (2) CUR; (3) CaO2@ZIF8:CUR@PAA. The cells were then incubated for another 8 h. After this, the media was aspirated with a pipette and the cells were washed with PBS. Subsequently, 500 µL of 2.5% v/v glutaraldehyde aqueous solution was added and the cells fixed for 10 min. Cell nuclei were stained with DAPI (50 µg/mL, 1 mL) for 3 min, and the dye was gently washed away before CLSM observation. A second set of experiments was performed under identical conditions but with a 24 h incubation period.
In vitro Cytotoxicity and Cell Cycle Analysis
The cytotoxicity of CaO2@ZIF8:CUR@PAA NPs to tumor cells and their compatibility with healthy cells were measured using the MTT assay. 143B cells or HUVEC cells were cultured on 96 well plates at a density of 104 cells per well. 143B cells and HUVEC cells were cultured in 100 μL MEM complete medium and complete DMEM medium (containing 10% FBS and 1% 100× penicillin-streptomycin solution, v/v%) respectively at 37°C and 5% CO2 for 24 hours. The media was removed and, after washing with PBS three times, 100 µL of solutions/suspensions of the test samples were added to each well. For HUVEC cells, two different treatments were explored: (a) control (media only); (b) CaO2@ZIF8 @PAA NPs. For 143B cells, six different treatments were explored: (a) control (media only); (b) free CUR; (c) CaO2; (d) CaO2@ZIF8; (e) CaO2@ZIF8:CUR; (f) CaO2@ZIF8:CUR@PAA NPs. After continuing the culture for 24 hours, the culture medium was discarded and the cells washed with PBS three times. MTT assays were performed as per the manufacturer instructions, and the optical density (OD) read at 450 nm. Each group of samples was performed with four different concentrations. Five independent experiments were performed with four replicate wells per plate. The cell survival rate is calculated using Equation (3).

Test OD represents the OD value of the incubated drug wells; control OD represents the OD value of the control group; blank OD represents the OD value of the well without added drugs and cells.
Cytotoxicity was also studied using the Calcein-AM/PI double staining method. 143B cells (1 × 10⁵ /mL, 1 mL per well) were loaded into the wells of a 6-well plate), incubated for 24 hours, and then the media aspirated. The cells were washed with PBS three times, and then treated with 2 mL of complete MEM containing (a) control (media only); (b) free CUR; (c) CaO2; (d) CaO2@ZIF8; (e) CaO2@ZIF8:CUR; (f) CaO2@ZIF8:CUR@PAA NPs. After incubation for 24 hours (37°C and 5% CO2), the media was aspirated and the cells washed with PBS three times, before adding 500 µL of Calcein-AM (2 μmol/L) and PI (8 μmol/L) solutions. After 30 minutes of staining, the cells were washed with PBS three times, and images were collected using an inverted fluorescence microscope.
Annexin V-EGFP/PI staining was used to detect the apoptosis rate by flow cytometry. 143B cells (1 × 10⁵ cells/mL, 2 mL per well) were loaded into a 6-well plate, incubated for 24 hours, and then the media removed and the cells washed with PBS as above. The cells were then incubated with the same test formulations as above for 12 hours. PBS was used to wash the cells three times, and then trypsin added before the cells were collected by centrifugation (1000 rpm, 3 min). The supernatant was discarded, and this PBS washing process repeated twice more. The cells were then suspended in a 500 µL of binding buffer, before adding 5 µL of Annexin V-EGFP and add 5 µL of PI solution. The plate was incubated at room temperature for 10 min, protected from light. Flow cytometry was then performed on a FACS Canto II instrument (BD) within 1 hour. Each experiment was repeated three times using three 6-well plates. The ratio of the number of Annexin V-EGFP positive cells and the number of PI positive cells to the total number of cells was used as the apoptosis rate.
To analyze the cell cycle using flow cytometry, 143B cells were loaded in a 6-well plate (105 cells/mL, in 1 mL complete MEM), cultured in an incubator for 24 hours, and washed 3 times with PBS. Next, 2 mL of complete MEM containing (a) control (media only) or (b) CaO2@ZIF8:CUR@PAA NPs (final concentration of 6.06 μg/mL) was added and the cells then incubated for a further 24 h. Following the manufacturer’s instructions, cells were processed and tested using a cell cycle and apoptosis detection kit. Specifically, the cells were digested, collected, and washed with PBS. After centrifugation, the supernatant was removed, and 0.5 mL of staining buffer (containing 25 μL PI, 10 μL RNase A) was added to each tube of cells. The tubes were incubated in the dark for 30 minutes and then analyzed by flow cytometry.
Intracellular Ca2+ Accumulation
The accumulation of Ca2+ in the mitochondria of 143B cells was measured using the fluorescent marker Rhod-2 AM. 143B cells (1×10⁵/mL, 2 mL) were charged into a 35 mm glass dish, and incubated at 37°C, 5% CO2 for 24 hours. The culture medium was removed and the cells rinsed three times with PBS (pH 7.4, 1 mL). Subsequently, 2 mL of complete MEM containing the test formulation was added (with the CUR concentration maintained at 3.2 µg/mL). Experiments were performed with (a) control (media only); (b) CaO2@ZIF8 NPs; (c) CaO2@ZIF8:CUR NPs; (d) CaO2@ZIF8:CUR@PAA NPs. After incubating for another 4 hours under the same culture conditions, the media was aspirated, the cells rinsed three times with PBS, and then 500 µL of 2.5% v/v aqueous glutaraldehyde solution added to each culture dish. After 10 minutes, 500 µL of Rhod-2 AM staining solution was also added to each dish. After 15 min of staining in the dark at 37°C, the staining solution was removed and the cells washed three times with PBS. After aspirating the final PBS was, the cells were imaged using CLSM.
Intracellular H2O2 Detection
2 × 10⁵ 143B cells (2 mL in complete MEM) were loaded into the wells of a 6-well plate, cultured for 24 hours. After discarding the old culture medium, the cells were then incubated with the test formulations: (a) Control; (b) CaO2; (c) CaO2@ZIF8@PAA; (d) CaO2@ZIF8:CUR@PAA [Ca]=0.08 μg/mL; (e) CaO2@ZIF8:CUR@PAA [Ca]=0.16 μg/mL). Incubation was performed (37°C, 5% CO2) for 24 hours, before being washed, labelled with DCFH-DA following the kit manufacturer instructions, and intracellular H2O2 detection performed using flow cytometry and inverted fluorescence microscopy.
Anti-Migration Effects
2 × 10⁵ 143B cells (1 mL) were loaded in the wells of a 24-well plate and incubated for 24 h. After removal of the media and PBS washing, the adherent cell layer was scratched with a pipette tip (200 μL). Subsequently, the cells were incubated with 20 μL complete MEM medium containing CaO2@ZIF8:CUR@PAA NPs (Ca concentration 2 μg/mL) for 24 or 48 h. Cell migration was observed by light microscopy. The cell mobility is defined as (initial scratch width – 48 h scratch width)/initial scratch width × 100%.
In vivo Experiments
Murine Tumor Model Establishment
All animal experiments were ethically reviewed and conducted according to the procedures authorized by the Animal Welfare and Ethics Committee of Yunnan University of Chinese Medicine (Approval no. SCXK-K2022-0004). Tumor models were established using BALB/c male mice (6–8 weeks old and weight 20–25 g), by injecting 100 μL of a 143B cell suspension (5 × 10⁶ cells) subcutaneously in the left axilla of the mice. The volume of the tumor was calculated according to the following formula:29

where a is the tumor length and b is the tumor width, in mm.
The calculation process of relative tumor volume is as follows:

V0 is the tumor volume measured during cage administration (ie day = 0), and Vt is the tumor volume at each measurement.
Live Imaging
To observe biodistribution in vivo, CaO2@ZIF8:CUR@PAA NPs were fluorescently labeled with ICG. To do this, 100 mg of CaO2@ZIF8 NPs were dispersed in 10 mL of methanol, to which 7.5 mL of CUR methanolic solution (2 mg/mL) and 6 mg of ICG were added. The product was placed in a dialysis bag (MWCO: 1 kDa) for 24 hours of dialysis, and then freeze-dried to obtain CaO2@ZIF8:CUR/ICG@PAA NPs. 50 mg of these NPs was then dispersed in 10 mL of ultrapure water under rapid stirring, 10 mL of 1 mg/mL aqueous PAA solution added dropwise, and the mixture stirred at room temperature for 10 h. CaO2@ZIF8:CUR/ICG@PAA NPs were separated from the solution by centrifugation and washed several times in methanol to remove residual PAA.
Twelve days after the injection of 143B cells, one mouse was injected through the tail vein with 100 μL of a 5 mg/mL CaO2@ZIF8:CUR/ICG@PAA in saline dispersion. At different time points (10 min, 2 h, 6 h, 48 h), imaging scans were performed using an IVIS Lumina LT imaging system (Caliper Life Sciences). The specific parameters were as follows: exposure time 60s, excitation wavelength 780 nm, and emission wavelength 845 nm. After determining the maximum intensity of fluorescence in the IVIS, the experiment was repeated with a second mouse. Here, the mouse was sacrificed 2 h after injection, and the key organs extracted for imaging under the IVIS.
Pharmacokinetics
The pharmacokinetic experiments were based on a previous experimental design.30 The in vivo pharmacokinetics were assessed by determining the Ca content in blood. Healthy mice (n = 3) were injected with 200 μL of CaO2@ZIF8:CUR@PAA (5 mg/kg) via the tail vein, and 20 μL of blood was withdrawn for acid digestion by aqua regia at pre-determined time points (0.5, 1, 2, 4, 8, 12, 16, 20 and 24 h), and the in vivo metabolism of the material was determined by measuring the concentration of Ca by ICP-OES.
In vivo Therapy
Twelve days after the 143B cell injection, the thirty male mice were randomly divided into six groups (five males in each group), and treated with (a) saline; (b) free CUR; (c) CaO2; (d) CaO2@ZIF8; (e) CaO2@ZIF8:CUR; (f) CaO2@ZIF8:CUR@PAA. All nanoparticle dispersions were prepared in physiological saline and administered via the tail vein every 48 h, at a concentration of 4.2 μg/mL Ca and 16.89 μg/mL CUR. Six treatments were performed, with body weight and tumor length and width measured immediately prior to administration. At the end of the experiment, blood was collected from the mice before they were sacrificed and tissues excised from the tumor and major organs. Before execution, blood was collected from the mice and the bleeding serum was separated for analysis of AST, ALT, CRE and BUN. To assess metastasis, lung tissues were harvested, photographed, and stained with hematoxylin and eosin (H&E) according to standard protocols. Tumor sections were stained with H&E and Ki67, calreticulin (CRT), and CD86. Other organs (heart, liver, spleen, kidney) were H&E stained. These stains were all performed according to the manufacturer protocols.
Tumor Cytokine Assay
Spleen samples were collected at the end of the treatment period and the amounts of TNF-α, IL-6 (M1 macrophage production) in the spleen were determined by ELISA kits (Invitrogen) according to the manufacturer’s protocol.
In vivo Drug Accumulation and Toxicity Studies
Elemental Ca content was determined using tumor tissue recovered at the end of the in vivo treatment period. A small piece of tumor tissue was cut and weighed, and digested in 200 μL of aqua regia. This was then diluted to 10 mL with ultrapure water. The Ca content was determined by ICP-OES.
Statistical Analysis
No fewer than three parallel experiments were conducted in each experiment, and the data are expressed as mean ± standard deviation. A two-tailed unpaired T test was used to determine the statistical significance between two groups. One-way ANOVA or two-way ANOVA analysis followed by the Tukey’s test was used to compare the differences between multiple groups. The SPSS software was used for statistical analysis. Significance was taken at p < 0.05. (N.S.: not significant, * p < 0.05, ** p < 0.01, *** p < 0.001).
Results and Discussion
Preparation and Characterization of CaO2@ZIF8:CUR@PAA
Calcium chloride reacts with H2O2 in ammonia solution to prepare spherical CaO2 NPs, which were further coated with porous ZIF8. After drug loading, the final formulation is obtained by wrapping with a pH sensitive PAA shell to give CaO2@ZIF8:CUR@PAA (Figure 1A). TEM images (Figure 1B) show that the average diameter of the CaO2 NPs is ~110 nm. Significant morphological changes could be seen after ZIF8 coating and drug loading. CaO2@ZIF8:CUR@PAA showed the typical dodecahedral structure of ZIF8, and the particle diameter increased to ~170 nm (Figure 1C). To further confirm the successful synthesis of CaO2@ZIF8:CUR@PAA NPs, XPS was performed, and the results are shown in Figure 1D. From the full width spectrum, characteristic peaks related to Zn 2p, Ca 2p, N1s, and C1s can be observed. Looking at the high resolution spectra (Figure 1E–G, Figure S1), peaks at 1045.3 and 1022.2 eV correspond to Zn2+ 2p1/2 and 2p3/2 respectively,31 while there are signals at 346.8 and 350.5 eV from Ca2+ 2p3/2 and 2p1/2.32 The C1s region of the spectrum shows two peaks from C–N (286.3 eV) and C–C bonds (285.1 eV).33,34 These bands are consistent with the deposition of the ZIF8 structure on the CaO2 core. XRD results further prove the successful synthesis of CaO2 and CaO2@ZIF8:CUR@PAA. The representative Bragg reflections of CaO2 arise at 2θ values of 30.25°, 35.53°, 39.56°, and 47.48° (Figure 1H).35 In the XRD data for CaO2@ZIF8:CUR@PAA NPs, there are distinct reflections of both ZIF8,36 (Figure 1H) and CaO2 (Figure S2).
 |
Figure 1 (A) Schematic diagram showing the preparation of CaO2@ZIF8:CUR@PAA NPs; TEM images of (B) the CaO2 NPs and (C) CaO2@ZIF8:CUR@PAA NPs; (D) XPS spectrum of CaO2@ZIF8:CUR@PAA NPs; XPS spectra showing the Zn 2p (E), Ca 2p (F) and N 1s (G) regions for CaO2@ZIF8:CUR@PAA NPs; (H) XRD patterns of CaO2 and CaO2@ZIF8:CUR@PAA NPs; (I) zeta potential values of CaO2, ZIF8, CaO2@ZIF8, CaO2@ZIF8:CUR, and CaO2@ZIF8:CUR@PAA NPs; (J) UV-Vis absorption spectra of CUR, CaO2@ZIF8, CaO2@ZIF8:CUR@PAA; The data are displayed as mean ± S.D., n=3. |
The hydrodynamic size and zeta potential were assessed using dynamic light scattering. The size gradually increases from 106 to 164 nm with the addition of coatings to the CaO2 core (Figure S3), and the zeta potential also changes. The initial negative potential of CaO2 (−3.6 ± 0.3 mV; Figure 1I) becomes positive (18.5 ± 0.4 mV) after adding ZIF8 (as would be expected given the strongly positive zeta potential of the latter), and this then becomes increasingly negative after the addition of CUR and PAA owing to the presence of acidic groups in these moieties. The final NPs have a zeta potential of −15.0 ± 0.3 mV. This confirms the successful coating of ZIF8 and PAA shells on the CaO2 surface.37
The UV visible absorption spectrum of CUR, CaO2@ZIF8, CaO2@ZIF8:CUR@PAA is shown in Figure 1J. CaO2@ZIF8:CUR@PAA shows a characteristic CUR absorption peak at λ=425 nm, which is not present with CaO2@ZIF8 itself, indicating that CUR was successfully loaded.
Properties of CaO2@ZIF8:CUR@PAA
Stability of CaO2@ZIF8:CUR@PAA
The stability of the CaO2@ZIF8:CUR@PAA NPs in suspension was examined under simulated physiological conditions. As shown in Figure S4, the average particle size lay in the range of 170–180 nm and remained almost constant during 24 h incubation in cell culture medium, PBS and media supplemented with FBS, demonstrating that there was little aggregation or dissociation.
Ca2+ Release and CUR Delivery
The content of Ca within CaO2@ZIF8:CUR@PAA NPs was determined by inductively coupled plasma-optical emission spectrometer (ICP-OES) to be 5.3 ± 0.3% w/w. ICP-OES assays were then used to monitor Ca2+ release in simulated physiological fluid (pH 7.4), and in the acidic tumor microenvironment (TME) (pH 6.8) and lysosomal environment (pH 5.0). The findings are depicted in Figure 2A. Ca2+ release from CaO2@ZIF8:CUR NPs was not significantly affected by pH, with around 90% release after ca. 60 h. The release profile of CaO2@ZIF8:CUR@PAA varied markedly with the pH of the release media, owing to the acidic nature of PAA. When the pH was 7.4, the PAA will be ionized and thus interacts strongly with ZIF8, effectively hindering the entry of water to the pores and ensuring the stability of CaO2. As the pH is reduced, the rate of release increases. This can be attributed to the increasing degree of protonation of the PAA, which reduces the attraction between the polymer molecules and the ZIF8 framework.38 This in turn opens the pore outlets, permitting water ingress into the pores and resulting in Ca2+ being dissolved into solution. Thus, the release rate of CaO2@ZIF8:CUR@PAA NPs after 30 h was much lower at pH 7.4 (40.0%) than that at pH 6.5 (54.1%, Figure 2A). When the pH was further reduced to 5.0, the CaO2@ZIF8:CUR@PAA NPs pores were almost fully open and thus release was greater still. Moreover, ZIF8 and CaO2 are more prone to decomposition in acidic environments. These data thus indicate that CaO2@ZIF8:CUR@PAA NPs could have the ability to prevent Ca release in healthy tissue and deliver CaO2 to acidic locales in tumor sites.
 |
Figure 2 (A) Ca2+release profiles in PBS at different pH values (n=3); (B) CUR release from CaO2@ZIF8:CUR and CaO2@ZIF8:CUR@PAA at different pH values (n=3); (C) After processing with different materials, the color of Ti(SO4)2 solution changes; Under the conditions of pH=5 (D), 6.8 (E), 7.4 (F), the color change of Ti(SO4)2 solution treated with different concentrations of CaO2@ZIF8@PAA; (G)UV-vis absorption spectra of TMB solution mixed with CaO2@ZIF8@PAA at different time; (H) UV-vis absorption spectra of TMB solution at different concentrations CaO2@ZIF8@PAA; (I) the color change of GSH solution treated with different concentrations of CaO2@ZIF8@PAA. |
The CUR loading was calculated as 21.1 ± 1.2% w/w and the encapsulation efficiency was 88.9±0.3%. CUR release from CaO2@ZIF8:CUR and CaO2@ZIF8:CUR@PAA NPs at different pHs is shown in Figure 2B. For the former, the cumulative release at pH 5.0, pH 6.8, and pH 7.4 after 90 h was 94.3%, 93.1%, and 90.6%, respectively. The release from CaO2@ZIF8:CUR@PAA was generally lower over the study period. After 90 h, the cumulative release of CUR was 86.2%, 62.3%, and 48.1% at pH 5.0, pH 6.8, and pH 7.4, respectively. Again, the system is seen to have pH-responsive release properties, which is promising for potential tumor-targeting applications.
Ca2+ and CUR could still be released faster from CaO2@ZIF8 wrapped around the monolayer acid-responsive shell ZIF8 in the acidic environment of pH = 5, which could release 60.22% and 52.22%, respectively, at 10 h. The release rates of Ca2+ and CUR were 29.94% and 38.94% at pH = 5 and 10 h after adding the second lock PAA, respectively (Figure 2A and B). This proves that the dual-lock nanocarriers have an acid unlocking mechanism inside the tumor, which can effectively allow CaO2 to decompose slowly and release Ca2+, and CUR facilitates their role in vivo.
Release of H2O2
In order to detect the H2O2 released by CaO2@ZIF8@PAA, two color development methods, Ti(SO4)2 and TMB, were used to demonstrate the release of H2O2 from CaO2@ZIF8@PAA. Ti4+ in Ti(SO4)2 can generate an orange complex with H2O2, which peaks between 340 and 410 nm. At the same concentration, CaO2 group has the deepest yellow color, followed by CaO2@ZIF8 group, CaO2@ZIF8@PAA group has the lightest color. And the UV absorption peaks of the three groups were also from high to low (Figure 2C). One possibility is that at the same mass concentration, the CaO2 content decreases after being wrapped in ZIF8 and PAA shells. Another possibility is that the protection of the shells at the same time reduced the rate of H2O2 releasing CaO2. The H2O2 produced by the degradation of CaO2 can form a yellow titanium peroxide complex with Ti(SO4)2. The titanium peroxide composite exhibits a peak at 340nm-400nm. Comparison of Figure 2D–F observed that the release of H2O2 was acid-dependent and concentration-dependent. Acid effectively triggered the decomposition of the two layers of protective locks, ZIF8 and PAA, and H+ reacted with CaO2 to form Ca2+ and H2O2.
3,3′, 5,5′- tetramethylbenzidine (TMB) is commonly used to indirect detect H2O2 generated by CaO2@ZIF8. In the acidic environment simulating tumors (pH = 5.0), CaO2@ZIF8 decomposition can slowly release ˙OH, which can turn TMB blue (Figure 2G). As the concentration of CaO2@ZIF8 increases, the blue color of the reaction solution becomes darker, indicating that more ˙OH is produced at the same time as the concentration of CaO2@ZIF8 increases (Figure 2H).
The depletion of reduced GSH by the CaO2@ZIF8@PAA material was also evaluated. DTNB monitored the unreacted GSH in the solution. As the concentration of CaO2@ZIF8@PAA increased, the yellow color of the reacting solution gradually faded, and the UV peaks at 400–450 nm gradually decreased (Figure 2I). This also indirectly proves that CaO2@ZIF8@PAA releases H2O2 and consumes the important reducing substance GSH in tumors.
In vitro Experiments
Cell Uptake
143B cells were used to study the uptake of the NPs by cancer cells (Figure 3A). CUR showed green fluorescence under excitation while the DAPI-stained nuclei give blue fluorescence. Increased uptake of both CUR and the CaO2@ZIF8:CUR@PAA NPs can be seen with time, as evidenced by the increased green fluorescence in the images. However, the NPs are clearly internalized more effectively than free CUR, with more intense CUR fluorescence visible.
 |
Figure 3 Results of in vitro experiments. (A) Confocal microscope images of 143B cells treated with free CUR and CaO2@ZIF8:CUR@PAA at different timepoints; relative cell viability of (B) HUVEC and (C) 143B cells after exposure to the formulations. The data are displayed as mean ± S.D., n=4., ***P < 0.001, **P < 0.01, NS.: not significant; (D) Fluorescence images of Calcein-AM/PI double stained 143B cells treated with different formulations (Scale bar: 500 μm); (E) Flow cytometry plots for Annexin V-EGFP/PI double stained 143B cells treated with different formulations. Quadrants: lower left (healthy cells), upper left (necrotic cells), lower right (early apoptosis), upper right (late apoptosis). The percentage of apoptotic cells is the sum of the percentages in the latter two quadrants. |
Cytotoxicity
The cytocompatibility of the material with healthy HUVEC cells was determined using the MTT method. As revealed in Figure 3B, the survival rate decreased with increasing CaO2@ZIF8@PAA has good (>80%) cytocompatibility. The cell survival rates obtained after treatment of 143B cells are shown in Figure 3C. The survival of cells in the CaO2@ZIF8, CaO2@ZIF8:CUR and CaO2@ZIF8:CUR@PAA groups was extremely significantly lower than that of the CUR and ZIF8 group at the highest concentration measured. These three groups had either ZIF8 or PAA shells to protect CaO2 from premature release. The CaO2@ZIF8:CUR@PAA treatment was the most prominent under the protection of the double shell, probably because the double acid-responsive shell protected both CaO2 and CUR, the two active substances, from premature release. Although ZIF8 can carry the drug, it is possible that CUR is still lost by leakage during the treatment process. This ultimately led to a higher survival rate of 143B cells in the CaO2@ZIF8:CUR group than in the CaO2@ZIF8:CUR@PAA group. The cell survival rate after treatment with CaO2@ZIF8:CUR@PAA gradually decreased with increasing NP concentration, and the viability was lower with the composite NPs than with free CUR and CaO2. This can likely be attributed to the synergistic effect provided by the combination of Ca2+ ion therapy and CUR chemotherapy.
Apoptosis and the Cell Cycle
After different treatments, 143B cell death was observed using Calcein-AM/PI double staining, and cell apoptosis was analyzed using flow cytometry and Annexin V-EGFP/PI dual staining (Figure 3D and E). In the former (Figure 3D), cells treated with CaO2@ZIF8:CUR@PAA showed the largest number of red-stained particles, indicating a greater extent of cell death. In the flow cytometry data (Figure 3E), the percentage of cell apoptosis is taken to be the sum of the percentages in the upper right (late apoptosis) and the lower right quadrant (early apoptosis). The apoptosis rate of cells given CaO2@ZIF8:CUR@PAA NPs (56.7%) was much higher than that of the control (5.65%) and when cells were given other treatments: CUR (35.9%), CaO2 (28.1%), CaO2@ZIF8 (28.4%) and CaO2@ZIF8:CUR (40%). These findings are all consistent with the MTT results described above.
In order to elucidate the underlying therapeutic mechanism of CaO2@ZIF8:CUR@PAA NPs in vitro anti-cancer, we next analyzed the effect of CaO2@ZIF8:CUR@PAA NPs on the 143B cell cycle using flow cytometry. CUR is known to block the S-phase.39 The proportion of G1 phase cells decreased from 48.7% to 18.0% after treatment with the NPs, while the proportion of S phase cells increased from 22.2% to 53.2% (Figure S5A and B). In short, CaO2@ZIF8:CUR@PAA NPs can induce cell S cycle arrest. S phase cell cycle arrest weakens its proliferation ability and can inhibit tumor cell growth.40
Cellular H2O2 Content, Ca2+ Content and Membrane Potential
Intracellular H2O2 production by 143B cells was investigated using the dye DCFH-DA (Figure 4A and Figure S6). CaO2 increases H2O2 production by almost 2-fold, but is readily decomposed in water and thus some of the active species is likely lost before entering the cell. CaO2@ZIF8:CUR@PAA in contrast enters with the reactive CaO2 moiety protected by the ZIF8 and PAA coating, and thus results in greater generation of H2O2 (Figure 4A and Figure S6). Intracellular DCFH-DA fluorescence signaling was significantly higher in the CaO2@ZIF8:CUR@PAA and CaO2@ZIF8:CUR@PAA groups than in the CaO2 group. The presence of CUR in the material led to a further increase in H2O2 production.41 This is thought to be related to CUR causing an increase in intracellular H2O2 production via a loss of mitochondrial membrane potential.42 This observation is found to be concentration dependent, with a greater concentration of CaO2@ZIF8:CUR@PAA material producing more H2O2.
 |
Figure 4 (A) Flow cytometry plots showing H2O2 production of 143B cells treated with different materials; (B)Accumulation of Ca2+ in 143B cells. Scale bar in microscope images is 20 μm. (C) Mitochondrial membrane potential of 143B cells treated with different formulations (scale bar: 500 μm). |
The free Ca2+ concentration in 143B cells was examined with the fluorescent probe Rhod-2 AM. The results are shown in Figure 4B. The red fluorescence intensity representing Ca2+ was weakest with the PBS control, and increases sequentially following exposure to CaO2@ZIF8 and CaO2@ZIF8:CUR@PAA NPs. This may allow the NPs to exert a “calcium nanobomb” effect. This can cause mitochondrial dysfunction and decrease mitochondrial membrane potential, thus indirectly leading to apoptosis.
In order to reveal the relationship between intracellular calcium content and mitochondrial damage, Mito-Tracker Red CMXRos was used to detect the changes in mitochondrial membrane potential in 143B cells. The results are shown in Figure 4C. The red fluorescence signals after all treatments are reduced compared to the untreated cells control. Compared with the control, the red color of cells treated with CUR was slightly weakened, which proves that CUR can indeed cause mitochondrial damage and reduce membrane potential, conducive to the accumulation of H2O2 in cells. CaO2@ZIF8:CUR@PAA NPs led to the weakest red fluorescent signal, indicating that cells exposed to these NPs had the lowest mitochondrial membrane potential and the highest degree of mitochondrial damage. This is thought to be because the CaO2@ZIF8:CUR@PAA NPs can enter tumor cells, where they are disassembled and Ca2+ and CUR released, leading to mitochondrial dysfunction and cell apoptosis. The effects here are more notable than with CaO2@ZIF8:CUR, because the PAA coating helps to prevent the release of CUR or Ca2+ into the culture medium, which is expected to occur to an appreciable extent with the uncoated analogue.
Cell Migration
Emerging evidence suggests that mitochondria play a crucial role in tumor metastasis.43 They can provide energy for the detachment of cells from the primary tumor to the circulation, and are involved in multiple metastasis-related pathways. Recent studies have reported that extensive ROS production can inhibit tumor metastasis. We thus explored the effect of the NPs in a scratch model (Figure 5A and Figure S7). With a PBS treatment, there is notable cell migration across the scratch over 48 h. This is much less marked with the CaO2@ZIF8:CUR@PAA NPs. The NPs inhibited 143B cell lateral migration by about 33.6%, and the lateral migration rate of CaO2@ZIF8:CUR@PAA NPs group was inhibited by 23.2% compared to the control group. It thus appears that damage to the mitochondria caused by H2O2 production and Ca2+ accumulation greatly inhibits 143B cell invasion and migration.
 |
Figure 5 (A) Results of a scratch test to investigate the effect of the NPs on the lateral migration of 143B cells. The data are displayed as mean ± S.D., n=3. (B) Fluorescence images at different time points after tail vein injection of CaO2@ZIF8:CUR/ICG@PAA into a single mouse. (C) Ex vivo fluorescence imaging images of the main organs and tumors 2 h after injection. |
In vivo Experiments
The pharmacokinetics of CaO2@ZIF8:CUR@PAA was investigated, and the concentration of elemental Ca in the blood was determined at different time intervals. The drug-time profile of CaO2@ZIF8:CUR@PAA followed the classical two-compartmental model (Figure S8), along with a circulating distribution half-life of 7.76 ± 0.62 h and an elimination half-life of 39.52 ± 10.29 h. The results showed that CaO2@ZIF8:CUR@PAA could circulate in the blood, which facilitated its accumulation at the tumor site. Before evaluating the therapeutic effect in animals, the retention of CaO2@ZIF8:CUR/ICG@PAA NPs in tumors was first evaluated through in vivo fluorescence imaging. As shown in Figure 5B, two hours after intravenous injection of CaO2@ZIF8:CUR/ICG@PAA NPs, the appearance of ICG fluorescence indicates that CaO2@ZIF8:CUR/ICG@PAA NPs can be trafficked to and retained at the tumor site. Fluorescence in the abdominal skin area after 2 h and 6 h of injection may be due to the fluorescent signal in the viscera where the material accumulates with blood circulation. Figure 5C depicts ex vivo imaging of the main organs and tumors of mice 2 h after injection into the tail vein. The fluorescence signal intensity of the tumor is much higher than that of other organs, followed by the liver. The above results prove that the NPs can enter tumors with some degree of selectivity. The fluorescence signal of nanoparticles is most clearly present in the liver and kidneys, and we speculate that nanoparticles are mainly metabolized by these two organs.44,45 After 48 hours, the mice showed no fluorescence signal, possibly due to the CaO2@ZIF8:CUR/ICG@PAA NPs having been metabolized and cleared.46 In the tumor, the material accumulates largely via the EPR effect. This avoids off-target toxicity caused by the use of high-dose agents47 and premature release of CUR.48 Moreover, due to the involvement of both the kidneys and liver in the metabolism of the nanoparticle, it has been completely metabolized within 48 hours, reducing toxicity to other tissues.49 The material is hence potentially suitable for in vivo tumor treatment.50
Evaluation of in vivo Antitumor Effect
Unilateral tumors were allowed to grow for 12 days, after which the mice were given different treatments by tail vein injection every two days (Figure 6A). Tumor volume and mouse body weight were closely monitored during the 12-day treatment period. There was no significant change in body weight in any group of mice, indicating minimal off-target side effects (Figure 6B). Tumor volumes in the CaO2 and CaO2@ZIF8 groups increased in parallel with those in the saline group over two weeks, albeit to a lesser extent, showing only slight tumor suppression activity (Figure 6C). This is because the ZIF8 shell protected CaO2 from premature hydrolysis to release Ca and ROS to the tumor site causing mitochondrial damage to the tumor cells. Therefore, the tumor was slightly reduced after treatment compared to the CaO2 group. Overall, CaO2 and CaO2@ZIF8@PAA are not effective in inhibiting tumor growth. In contrast, treatment with CaO2@ZIF8:CUR and CaO2@ZIF8:CUR@PAA resulted in significant tumor suppression, with the final relative tumor volume (day 12) changing to a mean of 1.26 and 0.79 times the original values respectively. The tumor weight also showed a similar trend, with CaO2@ZIF8:CUR and CaO2@ZIF8:CUR@PAA groups showing significantly lower tumor weight after treatment compared to the saline group (Figure 6D). After CaO2@ZIF8 was combined with the drug CUR, it has a significant anti-tumor therapeutic effect. This indicates that CUR can play a role in the effective accumulation of Ca2+ (Ca storm) in the tumor. CaO2@ZIF8:CUR@PAA has the most significant therapeutic effect with an average tumor weight of 0.082 g. It is clear that under the double-layer protective shell, the nanomaterials exert the combined therapeutic advantages of Ca storm/oxidative damage. Figure 6E records the tumor growth curves of each treatment group of mice, which also demonstrates the synergistic anti-tumor effect of CaO2 and drug CUR packaged in a double-layer shell.
 |
Figure 6 CaO2@ZIF8:CUR@PAA mediates tumor inhibition in vivo. Schematic diagram of the treatment plan (n=6) (A); time dependent changes in mouse body weight (B) and in solid tumor volume (C) during 12 days of treatment; Tumor weight (D) and growth curve (E) of mice treated with different materials; H&E, Ki67, CD86, and CRT staining on tumor tissues from selected treatment groups (F). ((a) control (saline); (b) free CUR; (c) CaO2; (d) CaO2@ZIF8; (e) CaO2@ZIF8:CUR; (f) CaO2@ZIF8:CUR@PAA). The data are displayed as mean ± S.D., n=5., NS: not significant, *P<0.05, **P<0.01, and ***P<0.001. |
Tumor sections were stained with hematoxylin and eosin (H&E), Ki67, CRT, and CD86 (Figure 6F; Figure S9–S11). In the H&E staining of the saline group, a blue purple color representing the nucleus is abundant and densely arranged, and there is no obvious necrosis. In the CaO2@ZIF8:CUR@PAA group, there is much reduced intensity of purple color, indicating that the structure of the tumor tissue is disrupted by H2O2 induced mitochondrial damage and Ca storms. The H&E results showed that the necrotic area was higher in all treatment groups than in the saline control group, and the most severe cell damage was observed in the CaO2@ZIF8:CUR@PAA treatment group (Figure 6F, Figure S9). According to the Ki67 staining results (Figure 6F, Figure S9), the saline sham treatment group had the fastest tumor cell proliferation, as evidenced by the greatest number of red-stained cells. This is followed by the CUR, CaO2, and CaO2@ZIF8 groups. CaO2@ZIF8:CUR@PAA led to the slowest tumor proliferation and the most necrotic areas.
The ROS (H2O2) generated by the NPs and the triggering of mitochondrial dysfunction can lead to ICD.51 After triggering ICD, damage related patterns (DAMPs, including CRT, HMGB1, ATP) and pro-inflammatory factors IL-6 are released. CRT is representative of damage-related patterns, and thus we applied staining to visualize this. The CaO2@ZIF8:CUR@PAA group also showed notable upregulation of CRT due to ICD induction (Figure 6F; Figure S10). The expression of CRT in the CaO2 and CaO2@ZIF8 groups is weak, possibly due to the lack of the PAA shell to protect the CaO2 core. Without this protection the CaO2 is prone to react with water, losing the ability to produce H2O2 inside tumor cells, and thus being unable to activate ICD. The expression of CRT in the CUR and CaO2@ZIF8:CUR groups was notably stronger than that in the saline group, because curcumin itself can induce ICD. In addition, the most extensive recruitment of CD86+ M1 macrophages (denoted by red-stained cells) was observed in this group,52,53 indicating the strongest anti-tumor immune response (red-stained cells; Figure 6F and Figure S11). Activated macrophages can generate immune responses and pro-inflammatory cytokines such as TNF-α and IL-6.54 Quantification of these pro-inflammatory factors in the spleen indicate that CaO2@ZIF8:CUR@PAA treatment results in significantly elevated IL-6 and TNF-α in compared to the saline group (Figure 7A and B). From the lower concentrations of IL-6 and TNF-α in the spleen of the CUR group compared to the Saline group, it can be seen that CUR slightly reduces IL-6 and TNF-α, but there was no significant difference. There was no significant difference in the content of these two immune factors in the spleen between the CaO2 group without shell protection and the Saline group. The presence of CUR and CaO2 alone makes it difficult to activate immunity. Due to the coexistence of CUR and CaO2 in the CaO2@ZIF8:CUR group, the concentrations of IL-6 and TNF-α in the spleen of the CaO2@ZIF8:CUR group were significantly higher than those in the saline group. In CaO2@ZIF8:CUR@PAA group, due to strong ROS release and Ca accumulation, macrophages may still produce pro-inflammatory polarization (M1-like phenotype). Looking at the lung tissue excised after sacrifice, the saline group had a large white area in the lungs (Red circle), which was caused by tumor metastasis. H&E - stained lung sections showed a blue-purple tumor tissue after saline treatment. Both digital images and H&E staining revealed a reduction in the presence of metastatic tumors in the lung after treatment with CaO2@ZIF8:CUR@PAA (cf. PBS) (Figure 7C and Figure S12).
 |
Figure 7 Quantification of TNF-α (A) and IL-6 (B) in the CaO2@ZIF8:CUR@PAA group relative to the Saline group in the spleen as detected by ELISA; The data are displayed as mean ± S.D., n=3., NS: not significant, ***P < 0.001, **P < 0.01, *P < 0.05 (C) Images and H&E staining of lung tissue after the treatment period; (D) Blood biochemistry indicators of mice on the 14th day after of different treatment (n=3). The data are displayed as mean ± S.D., n=3 (N.S.: not significant); (E) Histopathologic examination of organ sections (heart, liver, spleen and kidney) from BALB/c mice after different treatments (scale bar = 200 μm); (F) the distribution of Ca in the tumor, heart, liver, spleen, lungs, and kidneys after intravenous injection ((a) control (saline); (b) free CUR; (c) CaO2; (d) CaO2@ZIF8; (e) CaO2@ZIF8:CUR; (f) CaO2@ZIF8:CUR@PAA). |
In vivo Accumulation and Toxicity
Key blood components were analyzed using biochemical and hematological tests on fresh blood collected from treated mice. Compared with the mice treated with Saline, the hematological or biochemical parameters listed in the mice treated with CaO2@ZIF8:CUR@PAA did not show difference in AST, ALT and CRE, BUN, indicating that the material does not adversely affect liver or kidney function (Figure 7D). Figure 7E and Figure S13 depict H&E staining of the major organs after treatment. No obvious inflammation, injury, or necrosis was observed in the heart, liver, spleen, or kidneys, confirming that there was no significant long-term toxicity. After treatment, all tissues isolated from the saline group had the lowest Ca content (see Figure 7F). After free CUR treatment, the Ca content in the tumor was similar to that in the saline group, and the highest concentration was seen with CaO2@ZIF8:CUR@PAA. The biological distribution of CaO2@ZIF8:CUR@PAA in the tumor and major organs indicates that the material is prone to accumulation in the kidneys (Figure 7F). Thus, CaO2@ZIF8:CUR@PAA is excreted via the kidneys after entering the bloodstream. This results in the kidneys contain a large concentration of calcium ions, but the H&E images show that this does not cause any detrimental effects and is presumably simply a result of the excretion pathway.
Discussion and Challenges
Calcium nanomodulators such as calcium carbonate (CaCO3),55 calcium peroxide (CaO2), and calcium phosphate (CaP)56 have been previously developed for “calcium overload” mediated cancer treatment, but they have a number of limitations. For example, the level of Ca2+ in the mitochondria may quickly recover to normal levels due to the natural efflux through Ca2+ channels, resulting in poor anticancer effects. These Ca2+ containing materials are also prone to decomposition in acidic environments, making it difficult for them to function in the TME. Therefore, it is necessary to design a protective shell to protect the calcium material. Previous studies have shown that hyaluronic acid modified CaO2 (SH-CaO2 NPs) can support the safe transport of the Ca2+ to tumors, leading to intracellular calcium loading and oxidative stress. Compared with these studies, the use of PAA and ZIF8 shells in this work utilized the respective advantages of the two materials to provide better performance than sodium hyaluronate19 and hyaluronic acid57 in terms of slowing down the release of Ca2+ and avoiding premature release of the active ingredient. The two-layer CaO2 protective shell is like two locks that hold CaO2 in place, waiting for acid to unlock it. The use of such two-layer shells could each protect a different active ingredient, delivering and releasing them more efficiently compared to single-layer protection. It is thus a potentially promising strategy for efficient delivery of drugs with different traits.
Other studies use CaO2 to provide H2O2 in combination with tandem catalytic,57 photothermal, and/or photodynamic58 methods for tumor treatment, but the effect seen was lower than that observed in this work. Future combinations of CaO2@ZIF8:CUR@PAA with other therapeutic modalities such as immunotherapy, chemotherapy or radiation therapy could be considered to improve therapeutic efficacy. The in vivo experimental results presented here demonstrate that CaO2@ZIF8:CUR@PAA is effective in providing a Ca storm combined with oxidative damage treatment for tumors. The material can also serve as an ICD inducer and provide new directions for tumor immunotherapy. However, some challenges still exist hindering the implementation of CaO2@ZIF8:CUR@PAA in clinical applications. Although it will accumulate at the tumor site, the acid-dependent release of the nanoplatform may lead to toxicity if release occurs in other slightly acidic environments in the body. In addition, potential toxicity or immune response persistence during long-term treatment is to be investigated. Larger animal models, and ultimately human trials, will be needed before clinical translation is possible. The collection of therapeutic data related to other types of cancer will also be helpful, to show how broadly effective the formulation is likely to be. However, the complexity of large-scale animal model studies, tumor model studies, and other problems implies the need for safe, stable, and controllable synthetic processes, and scaling up to study the above problems is challenging.
Conclusion
In this work, we develop a nanoparticle platform to increase the Ca and H2O2 content in tumor cells, thereby driving mitochondrial dysfunction. CaO2 NPs were first prepared, and then the mesoporous ZIF8 deposited on the surface. The chemotherapeutic drug CUR was loaded into the ZIF pores and finally a pH-responsive PAA layer coated on the particle exterior. The hydrodynamic diameter of the final product CaO2@ZIF8:CUR@PAA is approximately 164 nm, which remains stable with time in physiologically relevant media. The CaO2@ZIF8:CUR@PAA complexes exhibit pH responsive properties, unlocking the two protective shells of ZIF8 and PAA and accelerating CUR and Ca2+ release in the mildly acidic conditions typical of the tumor microenvironment. In vitro cell culture studies found that the NPs are largely non-toxic to healthy cells but can promote the death of cancerous cells. Intracellular H2O2 and Ca2+ levels are both upregulated after NP application, while the ability of the cells to migrate is reduced. In vivo experiments have shown that CaO2@ZIF8:CUR@PAA can enhance Ca accumulation in tumors, resulting in extensive apoptosis and minimal tumor growth. The NPs can polarize macrophages to the M1 phenotype, hence driving immunogenic cell death. Tumor metastasis is reduced, while there are no marked toxic side effects. Hence, the CaO2@ZIF8:CUR@PAA system has clear potential for tumor treatment.
Data Sharing Statement
The data that support the findings in this paper are available from the corresponding author upon reasonable request.
Ethical Approval
All animal experiments were ethically reviewed and conducted according to the procedures authorized by the Animal Welfare and Ethics Committee of Yunnan University of Chinese Medicine (Approval no. SCXK-K2022-0004). All applicable institutional guidelines for the care and use of animals were followed. The authors have adhered to the ARRIVE guidelines.
Author Contributions
All authors made a significant contribution to the work reported, whether that is in the conception, study design, execution, acquisition of data, analysis and interpretation, or in all these areas; took part in drafting, revising or critically reviewing the article; gave final approval of the version to be published; have agreed on the journal to which the article has been submitted; and agree to be accountable for all aspect of the work.
Funding
This work was supported by the Science and Technology Commission of Shanghai Municipality under Grant [No. 22520710400, 21WZ2501300, 20DZ2254900]; the Biomedical Textile Materials “111 Project” of the Ministry of Education of China under Grant [No. B07024]; National Natural Science Foundation of China under Grant [No. 82272012]; Shanghai Jiao Tong University K. C. Wong Medical Fellowship Fund and Shanghai Municipal Education Commission; the Young Scientists Fund of the National Natural Science Foundation of China under Grant [No. 82104403].
Disclosure
The authors declare no conflict of interests.
References
1. Yang J, Griffin A, Qiang Z. et al. Organelle-targeted therapies: a comprehensive review on system design for enabling precision oncology. Signal Transduct Target TAR. 2022;7(1):379. doi:10.1038/s41392-022-01243-0
2. Zhong X, Wei G, Liu B, et al. Polyhedral oligomeric silsesquioxane-based nanoparticles for efficient chemotherapy of glioblastoma. Small. 2023;19(18):2207248. doi:10.1002/smll.202207248
3. Du W, Du S, Dong X, et al. Biodegradable silica nanocapsules enable efficient nuclear-targeted delivery of native proteins for cancer therapy. Biomaterials. 2023;294:122000. doi:10.1016/j.biomaterials.2023.122000
4. Jiang H, Fu H, Guo Y, et al. Evoking tumor associated macrophages by mitochondria-targeted magnetothermal immunogenic cell death for cancer immunotherapy. Biomaterials. 2022;289:121799. doi:10.1016/j.biomaterials.2022.121799
5. Li W, Yin S, Shen Y, et al. Molecular engineering of pH-responsive nir oxazine assemblies for evoking tumor ferroptosis via triggering lysosomal dysfunction. J Am Chem Soc. 2023;13:7825. doi:10.1002/smll.202207825
6. Gu R, Yang W, Han L, et al. Biomineralized CO gas-releasing nanoprodrug for endoplasmic reticulum stress mediated cancer therapy. Nano Res. 2023;16(5):7373–7382. doi:10.1007/s12274-023-5458-8
7. Huang M, Xiong D, Pan J, et al. Prevention of tumor growth and dissemination by in situ vaccination with mitochondria-targeted atovaquone. Adv Sci. 2022;9(12):2101267. doi:10.1002/advs.202101267
8. Gong W, Zhao T, Yuan H, et al. A multichannel nucleic acid-based Ca2+ nanomodulator induces multilevel destruction of mitochondria for cancer therapy. Nano Today. 2024;58:102465. doi:10.1016/j.nantod.2024.102465
9. Shi J, Kantoff PW, Wooster R, et al. Cancer nanomedicine: progress, challenges and opportunities. Nat Rev Cancer. 2017;17(1):20–37. doi:10.1038/nrc.2016.108
10. Liu X, He F, Liu M. New opportunities of stimulus-responsive smart nanocarriers in cancer therapy. NMS. 2024;22:1. doi:10.1016/j.nanoms.2024.10.013
11. Wu XXY, Zhang H, Quan L, Ao Q, Ao Q.Biopolymer-based nanomedicine for cancer therapy: opportunities and challenges. Int J Nanomed. 2024;19:7415–7471. doi:10.2147/IJN.S460047
12. Zhao P, Gong L, Chang L, et al. Multifunctional Fe-based coordination polymer nano-bomb modified with β-lapachone and CaO2 for targeted tumor dual chemodynamic therapy with enhanced ferroptosis and H2O2 self-supply. JNAN. 2024;22(1):3. doi:10.1186/s12951-023-02287-2
13. Singh V, Nandi S, Ghosh A, et al. Epigenetic reprogramming of T cells: unlocking new avenues for cancer immunotherapy. Cancer Metast Rev. 2024;43(1):175–195. doi:10.1007/s10555-024-10167-w.
14. Gong F, Yang N, Wang X, et al. Tumor microenvironment-responsive intelligent nanoplatforms for cancer theranostics. Nano Today. 2020;32:100851. doi:10.1016/j.nantod.2020.100851
15. Shi Y, Liao J, Zhang C, et al. Cascade-responsive size/charge bidirectional-tunable nanodelivery penetrates pancreatic tumor barriers. Chemical Science. 2024;15(38):15647–15658. doi:10.1039/D4SC04782F
16. Liu X, Wang X, Zang D, et al. pH-responsive oxygen self-sufficient smart nanoplatform for enhanced tumor chemotherapy and photodynamic therapy. J Colloid Interf Sci. 2024;675:1080–1090. doi:10.1016/j.jcis.2024.07.113
17. Liu X, Chen X, Fei Y, et al. Locally injectable, ROS-scavenging, and ROS-/pH-responsive polymeric-micelles-embedded hydrogels for precise minimally invasive and long-lasting rheumatoid therapy. Adv Healthc Mater. 2024;2024:2403579. doi:10.1002/adhm.202403579
18. He Y, Zheng K, Qin X, et al. Intravenous delivery of STING agonists using acid-sensitive polycationic polymer-modified lipid nanoparticles for enhanced tumor immunotherapy. APSB. 2024;2024:1. doi:10.1016/j.apsb.2024.06.004
19. Zhang M, Song R, Liu Y, et al. Calcium-overload-mediated tumor therapy by calcium peroxide nanoparticles. Chem. 2019;5(8):2171–2182. doi:10.1016/j.chempr.2019.06.003
20. Wei F, Hou L, Yao Y, et al. An intelligent Cu/ZIF-8-based nanodrug delivery system for tumor-specific and synergistic therapy via tumor microenvironment-responsive cascade reaction. Microchim Acta. 2024;191(8):447. doi:10.1007/s00604-024-06527-6
21. Duan W, Hang L, Ma Y, et al. Compartmentalized nano-MOFs as Co-delivery systems for enhanced antitumor therapy. ACS Appl Mater Interfaces. 2023;15(33):39039–39052. doi:10.1021/acsami.3c04296
22. Lai Z, Bai F, Pu T, et al. Tumor-targeted gypenoside nanodrug delivery system with double protective layers. J Cancer Res Ther. 2024;20(2):684–694. doi:10.4103/jcrt.jcrt_134_23
23. Gong Z, Fu Y, Gao Y, et al. “Abraxane-like” radiosensitizer for in situ oral cancer therapy. Adv Sci. 2024;2024:2309569. doi:10.1002/advs.202309569.
24. Wang W, Yu J, Lin Y, et al. NIR absorptive croconic acid/quercetin/CaO2 nanoplatform for tumor calcium overload therapy combined mild photothermal therapy. BMA. 2023;149:213418. doi:10.1016/j.bioadv.2023.213418
25. Wang C, Li Z, Bai J. Bubble-assisted HIFU ablation enabled by calcium peroxide. J Mater Chem B. 2022;10(23):4442–4451. doi:10.1039/D2TB00587E
26. Bai S, Lan Y, Fu S, et al. Connecting calcium-based nanomaterials and cancer: from diagnosis to therapy. NML. 2022;14(1):145. doi:10.1007/s40820-022-00894-6
27. Zhang H, Zou Y, Lu K, et al. A nanoplatform with oxygen self-supplying and heat-sensitizing capabilities enhances the efficacy of photodynamic therapy in eradicating multidrug-resistant biofilms. JMST. 2024;169:209–219. doi:10.1016/j.jmst.2023.07.001
28. Lu Y, Zhao X, Yan D, et al. Upconversion-based chiral nanoprobe for highly selective dual-mode sensing and bioimaging of hydrogen sulfide in vitro and in vivo. Light Sci Appl. 2024;13(1):180. doi:10.1038/s41377-024-01539-6
29. Kwon S, Meng F, Tamam H, et al. Systemic delivery of paclitaxel by find-me nanoparticles activates antitumor immunity and eliminates tumors. ACS Nano. 2024;18(4):3681–3698. doi:10.1021/acsnano.3c11445
30. Tang H, Li Q, Yan W, et al. Reversing the chirality of surface ligands can improve the biosafety and pharmacokinetics of cationic gold nanoclusters. Angew Chem Int Ed. 2021;60(25):13829–13834. doi:10.1002/anie.202101609
31. Ding B, Chen H, Tan J, et al. ZIF-8 nanoparticles evoke pyroptosis for high-efficiency cancer immunotherapy. Angew Chem Int Ed. 2023;62(10):e202215307. doi:10.1002/anie.202215307
32. Sun X, Chen K, Liu Y, et al. Metal–organic framework combined with CaO2 nanoparticles for enhanced and targeted photodynamic therapy. Nanoscale Adv. 2021;3(23):6669–6677. doi:10.1039/D1NA00610J
33. Zhang T, Jin X, Owens G, et al. Remediation of malachite green in wastewater by ZIF-8@Fe/Ni nanoparticles based on adsorption and reduction. J Colloid Interf Sci. 2021;594:398–408. doi:10.1016/j.jcis.2021.03.065
34. Bhalla S, Melnekoff DT, Aleman A, et al. Patient similarity network of newly diagnosed multiple myeloma identifies patient subgroups with distinct genetic features and clinical implications. Sci Adv. 2021;7(47):eabg9551. doi:10.1126/sciadv.abg9551
35. Shen S, Mamat M, Zhang S, et al. Synthesis of CaO2 nanocrystals and their spherical aggregates with uniform sizes for use as a biodegradable bacteriostatic agent. Small. 2019;15(36):1902118. doi:10.1002/smll.201902118
36. Fang K, Sun Y, Yang J, et al. A Dual Stimuli-Responsive Nanoplatform Loaded Pt IV -Triptolide Prodrug for Achieving Synergistic Therapy toward Breast Cancer. Adv Healthc Mater. 2023;12(28):2301328. doi:10.1002/adhm.202301328
37. Yang J, Lin J, Chen X, et al. Mesona chinensis polysaccharide/zein nanoparticles to improve the bioaccesibility and in vitro bioactivities of curcumin. Carbohyd Polym. 2022;295:119875. doi:10.1016/j.carbpol.2022.119875
38. Li R, Zhang C, Wang C, et al. Study on the mechanism of the reversible color change of polyacrylic acid modified gold nanoparticles responding to pH. Mat. 2021;14(13):679. doi:10.3390/ma14133679
39. Zhu Y, Bu S. Curcumin induces autophagy, apoptosis, and cell cycle arrest in human pancreatic cancer cells. Evid-Based Complementary Altern Med. 2017;2017:5787218. doi:10.1155/2017/5787218
40. Xie X, Zheng X, Han Z, et al. A biodegradable stent with surface functionalization of combined-therapy drugs for colorectal cancer. Adv Healthc Mater. 2018;7(24):1801213. doi:10.1002/adhm.201801213
41. Wang KX, Cai MR, Yin DG, et al. IRMOF-8-encapsulated curcumin as a biocompatible, sustained-release nano-preparation. App Organomet Chem. 2022;36(6):e6680. doi:10.1002/aoc.6680
42. Carozza G, Tisi A, Capozzo A, et al. New insights into dose-dependent effects of curcumin on ARPE-19 cells. Int J mol Sci. 2022;23(23):14771. doi:10.3390/ijms232314771
43. Li X, Zhou Z, Zhou R, et al. Stimuli-responsive nanoparticles combining photodynamic therapy and mitochondria disruption suppressed tumor metastasis. AMI. 2021;8(10):2002200. doi:10.1002/admi.202002200
44. Jia Q, Li F, Li C, et al. Human epidermal growth factor receptor 2(Her2)-targeted pH-responsive MR/NIRF bimodal imaging-mediated nano-delivery system for the diagnosis and treatment of undifferentiated thyroid cancer. Drug Deliv Transl Re. 2024;2024:1. doi:10.1007/s13346-024-01727-2
45. Sun L, Qi J, Ding L, et al. Ultrasound-triggered nano delivery of lenvatinib for selective immunotherapy treatment against hepatocellular carcinoma. Scientific Reports. 2024;14(1):27395. doi:10.1038/s41598-024-79069-9
46. Liu Z, Yang Y, Kong X, et al. Drug-device-field integration for mitochondria-targeting dysfunction and tumor therapy by home-tailored pyroelectric nanocomposites. Biomaterials. 2025;316:122990. doi:10.1016/j.biomaterials.2024.122990
47. Zhou Y, Yuan J, Xu K, et al. Nanotechnology reprogramming metabolism for enhanced tumor immunotherapy. ACS Nano. 2024;18(3):1846–1864. doi:10.1021/acsnano.3c11260
48. Liu J, Hu X, Yu G, et al. Doxorubicin-based ENO1 targeted drug delivery strategy enhances therapeutic efficacy against colorectal cancer. Biochem Pharmacol. 2024;224:116220. doi:10.1016/j.bcp.2024.116220
49. Li Z, Lan J, Wu Y, et al. Sensitizing sorafenib to hepatocellular carcinoma with dual-targeted and pH-responsive nanodrugs via overcoming the hypoxia tumor microenvironment. Chem Eng J. 2024;500:157231. doi:10.1016/j.cej.2024.157231
50. He K, Hu C, Ding Y-F, et al. Renal-clearable luminescent gold nanoparticles incorporating active and bio-orthogonal tumor-targeting for drug delivery and controlled release. Nano Today. 2024;56:102245. doi:10.1016/j.nantod.2024.102245
51. Li D, Liu S, Ma Y, et al. Biomaterials that induce immunogenic cell death. Small Methods. 2023;7(5):2300204. doi:10.1002/smtd.202300204
52. Chen L, Ma X, Dang M, et al. Simultaneous T cell activation and macrophage polarization to promote potent tumor suppression by iron oxide-embedded large-pore mesoporous organosilica core–shell nanospheres. Adv Healthc Mater. 2019;8(9):1900039. doi:10.1002/adhm.201900039
53. Zhang K, Wu J, Zhao X, et al. Prussian blue/calcium peroxide nanocomposites-mediated tumor cell iron mineralization for treatment of experimental lung adenocarcinoma. ACS Nano. 2021;15(12):19838–19852. doi:10.1021/acsnano.1c07308
54. Guan X, Li J, Cai J, et al. Iron oxide-based enzyme mimic nanocomposite for dual-modality imaging guided chemical phototherapy and anti-tumor immunity against immune cold triple-negative breast cancer. Chem Eng J. 2021;425:130579. doi:10.1016/j.cej.2021.130579
55. Ma S, Xu W, Fei Y, et al. Mn 2+ /Ir 3+ -Doped and CaCO 3 -Covered Prussian Blue Nanoparticles with Indocyanine Green Encapsulation for Tumor Microenvironment Modulation and Image-Guided Synergistic Cancer Therapy. Ad Healthc Mater. 2023;12(28):2301413. doi:10.1002/adhm.202301413
56. Lv Y, Chen X, Shen Y. Folate-modified carboxymethyl chitosan-based drug delivery system for breast cancer specific combination therapy via regulating mitochondrial calcium concentration. Carbohyd Polym. 2024;323:121434. doi:10.1016/j.carbpol.2023.121434
57. Zhu Y, Liu J, Liu Y, et al. Self-supplying of hydrogen peroxide/oxygen based on CaO2-Co3O4 cascade nanoreactors for cellular microenvironment regulation. ACS Appl Nano Mater. 2023;6(14):12904–12913. doi:10.1021/acsanm.3c01642
58. Qian Z, Zhao N, Xu S, et al. In situ injectable thermoresponsive nanocomposite hydrogel based on hydroxypropyl chitosan for precise synergistic calcium-overload, photodynamic and photothermal tumor therapy. Carbohyd Polym. 2024;324:121487. doi:10.1016/j.carbpol.2023.121487
 © 2025 The Author(s). This work is published and licensed by Dove Medical Press Limited. The
full terms of this license are available at https://www.dovepress.com/terms.php
and incorporate the Creative Commons Attribution
- Non Commercial (unported, 3.0) License.
By accessing the work you hereby accept the Terms. Non-commercial uses of the work are permitted
without any further permission from Dove Medical Press Limited, provided the work is properly
attributed. For permission for commercial use of this work, please see paragraphs 4.2 and 5 of our Terms.
© 2025 The Author(s). This work is published and licensed by Dove Medical Press Limited. The
full terms of this license are available at https://www.dovepress.com/terms.php
and incorporate the Creative Commons Attribution
- Non Commercial (unported, 3.0) License.
By accessing the work you hereby accept the Terms. Non-commercial uses of the work are permitted
without any further permission from Dove Medical Press Limited, provided the work is properly
attributed. For permission for commercial use of this work, please see paragraphs 4.2 and 5 of our Terms.
Recommended articles
An Oxygen-Sufficient Nanoplatform for Enhanced Imaging-Guided Microwave Dynamic Therapy Against Hypoxic Tumors
Yang R, Huang J, Liao M, Huang J, Gao B, Zhang H, Zhou J, Xu J, Lu Q
International Journal of Nanomedicine 2022, 17:5525-5545
Published Date: 21 November 2022