")
Back to Journals » Journal of Inflammation Research » Volume 18
Adipose-Derived Mesenchymal Stem Cells Accelerate Diabetic Foot Ulcer Healing by Promoting Macrophage M2 Polarization Through Downregulation of EREG and CSTA
Authors Cao J , Zhang X, Li Z, Zhang S, Guo L, Liu Z, An W , Xu L, Li L , Long X, Yang Y
Received 27 January 2025
Accepted for publication 31 May 2025
Published 12 June 2025 Volume 2025:18 Pages 7749—7768
DOI https://doi.org/10.2147/JIR.S519713
Checked for plagiarism Yes
Review by Single anonymous peer review
Peer reviewer comments 2
Editor who approved publication: Dr Tara Strutt
Jing Cao,1,* Xin Zhang,1,* Zhujun Li,2 Sen Zhang,3 Leiming Guo,1 Zichao Liu,1 Wenqiang An,1 Lijia Xu,4,5 Lijie Li,1 Xiao Long,2 Yuemei Yang1
1Research and Development Department, Beijing AegleStem Therapeutics Co., Ltd., Beijing, People’s Republic of China; 2Department of Plastic Surgery, Peking Union Medical College Hospital, Beijing, People’s Republic of China; 3Institute of Materia Medica, Chinese Academy of Medical Sciences & Peking Union Medical College, Beijing, People’s Republic of China; 4Institute of Medicinal Plant Development, Chinese Academy of Medical Sciences & Peking Union Medical College, Beijing, People’s Republic of China; 5Hainan Branch of the Institute of Medicinal Plant Development, Chinese Academy of Medical Sciences & Peking Union Medical College, Haikou, People’s Republic of China
*These authors contributed equally to this work
Correspondence: Yuemei Yang, Research and Development Department, AegleStem Therapeutics Co., Ltd.E4, Innovation Service Center, Free Trade Zone, 1 North Yuanping Road, Beijing, 102600, People’s Republic of China, Email [email protected] Xiao Long, Department of Plastic Surgery, Peking Union Medical College Hospital, 1 Shuaifuyuan, Beijing, 100730, People’s Republic of China, Email [email protected]
Purpose: Macrophage polarization plays a critical role in the chronic wound healing of diabetic foot ulcers (DFU). Recent studies have shown that adipose-derived mesenchymal stem cells (ADSCs) can reduce inflammation in DFU and promote wound healing. Despite advances in stem cell therapy, the molecular mechanisms by which ADSCs regulate macrophage polarization in DFU healing remain unclear, and robust prognostic models for DFU are lacking. This study aims to identify macrophage polarization-associated molecules in DFU and explore whether ADSCs promote DFU healing by regulating these molecules.
Patients and Methods: Macrophage polarization-associated differentially expressed genes (MA-DEGs) were screened from GSE134431 and GSE80178 datasets. Protein-protein interaction (PPI) networks were constructed using STRING and Cytoscape. Machine learning and Firth regression were employed to develop a prognostic model, which was evaluated using receiver operating characteristic (ROC) curves. The expression of predicted genes (EREG and CSTA) and the regulatory effects of ADSCs on these genes were validated in both DFU mouse model and THP-1 cells.
Results: A total of 30 macrophage polarization-associated differentially expressed genes (MA-DEGs) were identified, including 18 hub genes. These MA-DEGs were primarily enriched in pathways related to leukocyte chemotaxis and interleukin-4 and 13. A two-gene prognostic model was constructed using machine learning and Firth regression, achieving an AUC greater than 0.944 in both the training and external validation datasets. In vivo and in vitro experiments demonstrated that ADSCs regulate EREG and CSTA expression to promote macrophage M2 polarization and facilitate DFU wound healing.
Conclusion: This study elucidates the molecular mechanisms by which ADSCs facilitate DFU healing via macrophage M2 polarization. The identified two-gene MA-DEGs model not only serves as a potential prognostic biomarker but also provides promising targets for DFU therapy.
Keywords: diabetic foot ulcer, macrophage polarization, prognostic model, adipose-derived mesenchymal stem cells
Introduction
Diabetic foot ulcers (DFU) are a prevalent complication in individuals with diabetes mellitus. They are a leading cause of diabetes-related hospitalizations and lower limb amputations, affecting approximately 25% of patients with diabetes over their lifetime.1–3 This condition impose a substantial burden on both patient quality of life and global healthcare systems. It underscore the urgent need for effective prognostic and therapeutic strategies.4,5
Wound healing is a dynamic and complex biological process typically divided into four interrelated phases: hemostasis, inflammation, proliferation, and remodeling.6 Following injury, platelets release transforming growth factor (TGF-β), platelet-derived growth factor (PDGF), and other factors. These factors recruit neutrophils and macrophages, initiating the inflammatory phase of healing.7 In the early stage of inflammation, neutrophils play a dominant role. As inflammation progresses to the later stage, neutrophils decrease and are replaced by macrophages.8 Macrophages can be broadly categorized into pro-inflammatory M1 and anti-inflammatory M2 phenotypes.9 M1 macrophages exert pro-inflammatory effects. They have enhanced phagocytosis and antigen processing capabilities. They promote host defense by upregulating cytokines such as interleukin-1 (IL-1), IL-6, IL-12, and tumor necrosis factor-alpha (TNF-α).10 M2 macrophages can be induced by various stimuli, such as IL-4, IL-13, and glucocorticoids. They play key roles in suppressing inflammation, promoting wound healing, and facilitating tissue remodeling.10–12 Thus, M2 macrophages are essential for coordinating the transition from inflammation to the proliferative phase through the release of soluble mediators.7 During the proliferative phase, keratinocytes and fibroblasts migrate to the wound site, contributing to re-epithelialization and wound contraction, which ultimately promote healing.
In skin injuries without underlying pathophysiological defects, wound healing proceeds orderly. However, in DFU, the healing process is often arrested at the inflammatory phase. Persistent chronic inflammation hinders wound healing.13 The hyperglycemic microenvironment in DFU promotes sustained M1 pro-inflammatory responses while impairing M2 macrophage polarization.14 This impaired polarization disrupts the transition from the inflammatory phase to the proliferative and remodeling stages.15 Prolonged inflammation exacerbates tissue damage and ultimately contributes to the formation of non-healing ulcers. Meanwhile, a prolonged hyperglycemic environment accelerates the accumulation of advanced glycation end products (AGEs). These AGEs impair keratinocyte and fibroblast function by inhibiting growth factor activity and enhancing pro-inflammatory cytokine production.16 As a result of these molecular alterations, the healing process remains stalled in the inflammatory phase. This leads to pathological inflammation and impaired endogenous repair mechanisms, ultimately preventing progression to subsequent healing phases.17
Mesenchymal stem cells (MSCs), including ADSCs, have emerged as promising candidates for enhancing wound healing due to their multipotent differentiation potential and paracrine-mediated immunomodulatory effects. Recent studies have shown that MSCs modulate the inflammatory microenvironment by suppressing M1 polarization and promoting M2 phenotype transition, thereby decreasing pro-inflammatory cytokines (eg, TNF-α, IL-6) and increasing anti-inflammatory mediators such as IL-10.18 Additionally, MSCs secrete angiogenic factors such as vascular endothelial growth factor (VEGF) and fibroblast growth factor (FGF), which stimulate neovascularization and fibroblast proliferation, critical for tissue regeneration.19 These mechanisms are particularly relevant in DFU, where impaired angiogenesis and dysregulated macrophage activity contribute to chronic non-healing wounds.
ADSCs, a subset of MSCs isolated from adipose tissue, possess the fundamental properties of MSCs and exhibit potential for differentiation into adipose, bone, and cartilage, making them a versatile source for tissue repair.20,21 The mechanisms by which ADSCs ameliorate DFU-associated lesions align with the general functional profile of MSCs. They exert immunomodulatory effects by suppressing T lymphocyte proliferation, inhibiting dendritic cell (DC) maturation, and downregulating M1 macrophage polarization.22 In addition, ADSCs promote angiogenesis primarily through the secretion of VEGF.18 These actions address the core pathological features of DFU, including sustained inflammation and inadequate vascularization.23 Wound formation triggers an acute inflammatory response, which serves to clear necrotic tissue and initiate tissue repair and remodeling.24 However, DFU typically manifests as sustained chronic inflammation. This impairs tissue repair.25 ADSCs possess distinct immunomodulatory capabilities. They exert anti-inflammatory effects in an inflammatory microenvironment by inhibiting T lymphocyte proliferation, DC maturation, and M1 macrophage polarization, thereby facilitating wound healing.26
This study analyzed the DFU-related datasets from the GEO database (Gene Expression Omnibus) to identify hub genes involved in DFU formation. A prognostic model for DFU was established using machine learning. The model’s predictive performance was validated in an independent external dataset. Key genes identified from the model—EREG and CSTA—were further validated in a DFU mouse model. They were found to be highly expressed and implicated in DFU pathogenesis. Treatment with ADSCs reduced the expression of EREG and CSTA in DFU, promoted macrophage polarization toward the M2 phenotype, and achieved therapeutic effects on DFU.
Materials and Methods
Raw Data Collection
Gene expression data and annotation information for datasets GSE134431, GSE80178, and GSE143735 were retrieved from the GEO (https://www.ncbi.nlm.nih.gov/geo/) database. The GSE134431 dataset included RNA-seq on DFU biopsy tissues and human skin wound biopsies, identifying a distinct inflammatory signature in DFU compared to normal wound healing. The GSE80178 dataset compared DFU with human acute wounds (AW), revealing dysregulation in key healing processes such as inflammation. The GSE143735 dataset examined gene expression differences between healthy controls, diabetic patients without DFU, and DFU patients. The research aims and findings of these three datasets are consistent with those of our current study. In this study, GSE134431 and GSE80178 were used as discovery sets, while GSE143735 was used as a validation set. Detailed information about each gene set is provided in (Table 1).
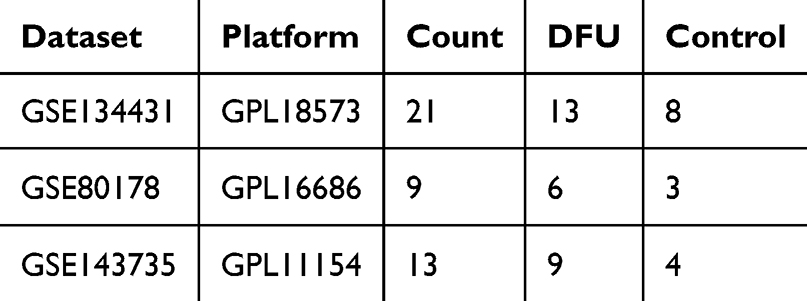 |
Table 1 Dataset Information |
Macrophage Polarization-Associated Differently Expressed Genes (MA-DEGs) Identification
GEO2R (https://www.ncbi.nlm.nih.gov/geo/geo2r/) was utilized to identify differentially expressed genes between DFU tissue and the control group. Genes with adjusted P < 0.05 and |log2(fold change) | ≥ 1 were identified as significantly differentially expressed genes (DEGs).27,28 The “ggplot2” and “pheatmap” packages in R (https://www.r-project.org/) were used to visualize the differential results with volcano plots and heatmaps. “Macrophage Polarization” and “Macrophage M2” were used as keywords to search for macrophage polarization-associated genes on the GeneCards (https://www.genecards.org/) database. The intersection of identified macrophage polarization-associated genes and differentially expressed genes (DEGs) in GSE134431 and GSE80178 was defined as MA-DEGs.
GO and KEGG Pathway Enrichment Analysis
The “ClusterProfiler”29 and “org.Hs.eg.db”30 packages in R were used to conduct gene ontology (GO)31 and Kyoto Encyclopedia of Genes and Genomes(KEGG)32 enrichment analysis of DEGs.
Hub Genes Identification
The STRING database (https://string-db.org/)33 was used to construct the Protein-protein interaction (PPI) network for MA-DEGs and to perform GO and Reactome enrichment analysis. Interactions with a confidence score ≥ 0.4 (medium confidence threshold) were included. Cytoscape34 (Version 3.10.3, https://cytoscape.org/) was used to identify key genes through four methods: Maximum Neighborhood Component (MNC), Maximal Clique Centrality (MCC), Edge Percolated Component (EPC), and Degree. MNC: Prioritizes nodes within dense functional modules (local functional coherence). MCC: Detects core components of fully interconnected complexes (protein complex cores). EPC: Filters noise by retaining high-confidence edges (STRING score ≥0.4), ensuring robustness. Degree: Identifies globally connected hubs (breadth of influence). The top 20 genes from each algorithm were intersected to generate the final hub gene list.
Machine Learning
Four machine learning algorithms, including Least Absolute Shrinkage and Selection Operator (LASSO),35 random forest (RF),36 Support Vector Machine Recursive Feature Elimination (SVM-RFE),37 and eXtreme Gradient Boosting (XGBoost)38 were applied to filter the hub gene list, and the intersection of key variables was taken. A DFU prognostic model was developed using Firth regression based on the intersected genes. Firth regression was specifically developed to address separation issues in logistic regression and small sample size bias, making it particularly suitable for clinical studies with rare outcomes, such as DFU.39,40 The model’s predictive efficacy was validated in both the training and validation sets using receiver operating characteristic (ROC) curves,41 The R packages “glmnet”,42 “randomForest”,43 “e1071”,44 “xgboost”,38 and “logistf”45 were used to implement LASSO, RF, SVM-RFE, XGBoost, and Firth regression, respectively. The “pROC”46 package was used for plotting ROC curves.
Immune Cell Infiltration Analysis
The landscape of 22 immune cell types in DFU was analyzed using the “CIBERSORT”47 R package based on the CIBERSORT algorithm and the LM22 gene set.48 Subsequently, the correlation between the expression of key genes EREG and CSTA and immune cell infiltration was analyzed.
Isolation and in vitro Culture of ADSCs
Adipose tissue was collected via liposuction from healthy donors at Peking Union Medical College Hospital with informed consent. In the laboratory, the tissue was washed, minced, and enzymatically digested with 0.1% collagenase I at 37°C for 30 minutes. After filtration through a 100 μm strainer and centrifugation at 300 × g for 5 minutes, cells were cultured in T75 flasks at 37°C with 5% CO2. The culture medium was replaced every 48 hours. When reaching 80–90% confluence, ADSCs were passaged using TrypLE™ (Cat. No. 12604021, Thermo Fisher Scientific, USA).
Establishment of the DFU Mouse Model and ADSCs Treatment
Male BALB/c mice, aged 6–8 weeks and weighing 18–20 g, were purchased from Sipeifu (Beijing) Biotechnology Co., Ltd. to establish a DFU mouse model. Diabetes was induced using streptozotocin (STZ), and the mice were fasted for 12 hours before induction but were allowed free access to water. STZ was administered via intraperitoneal injection at a dose of 120 mg/kg.49 Blood glucose in mice was monitored daily after STZ induction until day 7. Mice with fasting blood glucose levels exceeding 11.1 mmol/L were considered diabetic. Diabetic mice were anesthetized, and under aseptic conditions, a 4 mm circular full-thickness skin wound was created on the dorsal hind limb using a biopsy punch. To evaluate the therapeutic effect, 5×10⁵ ADSCs suspended in 100 µL PBS were subcutaneously injected into four equidistant sites (25 µL per site) surrounding the wound margin.
Wound Closure Rate Assessment
The wound closure rate was analyzed using Image-Pro Plus 6.0 software. The closure rate was determined by comparing the wound area on day 7 with the initial area, using the formula:
Wound closure rate (%) = [(initial area - area on day 7) / initial area] × 100%.
Histological Assessment of DFU Healing
On the 7th day after ADSCs administration, mice were euthanized, and wound tissues along with adjacent skin were harvested. The samples were immediately fixed in formalin for 48 hours and then embedded in paraffin wax. The embedded tissues were sectioned at a thickness of 5 µm. Hematoxylin and eosin (H&E) and Masson’s trichrome staining were performed to evaluate inflammatory cell infiltration and collagen fiber deposition, respectively.
Immunohistochemistry
To evaluate collagen deposition, immunohistochemistry (IHC) for collagen I was conducted following the protocols provided by the antigen manufacturer. Antigen retrieval was performed by heating the slides in citrate buffer (pH 6.0) in a microwave. DAB (3,3′-diaminobenzidine) was used as a coloring solution, and the sections were counterstained with hematoxylin. The intensity of collagen I expression was evaluated microscopically. Statistical comparisons between treated and control groups were conducted to assess therapeutic efficacy.
Transwell Co-Culture Experiments Under AGE Conditions
Under AGE conditions, the regulatory effects of ADSCs on macrophages were conducted through transwell experiments. Briefly, 10 mg AGE was dissolved in PBS to form a 10 mg/mL stock solution which was added to the culture medium at a ratio of 1:50 to form a 200 μg/mL working solution.50 1×10⁶ Macrophages were seeded in the lower chamber, while 1×10⁵ ADSCs were seeded in the upper chamber. After co-culture, RNA was extracted from macrophages for RT-qPCR. Flow cytometry was used to detect macrophage markers. M0: THP-1 cells were treated with 100 ng/mL phorbol 12-myristate 13-acetate (PMA) for 48 hours to induce adhesion and differentiation into M0 macrophages. M1 polarization factors: Lipopolysaccharide (LPS, 100 ng/mL) + interferon-γ (IFN-γ, 20 ng/mL). M2 polarization factors: Interleukin-4 (IL-4, 20 ng/mL) + interleukin-13 (IL-13, 20 ng/mL).
RT-qPCR
According to the product manual of Takara’s RR820A, RT-qPCR was used to validate the expression of key genes EREG and CSTA in mouse tissues and macrophages before and after ADSCs treatment. To ensure the reliability of our RT-qPCR data, we conducted a reference gene stability analysis using the geNorm software.51 GAPDH was identified as the most stable housekeeping gene (M value < 0.5) and was used for normalization. Relative expression levels were calculated using the 2^−ΔΔCt method. Primer sequences are listed in (Table 2).
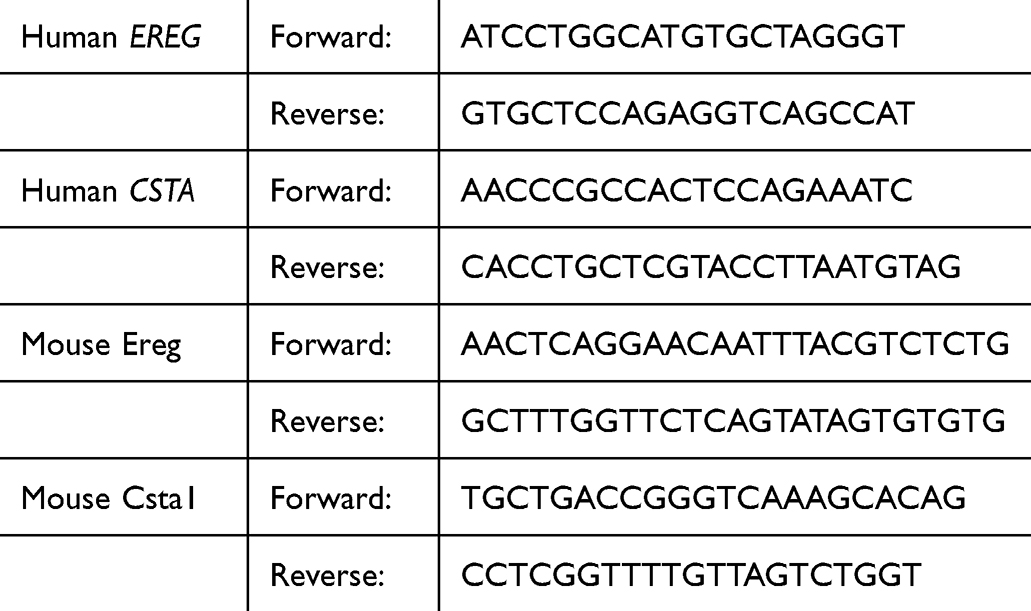 |
Table 2 Primer Sequences |
Statistical Analysis
Statistical analyses were conducted using GraphPad Prism 9 and R software. Data are presented as mean ± standard deviation (SD). Group comparisons were performed using Student’s t-test, one-way analysis of variance (ANOVA), or the Wilcoxon test. Benjamini-Hochberg correction was applied to control the false discovery rate (FDR). A two-sided adjusted P value < 0.05 was considered statistically significant. Confidence intervals (95%) were calculated where applicable.
Results
Flowchart of This Study
The flowchart of this study is shown in Figure 1. Differential expression analysis identified 30 MA-DEGs, and further screening identified 18 hub genes. Four machine learning algorithms identified EREG and CSTA as critical genes for DFU formation. A two-gene prognostic model was then established through regression analysis, and its predictive performance was validated. Subsequently, the association of these two key genes with immune cell infiltration and their co-expression with macrophage polarization-associated genes were analyzed. Finally, in vivo and in vitro experiments demonstrated that ADSCs treatment downregulated the expression of these genes, promoted M2 macrophage polarization, and facilitated DFU healing.
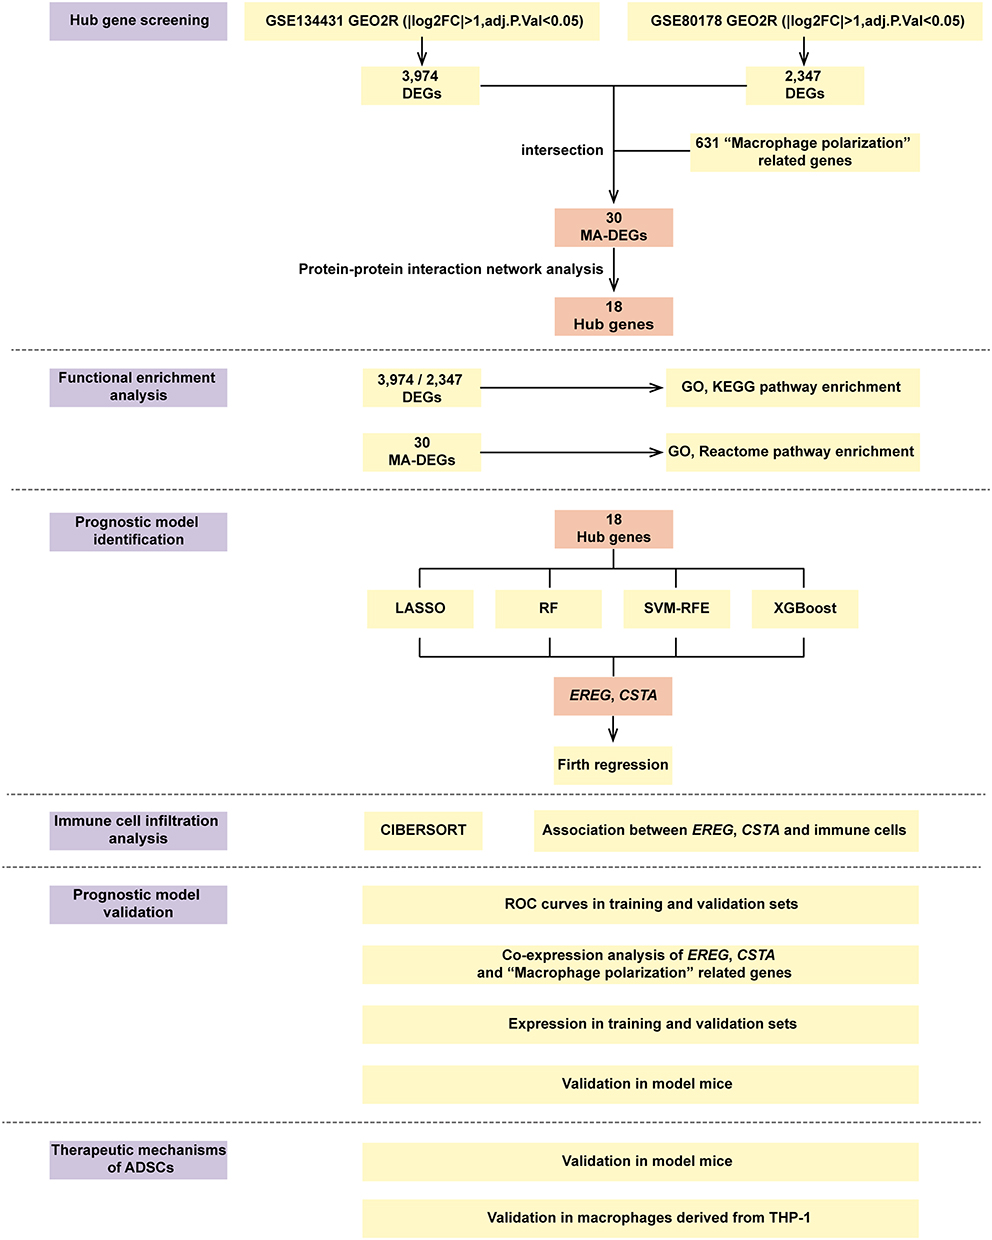 |
Figure 1 The flowchart of this study. Abbreviations: DEGs, Differentially Expressed Genes; MA-DEGs, Macrophage-Associated Differentially Expressed Genes; LASSO, Least Absolute Shrinkage and Selection Operator; RF, Random Forest; SVM-RFE, Support Vector Machine - Recursive Feature Elimination; XGBoost, eXtreme Gradient Boosting; ROC, Receiver Operating Curves; ADSCs, adipose-Derived Mesenchymal Stem Cells. |
Analysis of DEGs in the DFU Datasets
A total of 3,974 and 2,347 DEGs were identified in the DFU datasets GSE134431 (Figure 2A and B) and GSE80178 (Figure 2C and D), respectively. Enrichment analysis of GO and KEGG pathways for these DEGs revealed that in dataset GSE134431, the 3,974 DEGs were associated with pathways like skin barrier, keratinization, macrophage regulation pathways, and AGE-RAGE signaling in diabetic complications (Figure 2E and F). The 2,347 DEGs in GSE80178 were enriched in pathways such as keratinization, skin development, and AGE-RAGE in diabetic complications. (Supplementary Material, Figure S1A and S1B).
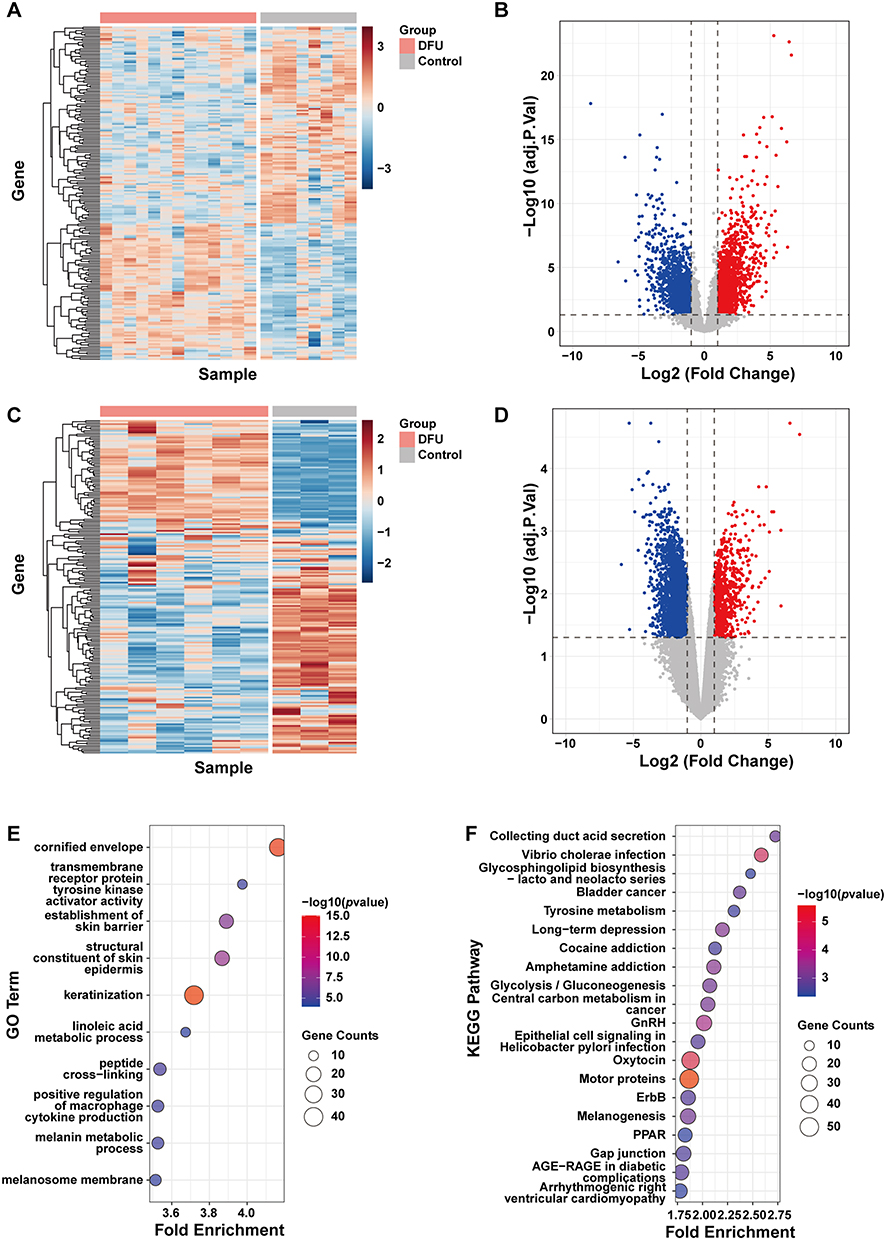 |
Figure 2 Analysis of DEGs in the DFU datasets. (A) Heatmap and (B) Volcano plot of DEGs in GSE134431. (C) Heatmap and (D) Volcano plot of DEGs in GSE80178. (E) Bubble plot of GO enrichment analysis for DEGs in GSE134431. (F) Bubble plot of KEGG pathway enrichment analysis for DEGs in GSE134431. Abbreviations: GO, Gene Ontology; KEGG, Kyoto Encyclopedia of Genes and Genomes. |
Identification of Hub Genes
By intersecting the DEGs from both datasets with 631 macrophage polarization-associated genes obtained from GeneCards, 30 MA-DEGs were identified (Figure 3A). The 30 MA-DEGs were input into the STRING website to construct a PPI network and subjected to GO (BP, MF, CC) and Reactome enrichment analyses. The results revealed significant enrichment in pathways such as leukocyte chemotaxis, RAGE receptor binding, and IL-4/IL-13 signaling (Figure 3B and C). The PPI network was visualized and modified in Cytoscape (Figure 3D). The intersection of the top 20 ranked genes from four methods (MNC, MCC, EPC, and Degree) yielded 18 hub genes (Figure 3E). The top-ranked gene lists obtained from each algorithm are provided in (Supplementary Material, Table S1). To validate these computational predictions, RT-qPCR was conducted for 14 selected MA-DEGs (including EREG and CSTA). The experimental results demonstrated high consistency with the bioinformatics findings: 12 out of 14 genes (85.7%) exhibited concordant expression trends, and 11 genes (78.6%) showed statistically significant differential expression (Supplementary Material, Figure S2).
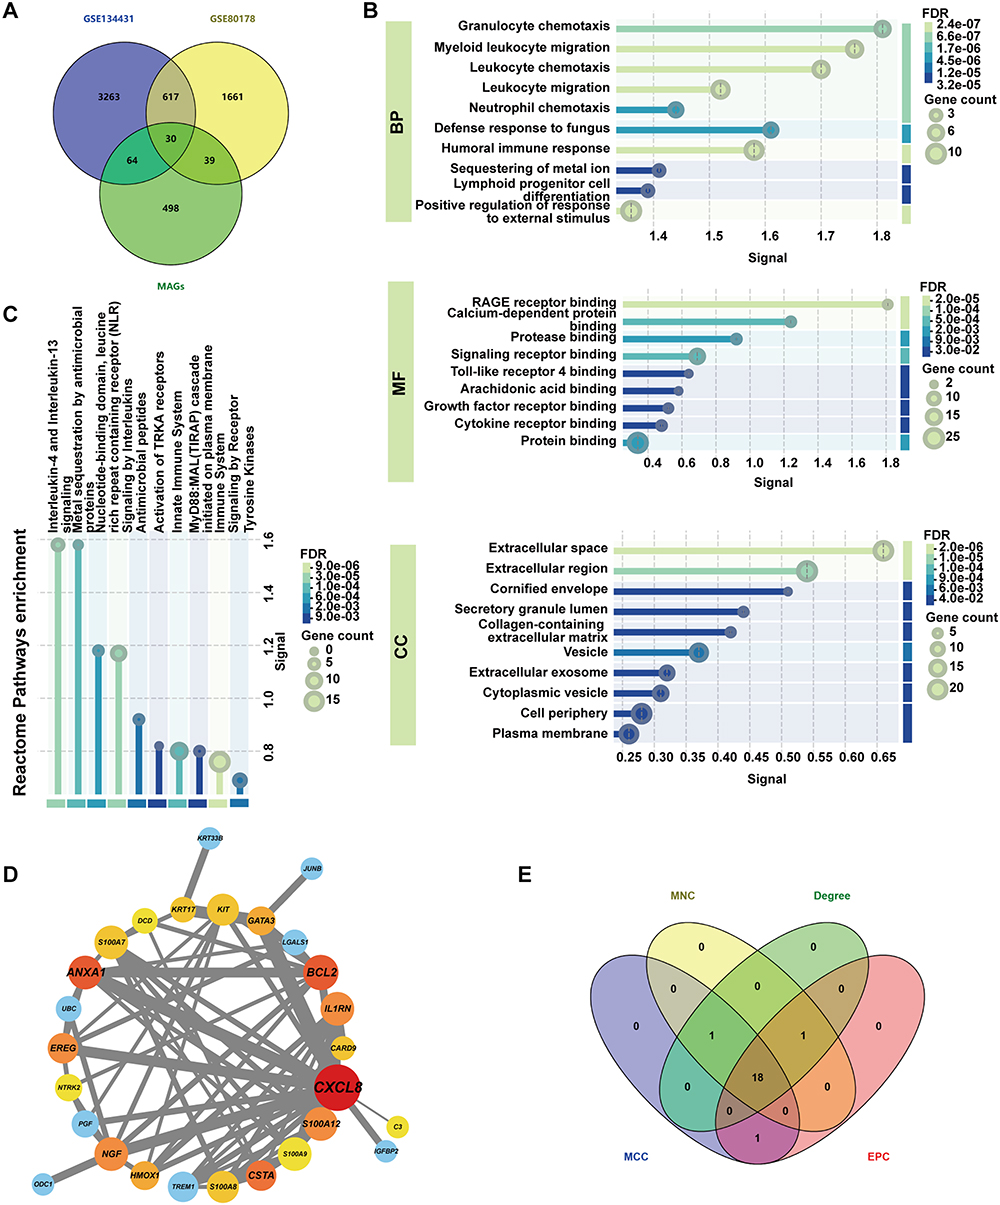 |
Figure 3 Screening of hub genes. (A) Venn diagram illustrating the intersection of DEGs and macrophage polarization-associated genes. (B) GO and (C) Reactome enrichment analysis of MA-DEGs. (D) PPI network diagram of MA-DEGs. (E) Venn diagram showing the intersection of the top 20 ranked genes from MNC, MCC, EPC, and Degree algorithms. Abbreviations: PPI, Protein-Protein Interaction; MNC, Maximum Neighborhood Component; MCC, Maximal Clique Centrality; EPC, Edge Percolated Component; BP, Biological Process; MF, Molecular Function; CC, Cellular Component. |
Variable Selection and Construction of the Prognostic Model
To identify key genes involved in the development and progression of DFU, datasets GSE134431 and GSE80178 were merged, followed by batch effect correction and normalization, forming the training dataset (Supplementary Material, Figure S3A and S3B). LASSO regression identified 9 key genes (Figure 4A–C). Random forest and XGBoost identified 7 and 3 key genes, respectively (Figure 4D and E), while SVM-RFE identified 5 key variables (Figure 4F–H). Importantly, EREG and CSTA were consistently identified across all four algorithms (Figure 4I). Subsequently, a two-gene DFU prognostic model was constructed using Firth regression. Risk score for DFU = (−35.443) + 2.614 × EREG + 0.629 × CSTA. This model demonstrated excellent predictive performance, achieving an area under the ROC curve (AUC) of > 0.99 in the training set (Figure 4J) and 0.944 in the independent validation set GSE143735 (Figure 4K). Additionally, both EREG and CSTA individually exhibited strong predictive value, with AUC values > 0.88 in both training and validation cohorts (Supplementary Material, Figure S3C–S3F).
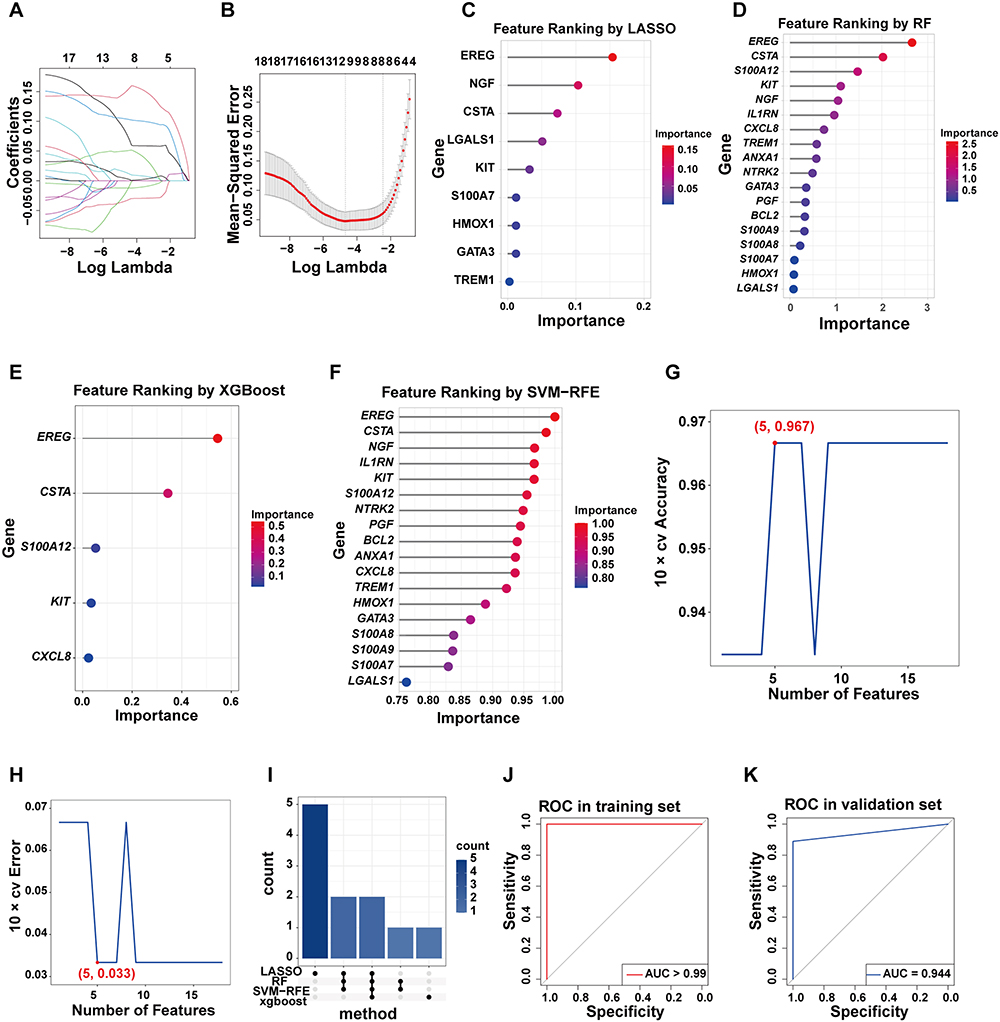 |
Figure 4 Machine learning and construction of the prognostic model. (A and B) Path plot and cross-validation results from LASSO regression. (C–F) Variable ranking plots from LASSO, RF and XGBoost and SVM-RFE. (G and H) Results of cross-validation accuracy and error from SVM-RFE. (I) Upset plot showing the intersection of genes identified by the four algorithms. (J and K) ROC curves validating the predictive performance of the model in the training and validation datasets. Abbreviation: AUC, Area Under the Curve. |
Correlation Analysis of EREG and CSTA with Immune Cell Infiltration
To explore the correlation between EREG and CSTA and immune cell infiltration, especially macrophage infiltration, an immune infiltration analysis was conducted. In the GSE134431 dataset, the DFU group showed a significant reduction in M2 macrophages compared to the control group (Figure 5A and B). In the GSE80178 dataset, the M2 macrophages in the DFU group were reduced compared to the control group, but this difference was not statistically significant (Supplementary Material, Figure S4A and S4B). To further validate the reduction of M2 macrophages in DFU, IHC staining was performed on wound tissues from normal and diabetic mice. The results showed a marked decrease in CD206⁺ M2 macrophages in the diabetic wound tissues relative to the controls (Figure 5C and D). Subsequent correlation analyses revealed that in the GSE134431 dataset, EREG and CSTA were significantly negatively correlated with M2 macrophage infiltration (Figure 5E and F). In the GSE80178 dataset, both EREG and CSTA showed a negative correlation with M2 macrophages, though it was not statistically significant. Notably, in this dataset, EREG and CSTA were positively correlated with M0 and M1 macrophages, respectively (Supplementary Material, Figure S4C and S4D). These results may reflect variations in disease stage among samples, with macrophages transitioning dynamically from M1 to M2 during DFU progression.
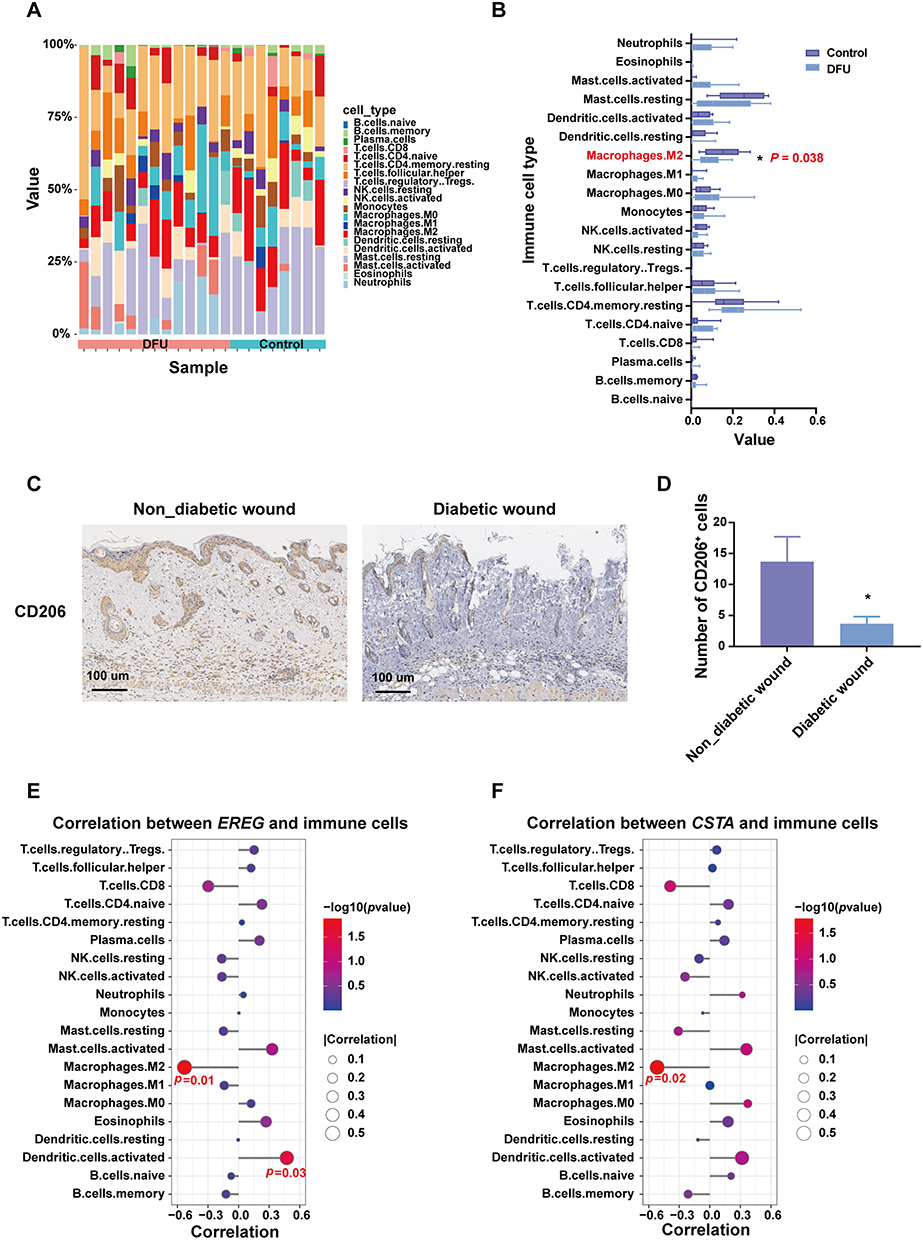 |
Figure 5 Immune infiltration analysis in dataset GSE134431. (A and B) The landscape of immune cell infiltrations in DFU and control groups. (C and D) Immunohistochemical Staining of M2 Macrophages (CD206+) in Normal and Diabetic Mouse Wound Tissues (E and F) Correlation between EREG or CSTA and immune cell infiltration. *P <0.05. |
Co-Expression Analysis of EREG and CSTA with Macrophage Polarization-Associated Genes
To explore the potential role of EREG and CSTA in macrophage polarization during DFU progression, a co-expression analysis was performed between these two genes and a panel of macrophage polarization-associated genes. The analysis revealed strong associations with multiple polarization markers. In both GSE134431 and GSE80178 datasets, EREG and CSTA showed a positive correlation with S100A12, a pro-inflammatory molecule known to promote M1 macrophage polarization (Figure 6A–D). Conversely, EREG was negatively correlated with CD163, a marker of M2 macrophages (Figure 6E and F), in both datasets. Full results of the co-expression analysis for dataset GSE134431 are presented in (Supplementary Material, Table S2), and those for GSE80178 are provided in (Supplementary Material, Table S3).
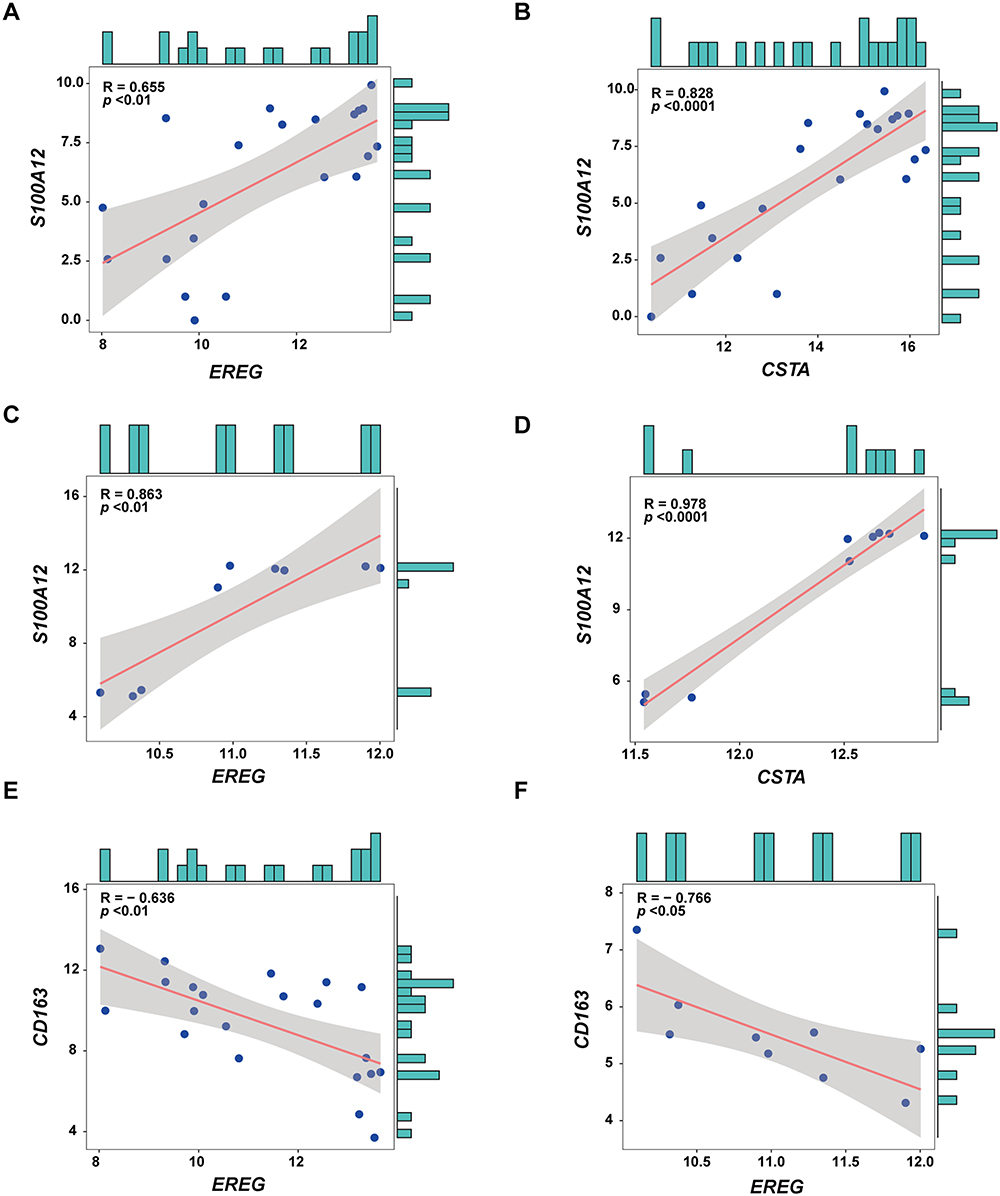 |
Figure 6 Co-expression Analysis of EREG and CSTA with macrophage polarization-associated genes. (A and B) Co-expression analysis of EREG and CSTA with the macrophage polarization-associated gene S100A12 in the dataset GSE134431. (C and D) Co-expression analysis of EREG and CSTA with the macrophage polarization-associated gene S100A12 in the dataset GSE80178. (E and F) Co-expression analysis of EREG with CD163 in datasets GSE134431 and GSE80178. |
EREG and CSTA Genes Were Upregulated in DFU
To investigate the involvement of EREG and CSTA in DFU, we analyzed their expression levels in patients from the GSE134431 and GSE80178 datasets. Both genes were found to be significantly upregulated in DFU samples compared to controls (Figure 7A–D).
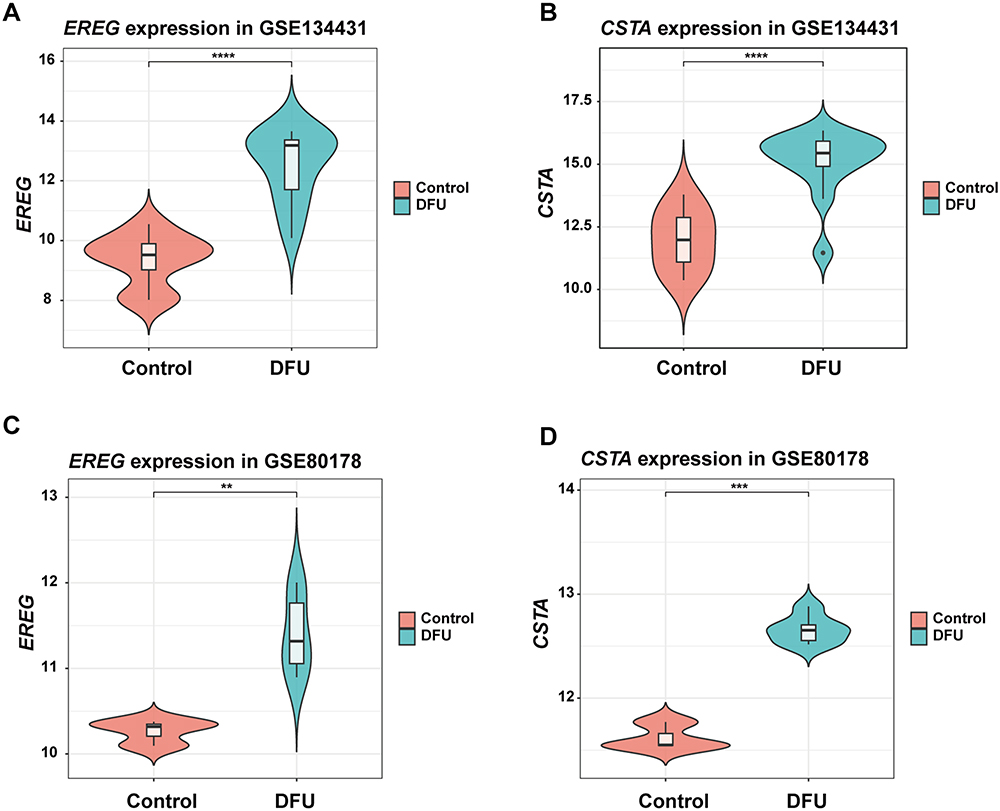 |
Figure 7 The Expression of EREG and CSTA in DFU Patients. (A and B) The Expression of EREG and CSTA in the GSE134431. (C and D) The Expression of EREG and CSTA in the GSE80178. **P <0.01, ***P <0.001, ****P <0.0001. |
To further examine whether ADSCs therapy could reverse this dysregulation, a streptozotocin-induced DFU mouse model was established and divided into three groups: control, model, and ADSCs treatment group. Consistent with human data, Ereg and Csta1 expression levels were elevated in the DFU group and were significantly reduced following ADSCs administration (Figure 8A). Functionally, wound healing was markedly impaired in the DFU model, as reflected by a lower closure rate on day 7. ADSCs treatment significantly improved wound healing (Figure 8B and C). HE staining showed that a large number of inflammatory cells infiltrated near the wound in DFU model mice, and the infiltration of inflammatory cells was significantly reduced after ADSCs treatment (Figure 8D and E). Masson’s trichrome staining and collagen I immunohistochemistry showed a significant reduction of collagen in the dermis of DFU model mice, which significantly increased after ADSCs treatment (Figure 8D–G). The viability and duration of ADSCs in mice were monitored using DID-labeled ADSCs. The results showed that the transplanted cells localized around the wound and remained viable for up to 28 days post-injection (Supplementary Material, Figure S5A and S5B).
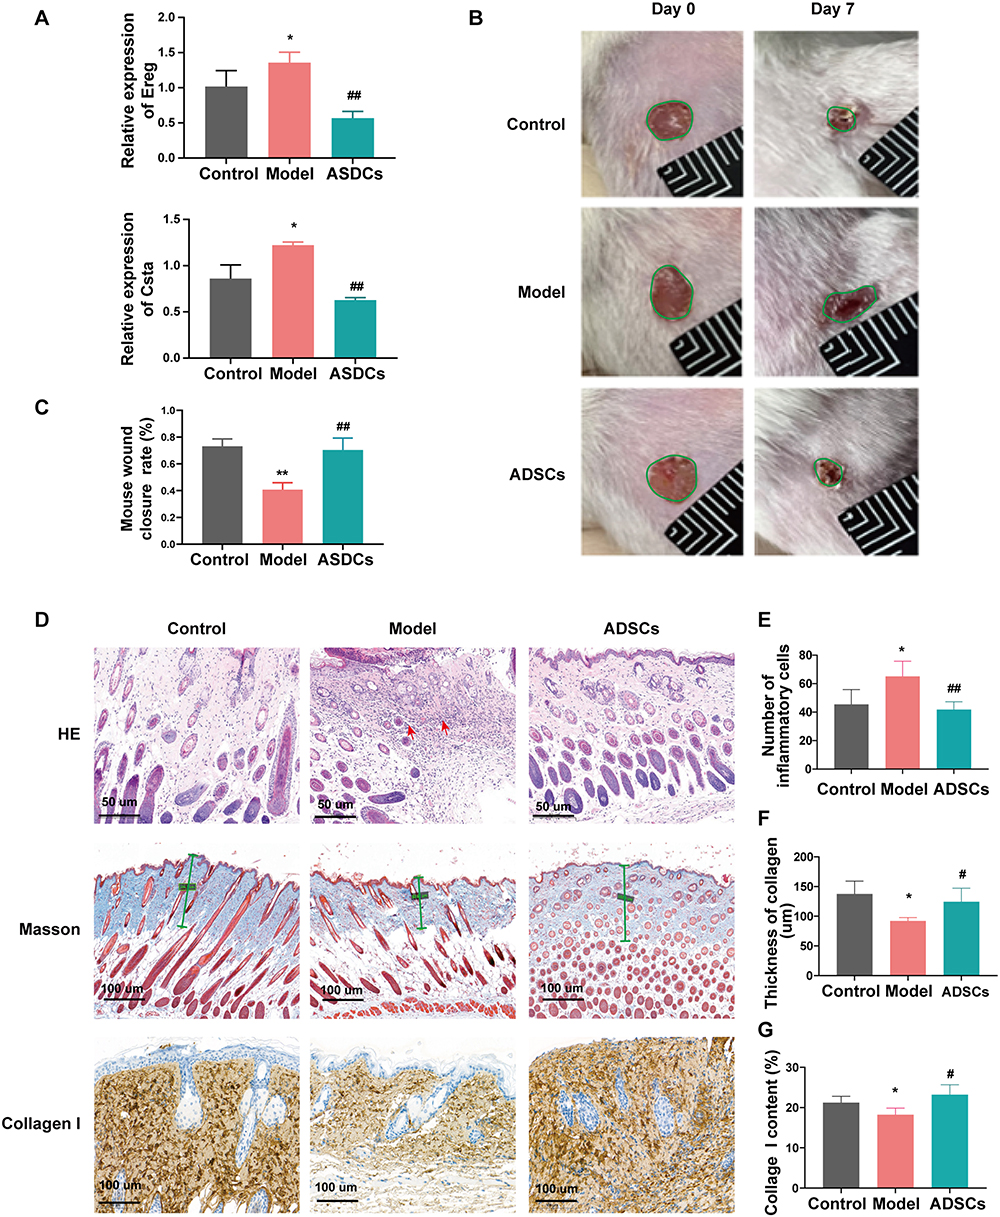 |
Figure 8 The Effect of ADSCs on Ereg and Csta1 expression in DFU Wound Healing. (A) RT-qPCR results showing the expression levels of Ereg and Csta1 in mice from different groups. (B and C) Macroscopic images and statistical results of wound healing in mice after ADSCs treatment. (D–G) Representative images and corresponding statistical results of HE staining, Masson’s trichrome staining, and collagen I immunohistochemical staining in skin tissues of mice from different groups. Control: healthy mice without diabetes; Model: DFU mouse model without ADSCs treatment. *P <0.05, **P <0.01 vs Control; #P <0.05, ##P <0.01 vs Model. |
ADSCs Promote M2 Macrophage Polarization by Downregulating EREG and CSTA Under AGE Conditions
The pathophysiology of DFU involves the accumulation of AGEs, which are key mediators of chronic inflammation. To verify whether ADSCs can regulate macrophage polarization through modulation of EREG and CSTA under AGE conditions. The effect of ADSCs on the expression of EREG and CSTA and their impact on macrophage polarization were observed in transwell co-culture experiments under AGE stimulation (200 μg/mL). After ADSCs treatment, the expression of EREG and CSTA in M2 macrophages was significantly reduced (Figure 9A). Flow cytometry analysis showed that ADSCs inhibited M1 polarization (14%) and promoted M2 polarization (181%) of macrophages (Figure 9B). To further validate the regulatory effects of ADSCs on macrophage polarization, we detected M1 and M2 markers of macrophages via RT-qPCR and found that ADSCs significantly inhibited the expression of M1 markers while promoting the expression of M2 markers in macrophages (Figure 9C). These findings preliminarily demonstrate that ADSCs can promote macrophage polarization toward M2 by downregulating the expression of EREG and CSTA.
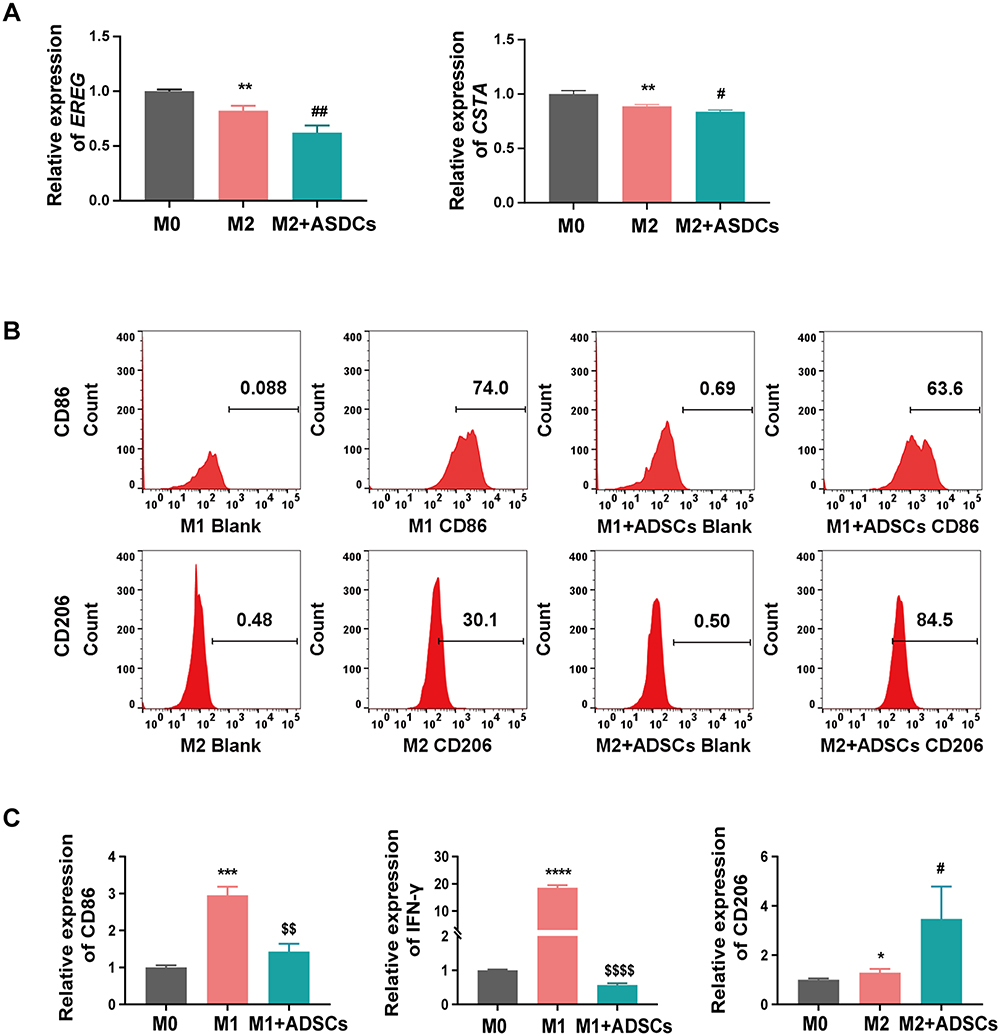 |
Figure 9 The Effect of ADSCs on EREG and CSTA expression and Macrophage polarization under AGE conditions. (A) The expression of EREG and CSTA in M2 macrophages before and after co-culture with ADSCs. (B) The regulation of ADSCs on macrophage polarization. (C) RT-qPCR analysis of M1 and M2 Markers in macrophages. *P < 0.05, **P < 0.01, ***P < 0.001, ****P < 0.0001 vs M0; $$ P < 0.01, $$$$ P < 0.0001 vs M1; #P < 0.05, ##P < 0.01 vs M2. |
Discussion
DFU continues to pose a substantial clinical challenge. The limited options for diagnosis and treatment lead to a high amputation risk and significant patient suffering.52 Developing a robust prognostic model for DFU holds promise for improving early detection and timely intervention, yet this field is still underexplored. Compared to conventional indicators such as hemoglobin A1c or wound area measurements, our identified two-gene signature (EREG and CSTA) provides a molecular-level prognostic tool, aligning with the emerging trends in precision medicine for chronic wounds.19 Conventional therapies often fail to address the dysregulated macrophage polarization and persistent inflammation of DFU. Thus, novel biomarkers and targeted interventions are required.
Dysfunctional macrophage polarization, particularly the imbalance between M1 and M2 phenotypes, has been recognized as a key factor in the pathogenesis of DFU.15,53 Consistent with this concept, our study identifies EREG and CSTA as novel molecular drivers of M1 polarization, thereby expanding the current understanding of immune dysregulation in chronic wounds. A recent investigation demonstrated that MSCs modulate macrophage phenotypes by suppressing M1-associated pro-inflammatory markers, such as TNF-α and IL-6, and enhancing M2 anti-inflammatory activity.18 The immunomodulatory effects of ADSCs observed in our study reflect this paradigm. This indicates a conserved immunoregulatory mechanism across MSC subtypes. In particular, the modulation of inflammatory gene expression appears to play a pivotal role in alleviating chronic inflammation and promoting wound healing.
Although histone methyltransferase MLL1 has been implicated in macrophage-mediated inflammation in diabetes,54 our study expands the mechanistic landscape by pinpointing downstream effector genes directly linked to macrophage phenotype transition. Unlike previous research that focused on epigenetic modifiers, our data emphasize post-translational and cytokine-driven pathways. Specifically, EREG promotes M1 polarization through Toll-like receptor (TLR) mediated augmentation of pro-inflammatory cytokine production.55 In the context of skin inflammation, EREG in macrophages enhances TLR-mediated inflammatory responses, leading to increased production of IL-6 and TNF-α.56 Another study has shown that EREG plays a key regulatory role in the production of pro-inflammatory cytokines induced by peptidoglycan in antigen-presenting cells, especially macrophages and dendritic cells.57 CSTA, a cysteine protease inhibitor from the cystatin superfamily, likely disrupts extracellular matrix remodeling through protease inhibition. It is crucial for skin homeostasis and immune system function. Loss-of-function mutations in the CSTA gene are a genetic cause of exfoliative skin syndrome.58 This protein plays a key role in intercellular adhesion between basal and upper basal keratinocytes.59 By inhibiting protease activity, CSTA may disrupt extracellular matrix remodeling and cell adhesion, thereby exacerbating the inflammatory microenvironment. These mechanisms converge to reinforce a pro-inflammatory state, impeding the transition from the inflammatory to the proliferative phase of healing. Collectively, these mechanisms sustain a pro-inflammatory environment that delays the shift from inflammation to proliferation during wound healing.60
Placing our findings in a broader biological context, macrophages support myofibroblast proliferation and heterogeneity during tissue repair.61 Despite these advances in understanding the complex interplay between immune cell dysregulation and DFU pathogenesis, the precise molecular circuitry governing macrophage polarization, including the upstream regulators of EREG and CSTA expression, remains to be fully elucidated. Our study has identified these critical nodes in this pathway, providing a foundation for targeted interventions.
In this study, we conducted a comprehensive analysis of MA-DEGs from two DFU-associated GEO datasets, GSE134431 and GSE80178. GO and Reactome pathway analysis revealed that these MA-DEGs were significantly enriched in leukocyte chemotaxis, IL-4/ IL-13 signaling pathways, and AGE-RAGE pathways. Using various topological algorithms in Cytoscape’s CytoHubba plugin, we identified 18 hub genes among the MA-DEGs. Further screening with four distinct machine learning algorithms narrowed down the candidate genes to EREG and CSTA. These were identified as key biomarkers in the development of DFU. Subsequently, a two-gene signature was established.
To evaluate the predictive capacity of this two-gene model, we used the two aforementioned GEO datasets as the training set and an independent dataset, GSE143735, for validation. The model exhibited a high predictive accuracy (AUC > 0.94) in both the training and validation datasets. Additionally, our analysis of immune cell infiltration in DFU patients revealed a negative correlation between EREG and CSTA expression and M2 macrophage infiltration. Co-expression analysis further showed that both genes were positively correlated with several M1 macrophage polarization-associated genes, such as members of the S100A family. They were negatively correlated with the M2 macrophage marker CD163. This suggests that EREG and CSTA may influence macrophage polarization towards the pro-inflammatory M1 phenotype, potentially exacerbating DFU progression.
In recent years, ADSCs have attracted a great deal of attention due to their potent anti-inflammatory, immune-regulatory, angiogenic, and tissue-repairing properties.62–64 The therapeutic potential of ADSCs in DFU healing is well-documented. Studies have demonstrated that ADSCs accelerate wound healing by promoting angiogenesis and suppressing inflammation.65–67 A study suggests that IL-10-enriched ADSCs enhance diabetic wound healing by modulating macrophage polarization.68 Research on MSCs in promoting DFU wound healing has increasingly focused on underlying molecular mechanisms and associated signaling pathways. For instance, ADSC-derived products have been shown to promote wound healing in diabetic mice through SIRT1-mediated autophagy.69 Liu et al demonstrated that melatonin-stimulated bone marrow MSCs significantly accelerated diabetic wound healing by targeting the PTEN/Akt signaling pathway.70
This study aims to further investigate the critical mechanisms through which ADSCs regulate macrophage polarization and contribute to DFU wound healing. The goal is to identify novel prognostic and therapeutic targets for clinical application. We confirmed the high expression of EREG and CSTA in DFU patients, DFU mouse models, and in vitro cell experiments. This is consistent with the bioinformatics analysis results. We explored the beneficial effects of ADSCs treatment on DFU wound healing in the DFU mouse model. We also investigated its inhibitory impact on the expression of these two genes. Additional in vitro experiments confirmed that ADSCs promote M2 macrophage polarization and inhibit the expression of these genes in cells. The therapeutic potential of ADSCs in DFU is reinforced by their ability to downregulate EREG/CSTA and promote M2 polarization. This mechanism connects the known anti-inflammatory effects of ADSCs in promoting wound healing with specific gene expression changes in macrophages.
However, several limitations of this study warrant further investigation. First, the clinical data used in this study are from public databases. The available clinical information for the samples is incomplete. Despite batch effect correction and data normalization, differences in sample collection standards across datasets may still impact the analysis results. Second, although the expression levels of EREG and CSTA have been validated across multiple dimensions, including patient samples, mouse models, and in vitro cells, the predictive power of the model has only been validated in a single external dataset. This requires further validation and optimization in more patient samples. Third, while Firth regression effectively addressed small-sample bias in our cohort, its conservative nature may have underestimated the effect sizes of strong predictors. Future studies with larger sample sizes are needed to validate the prognostic model. Lastly, further investigation is needed to elucidate the specific molecular mechanisms through which these two genes regulate macrophage polarization and DFU wound healing. Additional functional studies, such as knockdown or overexpression experiments, should be included in future research. These studies will provide essential preclinical evidence for exploring EREG and CSTA as potential therapeutic targets for DFU.
Conclusion
Our study identified EREG and CSTA involved in the development of DFU and constructed a two-gene prognostic model for DFU. The model’s predictive ability was validated in both the training and validation sets. Additionally, the correlation between these two key genes and macrophage infiltration and polarization was confirmed. Preliminary evidence suggests that ADSCs regulate macrophage polarization and promote wound healing by modulating the expression of these two genes. The findings of this study provide valuable insights into predicting the occurrence and progression of DFU, and with further validation, these two genes may serve as potential clinical treatment targets for DFU.
Abbreviations
DFU, diabetic foot ulcer; ADSCs, adipose-derived mesenchymal stem cells; MSCs, mesenchymal stem cells; MA-DEGs, macrophage polarization-associated differentially expressed genes; AGEs, advanced glycation end products; PPI, Protein-protein interaction network; ROC, receiver operating characteristic curve; LASSO, Least Absolute Shrinkage and Selection Operator; RF, random forest; SVM-RFE, Support Vector Machine Recursive Feature Elimination; XGBoost, eXtreme Gradient Boosting; STZ, streptozotocin.
Data Sharing Statement
All data supporting this article are included in the main text and/or Supplementary Materials. The gene expression datasets involved in this article are publicly available in the NCBI GEO database (accession numbers: GSE134431, GSE80178, and GSE143735). For additional data requests, please contact the corresponding author, Yuemei Yang [email protected]
Ethics Approval
This study complies with the Declaration of Helsinki and was approved by the Ethics Committee at Peking Union Medical College Hospital (Approval number: I-25ZM0035).
Ethical approval for the mouse experiments was granted by the Ethics Committee of the Chinese Academy of Medical Sciences (Approval number: 00009780). All animal experiments were conducted in strict accordance with the guidelines outlined in the National Institutes of Health Guide for the Care and Use of Laboratory Animals.
Funding
This work was supported by National High Level Hospital Clinical Research Funding (Grant No. 2025-PUMCH-D-001).
Disclosure
All authors declare no conflicts of interest in this work.
References
1. Armstrong DG, Boulton AJM, Bus SA. Diabetic foot ulcers and their recurrence. N Engl J Med. 2017;376(24):2367–2375. doi:10.1056/NEJMra1615439
2. Lin C, Liu J, Sun H. Risk factors for lower extremity amputation in patients with diabetic foot ulcers: a meta-analysis. PLoS One. 2020;15(9):e0239236. doi:10.1371/journal.pone.0239236
3. McDermott K, Fang M, Boulton AJM, Selvin E, Hicks CW. Etiology, epidemiology, and disparities in the burden of diabetic foot ulcers. Diabetes Care. 2023;46(1):209–221. doi:10.2337/dci22-0043
4. Boulton AJM, Vileikyte L, Ragnarson-Tennvall G, Apelqvist J. The global burden of diabetic foot disease. Lancet. 2005;366(9498):1719–1724. doi:10.1016/S0140-6736(05)67698-2
5. Armstrong DG, Swerdlow MA, Armstrong AA, Conte MS, Padula WV, Bus SA. Five year mortality and direct costs of care for people with diabetic foot complications are comparable to cancer. J Foot Ankle Res. 2020;13(1):16. doi:10.1186/s13047-020-00383-2
6. Brem H, Tomic-Canic M. Cellular and molecular basis of wound healing in diabetes. J Clin Invest. 2007;117(5):1219–1222.
7. Monaghan MG, Borah R, Thomsen C, Browne S. Thou shall not heal: overcoming the non-healing behaviour of diabetic foot ulcers by engineering the inflammatory microenvironment. Adv Drug Delivery Rev. 2023;203:115120.
8. Harding KG, Morris HL, Patel GK. Science, medicine and the future: healing chronic wounds. BMJ. 2002;324(7330):160–163. doi:10.1136/bmj.324.7330.160
9. Chanput W, Mes JJ, Savelkoul HF, Wichers HJ. Characterization of polarized THP-1 macrophages and polarizing ability of LPS and food compounds. Food Funct. 2013;4(2):266–276.
10. Martinez FO, Sica A, Mantovani A, Locati M. Macrophage activation and polarization. Front Bioscience. 2008;13:453–461. doi:10.2741/2692
11. Zhang X, Mosser DM. Macrophage activation by endogenous danger signals. J Pathol. 2008;214(2):161–178. doi:10.1002/path.2284
12. Martinez FO, Helming L, Gordon S. Alternative activation of macrophages: an immunologic functional perspective. Ann Rev Immunol. 2009;27:451–483. doi:10.1146/annurev.immunol.021908.132532
13. Falanga V. Wound healing and its impairment in the diabetic foot. Lancet. 2005;366(9498):1736–1743. doi:10.1016/S0140-6736(05)67700-8
14. Mirza R, Koh TJ. Dysregulation of monocyte/macrophage phenotype in wounds of diabetic mice. Cytokine. 2011;56(2):256–264. doi:10.1016/j.cyto.2011.06.016
15. Boniakowski AE, Kimball AS, Jacobs BN, Kunkel SL, Gallagher KA. Macrophage-mediated inflammation in normal and diabetic wound healing. J Immunol. 2017;199(1):17–24. doi:10.4049/jimmunol.1700223
16. Zhu P, Chen C, Wu D, Chen G, Tan R, Ran J. AGEs-induced MMP-9 activation mediated by Notch1 signaling is involved in impaired wound healing in diabetic rats. Diabetes Res Clin Pract. 2022;186:109831. doi:10.1016/j.diabres.2022.109831
17. Sn D, Nr D, Guru B, Mohapatra PC. Towards reaching the target: clinical application of mesenchymal stem cells for diabetic foot ulcers. Rejuvenation Res. 2014;17(1):40–53. doi:10.1089/rej.2013.1467
18. Prakashan D, Sahoo J, Gandhi S. Nanomaterial-based wound therapy: recent advances and future perspectives. In: Javed R, Chen J-T, Khalil AT, editors. Nanomaterials for Biomedical and Bioengineering Applications. Singapore: Springer Nature Singapore; 2024:221–247.
19. Prakashan D, Roberts A, Gandhi S. Recent advancement of nanotherapeutics in accelerating chronic wound healing process for surgical wounds and diabetic ulcers. Biotechnol Genet Eng Rev. 2023;39(2):1059–1087. doi:10.1080/02648725.2023.2167432
20. Gimble JM, Katz AJ, Bunnell BA. Adipose-derived stem cells for regenerative medicine. Circulation Res. 2007;100(9):1249–1260. doi:10.1161/01.RES.0000265074.83288.09
21. Bunnell BA, Flaat M, Gagliardi C, Patel B, Ripoll C. Adipose-derived stem cells: isolation, expansion and differentiation. Methods. 2008;45(2):115–120. doi:10.1016/j.ymeth.2008.03.006
22. Crop MJ, Baan CC, Korevaar SS, et al. Inflammatory conditions affect gene expression and function of human adipose tissue-derived mesenchymal stem cells. Clin Exp Immunol. 2010;162(3):474–486. doi:10.1111/j.1365-2249.2010.04256.x
23. Cao Y, Yan J, Dong Z, et al. Adipose-derived mesenchymal stem cells are ideal for the cell-based treatment of refractory wounds: strong potential for angiogenesis. Stem Cell Rev Rep. 2023;20(1):313–328. doi:10.1007/s12015-023-10641-y
24. Al-Ghadban S, Artiles M, Bunnell BA. Adipose stem cells in regenerative medicine: looking forward. Front Bioeng Biotechnol. 2021;9:837464. doi:10.3389/fbioe.2021.837464
25. Eming SA, Martin P, Tomic-Canic M. Wound repair and regeneration: mechanisms, signaling, and translation. Sci, trans med. 2014;6(265):265sr266. doi:10.1126/scitranslmed.3009337
26. Li W, Ren G, Huang Y, et al. Mesenchymal stem cells: a double-edged sword in regulating immune responses. Cell Death Differ. 2012;19(9):1505–1513. doi:10.1038/cdd.2012.26
27. Shi H, Yuan X, Liu G, Fan W. Identifying and validating GSTM5 as an immunogenic gene in diabetic foot ulcer using bioinformatics and machine learning. J Inflamm Res. 2023;16:6241–6256. doi:10.2147/JIR.S442388
28. McCarthy DJ, Smyth GK. Testing significance relative to a fold-change threshold is a TREAT. Bioinformatics. 2009;25(6):765–771. doi:10.1093/bioinformatics/btp053
29. Yu G, Wang LG, Han Y, He, He Q-Y. clusterProfiler: an R package for comparing biological themes among gene clusters. Omics. 2012;16(5):284–287. doi:10.1089/omi.2011.0118
30. Gentleman RC, Carey VJ, Bates DM, et al. Bioconductor: open software development for computational biology and bioinformatics. Genome Biol. 2004;5(10):R80. doi:10.1186/gb-2004-5-10-r80
31. Ashburner M, Ball CA, Blake JA, et al. Gene ontology: tool for the unification of biology. Gene Ontology Consortium Nature Genetics. 2000;25(1):25–29. doi:10.1038/75556
32. Kanehisa M, Goto S. KEGG: kyoto encyclopedia of genes and genomes. Nucleic Acids Res. 2000;28(1):27–30. doi:10.1093/nar/28.1.27
33. Szklarczyk D, Gable AL, Lyon D, et al. STRING v11: protein-protein association networks with increased coverage, supporting functional discovery in genome-wide experimental datasets. Nucleic Acids Res. 2019;47(D1):D607–d613. doi:10.1093/nar/gky1131
34. Shannon P, Markiel A, Ozier O, et al. Cytoscape: a software environment for integrated models of biomolecular interaction networks. Genome Res. 2003;13(11):2498–2504. doi:10.1101/gr.1239303
35. Tibshirani R. Regression shrinkage and selection via the lasso. J Royal Statistical Society Series B. 1996;58(1):267–288. doi:10.1111/j.2517-6161.1996.tb02080.x
36. Breiman L. Random Forests. Machine Learning. 2001;45(1):5–32. doi:10.1023/A:1010933404324
37. Guyon I, Weston J, Barnhill S, VJMl V. Gene selection for cancer classification using support vector machines. Machine learning. 2002;46:389–422.
38. Chen T, Guestrin C. Xgboost: a scalable tree boosting system.
39. Puhr R, Heinze G, Nold M, Lusa L, Geroldinger A. Firth’s logistic regression with rare events: accurate effect estimates and predictions? Stat Med. 2017;36(14):2302–2317. doi:10.1002/sim.7273
40. Dhopte A, Bamal R, Tiwari VK. A prospective analysis of risk factors for pediatric burn mortality at a tertiary burn center in North India. Burns Trauma. 2017;5:30. doi:10.1186/s41038-017-0095-7
41. Obuchowski NA, Bullen JA. Receiver operating characteristic (ROC) curves: review of methods with applications in diagnostic medicine. Phys Med Biol. 2018;63(7):07tr01. doi:10.1088/1361-6560/aab4b1
42. Friedman J, Hastie T, Tibshirani R. Regularization paths for generalized linear models via coordinate descent. J Statistical Software. 2010;33(1):1–22. doi:10.18637/jss.v033.i01
43. Liaw A, Wiener M. Classification and Regression by randomForest. R news. 2;(3):18–2
44. Meyer D, Dimitriadou E, Hornik K, et al. e1071: misc functions of the department of statistics, probability theory group (formerly: E1071. TU Wien. 2019;1(2).
45. Heinze G, Ploner M, Dunkler D, HJRpv S. Firth’s bias reduced logistic regression. R package version. 2013;1:33.
46. Robin X, Turck N, Hainard A, et al. pROC: an open-source package for R and S+ to analyze and compare ROC curves. BMC Bioinf. 2011;12:77. doi:10.1186/1471-2105-12-77
47. Newman AM, Liu CL, Green MR, et al. Robust enumeration of cell subsets from tissue expression profiles. Nature Methods. 2015;12(5):453–457. doi:10.1038/nmeth.3337
48. Newman AM, Steen CB, Liu CL, et al. Determining cell type abundance and expression from bulk tissues with digital cytometry. Nature Biotechnol. 2019;37(7):773–782. doi:10.1038/s41587-019-0114-2
49. Machado LMQ, Serra DS, Neves TG, et al. Pulmonary impairment in type 2 diabetic rats and its improvement by exercise. Acta Physiol. 2022;234(1):e13708. doi:10.1111/apha.13708
50. Liu W, Yuan Y, Liu D. Extracellular vesicles from adipose-derived stem cells promote diabetic wound healing via the pi3k-akt-mtor-hif-1α signaling pathway. Tissue Eng Regen Med. 2021;18(6):1035–1044. doi:10.1007/s13770-021-00383-8
51. Vandesompele J, De Preter K, Pattyn F, et al. Accurate normalization of real-time quantitative RT-PCR data by geometric averaging of multiple internal control genes. Genome Biol. 2002;3(7):Research0034. doi:10.1186/gb-2002-3-7-research0034
52. Wang M, Cao X, Shang Y, et al. Correlational analysis of PLIN1 with inflammation in diabetic foot ulcer wounds. Diabetes Res Clin Pract. 2024;209:111605. doi:10.1016/j.diabres.2024.111605
53. Sindrilaru A, Peters T, Wieschalka S, et al. An unrestrained proinflammatory M1 macrophage population induced by iron impairs wound healing in humans and mice. J Clin Invest. 2011;121(3):985–997. doi:10.1172/JCI44490
54. Kimball AS, Joshi A, WFt C, et al. The histone methyltransferase MLL1 directs macrophage-mediated inflammation in wound healing and is altered in a murine model of obesity and type 2 diabetes. Diabetes. 2017;66(9):2459–2471. doi:10.2337/db17-0194
55. Riese DJ 2nd, Cullum RL. Epiregulin: roles in normal physiology and cancer. Semin Cell Dev Biol. 2014;28:49–56. doi:10.1016/j.semcdb.2014.03.005
56. Shirasawa S, Sugiyama S, Baba I, et al. Dermatitis due to epiregulin deficiency and a critical role of epiregulin in immune-related responses of keratinocyte and macrophage. Proc Natl Acad Sci U S A. 2004;101(38):13921–13926. doi:10.1073/pnas.0404217101
57. Sugiyama S, Nakabayashi K, Baba I, Sasazuki T, Shirasawa S. Role of epiregulin in peptidoglycan-induced proinflammatory cytokine production by antigen presenting cells. Biochem Biophys Res Commun. 2005;337(1):271–274. doi:10.1016/j.bbrc.2005.09.050
58. Zeeuwen PL, Van vlijmen-willems IM, Jansen BJ, et al. Cystatin M/E expression is restricted to differentiated epidermal keratinocytes and sweat glands: a new skin-specific proteinase inhibitor that is a target for cross-linking by transglutaminase. J Investigative Dermatol. 2001;116(5):693–701. doi:10.1046/j.1523-1747.2001.01309.x
59. Blaydon DC, Nitoiu D, Eckl KM, et al. Mutations in CSTA, encoding Cystatin A, underlie exfoliative ichthyosis and reveal a role for this protease inhibitor in cell-cell adhesion. Am J Hum Genet. 2011;89(4):564–571. doi:10.1016/j.ajhg.2011.09.001
60. Prakashan D, Singh A, Deshpande AD, Chandra V, Sharma GT, Gandhi S. Bone marrow derived mesenchymal stem cells enriched PCL-gelatin nanofiber scaffold for improved wound healing. Int J Biol Macromol. 2024;274(Pt 2):133447. doi:10.1016/j.ijbiomac.2024.133447
61. Shook BA, Wasko RR, Rivera-Gonzalez GC, et al. Myofibroblast proliferation and heterogeneity are supported by macrophages during skin repair. Science. 2018;362(6417). doi:10.1126/science.aar2971.
62. Qin Y, Ge G, Yang P, et al. An update on adipose-derived stem cells for regenerative medicine: where challenge meets opportunity. Adv. Sci. 2023;10(20):e2207334.
63. Maumus M, Manferdini C, Toupet K, et al. Adipose mesenchymal stem cells protect chondrocytes from degeneration associated with osteoarthritis. Stem Cell Res. 2013;11(2):834–844. doi:10.1016/j.scr.2013.05.008
64. Rehman J, Traktuev D, Li J, et al. Secretion of angiogenic and antiapoptotic factors by human adipose stromal cells. Circulation. 2004;109(10):1292–1298. doi:10.1161/01.CIR.0000121425.42966.F1
65. Kuo YR, Wang CT, Cheng JT, Kao GS, Chiang YC, Wang CJ. Adipose-derived stem cells accelerate diabetic wound healing through the induction of autocrine and paracrine effects. Cell Transplant. 2016;25(1):71–81. doi:10.3727/096368915X687921
66. Irons RF, Cahill KW, Rattigan DA, et al. Acceleration of diabetic wound healing with adipose-derived stem cells, endothelial-differentiated stem cells, and topical conditioned medium therapy in a swine model. J Vasc Surg. 2018;68(6s):115s–125s. doi:10.1016/j.jvs.2018.01.065
67. Chen L, Zheng Q, Liu Y, et al. Adipose-derived stem cells promote diabetic wound healing via the recruitment and differentiation of endothelial progenitor cells into endothelial cells mediated by the VEGF-PLCγ-ERK pathway. Arch Biochem Biophys. 2020;692:108531. doi:10.1016/j.abb.2020.108531
68. Zhang Y, Wang W, Chen L, et al. Human adipose-derived multipotent stromal cells enriched with IL-10 modRNA improve diabetic wound healing: trigger the macrophage phenotype shift. Bioeng Transl Med. 2025;10(1):e10711.
69. Shi R, Jin Y, Hu W, et al. Exosomes derived from mmu_circ_0000250-modified adipose-derived mesenchymal stem cells promote wound healing in diabetic mice by inducing miR-128-3p/SIRT1-mediated autophagy. Am J Physiol Cell Physiol. 2020;318(5):C848–c856. doi:10.1152/ajpcell.00041.2020
70. Liu W, Yu M, Xie D, et al. Melatonin-stimulated MSC-derived exosomes improve diabetic wound healing through regulating macrophage M1 and M2 polarization by targeting the PTEN/AKT pathway. Stem Cell Res Ther. 2020;11(1):259.
 © 2025 The Author(s). This work is published and licensed by Dove Medical Press Limited. The
full terms of this license are available at https://www.dovepress.com/terms.php
and incorporate the Creative Commons Attribution
- Non Commercial (unported, 4.0) License.
By accessing the work you hereby accept the Terms. Non-commercial uses of the work are permitted
without any further permission from Dove Medical Press Limited, provided the work is properly
attributed. For permission for commercial use of this work, please see paragraphs 4.2 and 5 of our Terms.
© 2025 The Author(s). This work is published and licensed by Dove Medical Press Limited. The
full terms of this license are available at https://www.dovepress.com/terms.php
and incorporate the Creative Commons Attribution
- Non Commercial (unported, 4.0) License.
By accessing the work you hereby accept the Terms. Non-commercial uses of the work are permitted
without any further permission from Dove Medical Press Limited, provided the work is properly
attributed. For permission for commercial use of this work, please see paragraphs 4.2 and 5 of our Terms.