")
Back to Journals » Neuropsychiatric Disease and Treatment » Volume 21
Alterations of Blood Plasma Metabolites, Including Kynurenine and Tryptophan, in Bipolar Disorder
Authors Nakayama T , Umehara H, Mawatari K , Tomioka Y, Yoshida T, Matsuda H, Matsumoto Y, Masuda R, Kamishikiryo T, Fuchikami M, Nakataki M, Takahashi A, Tajima A , Okada G, Numata S
Received 28 November 2024
Accepted for publication 9 May 2025
Published 18 May 2025 Volume 2025:21 Pages 1067—1073
DOI https://doi.org/10.2147/NDT.S508021
Checked for plagiarism Yes
Review by Single anonymous peer review
Peer reviewer comments 2
Editor who approved publication: Dr Roger Pinder
Tomohiko Nakayama,1 Hidehiro Umehara,1 Kazuaki Mawatari,2 Yukiko Tomioka,1 Tomohiro Yoshida,1 Hiroya Matsuda,1 Yui Matsumoto,1 Rumiko Masuda,2 Toshiharu Kamishikiryo,3 Manabu Fuchikami,3 Masahito Nakataki,1 Akira Takahashi,2 Atsushi Tajima,4 Go Okada,3 Shusuke Numata1
1Department of Psychiatry, Institute of Biomedical Sciences, Tokushima University Graduate School, Tokushima, Japan; 2Department of Preventive Environment and Nutrition, Institute of Biomedical Sciences, Tokushima University Graduate School, Tokushima, Japan; 3Department of Psychiatry and Neurosciences, Graduate School of Biomedical Sciences, Hiroshima University, Hiroshima, Japan; 4Department of Bioinformatics and Genomics, Graduate School of Advanced Preventive Medical Sciences, Kanazawa University, Kanazawa, Japan
Correspondence: Hidehiro Umehara, Department of Psychiatry, Institute of Biomedical Sciences, Tokushima University Graduate School, 3-8-15 Kuramoto-cho, Tokushima, 770-8503, Japan, Tel +81 886 33 7130, Fax +81 886 33 7131, Email [email protected]
Background: Bipolar disorder (BD) is a psychiatric disorder characterized by recurrent episodes of mania and depression. However, the pathophysiology has not yet been fully elucidated.
Methods: In this study, we employed capillary electrophoresis time-of-flight mass spectrometry to measure 34 plasma metabolites and compared the levels between individuals with BD (N = 64, male/female = 30/34, age [mean ± S.D.] = 51.4 ± 12.0 years) and non-psychiatric controls (N = 92, male/female = 32/60, age = 38.6 ± 13.4 years).
Results: Significant differences in 12 plasma metabolites, including kynurenine and tryptophan, were observed between the two groups (q < 0.05).
Discussion: These findings support the involvement of amino acid dysregulation in the pathophysiology of BD. However, the cross-sectional design, lack of control for medication, diet, and smoking, and the use of peripheral rather than central samples limit the generalizability of the results. Further longitudinal and mechanistic studies are needed. Integration with clinical, imaging, and genetic data in future research may facilitate the development of metabolomics-based biomarkers.
Keywords: psychiatric disorder, metabolome, metabolomics, kynurenine, tryptophan
Introduction
Bipolar disorder (BD) is a psychiatric disorder characterized by recurrent chronic fluctuations in mood and energy levels, affecting approximately 1% of the population over a lifetime.1 Although a combination of genetic and environmental factors is thought to contribute to the development of BD,2 its precise pathophysiology remains unclear. BD often manifests as a depressive episode, making it challenging to differentiate from unipolar depression; therefore, there is an urgent need for biomarkers to assist in the diagnosis of BD.
Metabolomics, a global approach for understanding the regulation of metabolic pathways and networks, provides valuable insights into the biological system.3 Previous metabolomic studies in BD have reported alterations in various types of metabolites, suggesting potential diagnostic and therapeutic implications.4 However, findings across studies are often inconsistent, and few have examined these changes in Japanese populations.
Recent studies have highlighted the role of tryptophan and its downstream kynurenine pathway in the pathophysiology of BD. Tryptophan is an essential amino acid and the precursor of serotonin. However, the majority of tryptophan is metabolized via the kynurenine pathway, and alterations in this pathway are linked to immune-inflammatory mechanisms and neurotransmitter imbalances in BD.5 Accumulating evidence has shown alteration of tryptophan, kynurenine and related kynurenine pathway metabolites.6–8
In this study, we aimed to characterize the metabolic profile of plasma samples from Japanese patients with BD. We compared our findings with those of previous studies, with a particular focus on tryptophan and kynurenine.
Materials and Methods
Subjects
Sixty-four patients with BD (type 1/type 2 = 36/28) were recruited from Hiroshima University Hospital and psychiatric clinics in Hiroshima Prefecture, Japan. Experienced psychiatrists diagnosed BD according to the criteria of the Diagnostic and Statistical Manual of Mental Disorders (DSM-IV). All patients with BD were receiving pharmacological treatment, including antipsychotics, antidepressants, lithium, valproate, carbamazepine, and lamotrigine. Additionally, 92 non-psychiatric control subjects were recruited from the local community of Hiroshima and underwent structured interviews. Some participants had comorbid systemic illnesses, such as hypertension, diabetes mellitus, and thyroid disorders.
A priori power analysis was conducted to determine the required sample size. Assuming a medium effect size (f = 0.25), an alpha level of 0.05, and a power of 0.80, the analysis indicated that a total sample size of N = 67.5 per group would be required. The sample size of the control group met this requirement, whereas the BD group slightly fell short of the target sample size.
The study was conducted in accordance with the ethical principles outlined in the Declaration of Helsinki of the World Medical Association. The study protocol was approved by the Institutional Ethics Committees of the University of Tokushima Graduate School and Hiroshima University, Japan. Written informed consent was obtained from all the participants.
Quantitative Metabolome Analysis
Blood samples were collected from each participant on the day of hospital visit. Dietary intake and smoking status were not controlled. Plasma was isolated via centrifugation at 2000 g for 10 min, after which the plasma-containing supernatant fraction was frozen at −80 °C until further use. Details of the metabolite measurements are described in our previous study.9 In brief, 50 μL of plasma was mixed with 450 μL of methanol containing internal standards (10 μM). Milli-Q water (200 μL) and chloroform (500 μL) were added, mixed, and centrifuged at 2300 g at 4 °C for 5 min. The aqueous layer (375 μL) was filtered through a 5-kDa cut-off filter (EMD Millipore, Billerica, MA, USA) to remove macromolecules. The filtrate was lyophilized and dissolved in 50 μL of Milli-Q water containing reference compounds prior to mass spectrometry analysis. Metabolic profiles of 34 plasma metabolites were conducted using a capillary electrophoresis electrospray ionization time-of-flight mass spectrometry (CE-ESI-TOFMS) system (Agilent 7100 CE - 6230 TOFMS, Agilent Technologies, Palo Alto, CA, USA) in cationic mode, with a mass range of 50–1000. Sample were analyzed using a fused silica capillary (50 μm i.d. x 80 cm length) and electrolyte buffered solutions (HMT, Tsuruoka, Japan). The applied voltage for the cationic mode was set to 27 kV. Peaks detected by CE-TOFMS were extracted using MassHunter integration software (Agilent Technologies) to obtain peak information, including mass-to-charge ratios (m/z), migration time (MT), and peak area. Metabolites were annotated by comparing the MT and m/z values to a standard metabolite database, with a tolerance range of ± 0.2 min for MT and ± 10 parts per million for m/z. Peak areas were normalized to those of the internal standards.
Statistical Analyses
Age differences between the BD and control groups were compared using the Mann–Whitney U-test, while sex differences were analyzed using the chi-square test. The normality of distributions was evaluated using the Shapiro–Wilk test. The relationships between age, Beck Depression Inventory (BDI) score, Young Mania Rating Scale (YMRS) score and concentration of each metabolite were analyzed using Spearman’s rank correlation coefficient. Analysis of covariance (ANCOVA) was used to compare the log-transformed concentrations of each metabolite between the BD and control groups after adjusting for age, use of antipsychotics, antidepressants, lithium, valproate, carbamazepine, lamotrigine, presence of systemic illnesses and interaction terms. The Benjamini-Hochberg method was used to correct for multiple comparisons, and the significance level was set at q < 0.05. The log-transformed kynurenine-to-tryptophan (KT) ratio was analyzed separately using an ANCOVA model with the same covariates as in the main analysis—including age, use of psychotropic medications and presence of systemic illnesses—to evaluate group differences. All statistical analyses were performed using the R software (version 4.4.2).
Results
Demographics
The demographic characteristics of the participants are shown in Table 1. There was a significant difference in age between the BD and control groups (p = 5.7E-08), but no significant difference in sex (p = 0.18).
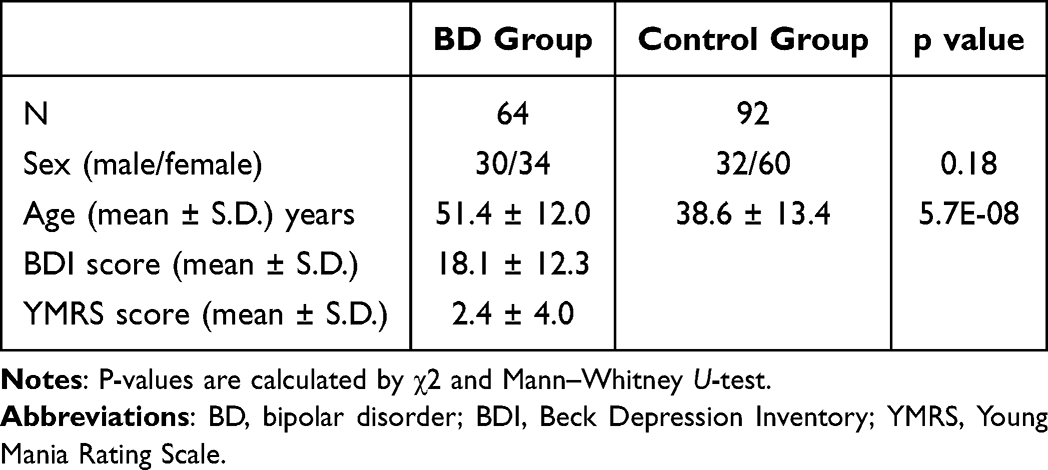 |
Table 1 Demographic of Participants |
Relationship Between Age and Each Metabolite Concentration
The correlation coefficients between age and plasma metabolite concentrations in the BD and control groups are shown in Tables S1 and S2. In the BD group, four metabolites—betaine, citrulline, cysteine, and phenylalanine—were correlated with age (p < 0.05). In the control group, 15 metabolites—including anthranilic acid, arginine, asparagine, aspartic acid, choline, citrulline, creatine, cysteine, glutamate, hypoxanthine, isoleucine, ornithine, phenylalanine, and thymine—showed significant correlation with age (p < 0.05).
Relationship Between BDI/YMRS Score and Each Metabolite Concentration
The correlation coefficients between Beck Depression Inventory (BDI) scores, Young Mania Rating Scale (YMRS) scores, and plasma metabolite concentrations in the BD group are presented in Tables S3 and S4. Among the metabolites, only betaine showed a significant correlation with the BDI score (p < 0.05). No significant correlations were observed between any metabolite and the YMRS score.
Differences of Plasma Metabolite Levels Between BD and Control Groups
The mean plasma concentrations of the 34 metabolites in the BD and control groups are presented in Table 2. Among the 34 measured metabolites, 12 showed significant differences between the two groups. Nine metabolites—asparagine, aspartic acid, glycine, kynurenine, phenylalanine, serine, thymine, tryptophan, and uracil—were present at lower concentrations in the BD group than that in the control group. In contrast, three metabolites—choline, creatinine, and cysteine—were present at higher concentrations in the BD group (q < 0.05). The concentrations of kynurenine and tryptophan are shown in Figure 1. KT ratio did not differ significantly between the groups (BD: 0.029 ± 0.008; control: 0.028 ± 0.007; p = 0.197).
 |
Table 2 Blood Plasma Metabolite Concentrations in the BD and Control Groups |
 |
Figure 1 Blood plasma concentrations of metabolites in the BD and control groups (*FDR q < 0.05). Y axis represents metabolic plasma concentration (μM). Bars indicate mean levels in the group. (a) The levels of Tryptophan were significantly lower in BD patients than in control subjects (FDR q = 1.09E-06). (b) The levels of Kynurenine were significantly lower in BD patients than in control subjects (FDR q = 3.35E-03). |
Discussion
In this study, we identified 12 plasma metabolites that differed between patients with BD and controls. In particular, we observed decreased levels of both kynurenine and tryptophan in the plasma of patients with BD. These results are consistent with those from a meta-analysis of 17 peripheral blood studies in BD.6 Kynurenine is a downstream metabolite of tryptophan, primarily generated through the enzymatic activity of indoleamine 2,3-dioxygenase 1 (IDO1), which is upregulated in response to pro-inflammatory stimuli. Activation of the kynurenine pathway leads to a reduction of serotonin, which is assumed to play a major role in the pathophysiology of depression.6 Interestingly, another meta-analysis of peripheral blood reported a decrease in kynurenine and tryptophan levels in major depressive disorder (MDD) and schizophrenia (SZ),7 and a combined cohort of patients with BD and MDD.8 These results suggest that abnormalities in kynurenine and tryptophan levels may contribute to the pathophysiology of all BD, MDD and SZ. KT ratio is often used as a surrogate marker for IDO1 activity and chronic inflammation.10 In our study, KT ratio was not significantly different between patients with BD and controls. Previous meta-analyses have also shown that KT ratio does not differ in BD,7,11 although it is elevated in MDD and SZ.7 These result may imply that the reduced concentrations of kynurenine and tryptophan may not be driven by enhanced IDO1 activity in BD.
We also demonstrated that both glycine and serine levels were decreased in the plasma of patients with BD. Previous studies on glycine levels in BD have been inconsistent, with some reporting increases12,13 and others reporting decreases.14,15 These discrepancies may be related to differences in measurement methods, with studies reporting reductions using high-performance liquid chromatography and those reporting increases using Nuclear Magnetic Resonance. The decrease in serine concentration in patients with BD is consistent with the results of previous studies.13,16 Glycine and serine are implicated in numerous metabolic pathways and play crucial roles in neurotransmission and energy metabolism in the brain. Disruptions in these pathways may lead to imbalances in neurotransmission and energy production within the brain, potentially contributing to the development of BD symptoms.4 Interestingly, a Mendelian randomization study showed that genetically determined higher glycine levels were associated with a decreased risk of psychiatric disorders, including BD, suggesting that glycine may represent a potential therapeutic target.17
Furthermore, we demonstrated that phenylalanine levels decreased in the plasma of patients with BD, which is consistent with previous studies.18,19 Phenylalanine is an essential amino acid and a precursor of catecholamines such as dopamine, norepinephrine, and epinephrine. Interestingly, the antidepressant effects of phenylalanine and the effects of phenylalanine/tyrosine depletion on mood have been reported.20,21
Our study had several limitations. First, we did not account for the effects of diet and smoking on metabolite levels. Previous studies have shown that diet, including alcohol and coffee, or smoking affect various types of blood metabolites.22,23 Future studies should control these confounding factors. Second, all patients with BD were receiving medications. Third, the effects of psychiatric symptoms on metabolite levels were not considered. Although there was no strong correlation between BDI or YMRS scores and blood metabolite concentrations in this study, future studies should further investigate the effect of mood state. Fourth, this study was cross-sectional. Finally, it remains unclear whether changes observed in the peripheral blood reflect alterations in the central nervous system.
In conclusion, we identified significant differences in plasma metabolite levels between patients with BD and controls, and these altered metabolites may help to elucidate the pathophysiology of the disease. Future studies should incorporate longitudinal assessments, standardized sample collection conditions, and more detailed clinical phenotyping to better understand metabolite-symptom relationships. Integrating neuroimaging or genomic data may further advance the development of metabolomics-based biomarkers.
Acknowledgments
The authors would like to thank all the volunteers who participated and who understood the purpose of the study, as well as the physicians who assisted with collection of clinical data and blood samples at the hospitals.
Author Contributions
All authors made a significant contribution to the work reported, whether that is in the conception, study design, execution, acquisition of data, analysis and interpretation, or in all these areas; took part in drafting, revising or critically reviewing the article; gave final approval of the version to be published; have agreed on the journal to which the article has been submitted; and agree to be accountable for all aspects of the work.
Funding
This research was supported by AMED under Grant Number JP18dk0307076.
Disclosure
The authors report no conflicts of interest in this work.
References
1. Merikangas KR, Jin R, He JP, et al. Prevalence and correlates of bipolar spectrum disorder in the World Mental Health Survey Initiative. Arch Gen Psychiatry. 2011;68(3):241–251. doi:10.1001/archgenpsychiatry.2011.12
2. Grande I, Berk M, Birmaher B, Vieta E. Bipolar disorder. Lancet. 2016;387(10027):1561–1572. doi:10.1016/S0140-6736(15)00241-X
3. Kaddurah-Daouk R, Krishnan KRR. Metabolomics: a global biochemical approach to the study of central nervous system diseases. Neuropsychopharmacology. 2009;34(1):173–186. doi:10.1038/npp.2008.174
4. Chen J, Amdanee N, Zuo X, et al. Biomarkers of bipolar disorder based on metabolomics: a systematic review. J Affect Disord. 2024;350:492–503. doi:10.1016/j.jad.2024.01.033
5. Zhang P, Huang H, Gao X, et al. Involvement of Kynurenine metabolism in bipolar disorder: an updated review. Frontiers in Psychiatry. 2021;12. doi:10.3389/fpsyt.2021.677039
6. Hebbrecht K, Skorobogatov K, Giltay EJ, Coppens V, De Picker L, Morrens M. Tryptophan catabolites in bipolar disorder: a meta-analysis. Front Immunol. 2021;12:1. doi:10.3389/fimmu.2021.667179
7. Marx W, McGuinness AJ, Rocks T, et al. The kynurenine pathway in major depressive disorder, bipolar disorder, and schizophrenia: a meta-analysis of 101 studies. Mol Psychiatry. 2020. doi:10.1038/s41380-020-00951-9
8. Almulla AF, Thipakorn Y, Vasupanrajit A, et al. The tryptophan catabolite or kynurenine pathway in major depressive and bipolar disorder: a systematic review and meta-analysis. Brain Behav Immun Heal. 2022;26. doi:10.1016/j.bbih.2022.100537
9. Kamishikiryo T, Okada G, Itai E, et al. Left DLPFC activity is associated with plasma kynurenine levels and can predict treatment response to escitalopram in major depressive disorder. Psychiatry Clin Neurosci. 2022;76(8):367–376. doi:10.1111/pcn.13373
10. Fujigaki H, Yamamoto Y, Saito K. L-Tryptophan-kynurenine pathway enzymes are therapeutic target for neuropsychiatric diseases: focus on cell type differences. Neuropharmacology. 2017;112:264–274. doi:10.1016/j.neuropharm.2016.01.011
11. Bartoli F, Misiak B, Callovini T, et al. The kynurenine pathway in bipolar disorder: a meta-analysis on the peripheral blood levels of tryptophan and related metabolites. Mol Psychiatry. 2020. doi:10.1038/s41380-020-00913-1
12. Hoekstra R, Fekkes D, Loonen AJM, Pepplinkhuizen L, Tuinier S, Verhoeven WMA. Bipolar mania and plasma amino acids: increased levels of glycine. Eur Neuropsychopharmacol. 2006;16(1):71–77. doi:10.1016/j.euroneuro.2005.06.003
13. Pålsson E, Jakobsson J, Södersten K, et al. Markers of glutamate signaling in cerebrospinal fluid and serum from patients with bipolar disorder and healthy controls. Eur Neuropsychopharmacol. 2015;25(1):133–140. doi:10.1016/j.euroneuro.2014.11.001
14. Ren Y, Bao S, Jia Y, et al. Metabolic profiling in bipolar disorder patients during depressive episodes. Front Psychiatry. 2020;11:569612. doi:10.3389/fpsyt.2020.569612
15. Guo XJ, Wu P, Cui XH, et al. Pre- and post-treatment levels of plasma metabolites in patients with bipolar depression. Front Psychiatry. 2021;12:747595. doi:10.3389/fpsyt.2021.747595
16. Yoshimi N, Futamura T, Kakumoto K, et al. Blood metabolomics analysis identifies abnormalities in the citric acid cycle, urea cycle, and amino acid metabolism in bipolar disorder. BBA Clin. 2016;5:151–158. doi:10.1016/j.bbacli.2016.03.008
17. Jia Y, Hui L, Sun L, et al. Association between human blood metabolome and the risk of psychiatric disorders. Schizophrenia Bulletin. 2023;49(2):428–443. doi:10.1093/schbul/sbac130
18. Joshi MB, Pai S, Balakrishnan A, et al. Evidence for perturbed metabolic patterns in bipolar disorder subjects associated with lithium responsiveness. Psychiatry Res. 2019;273:252–259. doi:10.1016/j.psychres.2019.01.031
19. Yin B, Cai Y, Teng T, et al. Identifying plasma metabolic characteristics of major depressive disorder, bipolar disorder, and schizophrenia in adolescents. Transl Psychiatry. 2024;14(1). doi:10.1038/s41398-024-02886-z
20. Beckmann H, Strauss MA, Ludolph E. Dl-phenylalanine in depressed patients: an open study. J Neural Transm. 1977;41(2–3):123–134. doi:10.1007/BF01670277
21. Leyton M, Young SN, Pihl RO, et al. Effects on mood of acute phenylalanine/tyrosine depletion in healthy women. Neuropsychopharmacology. 2000;22(1):52–63. doi:10.1016/S0893-133X(99)00086-X
22. Taba N, Valge HK, Metspalu A, et al. Mendelian randomization identifies the potential causal impact of dietary patterns on circulating blood metabolites. Front Genetics. 2021;12. doi:10.3389/fgene.2021.738265
23. Gu F, Derkach A, Freedman ND, et al. Cigarette smoking behaviour and blood metabolomics. Int J Epidemiol. 2016;45(5):1421–1432. doi:10.1093/ije/dyv330
 © 2025 The Author(s). This work is published and licensed by Dove Medical Press Limited. The
full terms of this license are available at https://www.dovepress.com/terms.php
and incorporate the Creative Commons Attribution
- Non Commercial (unported, 4.0) License.
By accessing the work you hereby accept the Terms. Non-commercial uses of the work are permitted
without any further permission from Dove Medical Press Limited, provided the work is properly
attributed. For permission for commercial use of this work, please see paragraphs 4.2 and 5 of our Terms.
© 2025 The Author(s). This work is published and licensed by Dove Medical Press Limited. The
full terms of this license are available at https://www.dovepress.com/terms.php
and incorporate the Creative Commons Attribution
- Non Commercial (unported, 4.0) License.
By accessing the work you hereby accept the Terms. Non-commercial uses of the work are permitted
without any further permission from Dove Medical Press Limited, provided the work is properly
attributed. For permission for commercial use of this work, please see paragraphs 4.2 and 5 of our Terms.