")
Back to Journals » International Journal of Nanomedicine » Volume 19
Antiviral Activity of Graphene Oxide–Silver Nanocomposites Against Murine Betacoronavirus
Authors Cymerys J , Bartak M, Słońska A, Lange A , Jaworski S , Chodkowski M, Ostrowska A , Wierzbicki M , Sawosz E, Bańbura MW
Received 12 April 2024
Accepted for publication 13 August 2024
Published 4 September 2024 Volume 2024:19 Pages 9009—9033
DOI https://doi.org/10.2147/IJN.S473448
Checked for plagiarism Yes
Review by Single anonymous peer review
Peer reviewer comments 3
Editor who approved publication: Prof. Dr. RDK Misra
Joanna Cymerys,1,* Michalina Bartak,1,* Anna Słońska,1 Agata Lange,2 Sławomir Jaworski,2 Marcin Chodkowski,3 Agnieszka Ostrowska,2 Mateusz Wierzbicki,2 Ewa Sawosz,2 Marcin W Bańbura1
1Department of Preclinical Sciences, Institute of Veterinary Medicine, Warsaw University of Life Sciences, Warsaw, Poland; 2Department of Nanobiotechnology, Institute of Biology, Warsaw University of Life Sciences, Warsaw, Poland; 3Military Institute of Hygiene and Epidemiology, Warsaw, Poland
*These authors contributed equally to this work
Correspondence: Joanna Cymerys, Department of Preclinical Sciences, Institute of Veterinary Medicine, Warsaw University of Life Sciences, 02-786, Warsaw, Poland, Email [email protected]
Background: The high infectivity of coronaviruses has led to increased interest in developing new strategies to prevent virus spread. Silver nanoparticles (AgNPs) and graphene oxide (GO) have attracted much attention in the antiviral field. We investigated the potential antiviral activity of GO and AgNPs combined in the nanocomposite GO-Ag against murine betacoronavirus MHV using an in vitro model.
Methods: GO, AgNPs, and GO-Ag characterization (size distribution, zeta potential, TEM visualization, FT-IR, and EDX analysis) and XTT assay were performed. The antiviral activity of GO-Ag nanocomposites was evaluated by RT-qPCR and TCID50 assays. The results were compared with free AgNPs and pure GO. Cell growth and morphology of MHV-infected hepatocytes treated with GO-Ag composites were analyzed by JuLI™Br. Immunofluorescence was used to visualize the cell receptor used by MHV. Ultrastructural SEM analysis was performed to examine cell morphology after MHV infection and GO-Ag composite treatment.
Results: A significant reduction in virus titer was observed for all nanocomposites tested, ranging from 3.2 to 7.3 log10 TCID50. The highest titer reduction was obtained for GO 5 μg/mL - Ag 25 μg/mL in the post-treatment method. These results were confirmed by RT-qPCR analysis. The results indicate that GO-Ag nanocomposites exhibited better antiviral activity compared to AgNPs and GO. Moreover, the attachment of AgNPs to the GO flake platform reduced their cytotoxicity. In addition, the GO-Ag composite modulates the distribution of the Ceacam1 cell receptor and can modulate cell morphology.
Conclusion: Graphene oxide sheets act as a stabilizing agent, inhibiting the accumulation of AgNPs and reducing their cellular toxicity. The GO-Ag composite can physically bind and inhibit murine betacoronavirus from entering cells. Furthermore, the constant presence of GO-Ag can inhibit MHV replication and significantly limit its extracellular release. In conclusion, GO-Ag shows promise as an antiviral coating on solid surfaces to minimize virus transmission and spread.
Keywords: graphene oxide, silver nanoparticles, GO-Ag composite, antiviral, coronavirus, MHV
Graphical Abstract:

Introduction
Coronaviruses (CoVs) (order Nidovirales, family Coronaviridae) are enveloped viruses with a positive sense, single-stranded RNA genome. With genome sizes ranging from 26 to 32 kilobases (kb) in length, CoVs have the largest genomes for RNA viruses. They have an average diameter of 100 nm with a spherical or oval shape. Based on genetic and antigenic criteria, CoVs have been organized into four groups: alpha-CoVs (14 subgenera and 19 species), beta-CoVs (5 subgenera and 14 species), delta-CoVs (3 subgenera and 7 species), and gamma-CoVs (3 subgenera and 5 species).1,2
The occurrence of coronaviruses in humans (HCoVs) or other species is not a novel phenomenon. Infections with HCoVs (229E, OC43) are known to cause approximately 15–29% of all cold-like illnesses with mild upper respiratory tract infections. Their potential for high virulence was demonstrated during the SARS-CoV epidemic of 2000–2003.3 With the emergence of COVID-19, caused by the novel severe acute respiratory syndrome coronavirus-2 (SARS-CoV-2), it became evident that this pathogen is significantly more transmissible among humans than its predecessor, SARS-CoV-1.4 On March 11, 2020, the World Health Organization (WHO) declared COVID-19 a pandemic, marking it as first caused by a coronavirus.5
The coronavirus disease 2019 (COVID-19), caused by SARS-CoV-2, is now considered a global public health emergency. COVID-19 is the first pandemic to occur in the context of an aging population, particularly in several high-income countries. The majority of COVID-19 cases develop a lower respiratory tract infection, which leads to a high rate of virus transmission, especially in densely populated areas or in hospitals.6 Aerosols are critical for SARS-CoV-2 transmission; however, in highly populated areas, the contaminated surfaces also take an important role.7,8
The development of an effective vaccine against SARS-CoV-2 commenced shortly after the onset of the pandemic, leading to the licensing or advancement into phase three clinical trials of several vaccines. These vaccines employ various strategies, including the utilization of recombinant spike glycoproteins delivered through mRNA-based platforms, adenoviral vectors, or direct injection of the protein itself. Currently, the registered protocol of recommended antiviral usage encompasses drugs such as remdesivir, chloroquine/hydroxychloroquine with or without azithromycin, ritonavir-boosted nirmatrelvir (Paxlovid), dexamethasone, lopinavir/ritonavir and other HIV protease inhibitors.9,10 The main goal of therapeutic management is to prevent progression to severe disease, hospitalization, or death. Other goals encompass expediting symptom resolution, achieving viral clearance, and preventing long-term sequelae.
It is imperative to underscore that certain patients remain at heightened risk of disease progression, and it is within this vulnerable population that therapies are most likely to be beneficial. Patients at highest risk are the elderly and those who are unlikely to have an adequate immune response to COVID-19 vaccines due to moderate to severe immunocompromising conditions or the use of immunosuppressive drugs. Other risk factors include unvaccinated or incomplete vaccination, a long interval since the last dose of vaccine (eg >6 months), and conditions such as obesity, diabetes, and chronic respiratory, cardiac, or renal disease. Survivors are at great risk of developing neurodegenerative diseases as they age, making the current pandemic a unique and unprecedented paradigm.3,11–14
Given the substantial number of infected patients worldwide (www.worldometers.info/coronavirus), the ability of SARS-CoV-2 to rapidly evolve new variants through accelerated genetic mutations, and the heightened rate of human-to-human transmission, including the possibility of transmission by asymptomatic infected individuals, scientists have been compelled to devise novel strategies to limit both the transmission and pathogenicity of SARS-CoV-2.15–18
One promising strategy worth exploring involves the utilization of nanoparticles and their composites as a novel therapeutic approach. Currently, nanoparticles (NPs) are the most important among various nanomaterials. In the context of antiviral properties, they exert their activity through multiple mechanisms. NPs are designed with geometric and size homology to viruses; therefore, they inhibit or inactivate the replication process. In addition, NPs are characterized by low toxicity, biomimetic properties, easy cell entry (negatively charged), flexible synthesis, biocompatibility, surface tunability, and chemical and structural composition design.18–22
The efficacy of silver nanoparticles (AgNPs) as broad-spectrum antimicrobial agents has been well-documented. AgNPs have been proven to be the most effective antimicrobial agents against bacteria and viruses because of their high surface-area-to-volume ratio and unique chemical and physical properties.23,24 There are two types of interaction between the AgNPs and the pathogenic virus: (i) the AgNPs bind to the outer coat of the virus, inhibiting virus attachment to cell receptors, and (ii) the AgNPs bind to the DNA or RNA of the virus, inhibiting virus replication or spread within host cells.20,21,25–28 The antiviral action of AgNPs has been demonstrated against various viruses, including Human Immunodeficiency Virus Type 1 (HIV-1),29,30 Hepatitis B virus,31 influenza virus,32–34 Human herpesvirus type 1,35 respiratory syncytial virus,36 monkeypox virus,37 Tacaribe virus38 and adenoviruses.39
Numerous factors can determine the antiviral efficacy of AgNPs, including size, shape, and capping agents.40,41 Previous studies have shown that a spherical shape is superior to a tubular shape or aggregated forms and that smaller AgNPs exhibit enhanced cellular uptake via endocytosis, leading to greater toxicity, while larger particles are not internalized.32,42,43 Several studies have confirmed the size-dependent antiviral effect of AgNPs, with particles between 2 and 15 nm in diameter being the most effective. This has been attributed to the higher stability of interaction with the viral protein achieved by 2–15 nm particles, which is not possible with larger particles.41,44 In addition, studies have shown that capping agents that limit the release of free AgNPs would have less viral inhibition.30 Furthermore, the use of free AgNPs has several major drawbacks, including inherent aggregation among AgNPs and the potential for cytotoxic or genotoxic damage to the human body upon inhalation or ingestion. The use of silver nanoparticles for disinfecting a room, clothes, and everyday objects is associated with their contact with the skin.45 Therefore, in order to achieve a superior application of AgNPs, novel materials are required to encapsulate and support the AgNPs. Such advances are critical to overcome these limitations and enhance the therapeutic potential of AgNPs in antiviral applications.
In order to increase the antiviral activity, it is proposed to attach Ag nanoparticles with graphene oxide (GO) for the formation of a nanocomposite (GO-Ag). Graphene, a carbon allotrope which structure consists of a planar sheet of single carbon atoms, with each atom bound to three densely packed atoms in a honeycomb crystal lattice, is a promising next-generation nanomaterial due to its unique high carrier mobility, effective optical transparency, large surface area, and biocompatibility.5,46–48 Studies have shown that both graphene and graphene oxide have antibacterial and antiviral properties. The antibacterial properties of graphene derivatives were found to be primarily based on the movement of their electrons in the direction of bacteria. This movement causes cytoplasmic efflux, reduction in metabolism, effects on lipid membranes, induction of oxidative stress, generation of reactive oxygen species (ROS), loss of glutathione, and ultimately bacterial death.47,49–51
The antiviral activity of well-dispersed GO sheets has also been evaluated. Several studies have indicated that graphene-based materials can inhibit the entry of an enveloped DNA virus (eg, HHV-1; pseudorabies virus, PRV) and RNA virus (eg, porcine epidemic diarrhea virus, coronavirus PEDV) in their target cells.52,53 The potent antiviral activity of GO can be attributed to the unique single-layer structure and negative charge. Ye et al (2015) suggested that the mechanism underlying the antiviral action of GO is based on the electrostatic interaction of negatively charged sharp-edged GO with positively charged virus particles, resulting in viral morphology damage (both the envelope and the spikes were destroyed) and subsequent inactivation.53 Song et al (2015) have also demonstrated that negatively charged GO can efficiently capture viruses (enterovirus 7, EV71; avian influenza virus H9N2), destroy their surface proteins, and extract viral RNA in an aqueous environment by the superficial bioreduction of GO.54
The aim of this study was to combine the properties of graphene oxide, characterized by its ultrathin sheets capable of covering an extensive surface area, with the antiviral efficacy of silver nanoparticles. We decided to investigate the antiviral properties of GO-Ag composites using an in vitro model comprising murine nonparenchymal hepatocytes infected with the murine hepatitis virus (MHV), an animal representative of betacoronaviruses. MHV, one of the better-known members of the Coronaviridae, has emerged as an excellent model for testing new antiviral therapies in the context of the SARS-CoV-2 pandemic because of its similar tissue tropism and structure. MHV strains can induce pulmonary, cardiac, and nephrotic pathologies identical to those observed in human SARS-CoV-2 infections.55,56 The polytropic (pulmonary) strains of MHV: MHV-1, MHV-2, MHV-3, MHV-JHM (MHV-4), MHV-A59 and MHV-S, initially replicate in the respiratory and olfactory epithelium of the nasal cavity, then develop viremia, and spread to the lungs, liver, bone marrow, brain, lymphoid tissue and reproductive organs. Enterotropic strains of MHV: MHV-D, MHV-DVIM, MHV-Y, and MHV-RI, primarily infect the gut and can spread to the liver, lymphoid tissues, and spleen.57–59 The primary cell receptor used by MHV to attach to the cell surface is the carcinoembryonic antigen-related cell adhesion molecule (Ceacam1). This receptor is abundantly expressed on the surface of various cells, including hepatocytes, which explains the increased tropism of the virus towards these cells and the induction of hepatitis in mice.57,60
Materials and Methods
Preparation of Silver Nanoparticles Anchored Graphene Oxide (GO-Ag)
Silver nanoparticles were obtained from Nano-Tech (Warsaw, Poland) and graphene oxide from Advanced Graphene Products (Zielona Gora, Poland). Size distribution and zeta potential of nanomaterials were measured using dynamic light scattering (DLS) and Doppler electrophoresis, respectively, by ZetaSizer Nano-ZS ZEN 3600 instrument (Malvern Ltd., UK) in ultrapure water at room temperature (23°C) after ultrasonic treatment for 30 minutes (Sonorex Super RK 514H; Bandelin Electronic, Berlin, Germany). Visualization of the nanomaterials was conducted using a transmission electron microscope (TEM; JEM-1220 JEOL, Tokyo, Japan) with an accelerating voltage of 80 kV. Prior to visualization, 10 μL droplets of hydrocolloids were placed onto TEM grids (Formvar on 3 mm 200 Mesh Cu Grids, Agar Scientific, Stansted, UK), and samples were observed immediately after air-drying. To perform Fourier transform infrared (FT-IR) spectrum measurements, the Nicolet iS10 spectrometer (Thermo Fisher Scientific, Waltham, MA, USA) was used. For this reason, discs were formed of 200 mg of KBr powder (Sigma-Aldrich, Munich, Germany), which was pressed together under 10 Atm. Thereafter, a droplet of the suspension of nanomaterials was pipetted onto a formed disc, dried in a vacuum overnight, and investigated in transmittance mode. The FT-IR range was collected in the range 500–4000 cm−1.61
In addition, the chemical analysis of the nanocomposites was carried out using a Quanta 250 FEG FEI scanning electron microscope equipped with an Energy Dispersive X-Ray (EDX) detector. First, the nanocomposites were centrifuged (10000 rpm, 20 min; MPW centrifuge MPW-352R). Subsequently, the droplets (approximately 0.5 μL) of hydrocolloids were placed on the SEM stages at 10x and dried at 30°C in a vacuum dryer (Vacucell 55, MMM Group). The analysis was carried out using spot 4.5 and 20kV parameters.62
Cell Culture
Murine nonparenchymal hepatocytes, NCTC Clone 1469 cells, were purchased from the American Type Culture Collection (ATCC-CCL-9.1). The cell culture was propagated according to the manufacturer’s procedure, aliquoted, and stored in liquid nitrogen for further studies. Cells were maintained in DMEM-GlutaMax medium with high glucose (4.5 g/L) (Gibco), supplemented with 1% penicillin-streptomycin, 5% fetal bovine serum, and 5% equine serum (Life Technologies) in an atmosphere with 95% humidity and 5% CO2 at 37°C.
Virus and Virus Titration
Murine hepatitis virus JHM strain (MHV-JHM) was obtained from the American Type Culture Collection (ATCC-VR-76513). The virus was propagated in NCTC Clone 1469 cells, followed by 3 cycles of freezing and thawing; the large debris was spun down, and the supernatant was used as a stock solution (MOI = 1.25).
Endpoint dilution assays were used to measure viral infectivity. Briefly, tenfold serial dilutions of a virus stock were prepared and inoculated onto cell cultures in multi-well format (96-well plastic plates, Sarstedt). Each dilution of the virus stock was inoculated into 8 wells, and each TCID50 (median tissue culture infectious dose) assay was performed in duplicate. A control with non-infected cells was included in each plate. After 24 hours post infection, cells were fixed with 4% paraformaldehyde in phosphate buffer solution (PBS), stained with 0.5% crystal violet in 20% pure methanol, and washed with dH2O. The changes in the cell culture were observed under an inverted phase-contrast microscope (Olympus), and the MHV-JHM titer was determined by the presence or absence of cytopathic effect (CPE). TCID50 was defined as the dilution of a virus required to infect 50% of a given cell culture using the improved Kärber method.63–65 This method gives the 50% endpoint as logTCID50 = log (dilution giving highest CPE) – log (dilution factor) x (Ʃ infected rate at each dilution – 0.5).
Cell Viability Assay
Cell viability was detected by sodium 3´-[1- (phenylaminocarbonyl)- 3.4- tetrazolium]-bis (4-methoxy 6-nitro) benzene sulfonic acid hydrate (XTT) assay (The Cell Proliferation Kit II (XTT), Roche). Briefly, the cells were cultured in 96-well microplates (at a seeding density of 105 cells per well) in the medium containing different concentrations of silver nanoparticles (AgNPs), graphene oxide (GO), and GO-Ag composite for a 24- and 48-hour period. Culture medium without the AgNPs, GO, or GO-Ag served as the control in each experiment. At the end of the exposure, 50μL XTT labeling reagent was added to each well and incubated for 4 h at 37°C and 5% CO2. Absorbance measurements of the blank background control and samples were performed using a microplate reader at a wavelength between 450–500 nm, with a reference wavelength between 650–690 nm (Infinite M200, Tecan, Durham, NC, USA).57,66 Cell viability was expressed as a percentage of the viability of the control culture.
Virus Inhibition Assay
MHV-JHM titer was determined by the presence or absence of cytopathic effect (CPE) in the murine hepatocytes cell line using a median tissue culture infectious dose (TCID50) assay. TCID50 was defined as the dilution of a virus required to infect 50% of a given cell culture using the improved Kärber method.63–65
To determine the antiviral activity of GO-Ag composites, MHV-JHM stock solution at indicated titers was mixed with different concentrations of each nanocomposite’s solutions at various dilutions using two methods (Figure 1). In the first method – inhibition of entry (Figure 1A), MHV-JHM stock solution was incubated for 1 hour with the following concentrations of GO-Ag composites: GO 3 µg/mL - Ag 3 µg/mL, GO 10 µg/mL - Ag 3 µg/mL, GO 3 µg/mL - Ag 10 µg/mL, GO 10 µg/mL - Ag 10 µg/mL and GO 5 µg/mL - Ag 25 µg/mL. The mixtures were used to infect hepatocytes in 96 well plates. After 1 h of incubation at 37 °C under 5% CO2, the cell cultures were washed twice with PBS, replaced with fresh growth medium, and incubated for another 24 h at 37 °C under 5% CO2. In the second method – inhibition of viral shedding (Figure 1B), cell cultures were firstly infected with a viral stock solution for 1 hour under 5% CO2, 37 °C. Then washed twice with PBS and incubated with mixtures of nanocomposites for 24 hours at 37 °C, 5% CO2. After 24 h, the cells were fixed with 4% paraformaldehyde in phosphate buffer solution (PBS), stained with 0.5% crystal violet in 20% pure methanol and washed with dH2O. The antiviral activity of GO-Ag was determined as the ratio of TCID50/mL from the group of GO-Ag treatment to TCID50/mL from the group of virus-only suspension. Furthermore, the antiviral activity of GO (GO 3 µg/mL, GO 5 µg/mL, and GO 10 µg/mL) and AgNPs (Ag 3 µg/mL, Ag 10 µg/mL, and Ag25 µg/mL) was tested separately under the same conditions. This was done for comparison with GO-Ag nanocomposites (positive control).
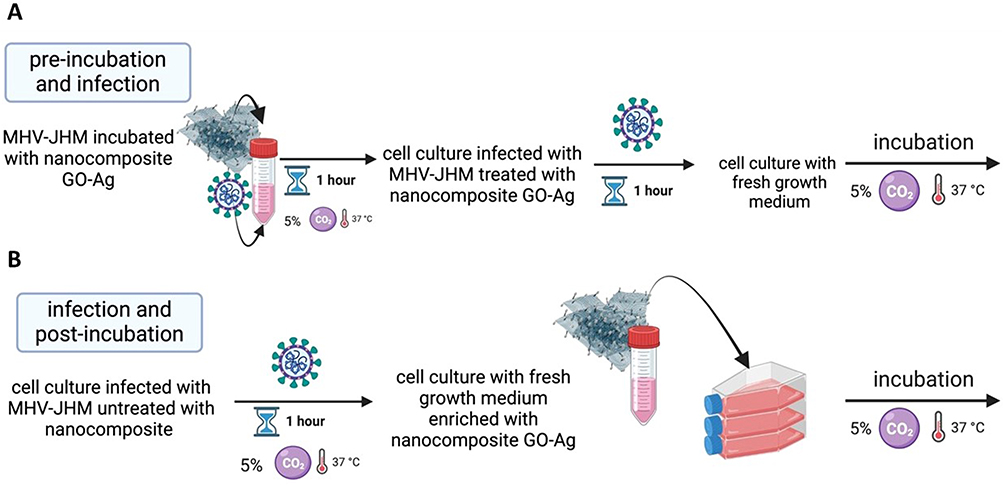 |
Figure 1 The scheme of two methods used to determine the antiviral properties of tested GO-Ag composites. Abbreviations: MHV-JHM, murine hepatitis virus JHM strain; GO-Ag, graphene oxide-silver nanoparticles composite. Notes: (A) variant with pre-treatment of viral stock prior to infection, (B) variant with post-infection treatment of infected cell culture. |
In addition, further analysis was carried out to assess the number of viral particles shed from the cells after a full replication cycle (and after the application of GO-Ag) and whether the nanocomposite present in the medium had an inhibitory effect on the virus. For this purpose, after incubation with MHV-JHM and nanocomposites (as described above; Figure 1), the culture supernatant was collected from each well and used to infect fresh cultures of murine hepatocytes, according to the scheme shown in Figure 1. After 24 h incubation, the cells were fixed with 4% paraformaldehyde in phosphate buffer solution (PBS), stained with 0.5% crystal violet in 20% pure methanol, and washed with dH2O. The antiviral activity of GO-Ag was determined as the ratio of TCID50/mL from the GO-Ag treatment group to TCID50/mL from the virus-only suspension group.
Real-Time Cell Growth Analysis
Cellular growth and morphology of hepatocytes infected with MHV-JHM and treated with various concentrations of GO-Ag composite were analyzed by the JuLI™Br Live Cell Analyzer system for bright-field analysis (NanoEnTek, Korea).67 Cells (at a seeding density of 105 cells per 9.6 cm2 well) were seeded in a 6-well plate and infected with MHV-JHM, with pre-incubation or post-incubation with GO-Ag, as described above (Figure 1). Cell-growth images were captured for 24 h with 5 min intervals. Cell confluence analysis, as well as real-time cell growth curve, were generated using JuLITMBr PC software. Uninfected cells served as a negative control, while untreated cells infected with the MHV-JHM strain constituted a positive control. All images were captured at a magnification of ×40.
Reverse Transcription Quantitative Real-Time PCR (RT-qPCR)
Cells (at a seeding density of 105 cells per 9.6 cm2 well) were seeded in a 6-well plate and infected with MHV-JHM, with pre-incubation or post-incubation with the following concentrations of GO-Ag composites: GO 3 µg/mL - Ag 3 µg/mL, GO 10 µg/mL - Ag 3 µg/mL, GO 3 µg/mL - Ag 10 µg/mL, GO 10 µg/mL - Ag 10 µg/mL and GO 5 µg/mL - Ag 25 µg/mL, and also GO (GO 3 µg/mL, GO 5 µg/mL and GO 10 µg/mL) and AgNPs (Ag 3 µg/mL, Ag 10 µg/mL and Ag25 µg/mL) separately (positive control), as described above (Figure 1). At 24 h post infection, the inoculum was removed, and cell monolayers were washed with PBS. Viral RNA was isolated from cells using RNeasy Mini Kit (Qiagen, USA), as recommended by the manufacturer. Purified RNA was eluted in 50 µL of RNase-free water. Viral RNA extracted from each sample was tested by Real-Time RT-qPCR using the QunatiNova RT-qPCR Kit (Qiagen Inc., Santa Clarita, CA, USA) on a thermocycler QuantStudio 5 (Applied Biosystems, Foster City, CA, USA). Standard RT-qPCR was performed according to the manufacturer’s recommendations. 5 µL of extracted RNA (total concentration 500 ng) was mixed with 2 µL Probe RT-PCR MasterMix, 6 μL of RNase-free water, 1.5 µL of each primer: MHV-F (5’ – GGA ACT TCT CGT TGG GGC ATT ATA CT – 3’), MHV-R (5’ – ACC ACA AGA TTA TCA TTT TCA CAA CAT A – 3’), 1 µL of Probe 5` 6-FAM 3` TAMRA (5’-6-FAM-ACA TGC TAC GGC TCG TGT AAC CGA ACT GT – TAMRA-3’) and 0.2 µL QN Probe RT-Mix, and filled with water to a total volume of 20 µL. The following cycle conditions were used: RT-step at 45 °C for 10 minutes, PCR initial heat activation at 95 °C for 5 minutes, and 40 cycles of 2-step cycling (denaturation at 95 °C for 5s and combined annealing at 60 °C for 30s). Primers were designed based on the region encoding membrane protein (nucleotides 29196–29303; product length 108 nt) in the MHV-JHM genome sequence (GenBank: FJ647226.1). Primers were purchased from IBB PAN (Warsaw, Poland). A standard curve was prepared using serial 10-fold dilutions of pGEM-T/MHV-JHM standard (106–10 copies per reaction). Each reaction was performed in triplicate.
Immunofluorescence Assay
All antibodies and reagents were purchased from Invitrogen by Thermo Fisher Scientific (Waltham, MA, USA) unless otherwise specified. A dual immunofluorescence assay for specific viral antigens and host cell receptors was performed.57 Cells cultured on coverslips in a 6-well plate (105 cells per well) were left uninfected (negative control), infected with MHV-JHM (positive control), treated with GO-Ag composite without infection (positive control), or: (i) pre-treated with GO-Ag composite and infected with MHV-JHM for 1 h at 37°C, (ii) infected with MHV-JHM for 1 h at 37°C and post-treated with GO-Ag composite. After incubation for 2, 18 and, 24 h at 37°C, cells were washed twice with phosphate buffer solution (PBS, Gibco), fixed in paraformaldehyde PBS for 30 min, and permeabilized with 0.5% Tween/PBS (Sigma-Aldrich), for 15 min. Unspecific binding sites were blocked using 1% bovine serum albumin (BSA, Sigma-Aldrich) in PBS (40 min) prior to staining. To visualize MHV-JHM antigen, cells were incubated with one of the following antibodies: SARS-CoV-2 Spike Protein S2 mouse mAb (1 mg/mL, 1:200, 1 h, 37°C) or SARS/SARS-CoV-2 Coronavirus Nucleocapsid mouse mAb (1 mg/mL, 1:500, 1 h, 37°C) coupled with goat anti-mouse Alexa Fluor 488 antibody (2 mg/mL, 1:500, 1 h, RT). For visualization of a host cell receptor, CEACAM1 recombinant rabbit mAb (1 mg/mL, 1:100, 4°C, overnight) coupled with secondary goat anti-rabbit Alexa Fluor 647 antibody (2 mg/mL, 1:200, RT) were used. Nuclear DNA was stained with Bisbenzimidine/Hoechst 33258 (2 μg/mL, 2 min, Sigma-Aldrich) according to the manufacturer’s recommendations. Stained coverslips were mounted on glass slides in ProLong Gold Antifade Reagent (Thermo Fisher Scientific; Waltham, MA, USA).
Image Acquisition
Fluorescent images were acquired using a FluoView FV10i laser scanning confocal microscope (Olympus Poland Sp. z o.o). equipped with ultraviolet/visible light LD lasers and 60x water-immersion objective. Confocal imaging was carried out in confocal mode using excitation wavelengths of 352 nm, 499 nm, 552 nm, and 653 nm to excite Hoechst, Alexa Fluor 488, TRITC, and Alexa Fluor 647, respectively. Images were converted to 24-bit tiff files for visualization. Microscopic analysis was performed using FV10i software (Olympus), ImageJ (NIH Image, version 1.53a, USA), and Adobe Photoshop CS6 software (Adobe Systems Incorporated).
Image Analysis for Colocalization
To detect the colocalization of the fluorescence signal from cells’ receptor - Ceacam1 and the viral antigen, a minimum of 100 images were used. Images were analyzed using the Fiji BIOP JACoP plug-in. The analysis involved two channels: green fluorescence corresponding to the viral antigen and far-red fluorescence for Ceacam1. The quantitative interpretation of pixel correlation coefficients, in the form of threshold parameters of Pearson’s correlation coefficient (PCC) and Manders’ correlation coefficient (M1 and M2) of global statistical analysis, were considered for statistical analysis, considering pixel intensity distributions from fluorogram plots.68 The degrees of correlation were indicated as perfect for values near ± 1, strong for values between ± 0.50 and ± 1, medium for values between ± 0.30 and ± 0.49, and low for values below + 0.29.
Scanning Electron Microscopy (SEM)
Murine hepatocytes were seeded on microscopic slides placed in a 24-well plate at a density of 3×10⁵ cells per well. Cells were left uninfected or: (i) pre-treated with GO-Ag composite and infected with MHV-JHM for 1 h at 37°C, or (ii) infected with MHV-JHM for 1 h at 37°C and post-treated with GO-Ag composite for 24 h at 37°C. Next, hepatocytes grown on microscopic slides were fixed for 2 h with 2.5% glutaraldehyde in phosphate buffer. After that, the coverslips were washed with phosphate buffer and post-fixed for 1 h in 1% OsO4 with 0.8% potassium ferrocyanide. After another washing cycle, the samples were dehydrated through a series of increasing concentrations (30%–100%) of ethanol and acetone (2x 30 min) and dried in a CPD 7501 critical point drier (Polaron; Hatfield, PA, USA). Cells were then coated with a gold layer in a JFC-1300 sputter-coater (JEOL, Tokyo, Japan). The SEM imaging was operated under FEI Quanta 200 environmental scanning electron microscope (ESEM) with an EDAX EDS system (FEI, Tokyo, Japan).
Statistical Analysis
The results were statistically evaluated by two-way analysis of variation (ANOVA) using the Tukey multiple comparisons test or multiple unpaired t-tests using threshold p-value with the Dunnett multiple comparisons correction method. All experiments were done at least in triplicate. These analyses were performed using GraphPad PrismTM version 9.4.0 (453) for macOS software (GraphPad Software Inc., San Diego, CA, USA). Statistical differences were interpreted as significant at p ≤ 0.05 (*), highly significant at p ≤ 0.01 (**), extremely significant at p ≤ 0.001 (***) and not significant at p > 0.05.
Results
Characterization of AgNPs, GO, and GO-Ag Composite
The size distribution and morphology features of the nanomaterials are shown in Figure 2. AgNPs exhibited the smallest hydrodynamic diameter at 108.6 nm, contrasting with GO, which presented the largest at 1235 nm. Nevertheless, GO was non-spherical, as shown by TEM analysis (Figure 2D). Bare GO showed a size exceeding 1000 nm, while the size of bare AgNPs ranged from 8 to 97 nm (Figure 2E). Differences between the size values obtained from DLS and TEM analysis are due to the formation of agglomerates by small-sized AgNPs and the flake-like structure of GO. However, GO was an excellent carrier for AgNPs. Due to its large surface area, GO provides an excellent platform for bonding with other metal nanoparticles.69,70
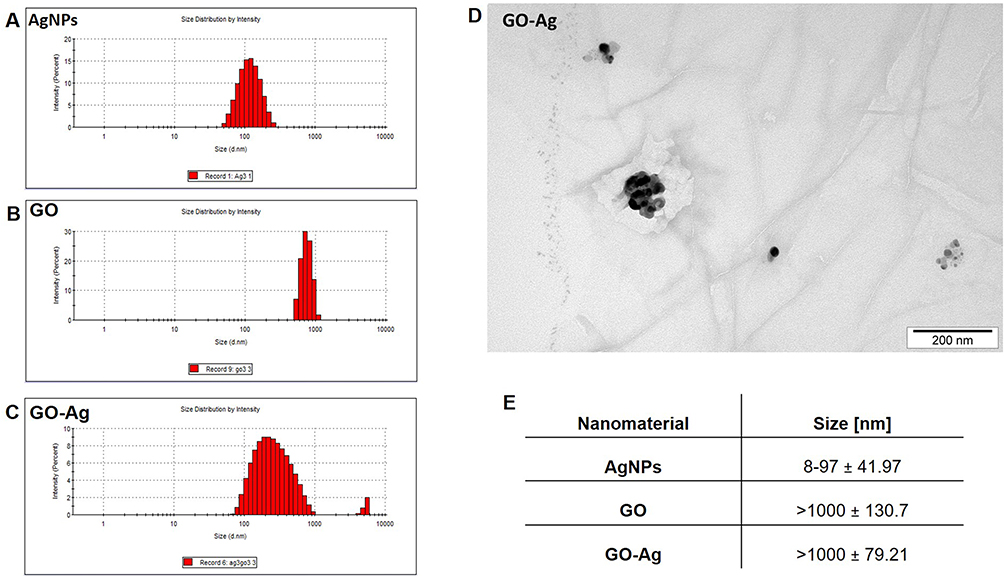 |
Figure 2 Particle size and morphology. Abbreviations: DLS, dynamic light scattering; TEM, transmission electron microscope; GO, graphene oxide; AgNPs, silver nanoparticles. Notes: (A–C), size measurement (DLS) of AgNPs, GO, and Ag-GO complex; (D) TEM visualization of Ag-GO; (E) particle size based on TEM visualization. |
All nanomaterials used indicated negative zeta potential (Table 1). AgNPs at their lowest concentration (3 μg/mL) displayed comparatively less negative values than other nanoparticles. The newly formed nanocomposites exhibited zeta potential values closer to ± 30 mV than nanoparticles used alone, which suggests mutual stability between the two components, as supported by previous studies.71 FT-IR analysis showed that the bands at 3400 cm−1 and 2950 cm−1 are related to -OH and -CH groups, respectively, and were found in the spectra of all nanomaterials (Figure 3A). The C-O, C-C, C-O, and C=C stretches were found in the spectra of GO, AgNPs, and GO-Ag. Energy dispersive X-ray (EDX) analysis showed that the spectra of the nanocomposites were composed of Ag, C, and O atoms (Figure 3B). The strongest absorption band peak of Ag was around 3 keV. The presence of C and O is due to the structure of graphene oxide. Based on the weight (%), there was 4 times more Ag than carbon, which is consistent with the concentration of the nanocomposite (GO: 5 μg/mL and Ag 25 μg/mL).
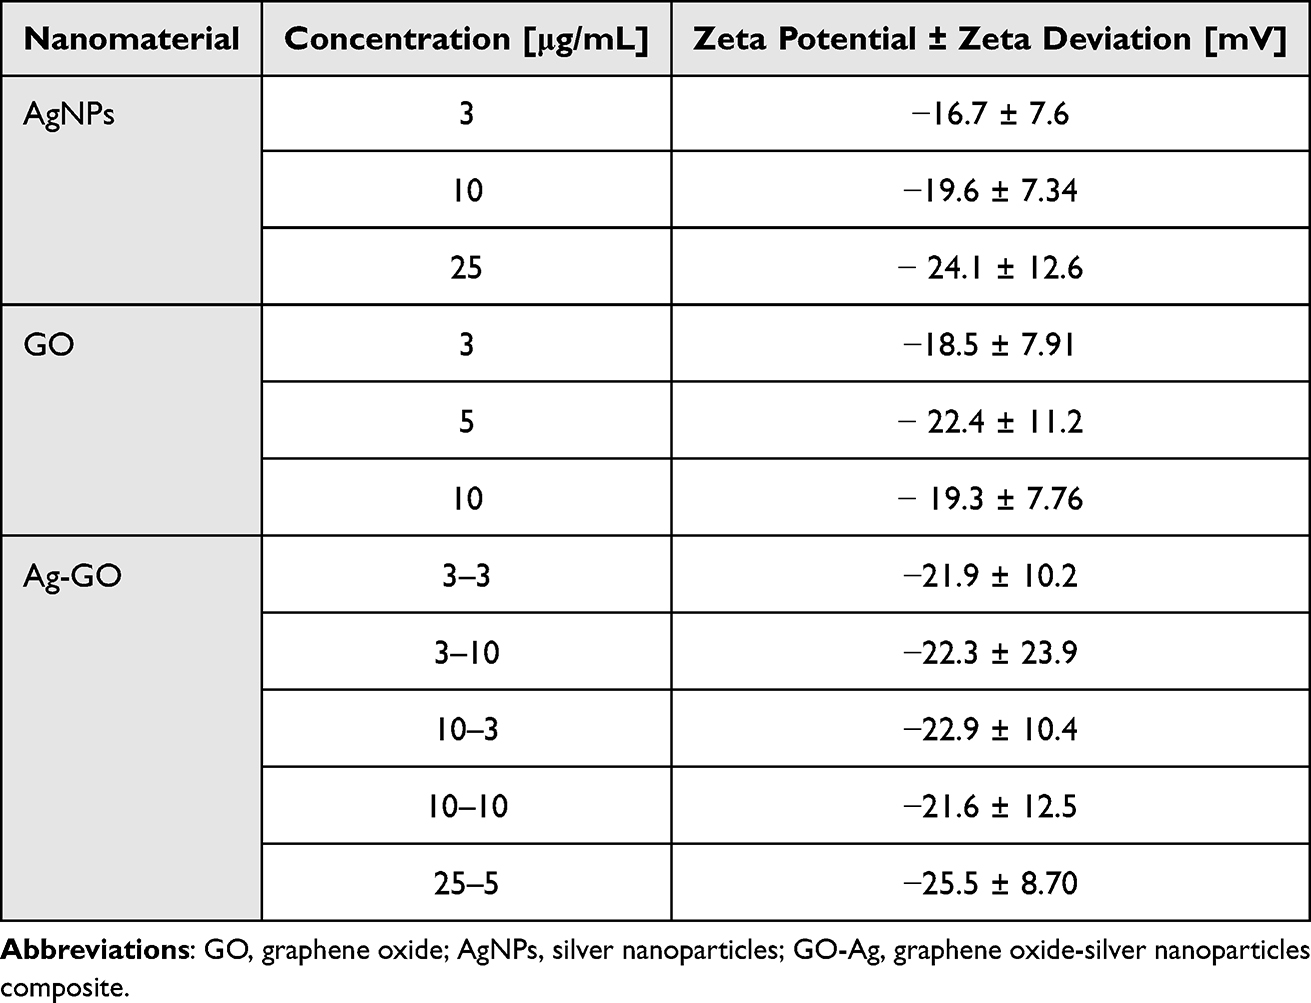 |
Table 1 Zeta Potential Values ± Zeta Deviation of Nanomaterials in Different Concentrations |
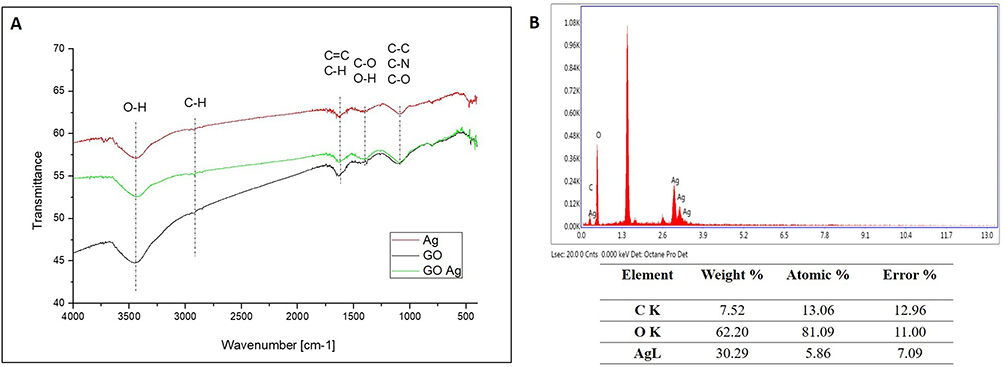 |
Figure 3 Chemical characteristics of the AgNPs, GO, and GO-Ag composite. Abbreviations: FT-IR, Fourier-transform infrared spectroscopy; EDX, Energy Dispersive X-ray detector attached with SEM; GO, graphene oxide; AgNPs, silver nanoparticles. Notes: (A) FT-IR spectra of the particles. Color markings: red, AgNPs; green, GO; and black GO-Ag composite, (B) EDX analysis used to identify the elemental composition of the particles. |
Cytotoxicity of AgNPs, GO and GO-Ag
The cytotoxicity of AgNPs, GO, and GO-Ag composite on murine hepatocytes was determined by an XTT-based cell proliferation assay (Figure 4). In GO-treated cells, the most significant reduction in cell viability was observed at a concentration of 50 µg/mL. After 24 and 48 hours of incubation, GO 50 µg/mL caused a 50% decrease in hepatocyte proliferation compared to the control. For the remaining GO concentrations used (3, 5, 10, and 25 µg/mL), a level of hepatocyte viability comparable to the control (100%) was observed (Figure 4A). In Ag-treated cells, the lowest viability after 24 hours was observed at 50 µg/mL, which has been shown to be highly cytotoxic to hepatocytes. The remaining concentrations of AgNPs (3, 5, 10, and 25 µg/mL) had no cytotoxic effect on hepatocyte viability (Figure 4B). However, the same tendency was not observed after incubation with AgNPs for 48 hours. Ag 10 µg/mL was found to reduce hepatocyte viability by 75% and Ag 25 µg/mL by up to 10%. The results of the XTT assay showed that the concentrations of GO-Ag nanocomposites used to determine its antiviral activity were non-cytotoxic. Following 24 and 48 hours of incubation with all concentrations of GO-Ag nanocomposite, the viability of cultured hepatocytes remained at a level comparable to the control (100%) (Figure 4C).
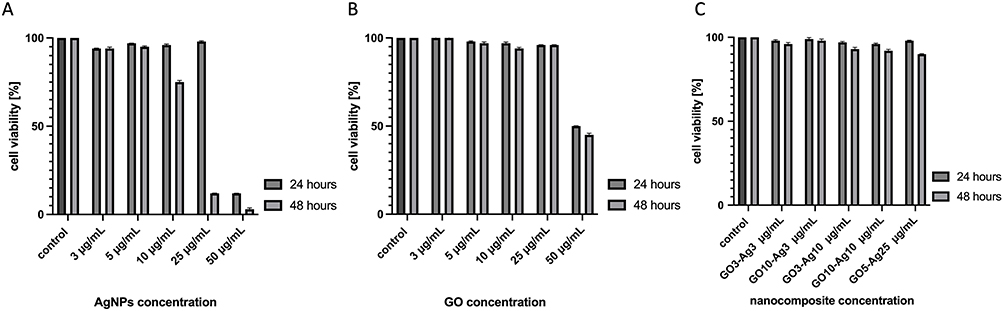 |
Figure 4 Cell viability after exposure to different concentrations of GO (A), AgNPs (B), and GO-Ag composite (C), evaluated using cell proliferation XTT assay. Abbreviations: GO, graphene oxide; AgNPs, silver nanoparticles; GO-Ag, graphene oxide-silver nanoparticles composite; XTT, cytotoxicity test, cell viability test. |
Cytopathic Effect and MHV-JHM Titer
The morphology and cytopathic effect (CPE) induced by the MHV-JHM strain on hepatocytes were examined using the JuLI™Br Live Cell Analyzer. The typical cytopathic effect (CPE) of coronavirus infection, including MHV-JHM, is the formation of multinucleated giant cells due to intercellular fusion (Figure 5). The formation of syncytial cells can be observed as early as 8 h p.i. (hour post infection) (Figure 5C; red circles), followed by the rounding of the cells and finally their detachment until the entire monolayer has been destroyed (18–24 h p.i). (Figure 5E and F). These results were confirmed by a graph of the confluence level of cells – starting from 8 h p.i., an intense decrease in the confluence level was observed (from 90% to 20%) (Figure 5G).
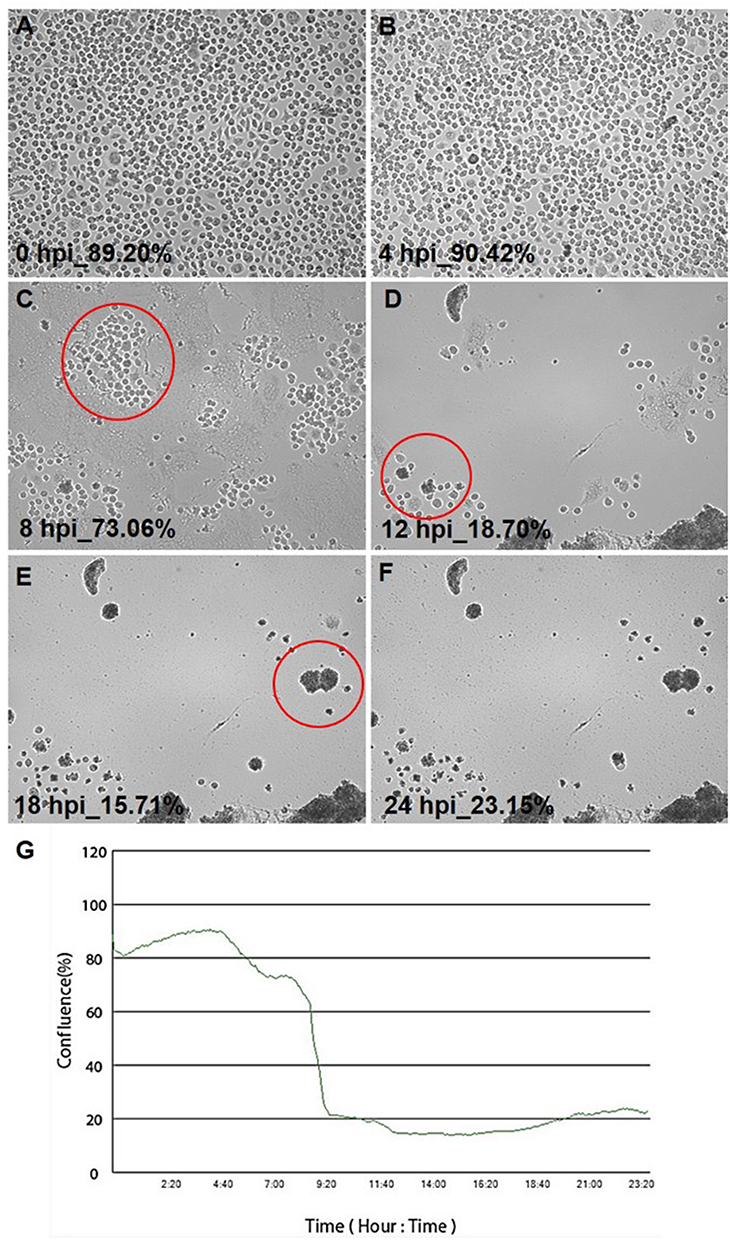 |
Figure 5 Real-time cell growth analysis of murine hepatocytes infected with MHV-JHM performed by using live image move analyzer JuLi™Br. Abbreviations: MHV-JHM, murine hepatitis virus JHM strain; hpi, hour post infection. Notes: Cultures were observed for 24 h from initial seeding (A-F). Syncytia formation is indicated by red circles. The generated graph shows the percentage of cells’ confluence level [%] during the complete analysis (G). All images were recorded every 5 min, and monolayer confluence was analyzed. Objective magnification × 40. |
The titer of MHV-JHM, using 0.1 mL of viral inoculum, evaluated according to the improved Kärber method, was 107.8 TCID50.
Virus Inhibition of GO-Ag Composite
In order to determine the potential antiviral effect of the GO-Ag composite, the MHV-JHM titer was examined using the method of the presence/absence of CPE in murine hepatocytes. The MHV-JHM titer was evaluated in cell culture with varying concentrations of each nanocomposite solution, using two distinct methods (Figure 1). Moreover, the antiviral activity of GO (GO 3 µg/mL, GO 5 µg/mL, and GO 10 µg/mL) and AgNPs (Ag 3 µg/mL, Ag 10 µg/mL, and Ag25 µg/mL) was tested separately under the same conditions for comparison with GO-Ag nanocomposites (positive control). The principle of the study was to determine the possibility of MHV-JHM inactivation by graphene oxide-silver nanoparticle composites, graphene oxide, and AgNPs based on the decrease in infectious titer of the virus.
The studies showed that all of the GO-Ag composites tested resulted in a statistically significant reduction of the virus titer between 3.2 and 7.3 logarithms (log10 TCID50) (Figure 6). In the first method (pre-incubation and infection), the greatest virus titer reduction was obtained for GO 5 µg/mL - Ag 25 µg/mL composite (reduction of 5.8 log10 TCID50 compared to the stock virus titer) (Figure 6A). In the second method (infection and post-incubation), the greatest MHV-JHM titer reduction was also obtained for GO 5 µg/mL - Ag 25 µg/mL composite (reduction of 7.3 log10 TCID50 compared to the stock virus titer) (Figure 6B).
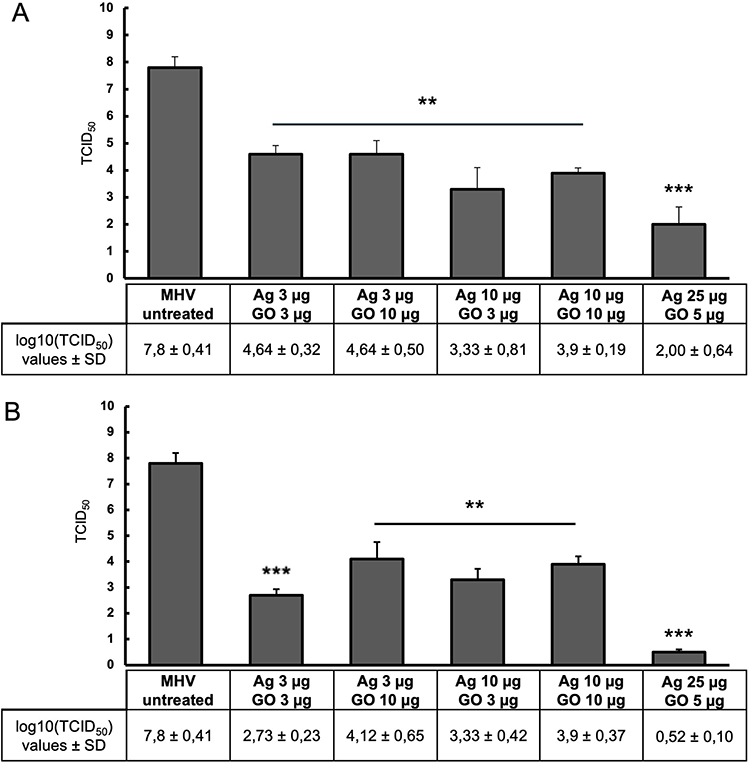 |
Figure 6 The antiviral activity of GO-Ag composites. Virus titration on murine hepatocytes (24 h p.i.). Abbreviations: MHV-JHM, murine hepatitis virus JHM strain; GO-Ag, graphene oxide-silver nanoparticles composite; log, logarithm; TCID, tissue culture infectious dose; SD, standard deviation. Notes: (A) pre-incubation and infection (MHV-JHM was incubated for 1 hour with the following concentrations of GO-Ag composites); (B) infection and post-incubation with GO-Ag composites. Data are presented as mean ± standard deviation (SD) (n = 3). Tukey’s multiple comparison test is highly significant at p ≤ 0.01 ** and extremally significant at p ≤ 0.001 ***. |
When the nanocomposite components were used separately, a reduction in virus titer was also observed, but at a lower level compared to the GO-Ag composite (Figures 8 and 9). In the first method (pre-incubation and infection), the greatest reduction in virus titer was obtained for Ag 25 µg/mL (reduction of 3.3 log10 TCID50 compared to the stock virus titer) (Figure 8A). In the second method (infection and post-incubation), the greatest MHV-JHM titer reduction was also obtained for Ag 25 µg/mL (reduction of 4.2 log10 TCID50 compared to the stock virus titer) (Figure 8B). All GO concentrations tested resulted in statistically insignificant reductions in virus titer ranging from 0.8 to 1.4 log10 TCID50 (Figure 9).
Further experiments were performed to determine whether the MHV-JHM titer underwent changes after completing a full replication cycle in hepatocytes and following the application of GO-Ag. For this purpose, after incubation with MHV-JHM and nanocomposites, the culture supernatant was collected from each well and used to infect fresh cultures of murine hepatocytes according to the scheme shown in Figure 1. All tested GO-Ag composites resulted in a statistically significant reduction in virus titer, ranging between 3.2 and 8.14 log10 TCID50 after the second passage in hepatocyte cells (Figure 7). In the first method (pre-incubation and infection), the most substantial reduction in virus titer was obtained for the GO 5 µg/mL - Ag 25 µg/mL composite (reduction of 8.14 logarithm compared to the control virus titer) (Figure 7A). In the second method (infection and post-incubation), remarkably high MHV-JHM titer reduction was also obtained for all GO-Ag composites (reduction of 7.47–8.14 log10 TCID50 compared to the control virus titer) (Figure 7B).
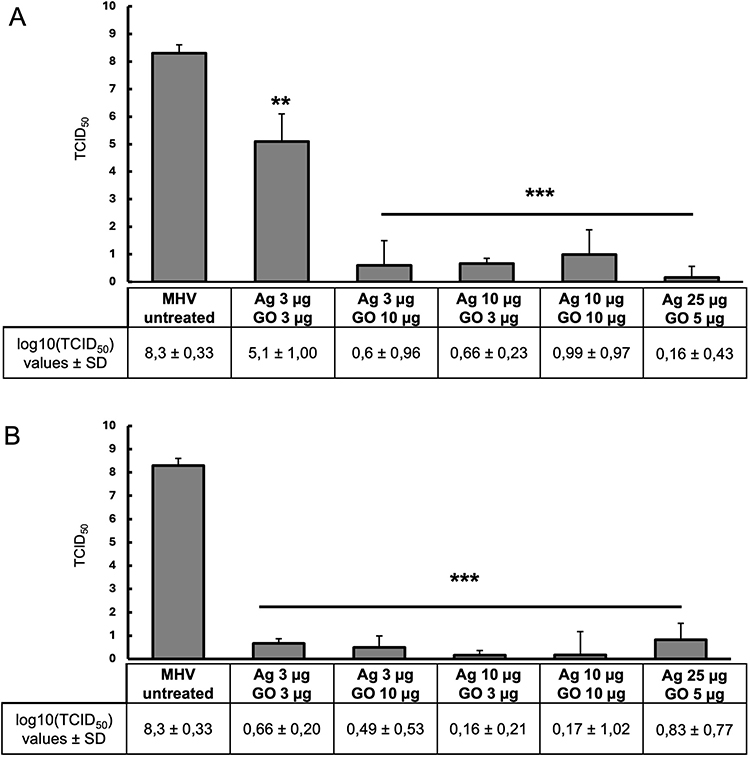 |
Figure 7 Virus titration in the cell culture supernatant collected at 24 h p.i., after initial (24 h) incubation of cells with GO-Ag nanocomposite. Abbreviations: MHV-JHM, murine hepatitis virus JHM strain; GO-Ag, graphene oxide-silver nanoparticles composite; log, logarithm; TCID, tissue culture infectious dose; SD, standard deviation. Notes: (A) pre-incubation and infection (MHV-JHM was incubated for 1 hour with the following concentrations of GO-Ag composites); (B) infection and post-incubation with GO-Ag composites. Data are presented as mean ± standard deviation (SD) (n = 3). Tukey’s multiple comparison test was significant at p ≤ 0.01 ** and extremally significant at p ≤ 0.001 ***. |
Reverse transcription quantitative real-time PCR (RT-qPCR) was used to detect viral RNA in hepatocyte cells pre- and post-incubated with various concentrations of GO-Ag composites, GO and, AgNPs to determine their effect on virus replication (Figures 10 and 11). The RT-qPCR analysis showed a significant decrease in MHV-JHM RNA copy number in GO-Ag treated cells compared to infected GO-Ag untreated control (7.67±2.08 × 10¹⁰ copies/µg RNA) (Figure 10A and B). The highest significant decrease in viral RNA copy number in hepatocytes was observed after post-incubation with the following composites: GO 3 µg/mL - Ag 3 µg/mL (1.48±1.0 × 10⁵ copies/µg RNA), GO 10 µg/mL - Ag 3 µg/mL (5.03±6.86 × 10⁵ copies/µg RNA), GO 3 µg/mL - Ag 10 µg/mL (3.94±5.56 × 10⁴ copies/µg RNA) and GO 5 µg/mL - Ag 25 µg/mL (1.07±1.37 × 10⁵ copies/µg RNA) (Figure 10B). Additionally, a significant decrease in viral RNA copy number was noted in cells pre-incubated with GO-Ag composites and infected at 24 h. The highest decrease in viral RNA copy number was observed after pre-incubation with GO 5 µg/mL - Ag 25 µg/mL composite (2.24±4.49 × 10⁶ copies/µg RNA) compared to control untreated cells (7.67±2.08 × 10¹⁰ copies/µg RNA) (Figure 10A).
After using AgNPs, the highest statistically significant decrease in viral RNA copy number in hepatocytes was observed after pre-incubation with Ag 10 µg/mL (7.22±4.7 × 10⁶ copies/µg RNA) and Ag 25 µg/mL (9.26±7.84 × 10⁶ copies/µg RNA) and post-incubation with the following concentrations: Ag 3 µg/mL (9.76±7.31 × 10⁶ copies/µg RNA), Ag 10 µg/mL (7.17±7.2 × 10⁵ copies/µg RNA) and Ag 25 µg/mL (1.25±9.5 × 10⁶ copies/µg RNA) compared to control untreated cells (7.67±2.08 × 10¹⁰ copies/µg RNA) (Figure 11A and B). In addition, a significant decrease in viral RNA copy number was observed in cells pre-incubated with GO 3 µg/mL and GO 5 µg/mL (9.33±8.37 × 10⁷ copies/µg RNA and 8.87±4.87 × 10⁷ copies/µg RNA, respectively) compared to untreated control cells (7.67±2.08 × 10¹⁰ copies/µg RNA) (Figure 11A).
To determine and confirm the inhibitory effect of GO 5 µg/mL - Ag 25 µg/mL composite treatment on cell growth and morphology of MHV-JHM-infected hepatocytes, real-time cell growth analysis (JuLI™ Br) was performed (Figure 12). Hepatocytes infected with MHV-JHM and incubated with GO 5 µg/mL - Ag 25 µg/mL composite remained unchanged with retained ability to proliferate. The cytopathic effect of syncytia formation was not observed. These observations were confirmed by quantifying cell confluence and generating a growth curve using image-based analysis (Figure 12).
Effect of GO-Ag Composite on the Distribution of the Viral Antigen and the Entry Receptor of MHV-JHM in Murine Hepatocytes
The distribution of the viral antigen and the entry receptor of MHV-JHM in murine hepatocytes was examined by confocal microscopy at 2, 18, and 24 h p.i. (Figure 13). In uninfected and untreated cells, a uniform distribution of the antigen for the Ceacam1 receptor was observed over the entire cell surface (Figure 13B). In the infected cells, where the viral antigen was already present in the early hours after infection (2 h), the distribution of the Ceacam1 receptor was similar in the form of intense, evenly distributed punctate fluorescence (Figure 13B). In the images of cells pre- and post-treated with GO-Ag composite, the viral antigen was also visible, but the changes in the distribution of the Ceacam1 receptor could be observed (Figure 13A). It was no longer evenly distributed on the cell surface but appeared in the form of intensely fluorescent accumulations.
Bioinformatic analysis of the Pearson correlation coefficient (PCC) of the hepatocyte Ceacam1 cell receptor with viral antigen was used to test how GO 5 µg/mL - Ag 25 µg/mL composite modulate the distribution of the Ceacam1 receptor and whether they affect the efficiency of virus entry into the cell (pre-treatment method; A) or release progeny virions after treatment with nanocomposites (post-treatment method; B) (Figure 13C). Untreated controls were MHV-JHM-infected cells without nanocomposite addition. In these samples, PCC showed a high correlation of 0.8, indicating colocalization of the cell receptor with the viral antigen. In contrast, in hepatocyte cells pre- and post-incubated with GO 5 µg/mL - Ag 25 µg/mL composite, a highly significant decrease in PCC was observed, which oscillated below 0.4 at all-time points after infection. These values are defined as no correlation. The most significant decrease in values was observed in the pre-treatment method (A) 18 h p.i. with MHV-JHM (Figure 13C).
Ultrastructural Analysis of Cell Morphology After MHV-JHM Infection and GO-Ag Composite Treatment by High-Resolution SEM
Consistent with the above observation, we performed an analysis of the cell surface of infected hepatocytes pre- and post-incubated with GO 5 µg/mL - Ag 25 µg/mL composite using scanning electron microscopy (SEM). As determined by SEM, hepatocytes in the control untreated sample had multiple protrusions, and in positive control (cells treated with nanocomposite), the cells were covered by GO-Ag sheets, and a thinning of protrusions was observed (Figure 14, red boxes and arrowheads). The GO-Ag treated cells were more oval and denser compared to the control cells (Figure 14). In positive control, MHV-JHM infected hepatocytes maintained the ability to form filopodia and connection between neighboring cells (supporting efficient virus spread) (Figure 14, red boxes and arrowheads). 18 h p.i. the entire replication cycle of MHV-JHM occurs, which is present in cell morphology as numerous cell blebbing and formation of apoptotic bodies. In the pre-treatment method, which implies limiting virus entry into the cell, the protrusions were visible, but the apparent change in cell morphology was present. No blebbing or apoptosis was noted. In the post-treatment method, in which the budding of progeny virions should be interrupted, it was possible to notice less prominent cell projections. The morphology of cells was rounded, but no apoptotic bodies or blebbing occurred even at 18 h p.i. (Figure 14).
Discussion
Coronaviruses, in particular SARS-CoV2, are mainly transmitted by respiratory droplets and aerosols during direct person-to-person contact, and due to their high stability, contaminated surfaces can also pose a real threat of transmission.72–74 Approaches to combat the pandemic include exposure reduction, vaccination, and the development and evaluation of novel or already approved drugs that reduce the infectivity of the virus. Apart from the use of antiviral drugs, the decontamination of surfaces and personal protective equipment (PPE) is critical to reducing infections.75
The field of nanotechnology has been growing rapidly over the past decade and nanomaterials are now being used in a variety of applications. They exhibit a broad spectrum of antiviral activities, such as inhibiting receptor binding of viral particles to host cell surface structures, interacting with the viral envelope and degrading its structure, or degrading viral particles by generating reactive oxygen species (ROS).20,21,25,27,44,76,77 These properties make them highly promising candidates for virus neutralization by therapeutics or surface coatings.
Extensive experimental evidence supports the antiviral activity of silver nanoparticles (AgNPs)27,29–39 and graphene oxide (GO).51,52,63 In this study, we investigated the potential antiviral activity of GO and AgNPs combined in a nanocomposite GO-Ag, against murine coronavirus MHV-JHM using an in vitro model.
Previous studies have shown that the formation of complexes of AgNPs and GO ensures better stabilization of the components, which is particularly important in the case of silver nanoparticles, which are known for their tendency to form agglomerates that can weaken their antimicrobial properties.45,51,61,78–80 This was evident in our study, as the GO-Ag complex exhibited a zeta potential close to ±26 mV, indicating that the complex was characterized by better colloidal stability than the individual components (Table 1). The size distribution of GO indicated the presence of large nanoparticles/agglomerates exceeding 1000 nm in diameter. The TEM analysis showed that GO was in the form of flakes, and GO provided a large platform for attaching AgNPs to its surface, creating a carrier to transport smaller particles (Figure 2). The presented spectra from FT-IR analysis are characteristic of all nanomaterials. The stretches C-O, C-C, C-O, and C=C were found in the spectra of GO, AgNPs, and GO-Ag. (Figure 3). In addition, silver particles anchored on graphene oxide sheets showed non-cytotoxic effects on cells susceptible to the coronavirus used. After incubation with all investigated concentrations of GO-Ag nanocomposite, the viability of cultured hepatocytes remained at a level comparable to the control (100%) (Figure 4). It should be noted that after 48 hours of incubation with non-complexed AgNPs, the viability of cultured hepatocytes decreased up to 75% for (Ag 10 µg/mL) and 10% (for Ag 25 µg/mL), whereas the GO concentrations used (3, 5, 10 and 25 µg/mL) maintained a level of hepatocyte viability comparable to the control (100%). It seems that the attachment of AgNP to the graphene oxide (GO) flake platform reduces its toxicity. Moreover, due to its low toxicity and remarkable physical properties, GO seems to be an excellent carrier for AgNP. Obtained results are in agreement with previous study by Jaworski et al (2018) in which they investigated the toxicity of a foil dressing to which the AgNP-GO complex was applied.70,81 The introduction of GO into the complex reduced the cytotoxicity of silver without reducing its antimicrobial properties. In addition, results from zebrafish studies suggest that GO is a preferred delivery platform due to its low toxicity and also reduces AgNP toxicity.82
To determine the antiviral effect of the different concentrations of each GO-Ag nanocomposite, as well as its components (AgNP and GO), after pre-treatment (pre-incubation and infection) and post-treatment (infection and post-incubation), the virus titer was assessed by the presence or absence of cytopathic effect (CPE) in a murine hepatocyte cell line using a TCID50 assay. The results obtained indicate a statistically significant reduction in virus titer ranging between 3.2 and 7.3 log (log10 TCID50) for all the nanocomposites tested. The greatest reduction in MHV-JHM titer was observed for the GO 5 µg/mL - Ag 25 µg/mL composite, particularly in the post-treatment method (Figure 6).
The question arises as to whether the antiviral effect of the GO-Ag composite is greater than that of its individual components - GO and AgNPs. Our data showed that when the components of the nanocomposite were used separately, a reduction in the titer of the virus was also observed, but at a lower level than in the case of GO-Ag composite. The results obtained indicate a statistically significant reduction in virus titer ranging from 2.4 to 4.2 log (log10 TCID50) for AgNPs and from 0.8 to 1.2 log (log10 TCID50) for GO. The greatest reduction in the titer of MHV-JHM was observed for Ag 25 µg/mL and GO 5 µg/mL, GO 10 µg/mL, especially in the post-treatment method (Figures 8 and 9). These results were further confirmed by RT-qPCR analysis (Figure 10). The higher significant decrease in viral RNA copy number in hepatocytes was observed after post-incubation with the following composites: GO 3 µg/mL - Ag 3 µg/mL, GO 10 µg/mL - Ag 3 µg/mL, GO 3 µg/mL - Ag 10 µg/mL and GO 5 µg/mL - Ag 25 µg/mL compared to untreated control cells and compared to the effects of AgNPs and GO separately (Figure 11).
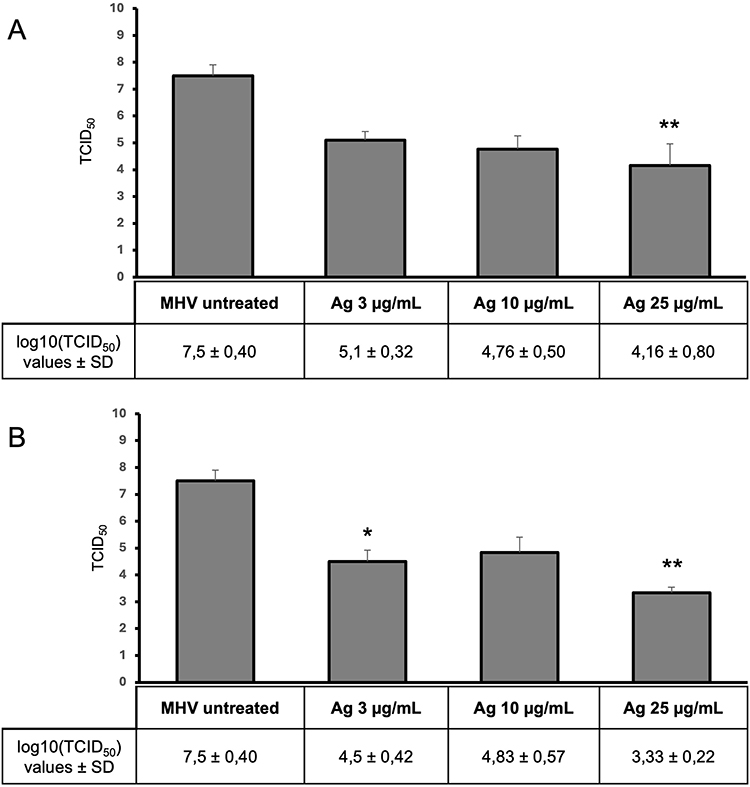 |
Figure 8 The antiviral activity of silver nanoparticles (AgNPs). Virus titration on murine hepatocytes (24 h p.i.). Abbreviations: MHV-JHM, murine hepatitis virus JHM strain; AgNPs, silver nanoparticles; log, logarithm; TCID, tissue culture infectious dose; SD, standard deviation. Notes: (A) pre-incubation and infection (MHV-JHM was incubated for 1 hour with the following concentrations of AgNPs); (B) infection and post-incubation with AgNPs. Data are presented as mean ± standard deviation (SD) (n = 3). Tukey’s multiple comparison test is significant at p ≤ 0.01* and highly significant at p ≤ 0.001 **. |
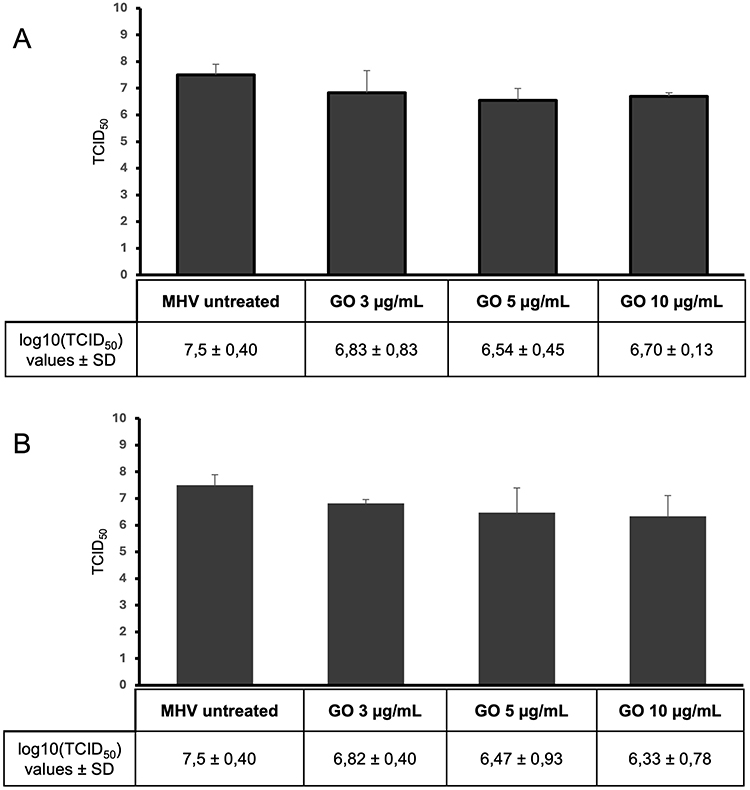 |
Figure 9 The antiviral activity of graphene oxide (GO). Virus titration on murine hepatocytes (24h p.i.). Abbreviations: MHV-JHM, murine hepatitis virus JHM strain; GO, graphene oxide; log, logarithm; TCID, tissue culture infectious dose; SD, standard deviation. Notes: (A) pre-incubation and infection (MHV-JHM was incubated for 1 hour with the following concentrations of GO); (B) infection and post-incubation with GO. Data are presented as mean ± standard deviation (SD) (n = 3). |
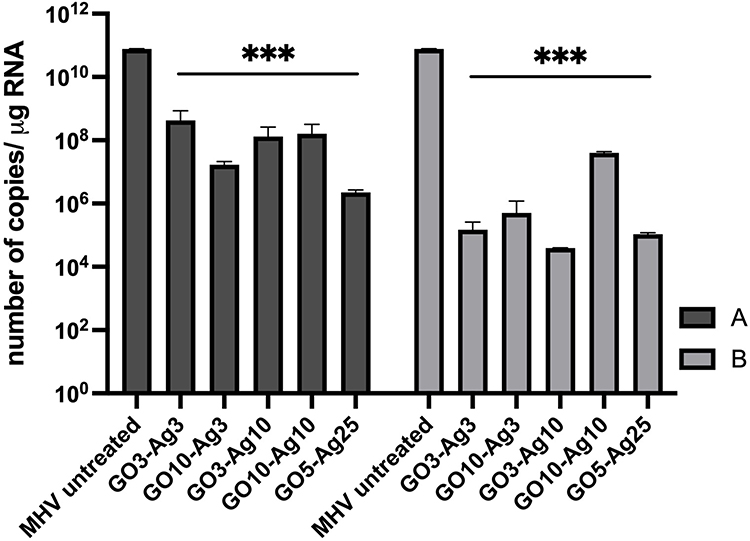 |
Figure 10 RT-qPCR analysis of MHV-JHM viral RNA copies per µg during 24 h p.i. in murine hepatocytes. Abbreviations: RT-qPCR, reverse transcription quantitative real-time polymerase chain reaction; MHV-JHM, murine hepatitis virus JHM strain; GO-Ag, graphene oxide-silver nanoparticles composite; SD, standard deviation, h p.i., hour post infection. Notes: Treatment effect of different concentrations of each GO-Ag nanocomposite solution on MHV-JHM replication. (A) pre-incubation with GO-Ag and infection, (B) infection and post-incubation with GO-Ag. Data are the mean of three independent experiments (n = 3). Data are presented as mean ± standard deviation (SD) (n = 3). Tukey’s multiple comparison test extremally significant at p ≤ 0.001 ***. |
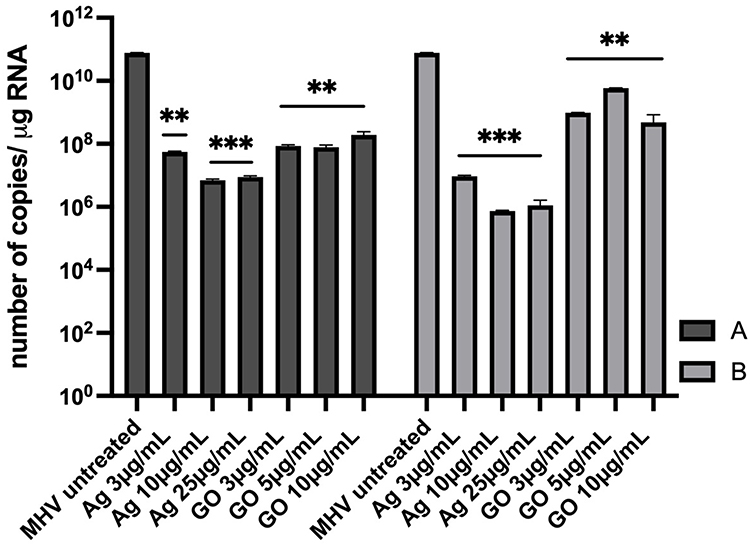 |
Figure 11 RT-qPCR analysis of MHV-JHM viral RNA copies per µg during 24 h p.i. in murine hepatocytes. Abbreviations: RT-qPCR, reverse transcription quantitative real-time polymerase chain reaction; MHV-JHM, murine hepatitis virus JHM strain; AgNPs, silver nanoparticles; GO, graphene oxide; SD, standard deviation, h p.i., hour post infection. Notes: Treatment effect of different concentrations of AgNPs and pure GO on MHV-JHM replication. (A) pre-incubation with AgNPs or GO and infection, (B) infection and post-incubation with AgNPs or GO. Data are the mean of three independent experiments (n = 3). Data are presented as mean ± standard deviation (SD) (n = 3). Tukey’s multiple comparison test is highly significant at p ≤ 0.01 ** and extremally significant at p ≤ 0.001 ***. |
A particularly strong antiviral effect of the GO-Ag composite and its components in the post-treatment method is probably due to the fact that the continuous presence of the composite interferes with the efficiency of viral replication. Our hypothesis that the GO-Ag composite interferes with the processes between virus entry and exit from the cell is also supported by results of the experiment in which we used culture medium from infected cells treated with GO-Ag (according to the scheme shown in Figure 1) to perform a TCID50 assay in a new hepatocyte culture. The results showed that all the GO-Ag composites tested resulted in a statistically significant reduction in virus titer - ranging from 3.2 to 8.14 log10 TCID50 after the second passage in hepatocytes, which was particularly marked after the post-treatment method (Figure 7). This reduction was significantly higher than that observed during the first MHV-JHM infection (Figure 6).
The strongest antiviral activity of the GO 5 µg/mL - Ag 25 µg/mL composite was further validated through real-time cell growth analysis (JuLI™ Br). Hepatocytes infected with MHV-JHM and incubated with the nanocomposite remained unchanged, devoid of characteristic morphological alterations associated with cytopathic effects, and retained their proliferative capacity (Figure 12).
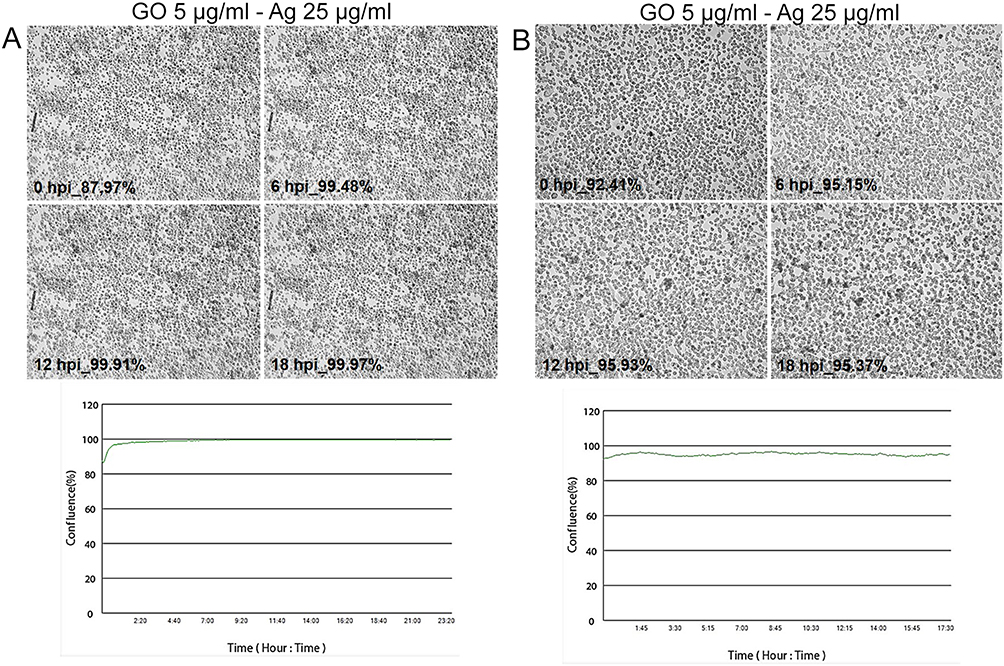 |
Figure 12 Real-time cell growth analysis of murine hepatocytes infected with MHV-JHM and treated with GO 5 µg/mL - Ag 25 µg/mL composite, performed by using live image move analyzer JuLi™Br. Abbreviations: MHV-JHM, murine hepatitis virus JHM strain; GO-Ag, graphene oxide-silver nanoparticles composite; hpi, hour post infection. Notes: (A) pre-incubation with GO-Ag and infection, (B) infection and post-incubation with GO-Ag. Cultures were observed from initial seeding for 18 h. The generated graph shows the percentage of cells’ confluence level [%] during complete analysis. All images were recorded every 5 min and analysed for monolayer confluence. Objective magnification × 40. |
The results presented also indicate that pre-incubation of the virus with the GO-Ag composite reduces, but does not completely inhibit, the efficiency of virus adsorption into the cell (Figure 6). Graphene-based nanocomposites can inhibit viral infection in several ways, including blocking the binding of viruses to their host receptors, preventing viral replication, and directly inactivating viruses.83 The antiviral effects of silver nanoparticles are also attributed to the disruption of the outer layer of the coronavirus.84 The results obtained indicate that the GO 5 µg/mL - Ag 25 µg/mL composite modulates the distribution of the Ceacam1 cell receptor, which may affect the efficiency of virus entry into the cell (pre-treatment method) or the release of progeny virions after treatment with nanocomposites (post-treatment method) (Figure 13). Bioinformatic analysis of the correlation coefficient of hepatocyte Ceacam1 cell receptor with viral antigen showed a significant decrease in PCC, defined as no correlation, after GO-Ag composite treatment (Figure 13C). In addition, scanning electron microscopy visualization showed the adherence of GO-Ag composite platelets to hepatocytes. The GO-Ag treated cells exhibited a more oval and dense morphology with shorter processes compared to the control cells, which could potentially affect the efficient spread of the virus (Figure 14).
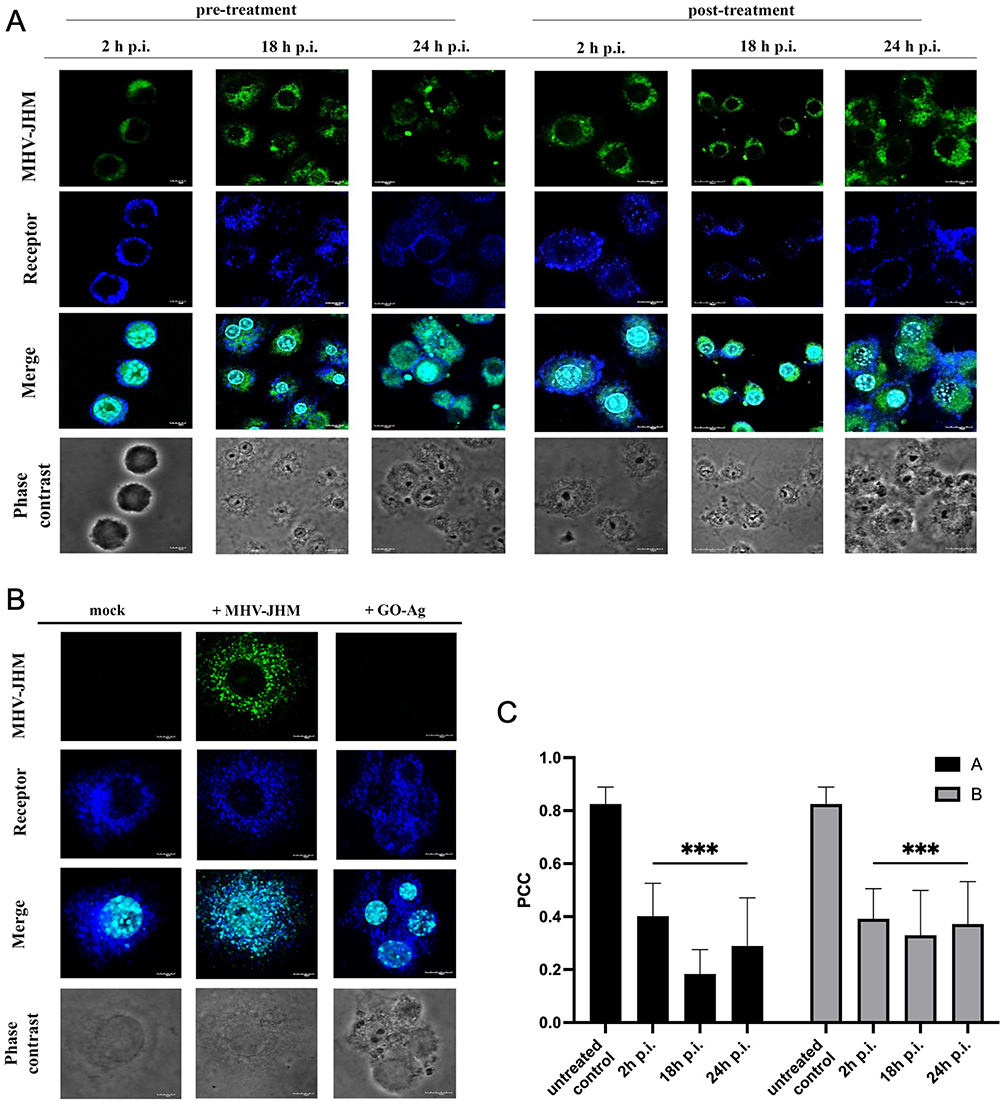 |
Figure 13 Confocal representative images of MHV-JHM infected hepatocytes treated with nanocomposites GO 5 µg/mL - Ag 25 µg/mL in pre-treatment (A), and post-treatment (B) method. Abbreviations: MHV-JHM, murine hepatitis virus JHM strain; GO-Ag, graphene oxide-silver nanoparticles composite; Ceacam1, carcinoembryonic antigen related cell adhesion molecules; mock, non-infected and non-treated cells; h p.i., hour post infection; PCC, Pearson correlation coefficient. Notes: Indirect and direct immunofluorescence staining; viral antigen – green; Ceacam1 receptor – deep blue; cell nuclei - blue;. Microscope magnification 60x, scale 30 µm (A and B). Grouped colocalization analysis for entry receptor – Ceacam1 with MHV-JHM viral antigen. Thresholded Pearson correlation coefficient analyses (presented as the mean and standard deviation) as a function of time for data from ≥100 cells in three independent experiments for each experimental condition. Histograms comparing correlations (presented as the mean and standard deviation) at 2, 18 and 24 h p.i. (C). Tukey’s multiple comparison test extremally significant at p ≤ 0.001 ***. |
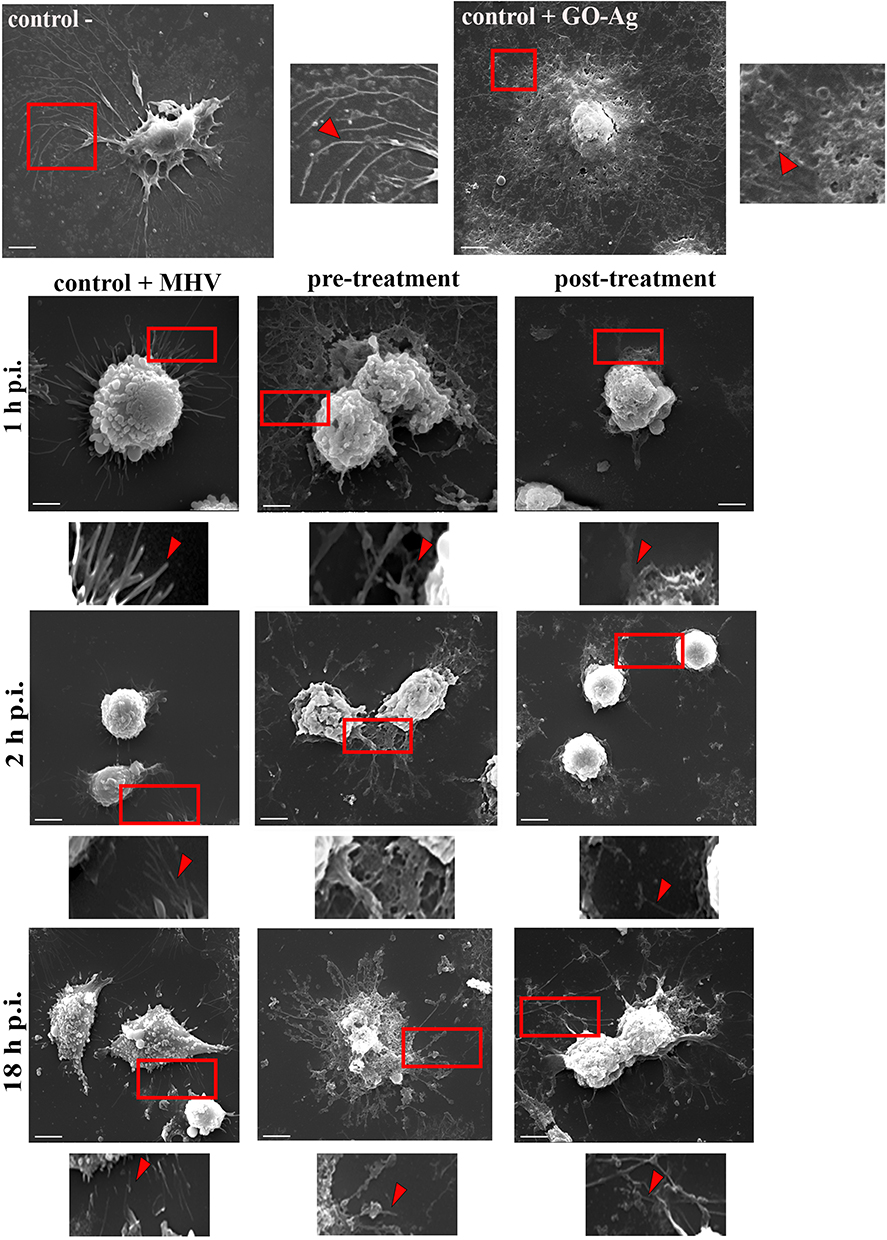 |
Figure 14 Scanning electron microscopy micrograph of hepatocyte surface. Abbreviations: MHV-JHM, murine hepatitis virus JHM strain; GO-Ag, graphene oxide-silver nanoparticles composite; h p.i., hour post infection. Notes: Effect of MHV-JHM infection and nanocomposite GO 5 µg/mL - Ag 25 µg/mL treatment on host cell surface at 1, 2 and 18 h p.i. Red squares show magnified regions of cell protrusions morphology with and without surface treatment. Red arrowheads indicate a major change in cell protrusions number and architecture. Scale 20 µm. |
Current research on the interaction between GO-Ag nanocomposites and viruses is still limited. In the literature reviewed for this study, one of the first reports by Chen et al (2016) found that GO sheets incorporated with silver particles exhibited antiviral activity against both enveloped and non-enveloped viruses, whereas GO sheets alone could only inhibit infection of enveloped viruses at non-cytotoxic concentrations.46 It was shown that the unique structure of graphene oxide sheets may contribute to the inhibition of infection by lipid-enveloped feline coronaviruses (FCOV).46 Studies of interactions between GO and lipid membranes have shown that negatively charged GO can adsorb to positively charged lipid membranes, leading to lipid membrane rupture.85 The exposed lipid tails from the ruptured lipid membrane would strongly associate with the aromatic plane of the GO sheet, facilitating the absorption of more lipid membranes.85,86 Du et al (2018) by, using the porcine reproductive and respiratory syndrome virus (PRRSV) as a pattern, showed that exposure to GO-Ag nanocomposites could suppress PRRSV infection.87 It was found that GO-Ag nanocomposites exhibited a better inhibitory effect compared to AgNPs and GO. Mechanism studies showed that GO-AgNPs nanocomposites might prevent PRRSV from entering the host cells, with 59.2% inhibition efficiency.87
In our case, it seems that GO acts as a trap, reducing the surface area of virus attachment to the cell membrane, covering the surface receptors, and by direct interaction, permanently binding the virus to the GO surface, thus deactivating it. On the other hand, the constant presence of the GO-Ag composite can inhibit the replication of the murine coronavirus and significantly limit its release from the cell.
Conclusion
The most common route of contracting a respiratory virus, like a coronavirus, is through direct contact with an infected person or through contaminated surfaces where the virus has settled. Therefore, the development of substrates, surfaces, and surface coatings capable of inactivating viral pathogens is critical for disinfecting high-touch surfaces in public transport systems and healthcare facilities. Graphene oxide (GO) presents itself as a promising candidate due to its biocompatibility, non-toxic nature, cost-effectiveness, high specific surface area, and remarkable ability to serve as a chemically tunable platform for conjugation, facilitated by its strong non-covalent interactions with adsorbed biomolecules, such as silver nanoparticles. In addition, graphene oxide sheets act as a stabilizing agent, inhibiting the agglomeration of silver nanoparticles and reducing cellular toxicity.
The present study shows that graphene oxide-silver nanocomposites exhibit remarkable inhibitory effects on murine coronavirus in vitro. Our results showed that the interaction of GO-Ag nanocomposite with cells is based on direct interaction with the cell membrane and interaction with surface receptors. Therefore, the use of the composite can inhibit viruses in physical binding and block the entry of MHV-JHM into the cells. In addition, the constant presence of the GO-Ag composite can inhibit murine coronavirus replication and significantly limit its release from the cell. To conclude, the application of such nanocomposites as antiviral coatings on solid surfaces could help minimize the transmission and spread of viruses, for example in public spaces or medical facilities, and reduce viral infections by limiting their adhesion to the cell or trapping them, for example from moving air.
Acknowledgments
This research was funded by the National Center for Research and Development in Poland, a project dedicated to COVID-19 Hospitals 23/2020. The publication was co-financed by the Science development fund of the Warsaw University of Life Sciences – SGGW.
Disclosure
The authors declare no competing interest in this work.
References
1. Walker PJ, Siddell SG, Lefkowitz EJ, et al. Changes to virus taxonomy and the statutes ratified by the international committee on taxonomy of viruses. Arch Virol. 2020;165(11):2737–2748. doi:10.1007/s00705-020-04752-x
2. Zhou Z, Qiu Y, Ge X. The taxonomy, host range and pathogenicity of coronaviruses and other viruses in the Nidovirales order. Anim Dis. 2021;1(5):1–28. doi:10.1186/s44149-021-00005-9
3. Mahalakshmi AM, Ray B, Tuladhar S, et al. Does COVID-19 contribute to development of neurological disease? Immun Inflamm Dis. 2021;9(1):48–58. doi:10.1002/iid3.387
4. Liu Y, Gayle AA, Wilder-Smith A, Rocklöv J. The reproductive number of COVID-19 is higher compared to SARS coronavirus. J Travel Med. 2020;27(2):021. doi:10.1093/jtm/taaa021
5. Rhazouani A, Aziz K, Gamrani H, et al. Can the application of graphene oxide contribute to the fight against COVID-19? Antiviral activity, diagnosis and prevention. Curr Res Pharmacol Drug Discov. 2021;2:100062. doi:10.1016/j.crphar.2021.100062
6. Li Q, Guan X, Wu P, et al. Early transmission dynamics in Wuhan, China, of novel coronavirus-infected pneumonia. N Engl J Med. 2020;382(13):1199–1207. doi:10.1056/NEJMoa2001316
7. Wiersinga WJ, Rhodes A, Cheng AC, et al. Pathophysiology, transmission, diagnosis, and treatment of coronavirus disease 2019 (COVID-19): a review. JAMA. 2020;324(8):782–793. doi:10.1001/jama.2020.12839
8. Almanza-Reyes H, Moreno S, Plascencia-López I, et al. Evaluation of silver nanoparticles for the prevention of SARS-CoV-2 infection in health workers: in vitro and in vivo. PLoS One. 2021;19(16):8. doi:10.1371/journal.pone.0256401
9. Coronavirus Disease 2019. (COVID-19) Treatment Guidelines. Bethesda (MD): National Institutes of Health (US; 2021.
10. Sanders JM, Monogue ML, Jodlowski TZ, Cutrell JB. Pharmacologic Treatments for Coronavirus Disease 2019 (COVID-19): a review. JAMA. 2020;323(18):1824–1836. doi:10.1001/jama.2020.6019
11. Ahmad I, Rathore FA. Neurological manifestations and complications of COVID-19: a literature review. J Clin Neurosci. 2020;77:8–12. doi:10.1016/j.jocn.2020.05.017
12. Mao L, Jin H, Wang M, et al. Neurologic manifestations of hospitalized patients with coronavirus disease 2019 in Wuhan, China. JAMA Neurol. 2020;77(6):683. doi:10.1001/jamaneurol.2020.1127
13. Marshall M. How COVID-19 can damage the brain. Nature. 2020;585(7825):342–343. doi:10.1038/d41586-020-02599-5
14. Majolo F, Silva GLD, Vieira L, et al. Neuropsychiatric disorders and COVID-19: what we know so far. Pharmaceuticals. 2021;14(9):933. doi:10.3390/ph14090933
15. Shrestha LB, Foster C, Rawlinson W, Tedla N, Bull RA. Evolution of the SARS-CoV-2 omicron variants BA.1 to BA.5: implications for immune escape and transmission. Rev Med Virol. 2022;32(5):e2381. doi:10.1002/rmv.2381
16. Sharifi E, Yousefiasl S, Trovato M, et al. Nanostructures for prevention, diagnosis, and treatment of viral respiratory infections: from influenza virus to SARS-CoV-2 variants. J Nanobiotechnology. 2023;21(1):199. doi:10.1186/s12951-023-01938-8
17. Wang Y, Ye M, Zhang F, et al. Ontology-based taxonomical analysis of experimentally verified natural and laboratory human coronavirus hosts and its implication for COVID-19 virus origination and transmission. PLoS One. 2024;19(1):e0295541. doi:10.1371/journal.pone.0295541
18. Imani SM, Ladouceur L, Marshall T, et al. Antimicrobial nanomaterials and coatings: current mechanisms and future perspectives to control the spread of viruses including SARS-CoV-2. ACS Nano. 2020;14(10):12341–12369. doi:10.1021/acsnano.0c05937
19. Losada-Garcia N, Vazquez-Calvo A, Alcami A, Palomo JM. Preparation of highly stable and cost-efficient antiviral materials for reducing infections and avoiding the transmission of viruses such as SARS-CoV-2. ACS Appl Mater Interfaces. 2023;10(15(18)):22580–22589. doi:10.1021/acsami.3c03357
20. Singh L, Kruger HG, Maguire GE, et al. The role of nanotechnology in the treatment of viral infections. Ther Adv Infect Dis. 2017;4(4):105–131. doi:10.1177/2049936117713593
21. Blessing AA. Metal-based nanoparticles for the treatment of infectious diseases. Molecules. 2017;22(8):1370. doi:10.3390/molecules22081370
22. Kaukab A, Gaur S, Agnihotri R, Taneja V. Silver nanoparticles as an intracanal medicament: a scoping review. Scie World J. 2023;2023:9451685. doi:10.1155/2023/9451685
23. Xu L, Wang YY, Huang J, et al. Silver nanoparticles: synthesis, medical applications, and biosafety. Theranostics. 2020;10(20):8996–9031. doi:10.7150/thno.45413
24. Ciriminna R, Albo Y, Pagliaro M. New antivirals and antibacterials based on silver nanoparticles. Chem Med Chem. 2020;15(17):1619–1623. doi:10.1002/cmdc.202000390
25. Khandelwal A, Kaur G, Kumar N, Tiwari A. Application of silver nanoparticles in viral inhibition: a new hope for antivirals. Dig J Nano and Biostr. 2014;9(1):175–186.
26. Luceri A, Francese R, Lembo D, Ferraris M, Balagna C. Silver nanoparticles: review of antiviral properties, mechanism of action and applications. Microorganisms. 2023;28(11(3)):629. doi:10.3390/microorganisms11030629
27. Krzyzowska M, Janicka M, Chodkowski M, et al. Epigallocatechin gallate-modified silver nanoparticles show antiviral activity against herpes simplex type 1 and 2. Viruses. 2024;2023(15). doi:10.3390/v15102024
28. Janicka M, Ranoszek-Soliwoda K, Chodaczek G, et al. Functionalized noble metal nanoparticles for the treatment of herpesvirus infection. Microorganisms. 2022;10(11):2161. doi:10.3390/microorganisms10112161
29. Elechiguerra JL, Burt JL, Morones JR, et al. Interaction of silver nanoparticles with HIV-1. J Nanobiotechnology. 2005;3(1):6. doi:10.1186/1477-3155-3-6
30. Lara HH, Ayala-Nuñez NV, Ixtepan-Turrent L, Rodriguez-Padilla C. Mode of antiviral action of silver nanoparticles against HIV-1. J Nanobiotechnology. 2010;8(1):1. doi:10.1186/1477-3155-8-1
31. Lu L, Sun RW, Chen R, et al. Silver nanoparticles inhibit hepatitis B virus replication. Antivir Ther. 2008;13(2):253–262. doi:10.1177/135965350801300210
32. Xiang DX, Chen Q, Pang L, Zheng CL. Inhibitory effects of silver nanoparticles on H1N1 influenza A virus in vitro. J Virol Methods. 2011;178(1–2):137–142. doi:10.1016/j.jviromet.2011.09.003
33. Xiang D, Zheng Y, Duan W, et al. Inhibition of A/Human/Hubei/3/2005 (H3N2) influenza virus infection by silver nanoparticles in vitro and in vivo. Int J Nanomed. 2013;8:4103–4113. doi:10.2147/IJN.S53622
34. Naumenko K, Zahorodnia S, Pop CV, Rizun N. Antiviral activity of silver nanoparticles against the influenza A virus. J Virus Erad. 2023;9(2):100330. doi:10.1016/j.jve.2023.100330
35. Baram-Pinto D, Shukla S, Gedanken A, Sarid R. Inhibition of HSV-1 attachment, entry, and cell-to-cell spread by functionalized multivalent gold nanoparticles. Small. 2010;6(9):1044–1050. doi:10.1002/smll.200902384
36. Sun L, Singh AK, Vig K, Pillai SR, Singh SR. Silver nanoparticles inhibit replication of the respiratory syncytial virus. J Biomed Nanotechnology. 2008;4(2):149–158. doi:10.1166/jbn.2008.012
37. Rogers JV, Parkinson CV, Choi YW, Speshock JL, Hussain SM. A preliminary assessment of silver nanoparticle inhibition of monkeypox virus plaque formation. Nanoscale Res Lett. 2008;3(4):129–133. doi:10.1007/s11671-008-9128-2
38. Speshock JL, Murdock RC, Braydich-Stolle LK, et al. Interaction of silver nanoparticles with Tacaribe virus. J Nanobiotechnology. 2010;8(1):19. doi:10.1186/1477-3155-8-19
39. Chen N, Zheng Y, Yin J, Li X, Zheng C. Inhibitory effects of silver nanoparticles against adenovirus type 3 in vitro. J Virol Methods. 2013;193(2):470–477. doi:10.1016/j.jviromet.2013.07.020
40. Gaikwad S, Ingle A, Gade A, et al. Antiviral activity of mycosynthesized silver nanoparticles against herpes simplex virus and human parainfluenza virus type 3. Int J Nanomed. 2013;8:4303–4314. doi:10.2147/IJN.S50070
41. Jeremiah SS, Miyakawa K, Morita T, Yamaoka Y, Ryo A. Potent antiviral effect of silver nanoparticles on SARS-CoV-2. Biochem Biophys Res Commun. 2020;26(533(1)):195–200. doi:10.1016/j.bbrc.2020.09.018
42. Asharani PV, Hande MP, Valiyaveettil S. Anti-proliferative activity of silver nanoparticles. BMC Cell Biol. 2009;10(1):65. doi:10.1186/1471-2121-10-65
43. Miethling-Graff R, Rumpker R, Richter M, et al. Exposure to silver nanoparticles induces size- and dose-dependent oxidative stress and cytotoxicity in human colon carcinoma cells. Toxicol In Vitro. 2014;28(7):1280–1289. doi:10.1016/j.tiv.2014.06.005
44. Galdiero S, Falanga A, Vitiello M, Cantisani M, Marra V, Galdiero M. Silver nanoparticles as potential antiviral agents. Molecules. 2011;16(10):8894–8918. doi:10.3390/molecules16108894
45. Zielińska-Górska M, Sawosz E, Sosnowska M, et al. Molecular biocompatibility of a silver nanoparticle complex with graphene oxide to human skin in a 3D epidermis in vitro model. Pharmaceutics. 2022;1(14(7)):1398. doi:10.3390/pharmaceutics14071398
46. Chen YN, Hsueh YH, Hsieh CT, et al. Antiviral activity of graphene-silver nanocomposites against non-enveloped and enveloped viruses. Int J Environ Res Public Health. 2016;13(4):430. doi:10.3390/ijerph13040430
47. Lasocka I, Jastrzębska E, Szulc-Dąbrowska L, et al. The effects of graphene and mesenchymal stem cells in cutaneous wound healing and their putative action mechanism. Int J Nanomed. 2019;14:2281–2299. doi:10.2147/IJN.S190928
48. Ebrahimi M, Asadi M, Akhavan O. Graphene-based nanomaterials in fighting the most challenging viruses and immunogenic disorders. ACS Biomater Sci Eng. 2022;8(1):54–81. doi:10.1021/acsbiomaterials.1c01184
49. Liu S, Zeng TH, Hofmann M, et al. Antibacterial activity of graphite, graphite oxide, graphene oxide, and reduced graphene oxide: membrane and oxidative stress. ACS Nano. 2011;5(9):6971–6980. doi:10.1021/nn202451x
50. Gurunathan S, Han JW, Dayem AA, Eppakayala V, Kim JH. Oxidative stress-mediated antibacterial activity of graphene oxide and reduced graphene oxide in Pseudomonas aeruginosa. Int J Nanomed. 2012;7:5901–5914. doi:10.2147/IJN.S37397
51. Lange A, Sawosz E, Wierzbicki M, et al. Nanocomposites of graphene oxide-silver nanoparticles for enhanced antibacterial activity: mechanism of action and medical textiles coating. Materials. 2022;15(9):3122. doi:10.3390/ma15093122
52. Sametband M, Kalt I, Gedanken A, Sarid R. Herpes simplex virus type-1 attachment inhibition by functionalized graphene oxide. ACS Appl Mater Interfaces. 2014;6(2):1228–1235. doi:10.1021/am405040z
53. Ye S, Shao K, Li Z, et al. Antiviral activity of graphene oxide: how sharp edged structure and charge matter. ACS Appl Mater Interfaces. 2015;7(38):21571–21579. doi:10.1021/acsami.5b06876
54. Song Z, Wang X, Zhu G, et al. Virus capture and destruction by label-free graphene oxide for detection and disinfection applications. Small. 2015;11(9–10):1171–1176. doi:10.1002/smll.201401706
55. Körner RW, Majjouti M, Alcazar MAA, Mahabir E. Of mice and men: the coronavirus mhv and mouse models as a translational approach to understand SARS-CoV-2. Viruses. 2020;12(8):880. doi:10.3390/v12080880
56. Caldera-Crespo LA, Paidas MJ, Roy S, et al. Experimental models of COVID-19. Front Cell Infect Microbiol. 2022;11:792584. doi:10.3389/fcimb.2021.792584
57. Bartak M, Bąska P, Chodkowski M, Tymińska B, Bańbura MW, Cymerys J. Neurons cytoskeletal architecture remodeling during the replication cycle of mouse coronavirus MHV-JHM: a morphological in vitro study. BMC Vet Res. 2024;20(1):18. doi:10.1186/s12917-023-03813-y
58. Weiss SR, Leibowitz JL. Coronavirus pathogenesis. Adv Virus Res. 2011;81,85–164.
59. Weiss SR, Navas-Martin S. Coronavirus pathogenesis and the emerging pathogen severe acute respiratory syndrome coronavirus. Microbiol Mol Biol Rev. 2005;69,635–64. doi:10.1128/MMBR.69.4.635-664.2005
60. Cowley TJ, Weiss SR. Murine coronavirus neuropathogenesis: determinants of virulence. J Neuro Virol. 2010;16:427–434. doi:10.3109/13550284.2010.529238
61. Lange A, Sawosz E, Daniluk K, et al. Bacterial surface disturbances affecting cell function during exposure to three-compound nanocomposites based on graphene materials. Nanomaterials. 2022;12(17):3058. doi:10.3390/nano12173058
62. MacArthur KE, Slater TJ, Haigh SJ, Ozkaya D, Nellist PD, Lozano-Perez S. Quantitative energy-dispersive X-ray analysis of catalyst nanoparticles using a partial cross section approach. Microsc Microanal. 2016;22(1):71–81. doi:10.1017/S1431927615015494
63. Kärber G. Beitrag zur kollektiven behandlung pharmakologiseher reihenversuche. Arch Exp Path Pharmacol. 1931;162(4):480–484. doi:10.1007/BF01863914
64. Lei C, Yang J, Hu J, Sun X. On the calculation of TCID50 for quantitation of virus infectivity. Virol Sin. 2021;36(1):141–144. doi:10.1007/s12250-020-00230-5
65. LaBarre DD, Lowy RJ. Improvements in methods for calculating virus titer estimates from TCID50 and plaque assays. J Virol Methods. 2001;96(2):107–126. doi:10.1016/s0166-0934(01)00316-0
66. Jaworski S, Strojny B, Sawosz E, et al. Degradation of mitochondria and oxidative stress as the main mechanism of toxicity of pristine graphene on u87 glioblastoma cells and tumors and HS-5 cells. Int J Mol Sci. 2019;2(20(3)):650. doi:10.3390/ijms20030650
67. NanoEnTek Inc., Korea; (2015) Available from:http://www.nanoentek.com.
68. Barlow AL, MacLeod A, Noppen S, Sanderson J, Guérin CJ. Colocalization analysis in fluorescence micrographs: verification of a more accurate calculation of pearson’s correlation coefficient. Microsc Microanal. 2010;16(6):710–724. doi:10.1017/S143192761009389X
69. Wang H, Zhang Y, Xu X, et al. Efficient loading of silver nanoparticles on graphene oxide and its antibacterial properties. Nano Express. 2020;1(1):010041. doi:10.1088/2632-959X/AB9546
70. Jaworski S, Wierzbicki M, Sawosz E, et al. Graphene oxide-based nanocomposites decorated with silver nanoparticles as an antibacterial agent. Nanoscale Res Lett. 2018;13(1):1–17. doi:10.1186/s11671-018-2533-2
71. Zhu J, Ni H, Hu C, et al. Rapid synthesis and characterization of silver-loaded graphene oxide nanomaterials and their antibacterial applications. R Soc Open Sci. 2021;8(2). doi:10.1098/RSOS.201744
72. Harrison AG, Lin T, Wang P. Mechanisms of SARS-CoV-2 transmission and pathogenesis. Trends Immunol. 2020;41(12):1100–1115. doi:10.1016/j.it.2020.10.004
73. Merkl P, Long S, McInerney GM, Sotiriou GA. Antiviral activity of silver, copper oxide and zinc oxide nanoparticle coatings against SARS-CoV-2. Nanomaterials. 2021;11(5):1312. doi:10.3390/nano11051312 PMID: 34067553; PMCID: PMC8155969.
74. He Q, Lu J, Liu N, et al. Antiviral properties of silver nanoparticles against SARS-CoV-2: effects of surface coating and particle size. Nanomaterials. 2022;17(12(6)):990. doi:10.3390/nano12060990
75. Riddell S, Goldie S, Hill A, et al. The effect of temperature on persistence of SARS-CoV-2 on common surfaces. Virol J. 2020;17(1):145. doi:10.1186/s12985-020-01418-7
76. Wolfgruber S, Rieger J, Cardozo O, et al. Antiviral activity of zinc oxide nanoparticles against SARS-CoV-2. Int J Mol Sci. 2023;24(9):8425. doi:10.3390/ijms24098425
77. Lin N, Verma D, Saini N, et al. Antiviral nanoparticles for sanitizing surfaces: a roadmap to self-sterilizing against COVID-19. Nano Today. 2021;40:101267. doi:10.1016/j.nantod.2021.101267
78. Chen S, Li X, Zhao Y, Chang L, Qi J. Graphene oxide shell-isolated Ag nanoparticles for surface-enhanced Raman scattering. Carbon. 2015;81:767–772. doi:10.1016/j.carbon.2014.10.021
79. Sukhanova A, Bozrova S, Sokolov P, et al. Dependence of nanoparticle toxicity on their physical and chemical properties. Nanoscale Res Lett. 2018;13(1):44. doi:10.1186/s11671-018-2457-x
80. Bruna T, Maldonado-Bravo F, Jara P, Caro N. Silver nanoparticles and their antibacterial applications. Int J Mol Sci. 2021;22(13):7202. doi:10.3390/ijms22137202
81. Wierzbicki M, Jaworski S, Sawosz E, et al. Graphene oxide in a composite with silver nanoparticles reduces the fibroblast and endothelial cell cytotoxicity of an antibacterial nanoplatform. Nanoscale Res Lett. 2019;14(1):320. doi:10.1186/s11671-019-3166-9
82. de Medeiros AMZ, Khan LU, da Silva GH, et al. Graphene oxide-silver nanoparticle hybrid material: an integrated nanosafety study in zebrafish embryos. Ecotoxicol Environ Saf. 2021;209:111776. doi:10.1016/j.ecoenv.2020.111776
83. Chakravarty M, Vora A. Nanotechnology‑based antiviral therapeutics. Drug Deliv Transl Res. 2020;11:1–40.
84. Sarkar PK, Das Mukhopadhyay C. Ayurvedic metal nanoparticles could be novel antiviral agents against SARS-CoV-2. Int Nano Lett. 2021;11(3):1–7. doi:10.1007/s40089-020-00323-9
85. Frost R, Jönsson GE, Chakarov D, et al. Graphene oxide and lipid membranes: interactions and nanocomposite structures. Nano Lett. 2012;12(7):3356–3362. doi:10.1021/nl203107k
86. Rui L, Liu J, Li J, et al. Reduced graphene oxide directed self-assembly of phospholipid monolayers in liquid and gel phases. Biochim Biophys Acta. 2015;1848(5):1203–1211. doi:10.1016/j.bbamem.2015.02.018
87. Du T, Lu J, Liu L, et al. Antiviral activity of graphene oxide-silver nanocomposites by preventing viral entry and activation of the antiviral innate immune response. ACS Appl Bio Mater. 2018;1(5):1286–1293. doi:10.1021/acsabm.8b00154
 © 2024 The Author(s). This work is published and licensed by Dove Medical Press Limited. The
full terms of this license are available at https://www.dovepress.com/terms.php
and incorporate the Creative Commons Attribution
- Non Commercial (unported, 3.0) License.
By accessing the work you hereby accept the Terms. Non-commercial uses of the work are permitted
without any further permission from Dove Medical Press Limited, provided the work is properly
attributed. For permission for commercial use of this work, please see paragraphs 4.2 and 5 of our Terms.
© 2024 The Author(s). This work is published and licensed by Dove Medical Press Limited. The
full terms of this license are available at https://www.dovepress.com/terms.php
and incorporate the Creative Commons Attribution
- Non Commercial (unported, 3.0) License.
By accessing the work you hereby accept the Terms. Non-commercial uses of the work are permitted
without any further permission from Dove Medical Press Limited, provided the work is properly
attributed. For permission for commercial use of this work, please see paragraphs 4.2 and 5 of our Terms.