")
Back to Journals » Therapeutics and Clinical Risk Management » Volume 21
Association Between Epicardial Adipose Tissue and Contrast-Induced Acute Kidney Injury in Patients with ST-Segment Elevation Myocardial Infarction
Authors Zang B, Hu W, Chao Y, Wang D
Received 20 January 2025
Accepted for publication 15 April 2025
Published 24 April 2025 Volume 2025:21 Pages 543—552
DOI https://doi.org/10.2147/TCRM.S518586
Checked for plagiarism Yes
Review by Single anonymous peer review
Peer reviewer comments 2
Editor who approved publication: Professor Garry Walsh
Baohe Zang, Weiwei Hu, Yali Chao, Dengji Wang
Department of Intensive Care Medicine, Affiliated Hospital of Xuzhou Medical University, Xuzhou, Jiangsu, People’s Republic of China
Correspondence: Dengji Wang, Department of Intensive Care Medicine, Affiliated Hospital of Xuzhou Medical University, Xuzhou, Jiangsu, 221000, People’s Republic of China, Email [email protected]
Background: Epicardial adipose tissue (EAT) affects the kidneys by secreting various bioactive molecules. Contrast-induced acute kidney injury (CI-AKI) is a common complication after percutaneous coronary intervention (PCI) in ST-segment elevation myocardial infarction (STEMI) patients. The relationship between EAT and CI-AKI remains unclear. This study aims to explore the relationship between EAT and the incidence of CI-AKI after PCI in STEMI patients.
Methods: Patients diagnosed with STEMI were continuously included, all patients underwent PCI within 12 hours of onset. EAT volume was measured and obtained by chest CT. Logistic regression analysis was used to analyze possible risk factors for CI-AKI. Restricted cubic splines (RCS) were utilized to explore the dose-response relationship involving EAT and CI-AKI.
Results: The incidence of CI-AKI was 8.9% (57/638). Compared with the Non-CI-AKI group, the EAT volume was significantly higher (p< 0.005). After adjusting for confounding factors, multivariate regression analysis showed FBG, NT-proBNP, LVEF, and EAT volume were the independent predictors for CI-AKI. RCS analysis indicated a linear dose-response relationship between EAT volume and CI-AKI. The integration of EAT volume could significantly improve ability of the model for CI-AKI (NRI 0.4071, 95% CI 0.231 ~ 0.583, p < 0.001; IDI 0.1356, 95% CI 0.091 ~ 0.180, p < 0.001).
Conclusion: Higher EAT volume was an independent risk factor for CI-AKI in STEMI patients. Integration of EAT volume could significantly improve the risk model for CI-AKI.
Keywords: epicardial adipose tissue, EAT, ST-segment elevation myocardial infarction, STEMI, contrast-induced acute kidney injury, CI-AKI, percutaneous coronary intervention, PCI
Graphical Abstract:

Introduction
Acute kidney injury (AKI) refers to the acute decline in kidney function over a short period, characterized by elevated serum creatinine levels, reduced urine output, or other signs of renal dysfunction.1 Severe AKI may require admission to intensive care units for further medical care. For patients with ST-segment elevation myocardial infarction (STEMI), the incidence of AKI is relatively high and closely linked to patient prognosis.2,3 According to research, the incidence of Contrast-induced acute kidney injury (CI-AKI) in STEMI patients after percutaneous coronary intervention (PCI) ranges from 15% to 30%, which is associated with hemodynamic changes, oxidative stress, inflammatory responses, and the direct nephrotoxic effects of contrast agents.4,5 Currently, the main preventive treatment for CI-AKI in clinical practice is hydration.6 However, there may not be enough time for hydration before primary PCI in patients with STEMI. Therefore, it is important to identify more risk factors for CI-AKI in patients with STEMI.
Epicardial adipose tissue (EAT) is the adipose tissue that covers the outer surface of the heart. Recent studies have found that EAT is not merely a simple energy-storing tissue but plays an important role in inflammation, metabolism, and cardiovascular diseases.7 The relationship between EAT and cardiovascular diseases has been well studied.8 In patients with myocardial infarction, increased EAT volume is associated with poor prognosis.9,10 Furthermore, EAT secretes various bioactive molecules, such as adipokines, cytokines, and hormones, that affect not only the surrounding heart tissue but also distant organs, including the kidneys.11–13 However, the relationship between EAT and CI-AKI remains unclear. This study aims to explore the relationship between EAT and the incidence of CI-AKI after PCI in STEMI patients.
Materials and Methods
Study Population
This analysis reviewed patients diagnosed with STEMI14 from January 2022 to November 2024. The criteria for inclusion were: (1) completion of successful primary PCI within 12 hours following the onset of symptoms (TIMI = 3); (2) Improvement of CT examination during hospitalization; (3) possession of comprehensive clinical data. Patients were excluded if they satisfied any of the subsequent criteria: (1) poor quality of CT image; (2) undergoing dialysis prior to admission or suffering from chronic renal failure (eGFR < 30 mL·min−¹·1.73 m−²); (3) having active inflammatory conditions (including pulmonary infections, intestinal inflammation, or autoimmune diseases); (4) a prior history of malignancy or blood disorders; (5) having been exposed to other radiographic contrast materials or nephrotoxic drugs within 48 hours prior to or 72 hours after PCI. This study complies with the Declaration of Helsinki and has been approved by the Institutional Review Board (IRB) of the Affiliated Hospital of Xuzhou Medical University. As this retrospective study posed no risk to patients, the necessity for written informed consent was waived per IRB regulations. Ultimately, 638 patients were included in the study (Figure 1).
 |
Figure 1 Study flowchart. Abbreviations: CI-AKI, contrast-induced acute kidney injury; STEMI, ST-segment elevation myocardial infarction. |
Clinical Data Assessment
Patient records provided the clinical data, encompassing variables such as age, sex, body mass index (BMI), medical history, medications, left ventricular ejection fraction (LVEF), and PCI-related specifics. Serum creatinine (Scr) levels prior to PCI, along with Scr measurements taken 48–72 hours post-exposure to the contrast agent, were carefully noted. Contrast-induced acute kidney injury (CI-AKI) was characterized by an increase in Scr of at least 50% or a rise of 0.3 mg/dL within the 48–72 hour window after contrast administration.15 Moreover, during hospitalization, peak levels of high-sensitivity C-reactive protein (hs-CRP), high-sensitivity troponin T (hs-TnT), and N-terminal pro B-type natriuretic peptide (NT-proBNP) were documented. The medications provided to patients included aspirin, P2Y12 inhibitors, β-blockers, statins, nitrates, angiotensin-converting enzyme inhibitors (ACEI) or angiotensin receptor blockers (ARB), and diuretics. All PCI operations and postoperative hydration were performed according to the latest guidelines, and the infarct-related artery (IRA) was determined on the basis of the coronary angiography findings.
Measurement of Epicardial Adipose Tissue
CT imaging was performed using the spiral CT machine (SOMATOM Definition, SIEMENS, Germany). Scanning with enhancement started at the root of the ascending aorta with a threshold set between 90 and 100 hU, initiated 6 seconds post-start and continuing for a duration of 5 to 12 seconds. The range of the scan covered from 1 cm beneath the tracheal carina to 1.5 cm beneath the lower border of the heart, employing a tube current of 280 to 350 mA and a voltage of 120 kV. The total epicardial adipose tissue, positioned within the pericardial sac stretching from the bifurcation of the pulmonary artery to the diaphragm, was reconstructed from 10 mm axial slices. Enhanced images allowed for the identification of EAT using Hounsfield units in the range of −50 to −200. The total adipose tissue was categorized as EAT, and its volume was subsequently calculated (Figure 2). The measurement of EAT was performed independently by two experienced doctors who were unaware of this study, and each reader performed repeat measurements. The inter-observer and intra-observer agreement for each EAT measurement seen in Supplementary Table 1.
 |
Figure 2 The measurement of epicardial adipose tissue. (A) cardiac axial map, and yellow regions represent epicardial adipose tissue; (B) At −50 and −200 hounsfield units (HU), epicardial adipose tissue volume; “1” represents the right side, and “2” represents the left side. |
Statistical Analysis
The analysis of data was conducted using SPSS (version 27.0, Chicago, USA) and R (version 4.3.1). To evaluate data normality, the Kolmogorov–Smirnov test was utilized. Continuous variables conforming to a normal distribution were expressed as mean ± standard deviation and analyzed with independent t-tests. In contrast, variables that did not follow a normal distribution were represented as median (Q25, Q75) and assessed using the Mann–Whitney U-test. Categorical variables were summarized in terms of counts and percentages, with comparisons made using the χ²-test. Factors deemed as potential risks, determined through univariate regression analysis, were incorporated into a multivariate regression analysis to pinpoint independent risk factors related to CI-AKI. To explore the dose-response relationship involving caIMR and CI-AKI, restricted cubic splines (RCS) were utilized. The new model’s predictive accuracy and the baseline model’s accuracy were evaluated through receiver operating characteristic (ROC) curves, the net reclassification index (NRI), and integrated discrimination improvement (IDI). A p-value less than 0.05 was regarded as statistically significant.
Results
Baseline Characteristics of the Study Population
The incidence of CI-AKI was 8.9% (57/638). Compared with the Non-CI-AKI group, the fasting blood glucose (FBG), EAT volume, hs-CRP, NT-proBNP, and the prevalence of diabetes mellitus, IRA-left anterior descending (LAD), and diuretics were significantly higher, and LVEF was significantly lower in the CI-AKI group (p<0.005) (Table 1).
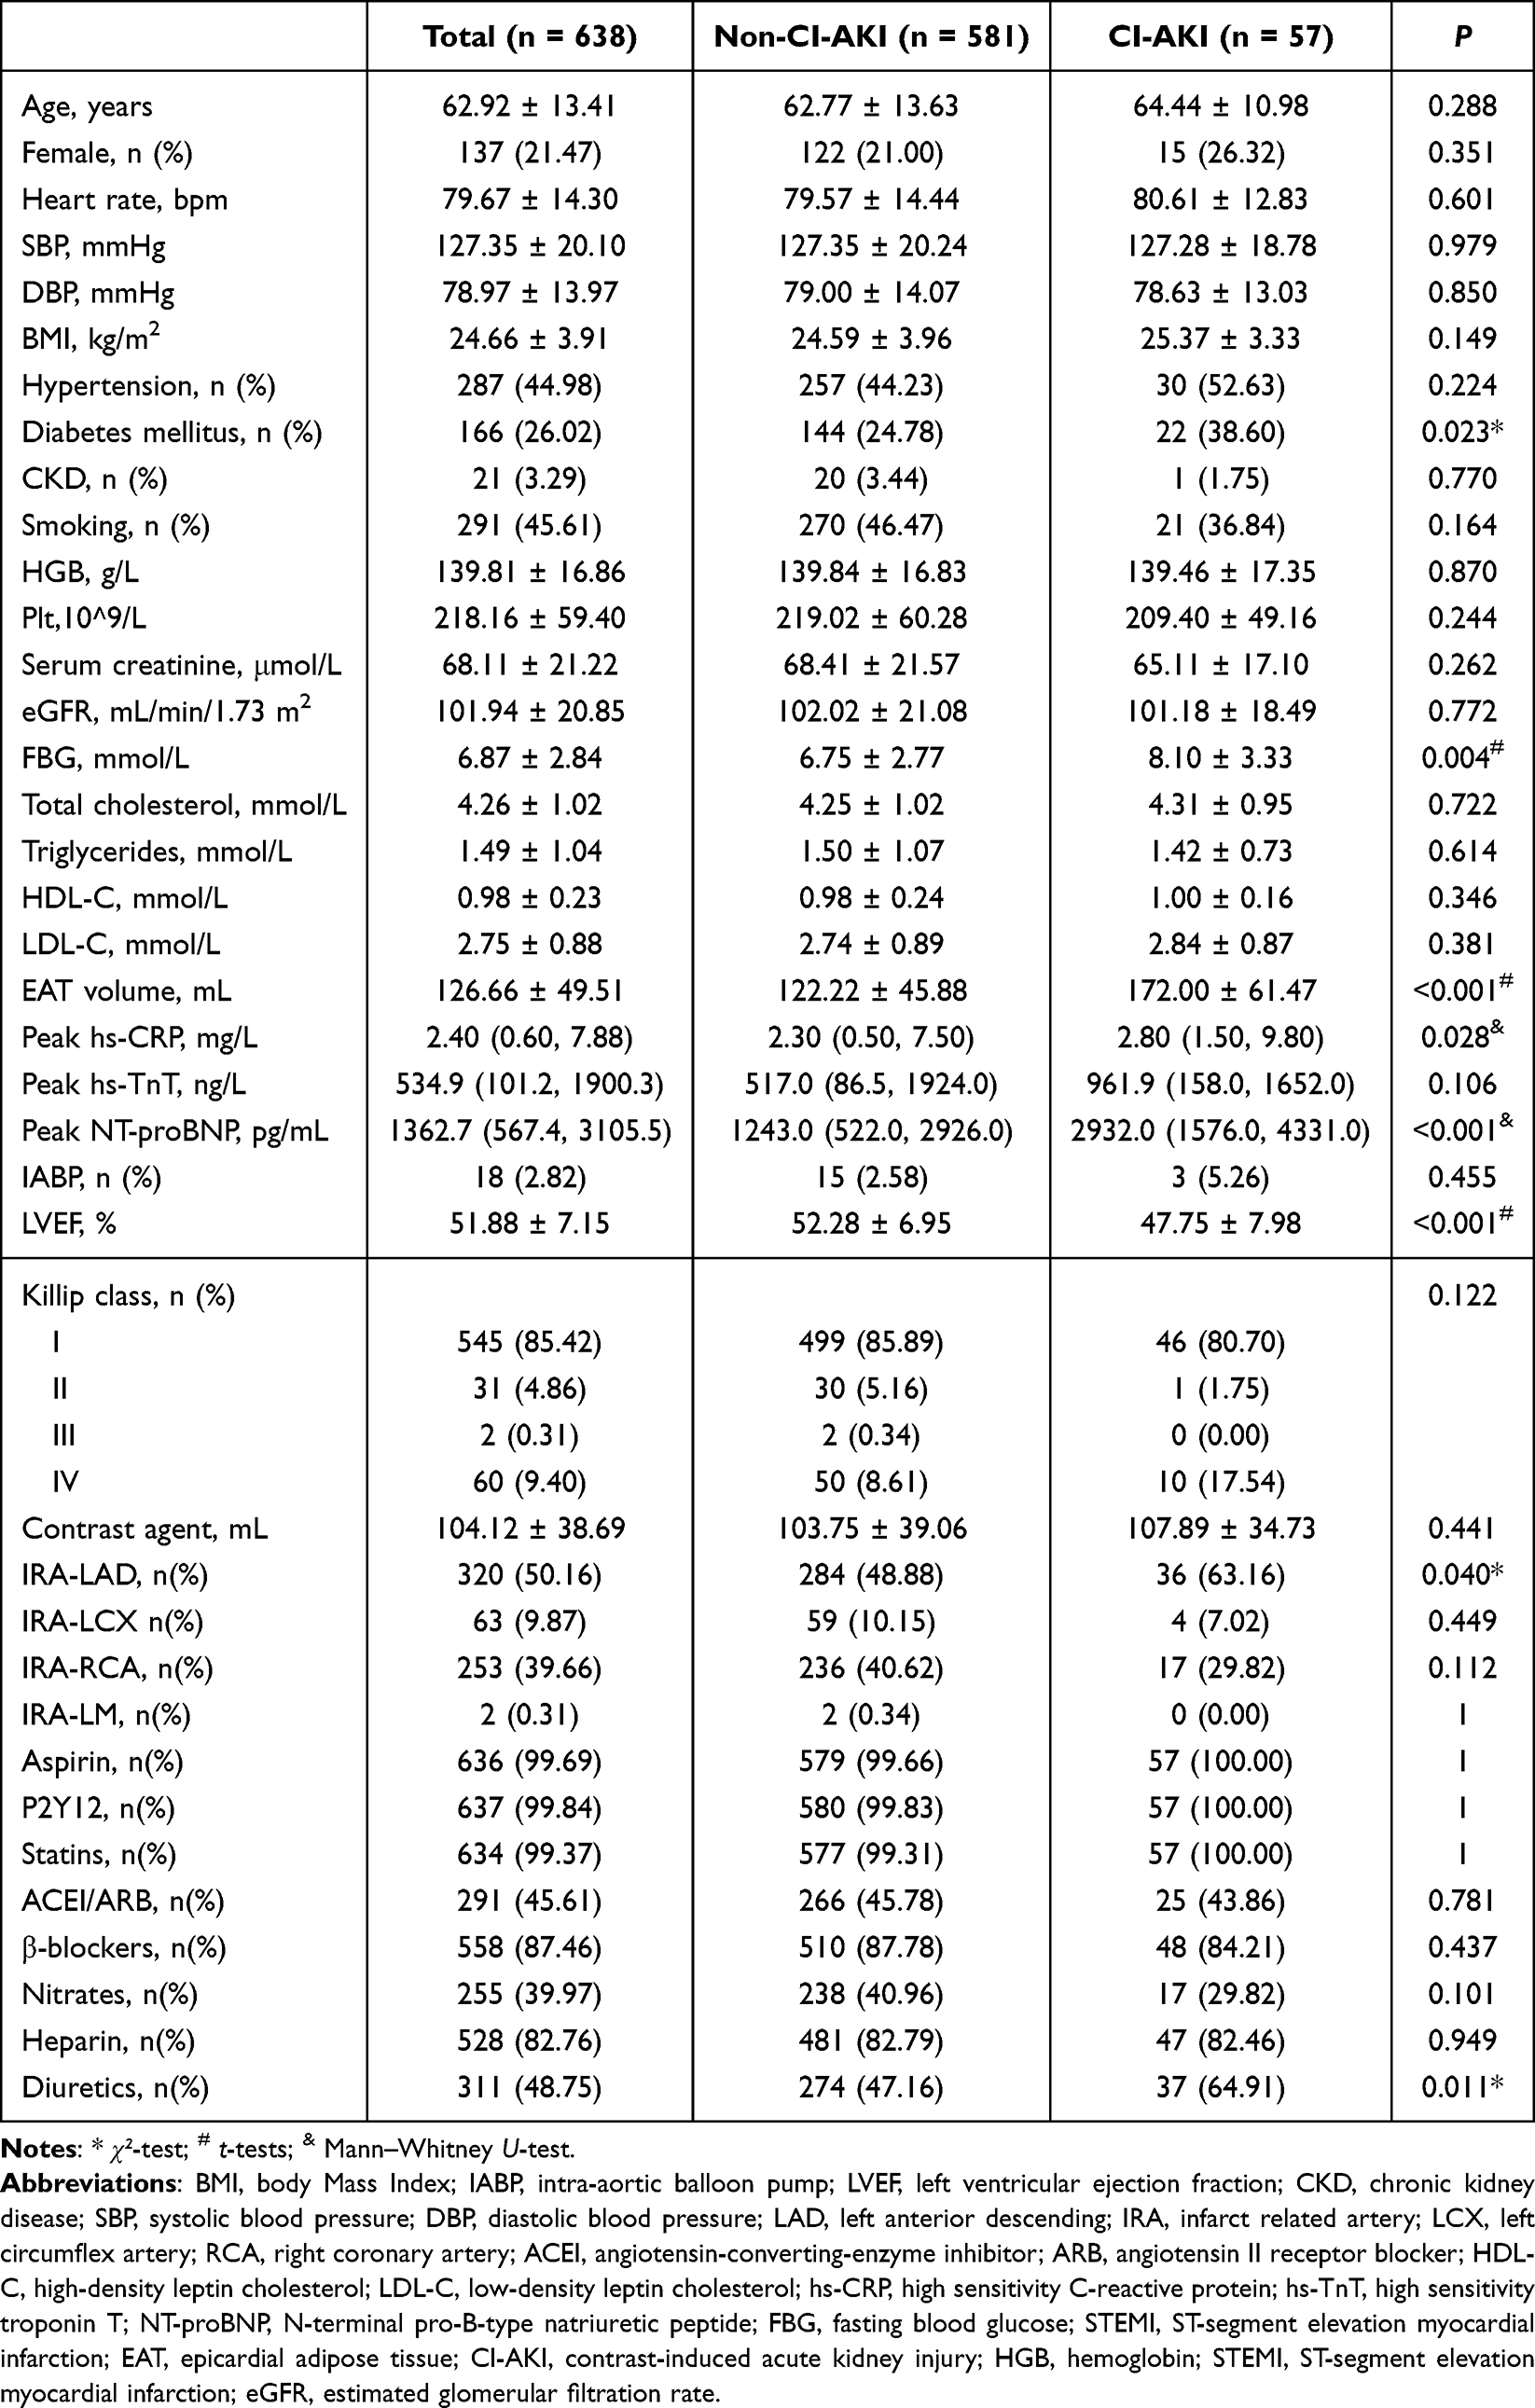 |
Table 1 Comparison of Baseline Data in Patients with STEMI |
Logistic Regression Analysis for CI-AKI
In univariate regression analysis, FBG, NT-proBNP, diabetes mellitus, IRA-LAD, and diuretics, LVEF, and EAT volume were associated with CI-AKI. In multivariate regression analysis, the potential risk variables in the univariate were included. The result showed FBG, NT-proBNP, LVEF, and EAT volume were still significantly associated with CI-AKI (Supplementary Table 2, Table 2). RCS analysis indicated a linear dose-response relationship between EAT volume and CI-AKI, suggesting that higher EAT volume are associated with an increased risk of CI-AKI (Figure 3).
 |
Table 2 Multivariate Logistic Regression Analysis on CI-AKI in Patients with STEMI |
 |
Figure 3 Dose-response relationship between EAT and CI-AKI. (A) a unadjusted dose-response relationship between EAT and CI-AKI; (B) an adjusted dose-response relationship between EAT and CI-AKI. Abbreviations: CI-AKI, contrast-induced acute kidney injury; EAT, epicardial adipose tissue. |
Diagnostic Value of EAT in CI-AKI
ROC showed that the areas under the curve (AUC) for LVEF, FBG, NT-proBNP, and EAT volume in diagnosing CI-AKI were 0.668, 0.646, 0.690, and 0.737, respectively (P < 0.05). The cut-off value of EAT volume was 147.36 mL, the sensitivity was 68.4%, and the specificity was 74.9% (95% CI: 0.663~0.811, p < 0.001) (Supplementary Table 3, Figure 4).
 |
Figure 4 Receiver operating characteristic analysis (ROC) of EAT for identifying CI-AKI. Abbreviations: CI-AKI, contrast-induced acute kidney injury; EAT, epicardial adipose tissue; LVEF, left ventricular ejection fraction; NT-proBNP, N-terminal pro-B-type natriuretic peptide; FBG, fasting blood glucose. |
Incremental Value of EAT in the Risk Model for CI-AKI
A baseline model (LVEF, FBG, and NT-proBNP) was constructed based on the results of multivariate regression analysis. ROC showed that the baseline model had an AUC of 0.745 (95% CI: 0.688~0.801), with a sensitivity of 91.2% and specificity of 52.0%. After integrating EAT volume in the baseline model, ROC showed that the AUC was 0.818 (95% CI: 0.767~0.869), with a sensitivity of 86.0% and specificity of 62.7% (Supplementary Table 4, Figure 5). Next, the NRI and IDI were calculated. The results showed that when EAT volume was integrated into the baseline model, the NRI>0 (NRI 0.4071, 95% CI 0.231 ~ 0.583, p < 0.001) and the IDI value was improved by 13.56% (IDI 0.1356, 95% CI 0.091 ~ 0.180, p < 0.001), suggesting that the integration of EAT volume could significantly improve ability of the model for CI-AKI (Table 3).
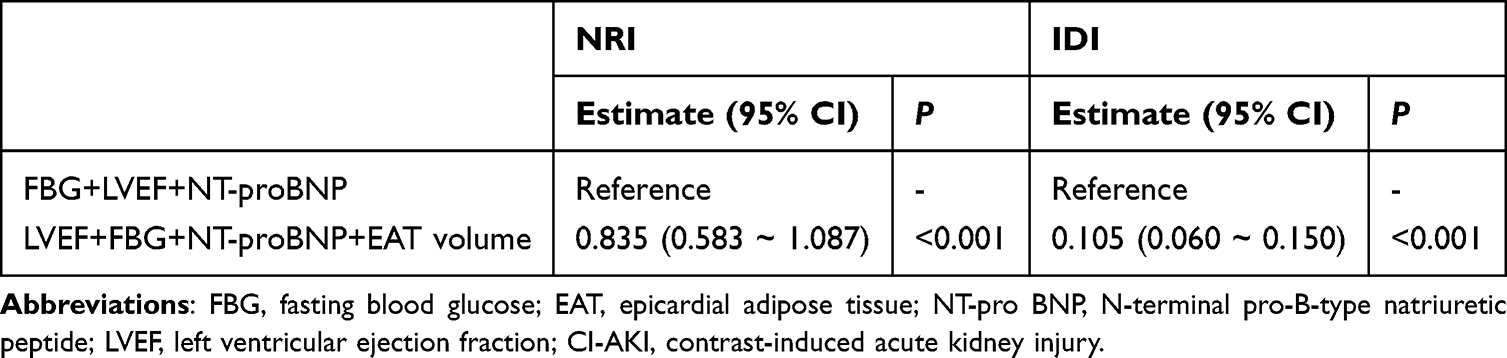 |
Table 3 Incremental Value of EAT Volume for CI-AKI |
 |
Figure 5 Receiver operating characteristic analysis (ROC) of models for identifying CI-AKI. Abbreviations: CI-AKI, contrast-induced acute kidney injury; EAT, epicardial adipose tissue; LVEF, left ventricular ejection fraction; NT-proBNP, N-terminal pro-B-type natriuretic peptide; FBG, fasting blood glucose. |
Discussion
The main findings of this study are as follows: (1) EAT volume was independently associated with CI-AKI in STEMI patients; (2) A linear dose-response relationship exists between EAT volume and CI-AKI; (3) Integration of EAT volume could significantly improve the risk model for CI-AKI.
PCI has been proven to be the most effective method for rapidly restoring coronary blood flow in STEMI patients.16 With the widespread use of contrast agents globally, CI-AKI has become a major iatrogenic cause of kidney injury.5 Consistent with previous studies, our research shows that the incidence of CI-AKI in STEMI patients is 8.9%.17,18 In addition to a higher incidence, various data suggest that CI-AKI is associated with poor clinical outcomes.3–5 Therefore, early recognition of CI-AKI is crucial.
EAT is considered not only as the “energy storage tissue” of the heart but also plays a significant role in cardiovascular and systemic metabolic regulation through the secretion of various bioactive substances such as adipokines, cytokines, hormones, and metabolites.7–10 In STEMI patients, numerous studies have demonstrated that increased EAT volume is associated with more severe disease and poorer prognosis.19–21 In recent years, more studies have focused on the potential role of EAT in kidney diseases.11–13 Clinical research has found that EAT thickness is positively correlated with renal dysfunction, particularly in patients with chronic kidney disease, where EAT accumulation is closely related to tubulointerstitial fibrosis, changes in renal blood flow, and metabolic disturbances.11,22 Moreover, some cohort studies have shown that increased EAT thickness is associated with elevated urinary albumin levels, renal tubular dysfunction, and increased inflammatory markers, suggesting that EAT may influence kidney metabolism and inflammation, thereby accelerating the progression of kidney disease through its relationship with metabolic syndrome.23–25 Additionally, a previous study showed that patients with hypertension tend to have thicker EAT, which may be related to microvascular renal damage and tubular dysfunction.26 However, the relationship between EAT and CI-AKI remains unclear. Our study found that EAT volume was independently associated with CI-AKI in STEMI patients, and there was a linear dose-response relationship between EAT volume and CI-AKI. The following mechanisms may partially explain the findings of this study. EAT secretes multiple pro-inflammatory factors, which can enter the kidneys through the bloodstream, activate local immune responses, and lead to tubular cell damage and acute renal failure.24,25 Dysregulated fatty acid metabolism in EAT may result in the accumulation of free fatty acids, which can promote oxidative stress, increase reactive oxygen species production, and thereby cause kidney damage.11,27 Furthermore, increased EAT may be associated with chronic diseases such as obesity, diabetes, and hypertension, all of which are independent risk factors for CI-AKI. STEMI patients often have these chronic conditions, and the increase in EAT may exacerbate the renal damage caused by these underlying diseases, making the use of contrast agents even more dangerous.22,28,29 Finally, the effect of EAT on the kidneys is not limited to direct metabolic effects, it may also indirectly worsen acute kidney injury through its impact on the cardiovascular system. Previous studies have shown that increased EAT is associated with larger infarct size and lower LVEF, which may lead to hypoperfusion and ischemic AKI.30–33 Moreover, our study also found that EAT significantly improved the risk model for CI-AKI. Therefore, our study provides additional information for risk stratification in STEMI patients. Clinically, patients with larger EAT volumes may face a higher risk of CI-AKI. Future research should further explore the specific mechanisms of EAT in STEMI and CI-AKI and evaluate its feasibility as a clinical intervention target to improve the prognosis of STEMI patients.
Limitations
First, this is a retrospective study, which has some unavoidable limitations, and our research cannot establish a definitive causal relationship between EAT and CI-AKI. Second, more basic research is needed to clarify how EAT affects the occurrence of CI-AKI in STEMI patients through mechanisms such as metabolism, inflammation, and cardiac remodeling. Third, our study included only patients diagnosed with STEMI, some findings may not be applicable to other diseases and need to be validated through replication studies. Forth, the measurement of EAT involves various methods. Cardiac magnetic resonance (CMR) is currently considered the best imaging tool for the evaluation of EAT. Therefore, in future studies, relevant evidence from CMR may be worth anticipating.
Conclusion
Higher EAT volume was an independent risk factor for CI-AKI in STEMI patients. Integration of EAT volume could significantly improve the risk model for CI-AKI.
Data Sharing Statement
The datasets used and/or analysed during the current study available from the corresponding author on reasonable request.
Ethics Approval and Consent to Participate
This study complies with the Declaration of Helsinki and has been approved by the Institutional Review Board (IRB) of the Affiliated Hospital of Xuzhou Medical University. The requirement for signed written consent was waived owing to no risk to the patient in accordance with the relevant IRB regulatory guidelines.
Funding
There is no funding to report.
Disclosure
The authors declare that they have no competing interests in this work.
References
1. Levey AS, James MT. Acute kidney injury [published correction appears in Ann Intern Med. 2018 Jan 2;168(1):84. doi: 10.7326/L17-0682]. Ann Intern Med. 2017;167(9):ITC66–ITC80. doi:10.7326/AITC201711070
2. Marbach JA, Wells G, Santo PD, et al. Acute kidney injury after radial or femoral artery access in ST-segment elevation myocardial infarction: AKI-SAFARI. Am Heart J. 2021;234:12–22. doi:10.1016/j.ahj.2020.12.019
3. Rihal CS, Textor SC, Grill DE, et al. Incidence and prognostic importance of acute renal failure after percutaneous coronary intervention. Circulation. 2002;105(19):2259–2264. doi:10.1161/01.cir.0000016043.87291.33
4. Silvain J, Nguyen LS, Spagnoli V, et al. Contrast-induced acute kidney injury and mortality in ST elevation myocardial infarction treated with primary percutaneous coronary intervention. Heart. 2018;104(9):767–772. doi:10.1136/heartjnl-2017-311975
5. McCullough PA, Choi JP, Feghali GA, et al. Contrast-induced acute kidney injury. J Am Coll Cardiol. 2016;68(13):1465–1473. doi:10.1016/j.jacc.2016.05.099
6. Sůva M, Kala P, Poloczek M, et al. Contrast-induced acute kidney injury and its contemporary prevention. Front Cardiovasc Med. 2022;9:1073072. doi:10.3389/fcvm.2022.1073072
7. Tay JCK, Yap J. Epicardial adipose tissue: more than meets the eye. Int J Cardiol. 2022;362:174–175. doi:10.1016/j.ijcard.2022.05.001
8. Le Jemtel TH, Samson R, Ayinapudi K, Singh T, Oparil S. Epicardial adipose tissue and cardiovascular disease. Curr Hypertens Rep. 2019;21(5):36. doi:10.1007/s11906-019-0939-6
9. Fisser C, Colling S, Debl K, et al. The impact of epicardial adipose tissue in patients with acute myocardial infarction [published correction appears in Clin Res Cardiol. 2022 Mar;111(3):355. doi: 10.1007/s00392-021-01889-w]. Clin Res Cardiol. 2021;110(10):1637–1646. doi:10.1007/s00392-021-01865-4
10. Hendricks S, Dykun I, Balcer B, Totzeck M, Rassaf T, Mahabadi AA. Epicardial adipose tissue is a robust measure of increased risk of myocardial infarction - a meta-analysis on over 6600 patients and rationale for the EPIC-ACS study. Medicine. 2021;100(52):e28060. doi:10.1097/MD.0000000000028060
11. Aeddula NR, Cheungpasitporn W, Thongprayoon C, Pathireddy S. Epicardial adipose tissue and renal disease. J Clin Med. 2019;8(3):299. doi:10.3390/jcm8030299
12. Zoccali C, Mallamaci F. The location of adipose tissue is important: epicardial fat in patients with chronic kidney disease. J Intern Med. 2015;278(1):88–91. doi:10.1111/joim.12356
13. Song G, Qiao W, Liu K, Yu X. Epicardial adipose tissue in patients with chronic kidney disease: a meta-analysis study and trial sequential analysis. Int Urol Nephrol. 2020;52(12):2345–2355. doi:10.1007/s11255-020-02575-y
14. Ibanez B, James S, Agewall S, et al. 2017 ESC Guidelines for the management of acute myocardial infarction in patients presenting with ST-segment elevation: The Task Force for the management of acute myocardial infarction in patients presenting with ST-segment elevation of the European Society of Cardiology (ESC). Eur Heart J. 2018;39(2):119–177. doi:10.1093/eurheartj/ehx393
15. van der Molen AJ, Reimer P, Dekkers IA, et al. Post-contrast acute kidney injury–Part 1: definition, clinical features, incidence, role of contrast medium and risk factors: Recommendations for updated ESUR Contrast Medium Safety Committee guidelines. Eur Radiol. 2018;28(7):2845–2855. doi:10.1007/s00330-017-5246-5
16. Alaswad K, Alqarqaz M. Complete revascularization in STEMI: why, how, and when? JACC Cardiovasc Interv. 2020;13(13):1583–1585. doi:10.1016/j.jcin.2020.05.022
17. Silver SA, Shah PM, Chertow GM, Harel S, Wald R, Harel Z. Risk prediction models for contrast induced nephropathy: systematic review [published correction appears in BMJ. 2015 Oct 08;351:h5401. doi: 10.1136/bmj.h5401]. BMJ. 2015;351:h4395. doi:10.1136/bmj.h4395
18. Marenzi G, Assanelli E, Campodonico J, et al. Contrast volume during primary percutaneous coronary intervention and subsequent contrast-induced nephropathy and mortality. Ann Intern Med. 2009;150(3):170–177. doi:10.7326/0003-4819-150-3-200902030-00006
19. Mohamed A. Predicting mortality and no-reflow in STEMI patients using epicardial adipose tissue. Clin Cardiol. 2021;44(10):1371–1376. doi:10.1002/clc.23692
20. Jehn S, Roggel A, Dykun I, et al. Epicardial adipose tissue and obstructive coronary artery disease in acute chest pain: the EPIC-ACS study. Eur Heart J Open. 2023;3(3):oead041. doi:10.1093/ehjopen/oead041
21. Zhao J, Cheng W, Dai Y, et al. Excessive accumulation of epicardial adipose tissue promotes microvascular obstruction formation after myocardial ischemia/reperfusion through modulating macrophages polarization. Cardiovasc Diabetol. 2024;23(1):236. doi:10.1186/s12933-024-02342-8
22. Kleinaki Z, Agouridis AP, Zafeiri M, Xanthos T, Tsioutis C. Epicardial adipose tissue deposition in patients with diabetes and renal impairment: analysis of the literature. World J Diabetes. 2020;11(2):33–41. doi:10.4239/wjd.v11.i2.33
23. Graham-Brown MP, McCann GP, Burton JO. Epicardial adipose tissue in patients with end-stage renal disease on haemodialysis. Curr Opin Nephrol Hypertens. 2015;24(6):517–524. doi:10.1097/MNH.0000000000000161
24. Çolak H, Kilicarslan B, Tekce H, et al. Relationship between epicardial adipose tissue, inflammation and volume markers in hemodialysis and transplant patients. Ther Apher Dial. 2015;19(1):56–62. doi:10.1111/1744-9987.12276
25. Akbas EM, Demirtas L, Ozcicek A, et al. Association of epicardial adipose tissue, neutrophil-to-lymphocyte ratio and platelet-to-lymphocyte ratio with diabetic nephropathy. Int J Clin Exp Med. 2014;7(7):1794–1801.
26. Drapkina J, Drapkina O. Epicardial fat as the predictor for essential hypertension and early vascular damage in patients with metabolic syndrome and non-alcoholic fatty liver disease. Endosc Ultrasound. 2014;3(Suppl 1):S2. doi:10.4103/2303-9027.129485
27. Nyawo TA, Pheiffer C, Mazibuko-Mbeje SE, et al. Physical exercise potentially targets epicardial adipose tissue to reduce cardiovascular disease risk in patients with metabolic diseases: oxidative stress and inflammation emerge as major therapeutic targets. Antioxidants. 2021;10(11):1758. doi:10.3390/antiox10111758
28. Packer M. Epicardial adipose tissue may mediate deleterious effects of obesity and inflammation on the myocardium. J Am Coll Cardiol. 2018;71(20):2360–2372. doi:10.1016/j.jacc.2018.03.509
29. Jortveit J, Pripp AH, Langørgen J, Halvorsen S. Incidence, risk factors and outcome of young patients with myocardial infarction. Heart. 2020;106(18):1420–1426. doi:10.1136/heartjnl-2019-316067
30. Islas F, Gutiérrez E, Cachofeiro V, et al. Importance of cardiac imaging assessment of epicardial adipose tissue after a first episode of myocardial infarction. Front Cardiovasc Med. 2022;9:995367. doi:10.3389/fcvm.2022.995367
31. Bière L, Behaghel V, Mateus V, et al. Relation of quantity of subepicardial adipose tissue to infarct size in patients with ST-elevation myocardial infarction. Am J Cardiol. 2017;119(12):1972–1978. doi:10.1016/j.amjcard.2017.03.024
32. Gavara J, Merenciano-Gonzalez H, Llopis-Lorente J, et al. Impact of epicardial adipose tissue on infarct size and left ventricular systolic function in patients with anterior ST-segment elevation myocardial infarction. Diagnostics. 2024;14(4):368. doi:10.3390/diagnostics14040368
33. Toya T, Corban MT, Imamura K, et al. Coronary perivascular epicardial adipose tissue and major adverse cardiovascular events after ST segment-elevation myocardial infarction. Atherosclerosis. 2020;302:27–35. doi:10.1016/j.atherosclerosis.2020.04.012
 © 2025 The Author(s). This work is published and licensed by Dove Medical Press Limited. The
full terms of this license are available at https://www.dovepress.com/terms.php
and incorporate the Creative Commons Attribution
- Non Commercial (unported, 4.0) License.
By accessing the work you hereby accept the Terms. Non-commercial uses of the work are permitted
without any further permission from Dove Medical Press Limited, provided the work is properly
attributed. For permission for commercial use of this work, please see paragraphs 4.2 and 5 of our Terms.
© 2025 The Author(s). This work is published and licensed by Dove Medical Press Limited. The
full terms of this license are available at https://www.dovepress.com/terms.php
and incorporate the Creative Commons Attribution
- Non Commercial (unported, 4.0) License.
By accessing the work you hereby accept the Terms. Non-commercial uses of the work are permitted
without any further permission from Dove Medical Press Limited, provided the work is properly
attributed. For permission for commercial use of this work, please see paragraphs 4.2 and 5 of our Terms.