")
Back to Journals » Diabetes, Metabolic Syndrome and Obesity » Volume 17
Association Between Percent Body Fat Reduction and Changes of the Metabolic Score for Insulin Resistance in Overweight/Obese People with Metabolic Dysfunction-Associated Steatotic Liver Disease
Authors Han Y, Liu J, Li W , Zhang F , Mao Y
Received 24 August 2024
Accepted for publication 29 November 2024
Published 11 December 2024 Volume 2024:17 Pages 4735—4747
DOI https://doi.org/10.2147/DMSO.S486841
Checked for plagiarism Yes
Review by Single anonymous peer review
Peer reviewer comments 2
Editor who approved publication: Dr Rebecca Conway
Yan Han,1,2,* Jinhan Liu,2,3,* Wenjian Li,4 Fan Zhang,1,2 Yonghua Mao1,5
1Department of Endocrinology, Changzhou Third People’s Hospital, Changzhou Medical Center, Nanjing Medical University, Changzhou, Jiangsu, People’s Republic of China; 2Department of Clinical Nutrition, Changzhou Third People’s Hospital, Changzhou Medical Center, Nanjing Medical University, Changzhou, Jiangsu, People’s Republic of China; 3Department of Liver Diseases, Changzhou Third People’s Hospital, Changzhou Medical Center, Nanjing Medical University, Changzhou, Jiangsu, People’s Republic of China; 4Department of Urology, Changzhou Third People’s Hospital, Changzhou Medical Center, Nanjing Medical University, Changzhou, Jiangsu, People’s Republic of China; 5Department of Nursing, Changzhou Third People’s Hospital, Changzhou Medical Center, Nanjing Medical University, Changzhou, Jiangsu, People’s Republic of China
*These authors contributed equally to this work
Correspondence: Fan Zhang; Yonghua Mao, Department of Endocrinology, Changzhou Third People’s Hospital, Changzhou Medical Center, Nanjing Medical University, 300 Lanling North Road, Changzhou, Jiangsu, 213001, People’s Republic of China, Tel +86-0519-82008311, Email [email protected]; [email protected]
Purpose: This study investigated the relationship between the difference in percent body fat (∆PBF) decrease and the change in the metabolic score for insulin resistance (METS-IR) in Chinese overweight/obese people with combined metabolic dysfunction-associated steatotic liver disease (MASLD) after weight loss.
Patients and Methods: A total of 357 overweight/obese MASLD patients were included using a retrospective study method. The subjects were divided into two groups (< 5% and ≥ 5%) based on the ∆PBF. The changes in METS-IR (∆METS-IR) and metabolic indices before and after fat loss were compared between the two groups. Spearman correlation analysis was employed to investigate the correlation between METS-IR changes and the decrease in PBF. A linear regression model was fitted using a restricted cubic spline (RCS) curve to investigate the dynamic relationship between ∆METS-IR and ∆PBF.
Results: Following the fat reduction, both groups’ body measurements and liver fat content exhibited a notable reduction, accompanied by a decline in METS-IR. In particular, the decrease in METS-IR was more pronounced in the group with a ≥ 5% decrease in PBF. Significant correlations were observed between ∆PBF and various insulin resistance indices. The correlation between ΔPBF and ∆METS-IR was noteworthy (r = 0.438, p < 0.001). RCS analysis revealed that when ΔPBF exceeded 3.2%, ∆METS-IR exhibited an upward trend with further reduction in PBF.
Conclusion: The reduction of PBF was closely associated with changes in METS-IR, indicating that fat loss is an effective method for improving insulin resistance in overweight/obese MASLD patients.
Keywords: metabolic dysfunction-associated steatotic liver disease, insulin resistance, metabolic score for insulin resistance, triglyceride-glucose index
Introduction
The prevalence of nonalcoholic fatty liver disease (NAFLD) has increased significantly over the past decade, becoming the most common liver disease in China. This rise can be attributed to the effective vaccination against viral hepatitis and significant lifestyle changes, including dietary transitions and reduced physical activity.1,2 NAFLD frequently coexists with metabolic dysfunctions such as overweight and obesity, type 2 diabetes mellitus (T2DM), and dyslipidemia. These conditions not only increase the risk of progression of liver diseases such as non-alcoholic steatohepatitis (NASH), liver fibrosis, cirrhosis, and hepatocellular carcinoma but also are closely associated with multiple metabolic complications, especially cardiovascular disease (CVD).3 In light of the background above, an international panel of experts proposed the concept of metabolic dysfunction-associated steatotic liver disease (MASLD). The diagnosis of MASLD is based on imaging and histologically confirmed hepatic steatosis, in addition to the fulfillment of at least one of the five cardio-metabolic criteria, which include overweight/obesity, T2DM, hypertension, reduced levels of high-density lipoprotein cholesterol (HDL-C), and elevated plasma triglyceride (TG) levels.4 Given that more than 95% of patients with NAFLD meet the diagnostic criteria for MASLD, epidemiological data on NAFLD may also inform MASLD, which also negatively affects patients’ quality of life and increases the burden of care.5 It has been demonstrated that the cumulative incidence and risk of CVD are 38% higher in patients with MASLD/ steatotic liver disease (SLD) compared to patients without MASLD /SLD.6
Insulin resistance (IR) indices are used to evaluate insulin sensitivity. It is essential in diagnosing and monitoring IR-related diseases, such as MASLD, T2DM, and CVD. Although the hyperinsulinemic-euglycemic clamp technique (HEC) is recognized as a classic index for assessing IR, its complex assay procedure and high technical requirements have limited its popularity in the population.7 In contrast, the homeostasis model assessment of insulin resistance (HOMA-IR) is the most widely used method for assessing IR in clinical practice. Its simplicity can only be calculated from fasting blood glucose and insulin levels.8 However, the HOMA-IR index has limitations regarding accuracy and stability. Novel indices for assessing IR have been proposed as medical research advances. These indices are based on a combination of routine clinical, biochemical assays and simple anthropometric measures, including the metabolic score for insulin resistance (METS-IR), the triglyceride-glucose index (TyG), and the triglyceride-to-high-density lipoprotein cholesterol ratio (TG/HDL-C), etc.9–11 These novel indices integrate more factors that reflect metabolic abnormalities without additional insulin measurement and demonstrate a strong correlation with HEC.9 These indices are simple and effective and more accurately identify the high-risk group of MASLD risk.12,13 They are, therefore, particularly suitable for large-sample epidemiological studies and routine clinical assessment.
Addressing obesity is particularly important in managing MASLD, as it can significantly improve IR, hepatic steatosis, fatty acid profiles, and associated cardiometabolic disturbances in patients. Although various weight loss methods are available, including dietary modification, exercise, pharmacotherapy, and even bariatric surgery, the fundamental and critical aspect of the weight loss process is reshaping a healthy lifestyle, including dietary calorie restriction and moderate physical activity.14 METS-IR, a recently developed evaluation index, has demonstrated considerable potential for assessing metabolic risk and screening insulin sensitivity. This study examined the relationship between changes in the summary IR indices and the degree of percent body fat (PBF) reduction following fat loss in Chinese adult overweight/obese MASLD patients. This will further explore the specific evidence of fat loss and improvement of IR and extend the application of METS-IR in clinical work.
Some studies have demonstrated that a 5% for weight loss from baseline is generally accepted as a “clinically meaningful” amount.15–18 However, in clinical practice, we have observed a noteworthy phenomenon: although some overweight/obese patients have achieved the 5% weight loss goal, there has been a notable loss of muscle tissue, while adipose tissue loss has been minimal or non-existent. In some cases, there has even been an increase in the PBF compared to the patient’s weight before weight loss. This phenomenon is referred to as “inappropriate weight loss”. The management of MASLD requires particular attention to obesity, as it can significantly improve IR, which in turn will help to minimize the harms caused by MASLD, including hepatic steatosis and associated cardiometabolic disturbances, and slow the progression of fibrosis. While numerous weight loss options exist, including dietary modifications, exercise, medication, and bariatric surgery, the essential and pivotal element of the weight loss process is forming a healthy lifestyle, encompassing dietary calorie restriction and moderate physical activity. In light of the observations above, it was hypothesized that overweight and obese MASLD populations with metabolic abnormalities would experience a notable benefit when PBF decreased by a minimum of 5% following weight loss. Accordingly, in this study, the reduction of PBF was employed as an indicator of weight loss effectiveness, with a ≥5% change in PBF used as the cut-off value for group comparison. This was done to investigate the relationship between the change in the IR index and the degree of reduction in PBF after weight loss in Chinese adults with overweight/obese MASLD.
Materials and Methods
Participants
A retrospective study included three hundred fifty-seven patients diagnosed with MASLD at Changzhou Third People’s Hospital between May 2018 and June 2023. The specific criteria for inclusion of subjects were as follows: (1) age ≥18 years old; (2) the controlled attenuation parameter (CAP) ≥238 dB/m, measured by vibration-controlled transient elastography (VCTE), must be which is used as a criterion for the determination of hepatic steatosis;19 (3) the body mass index (BMI) ≥24 kg/m2;20 (4) a reduction in PBF within one year after the initial dietary exercise instruction. The exclusion criteria were as follows: (1) fasting plasma glucose (FPG) ≥7.0 mmol/L or previously diagnosed diabetes mellitus or treated with hypoglycemic drugs; (2) blood pressure ≥130/85 mmHg or previously diagnosed hypertension and treated with antihypertensive drugs; (3) liver aminotransferase levels exceeding three times the upper limit of the normal range; (4) Other types of liver diseases, including viral hepatitis, excessive alcohol consumption (≥140 g/week for men, ≥70 g/week for women), drug-induced liver disease, and other types of liver diseases; (5) serious diseases such as cardiopulmonary dysfunction, serious infections, malignant tumors; (6) use of weight-loss-related drugs; (7) previous diagnosis of pancreatitis or use of lipid-lowering medications; (8) missing data.
This study was conducted in accordance with the ethical principles outlined in the Declaration of Helsinki and received formal approval from the Ethics Committee of Changzhou Third People’s Hospital. Due to the study’s retrospective nature and the data analyzed being derived from previous medical records, it was not feasible to contact all patients to obtain their written informed consent. To address this situation, we specifically applied for an exemption from the requirement of signing the informed consent form during the ethical review process, which was approved. Furthermore, patients’ personal information will be strictly identified and protected during the research process to ensure that the research is conducted without infringing on personal privacy or involving personal or commercial interests.
Study Design
This study employed uniform and standardized behavioral instructions for all participants who expressed a desire to lose weight. The guidance measures comprised two main aspects: (1) limited energy and balanced diet management. First, the daily energy intake was calculated based on the individual’s basal metabolic rate by multiplying it by a factor of 1.3 and subtracting 500 kcal. Individuals whose calculated energy value was less than 1200 kcal were given a daily energy intake recommendation of 1200 kcal. Furthermore, participants were provided with individualized dietary structure guidance based on the nutritional principles of 50% carbohydrate, 20% protein, and 30% fat. (2) Exercise training program: For exercise a moderate-intensity aerobic training program of 150 to 300 minutes per week was designed for all study participants. The training program only comprised brisk walking and jogging. Patients were monitored and assessed at intervals of three months and no more than one year after their initial visit and orientation. When multiple follow-ups were conducted, the most recent data were incorporated into the analysis.
Based on the degree of reduction in participants’ PBF, the subjects were categorized into two different groups: the first group (group ΔPBF < 5%) consisted of participants with less than 5% reduction in PBF. In contrast, the second group (group ΔPBF ≥ 5%) included participants with a 5% or more decrease in PBF. The grouping strategy facilitated further exploration of the effects of varying degrees of fat loss on participants’ health status.
Anthropometric and Laboratory Testing
This study determined the subjects’ height and weight by a precise ultrasonic height and weight measuring device (HNH-318 OMRON, Japan). BMI was calculated using the internationally accepted formula. The BMI is calculated as the body weight (kg) divided by the square of the height (m²). All subjects were maintained in a rigorously controlled fasting state for at least eight hours to ensure the precision of the test results. Subsequently, a 10-milliliter fasting blood sample was collected via venipuncture of the elbow vein during the morning hours. The samples were analyzed by a state-of-The-art automated biochemical analyzer (model LABOSPECT008AS, Hitachi Company, Japan) for FPG, TG, total cholesterol (TC), HDL-C, and low-density lipoprotein cholesterol (LDL-C), alanine aminotransferase (ALT), aspartate aminotransferase (AST), alkaline phosphatase (ALP), gamma-glutamyl transferase (GGT), total bilirubin (TBIL), albumin (ALB), creatinine (CREA), estimated glomerular filtration rate (eGFR) and uric acid (UA). Furthermore, fasting insulin (FINS) levels were evaluated using chemiluminescence (UniCel DxI 800, Beckman Coulter, USA).
CAP and Liver Stiffness Measurement (LSM)
Two professionally trained operators performed CAP and LSM measurements using a FibroScan-502 probe (Echosens, France). To ensure the accuracy of the test results, patients were instructed to fast for a minimum of eight hours before undergoing the examination. During the examination, the patient was positioned supine on the examination bed with the right arm fully abducted to allow for scanning of the right hepatic lobe through the intercostal space using the M-probe. The examination was considered valid when at least ten individual measurements were obtained and deemed valid. This study’s standard cut-off CAP for diagnosing fatty liver was set at ≥238 dB/m, while LSM measurements were recorded in kilopascals (kPa).19
Body Composition Analysis
In this study, body composition measurements were performed using the InBody770 (Biospace, Seoul, Korea), an instrument operated by two trained professionals. The data collected encompassed a multitude of critical indicators, including body weight, BMI, waist circumference (WC), waist-to-hip ratio (WHR), visceral fat area (VFA), PBF, body fat mass (BFM), fat mass index (FMI), free fat mass (FFM), free mass index (FFMI), skeletal muscle mass (SMM), skeletal muscle index (SMI), and basal metabolic rate (BMR).
IR Assessment Indices
To assess IR, we employed the following calculation formula:
- HOMA-IR = FPG(mmol/L)×FINS(mIU/L)/22.5;8
- METS-IR = ln[2×FPG(mmol/L)+ TG(mmol/L)]×BMI/ ln[HDL-C(mmol/L);9
- TyG = ln [TG(mg/dl)×FPG(mg/dl) /2];10
- TG/HDL-C = TG (mmol/L)/ HDL-C(mmol/L).
Statistical Analysis
The study was subjected to statistical analysis using SPSS 23.0 software (IBM Corporation, Armonk, New York, USA) and graphically represented using GraphPad Prism v.9.0 (GraphPad Software, USA). First, the normality of the data was assessed using the Kolmogorov–Smirnov test. For metric data that conformed to a normal distribution, the mean ± standard deviation was employed, and the independent samples t-test was utilized to compare differences between groups. Conversely, for quantitative data that were not normally distributed, the median (interquartile range, Q1, Q3) was used, and the Mann–Whitney U-test was selected to compare differences between groups. Categorical variables were presented as frequencies (percentages), and the chi-square test was employed to assess the significance of observed differences between groups. Propensity score matching (PSM) was used in this study to address potential imbalances in the data. The nearest neighbor method was utilized for the ΔPBF <5% group and the ΔPBF ≥5% group, with a matching ratio 1:1 and a caliper size set at 0.25. The variables included in the matching were age, gender, body measurements, CAP and LSM, liver and kidney function, glucose-lipid metabolism indices, and IR indices. The changes in variables before and after fat loss were compared using either a paired samples t-test (for normally distributed data) or a Wilcoxon rank sum test (for non-normally distributed data). PBF is regarded as a continuous variable. Spearman correlation analysis investigated the association between IR indices and ΔPBF. Furthermore, to explore the relationship between ΔPBF and ΔMETS-IR in patients who were overweight or obese and had MASLD, a restricted cubic spline (RCS) curve was employed after adjusting for age and gender. All statistical tests were conducted with a two-sided hypothesis, and differences were considered statistically significant at a P value of less than 0.05.
Results
Basic Information on the Subject of the Study
This study included 357 overweight/obese MASLD people. The objects underwent weight loss exclusively through diet and exercise guidance, reducing PBF within one year. Among these patients, 231 were males and 126 were females, with an average age of 38.00 (29.00, 47.00) years. The objects were divided into groups based on the extent of their PBF reduction over one year. The group ΔPBF < 5% (n=262, 73.39%) and the group ΔPBF ≥5% (n=95, 26.61%) (Table 1).
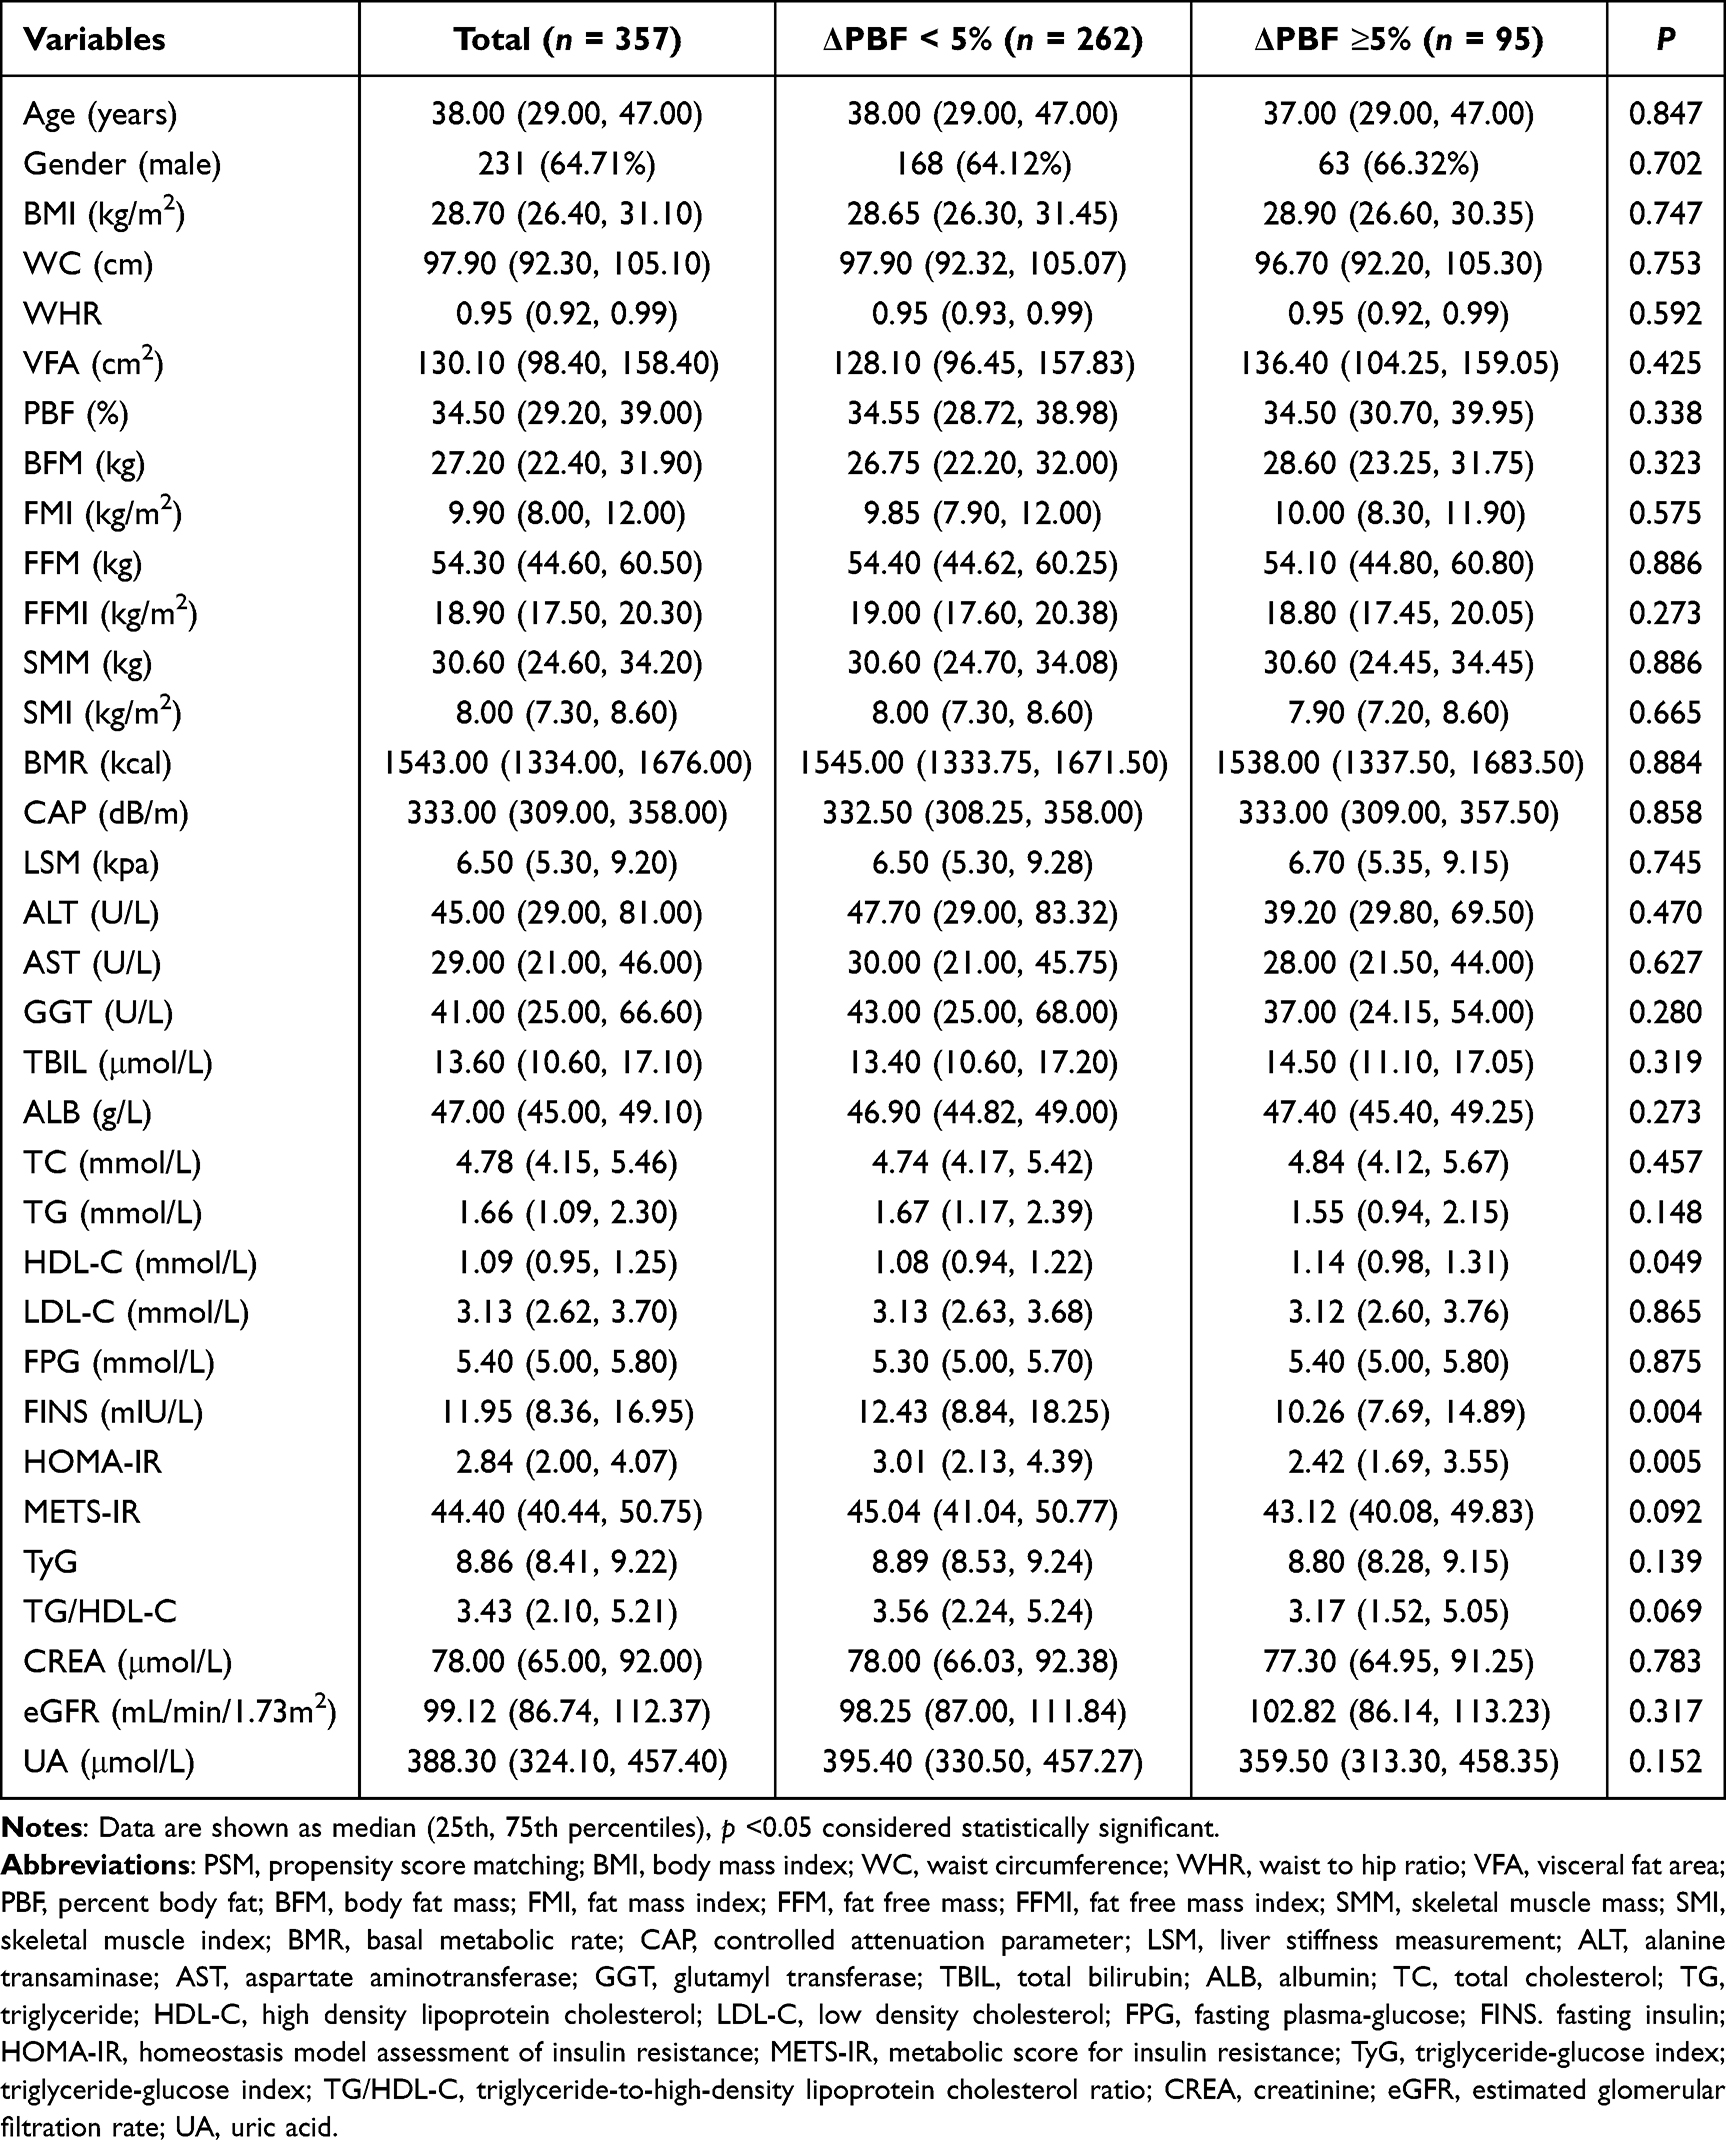 |
Table 1 Baseline Characterization of the Study Population Before PSM |
Baseline Characterization of the Study Population
A detailed comparison of the baseline characteristics of patients in the two groups was performed before PSM was applied. The results demonstrated that the two groups exhibited no statistically significant differences in age, gender, physical measures, CAP, LSM, liver and kidney function, UA, lipid metabolism indices (including TC, TG, and LDL-C), and IR indices (METS-IR, TyG, and TG/HDLC) (all p > 0.05). Notably, however, there were significant differences between the two groups in HDL-C (high-density lipoprotein cholesterol), FINS, and HOMA-IR (Table 1).
The two groups were further precisely matched by the PSM. After matching, 92 patients in each of the two groups were successfully matched. The comparison results demonstrated that the matched groups were statistically balanced concerning all baseline characteristics, including age, gender, body measurements, CAP, LSM, hepatic and renal function indices, UA, glucose-lipid metabolism indices, and IR indices (all p > 0.05). This result demonstrated that the PSM process effectively balanced the baseline characteristics of the two groups, providing a reliable basis for subsequent comparative analyses (Table 2).
 |
Table 2 Baseline Characterization of the Study Population After PSM |
Comparison of Changes Before and After Fat Loss in Different PBF Reduction Groups
This study was to compare the two groups (with varying degrees of PBF reduction) in terms of changes in various indicators before and after fat reduction. The results demonstrated that the two groups exhibited significant differences (all p < 0.01) in body measurements, including ΔBMI, ΔWC, ΔWHR, ΔVFA, ΔBFM, and ΔFMI. These findings indicated that fat loss significantly reduced body fat-related measurements. However, indicators representing muscle mass, such as ΔFFM, ΔFFMI, ΔSMM, and ΔSMI, did not demonstrate significant differences between the two groups (p > 0.05), indicating that muscle mass did not undergo a significant change during fat loss in different groups. The ΔCAP demonstrated a statistically significant difference between the two groups (p < 0.001), whereas the ΔLSM exhibited no significant difference (p > 0.05). This indicates that the reduction in PBF had a more pronounced impact on liver fat content, while the effect on liver stiffness was relatively limited. For the glycolipid metabolism indexes, there were significant differences between the two groups for ΔTC, ΔTG, and ΔLDL-C (all p < 0.05). This indicates that a reduction in PBF could reduce dyslipidemia. The insulin resistance indices ΔHOMA-IR, ΔMETS-IR, ΔTyG, and ΔTG/HDL-C exhibited significant intergroup differences (all p < 0.01). A more substantial decrease in body fat percentage was associated with a more significant reduction in the insulin resistance indices. (Table 3).
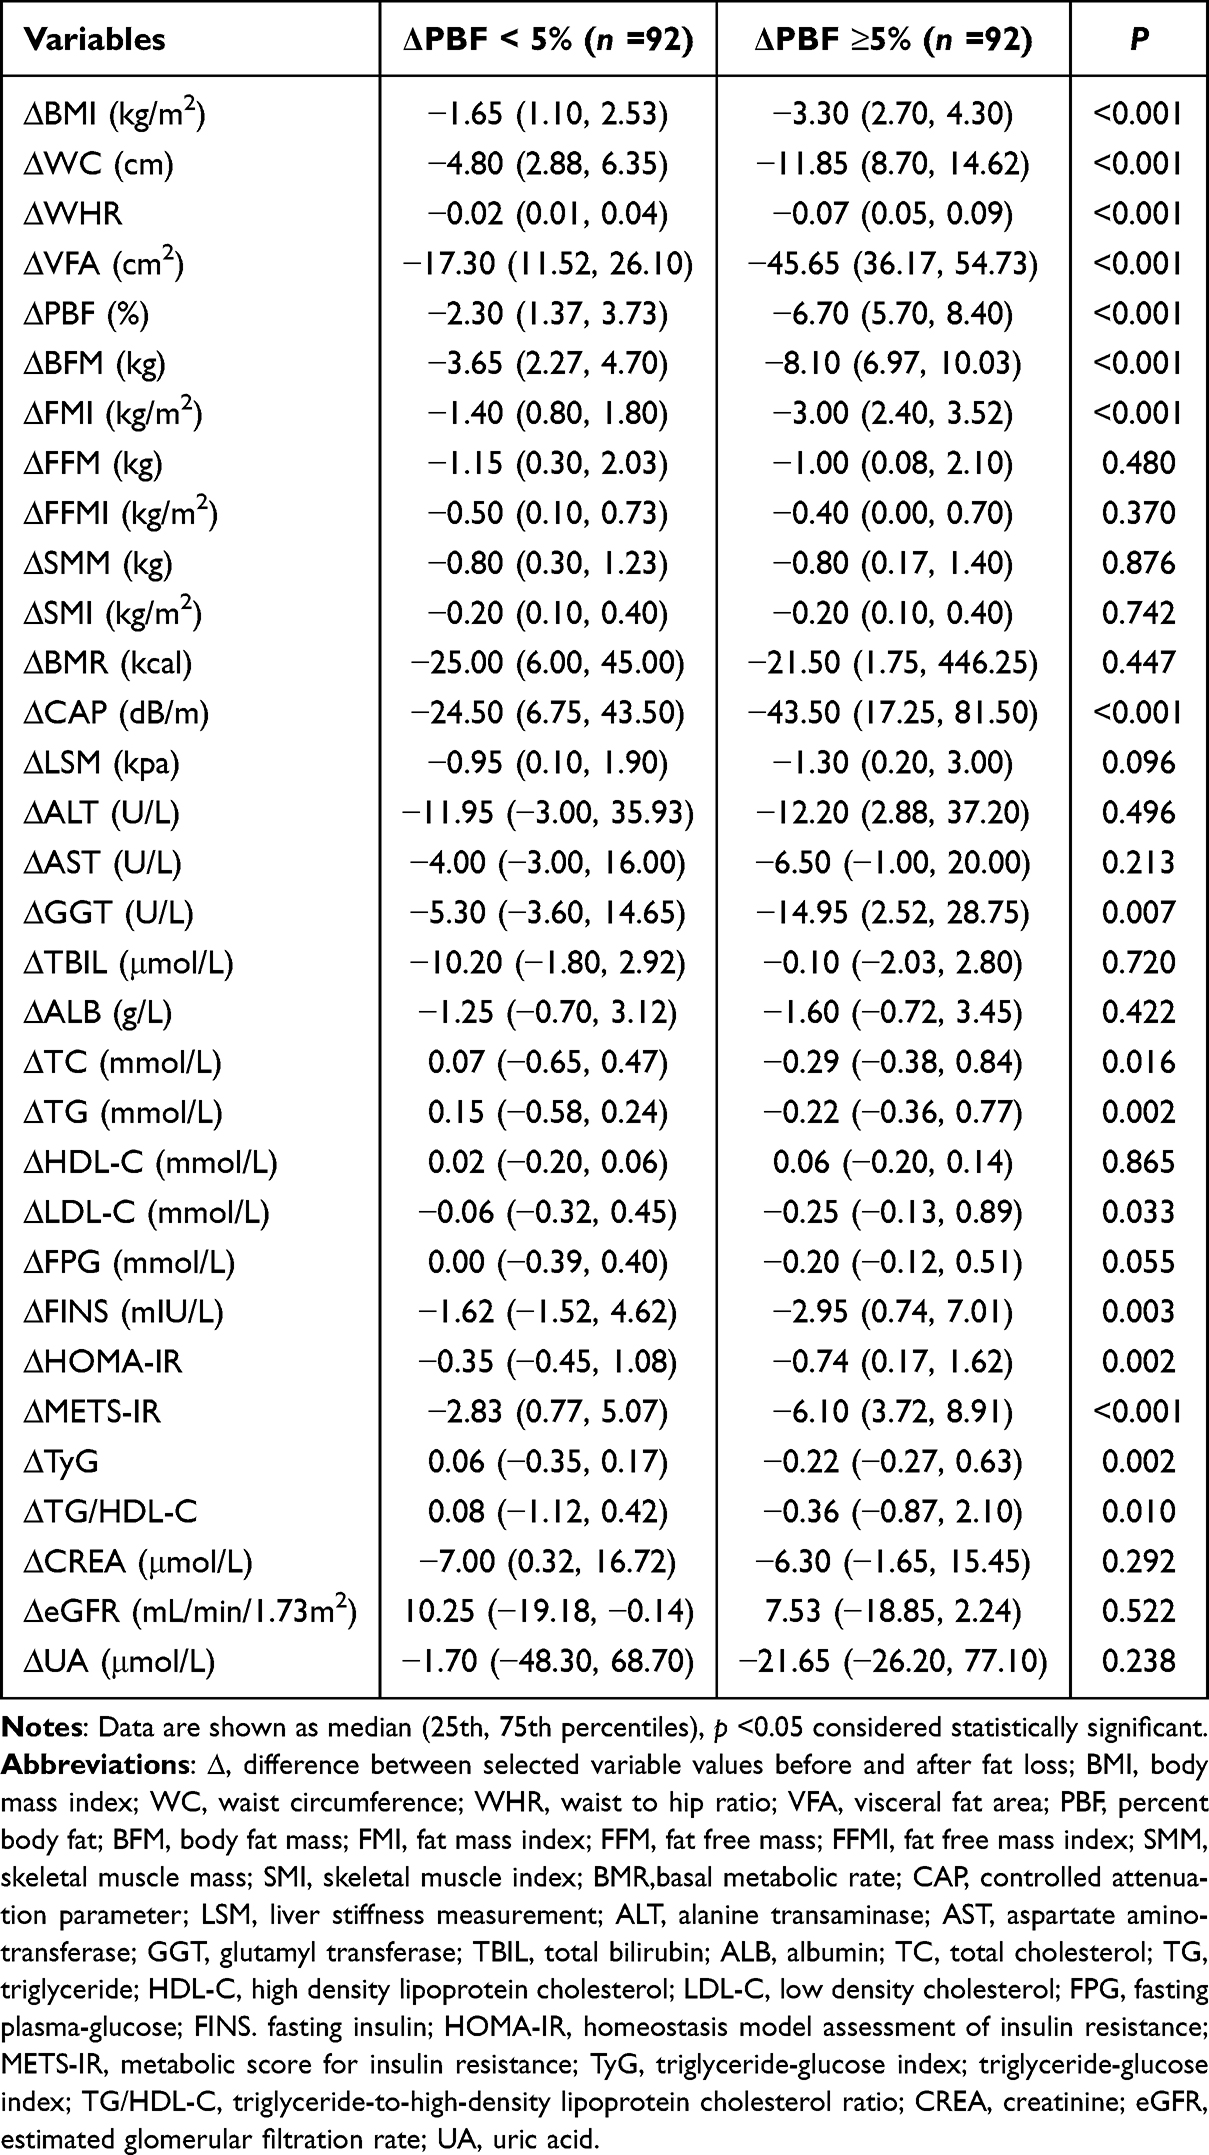 |
Table 3 Comparison of Changes in Different PBF Reduction Groups |
Correlation Between Changes in the IR Indices and Reduction in PBF
A total of 357 study participants were included in the analysis. ΔPBF was positively correlated with ΔHOMA-IR (r = 0.137, p = 0.009), ΔMETS-IR (r = 0.438, p < 0.001), ΔTyG (r = 0.147, p = 0.005) and ΔTG/HDL-C (r = 0.134, p = 0.011), respectively. Among the correlations, that between ΔPBF and ΔMETS-IR was the most significant, indicating that the relationship between METS-IR and the changes in PBF was closer than that observed with the other indices. Additional analyses demonstrated that ΔMETS-IR was not only strongly correlated with changes in PBF but also significantly and positively correlated with a range of body measurements, including ΔWC, ΔWHR, ΔVFA, ΔBFM, ΔFMI, and liver fat content (ΔCAP) (Table 4 and Figure 1). Notably, these correlation coefficients all exceeded the correlations of changes in other IR indices with the body above measurements and changes in hepatic fat content.
 |
Table 4 Correlation Between Changes of the IR Indices and Changes of Clinical Variables |
 |
Figure 1 The change in METS-IR positively correlated with the change of body fat indices. (a) Correlation of ∆METS-IR and ∆PBF. (b) Correlation of ∆METS-IR and ∆BFM. (c) Correlation of ∆METS-IR and ∆FMI. (d) Correlation of ∆METS-IR and ∆WC. (e) Correlation of ∆METS-IR and ∆ WHR. (f) Correlation of ∆METS-IR and ∆VFA. Abbreviations: ∆, difference between selected variable values before and after fat loss; METS-IR, metabolic score for insulin resistance; PBF, percent body fat; BFM, body fat mass; FMI, fat mass index; WC, waist circumference; WHR, waist to hip ratio; VFA, visceral fat area. |
RCS Analysis Between Reduction in PBF and Changes in the METS-IR
We employed a cubic spline function in conjunction with RCS analysis to investigate the relationship between ΔPBF and ΔMETS-IR in greater depth. To ensure the objectivity and accuracy of the results, this analysis was adjusted for age and gender. After the analysis, a significant correlation was observed between ΔPBF and ΔMETS-IR (p < 0.001). In particular, when the degree of improvement in PBF exceeded 3.2%, the degree of reduction in METS-IR exhibited an upward trend as the degree of improvement in ΔPBF increased. This finding indicates a robust linear relationship between the decrease in PBF and the improvement in IR within the specified range. The analysis did not reveal a nonlinear relationship between ΔPBF and ΔMETS-IR (p = 0.421) (Figure 2).
 |
Figure 2 Restricted cubic spline analysis of ΔPBF for estimating the degree of reduction in insulin resistance after adjusting for age and gender. The β value is displayed by the solid purple line, with the 95% confidence intervals represented by purple shading. Abbreviations: ∆, difference between selected variable values before and after fat loss; PBF, percent body fat; CI, confidence intervals. |
Discussion
The primary findings of this study were as follows: (1) Following the weight loss intervention, the ΔPBF ≥5% group exhibited more pronounced alterations in metabolic indices, including visceral fat, lipids, the insulin resistance indices, and CAP, compared to the ΔPBF <5% group. (2) The correlation between ΔPBF and ΔMETS-IR was particularly noteworthy, exhibiting the highest correlation coefficient. (3) When the change in PBF was higher than 3.2%, the change in METS-IR showed an increasing trend as the level of decreasing PBF increased.
The growing body of research on MASLD has yielded substantial evidence indicating a close relationship between MASLD and metabolic factors. This relationship is not limited to hepatic steatosis but encompasses five cardiovascular metabolic risk factors. Among these, overweight or obesity (BMI ≥23 kg/m2 Asia) is a significant contributor.4 In this study, we adhered to the Chinese criteria for defining overweight and selected patients with a BMI ≥24 as study subjects to ensure that all enrolled patients met the diagnostic criteria for MASLD.20 To minimize the impact of confounding variables, patients with a history of diabetes mellitus, hypertension, or those on hypoglycemic, antihypertensive, or lipid-regulating medications were excluded from the case screening process. This approach effectively controlled the influence of factors such as blood glucose, blood pressure, and extreme lipids on the study outcomes. Furthermore, to ensure the accuracy and reliability of the study, a propensity score matching method was employed to align the data from the different fat loss groups accurately.
The present study concentrated on the interrelationship between PBF alterations and IR indices after fat loss. The study employed several straightforward IR indices, including the METS-IR, TyG, and TG/HDL-C. These indices do not necessitate the measurement of insulin, which provides convenience for clinical application.21–23 METS-IR integrates several metabolism-related factors, such as FPG, TG, HDL-C, and BMI, and can comprehensively reflect the body’s metabolic status. In evaluating IR and cardiometabolic risk, METS-IR exhibits a high degree of concordance with the insulin sensitivity evaluation index (glucose metabolic rate/infusion rate) calculated by HEC.9,24,25 Previous study has successfully modeled the correlations between atherosclerosis risk variables and the IR risk assessment scale, with the three IR indices: TG/HDL-C, TyG index, and METS-IR. Among these indices, the METS-IR was recommended as the preferred formula for estimating IR due to its comprehensive assessment capability and high accuracy.26 In different PBF reduction groups, METS-IR was significantly reduced compared with baseline after fat reduction intervention. The group with more excellent PBF reduction showed a more significant reduction in METS-IR, suggesting that the improvement of IR was positively correlated with the degree of PBF reduction. The study’s results demonstrated a positive correlation between PBF changes and METS-IR changes. Several studies have confirmed the diagnostic efficacy of TyG and TG/HDL in the assessment of IR, which is essential in predicting cardiovascular risk and serious adverse events.27,28 The present study similarly found that the TyG index was significantly lower in both groups after fat loss compared to baseline. There was a positive correlation between the reduction in PBF and the decrease in the TyG index and TG/HDL-C. A comparison of the correlation between changes in IR indices and changes in PBF revealed that the highest correlation coefficient was found between changes in METS-IR and changes in PBF (r = 0.438, p < 0.001). Further RCS analysis demonstrated that when the change in PBF exceeded 3.2%, the degree of decrease in METS-IR tended to increase in proportion to the degree of decrease in PBF. This result suggests that the improvement of insulin resistance is more pronounced when the PBF decreases by more than 3.2%, which provides a reference for target values for fat loss in a clinical setting.
The present study additionally revealed that alterations in METS-IR were positively correlated with modifications in BFM and FMI, which reflect the level of whole-body adiposity and changes in WC, WHR, and VFA, which reflect visceral adiposity. In individuals with intra-abdominal fat accumulation, their hypertrophied adipocytes produce large amounts of free fatty acids (FFA) through lipolysis. These FFA enter the liver directly, inducing central (hepatic) IR by stimulating hepatic gluconeogenesis and triglyceride synthesis, inhibiting hepatic glucose utilization, and decreasing hepatic insulin uptake. Furthermore, elevated FFA levels in the bloodstream impede glucose utilization by muscle and adipose tissue, a phenomenon known as the glucose-fatty acid cycle. This ultimately leads to the development of peripheral-type IR.29,30
It has been demonstrated that for each standard deviation increase in the METS-IR score, there is a corresponding 34% increase in the risk of developing NAFLD.31 This finding suggests that METS-IR may serve as a valuable indicator for screening patients at risk for early-stage NAFLD. Few studies have examined the relationship between METS-IR and MASLD from the perspective of body fat alterations. The results of the present study demonstrated that the overweight/obese MASLD people exhibited 24.50 (6.75, 43.50) dB/m decrease in CAP values in the ΔPBF ≥5% group. In contrast, the ΔPBF <5% group demonstrated 43.50 (17.25, 81.50) dB/m decrease. The group with ΔPBF ≥5% exhibiting a more significant reduction in hepatic fat content. A positive correlation was also identified between the decrease in METS-IR and liver fat content after fat loss. The excess adipose tissue, particularly visceral fat, significantly contributes to chronic inflammation. The inflammatory state further impairs insulin signaling, perpetuating a vicious IR cycle.32 IR can affect the release of free fatty acids from adipocytes, leading to elevated levels of free fatty acids in the blood, which promotes hepatic fat accumulation. The direction of the causal relationship between the reduction of METS-IR and the improvement of hepatic fat content remains to be elucidated. However, when viewed from another perspective, this finding corroborates the positive effect of fat reduction on improving MASLD and provides new ideas for subsequent studies.
Given the superiority of low-fat content in improving metabolic function compared to weight loss alone, the current study further explored the relationship between changes in PBF and improvements in metabolic indicators. In this study, the ΔPBF ≥ 5% group showed improvement in metabolic indicators after weight loss. The ΔPBF ≥5% group exhibited more pronounced enhancements in TC, LDL-C, FPG, and TG/HDL-C compared to the ΔPBF <5% group. This indicates that the considerable decrease in PBF was significantly correlated with notable improvements in glucose metabolism, lipid metabolism, and IR by the anticipated health benefits of fat loss. It is important to note that during weight loss, there is a possibility of losing muscle mass, which can increase PBF instead of decrease. Nevertheless, monitoring the decline in PBF makes it possible to reflect body fat loss accurately. A proper weight loss strategy should aim to maintain or even increase muscle mass, which helps to increase the body’s basal metabolic rate. This, meanwhile, burns more calories even at rest, helping achieve long-term weight management.33 In the present study, despite a slight decline in indicators of skeletal muscle mass (eg, FFM, FFMI, SSM, and SMI) following fat loss, there was no significant difference in muscle loss between the two groups. This indicates that the weight management program, which involved limiting energy intake and engaging in appropriate exercise, is a scientifically sound approach. The program did not significantly affect muscle mass while ensuring a decrease in PBF, demonstrating its effectiveness in weight management.
The current study successfully matched data across different fat loss groups by applying a propensity score method, thus effectively eliminating confounding factors between two groups. This study design highlighted the inherent relationship between the changes in the IR indices before and after fat loss. It reflected the dynamic trends more accurately than cross-sectional studies. For further analysis, we identified a significant association between PBF changes and METS-IR changes. This allowed us to circumvent the problem of collinearity that might have arisen due to the possible inclusion of BMI in the calculation. It is important to acknowledge the limitations of this study. The present study is a retrospective analysis, and although the results are indicative of a potential causal relationship between PBF and each insulin sensitivity index, a large-sample, multicenter prospective study is necessary to validate this relationship further. In addition, while this study was able to hypothesize about the potential efficacy of dietary and exercise education interventions to a certain extent by observing the effects of fat loss in the enrolled study subjects, it is important to acknowledge that these interventions primarily rely on self-implementation and management by the study subjects, which may introduce bias in understanding and inconsistency in actual implementation, potentially impacting the study results. Furthermore, although we can infer the effectiveness of dietary and exercise education from the fat loss effect observed in the enrolled study subjects, it cannot be definitively assessed these objects’ implementation in the established program due to the lack of a rigorous follow-up design. Future studies must be thoroughly designed and examined to obtain more comprehensive and accurate conclusions. Finally, given that all study subjects were recruited from the same medical institution, there is a possibility that this may have introduced a degree of selection bias. To overcome this limitation, we collaborated with other healthcare organizations in future studies to expand the scope of the study to validate the study’s conclusions further and enhance its impact and utility in the academic community.
Conclusion
The results of this study confirm that the reduction of PBF is closely associated with changes in METS-IR, indicating that fat loss is an effective method for improving insulin resistance in overweight/obese MASLD people. As a novel and straightforward index for assessing insulin resistance, METS-IR demonstrated its potential clinical application in this study. These findings provide new strategies for treating MASLD people and emphasize the importance of fat reduction in metabolic health management.
Data Sharing Statement
The data used and/or analyzed during the current study are available from the corresponding author on reasonable request.
Institutional Review Board Statement
The study was conducted in accordance with the Declaration of Helsinki, and approved by the Ethics Committee of Changzhou Third People’s Hospital (02A-A20230023).
Informed Consent Statement
Informed consent was not required owing to the retrospective nature of the study.
Acknowledgments
The authors thank all the study participants for their assistance.
Author Contributions
All authors made a significant contribution to the work reported, whether that is in the conception, study design, execution, acquisition of data, analysis and interpretation, or in all these areas; took part in drafting, revising or critically reviewing the article; gave final approval of the version to be published; have agreed on the journal to which the article has been submitted; and agree to be accountable for all aspects of the work.
Funding
This research was funded by the Science and Technology Project of Changzhou [CJ20200059]-, and Key Talents Project of Changzhou Third People’s Hospital.
Disclosure
The authors report no conflicts of interest in this work.
References
1. Lou TW, Yang RX, Fan JG. The global burden of fatty liver disease: the major impact of China. Hepatobiliary Surg Nutr. 2024;13(1):119–123. doi:10.21037/hbsn-23-556
2. Cusi K, Isaacs S, Barb D, et al. American Association of Clinical Endocrinology Clinical Practice Guideline for the Diagnosis and Management of Nonalcoholic Fatty Liver Disease in Primary Care and Endocrinology Clinical Settings: co-Sponsored by the American Association for the Study of Liver Diseases (AASLD). Endocr Pract. 2022;28(5):528–562. doi:10.1016/j.eprac.2022.03.010
3. Zhou XD, Targher G, Byrne CD, et al. An international multidisciplinary consensus statement on MAFLD and the risk of CVD. Hepatol Int. 2023;17(4):773–791. doi:10.1007/s12072-023-10543-8
4. Rinella ME, Lazarus JV, Ratziu V, et al. A multisociety Delphi consensus statement on new fatty liver disease nomenclature. J Hepatol. 2023;79(6):1542–1556. doi:10.1016/j.jhep.2023.06.003
5. Song SJ, Lai JC, Wong GL, Wong VW, Yip TC. Can we use old NAFLD data under the new MASLD definition? J Hepatol. 2024;80(2):e54–e56. doi:10.1016/j.jhep.2023.07.021
6. Lee HH, Lee HA, Kim EJ, et al. Metabolic dysfunction-associated steatotic liver disease and risk of cardiovascular disease. Gut. 2024;73(3):533–540. doi:10.1136/gutjnl-2023-331003
7. DeFronzo RA, Tobin JD, Andres R. Glucose clamp technique: a method for quantifying insulin secretion and resistance. Am J Physiol. 1979;237(3):E214–223. doi:10.1152/ajpendo.1979.237.3.E214
8. Matthews DR, Hosker JP, Rudenski AS, Naylor BA, Treacher DF, Turner RC. Homeostasis model assessment: insulin resistance and beta-cell function from fasting plasma glucose and insulin concentrations in man. Diabetologia. 1985;28(7):412–419. doi:10.1007/BF00280883
9. Bello-Chavolla OY, Almeda-Valdes P, Gomez-Velasco D, et al. METS-IR, a novel score to evaluate insulin sensitivity, is predictive of visceral adiposity and incident type 2 diabetes. Eur J Endocrinol. 2018;178(5):533–544. doi:10.1530/EJE-17-0883
10. Simental-Mendía LE, Rodríguez-Morán M, Guerrero-Romero F. The product of fasting glucose and triglycerides as surrogate for identifying insulin resistance in apparently healthy subjects. Metab Syndr Relat Disord. 2008;6(4):299–304. doi:10.1089/met.2008.0034
11. Yi Q, Hu H, Zeng Q. Association of triglycerides to high density lipoprotein cholesterol ratio with hypertension in Chinese adults: a cross-sectional study. Clin Exp Hypertens. 2023;45(1):2195996. doi:10.1080/10641963.2023.2195996
12. Lee JH, Park K, Lee HS, Park HK, Han JH, Ahn SB. The usefulness of metabolic score for insulin resistance for the prediction of incident non-alcoholic fatty liver disease in Korean adults. Clin Mol Hepatol. 2022;28(4):814–826. doi:10.3350/cmh.2022.0099
13. Li H, Shi Z, Chen X, et al. Relationship Between Six Insulin Resistance Surrogates and Nonalcoholic Fatty Liver Disease Among Older Adults: a Cross-Sectional Study. Diabetes Metab Syndr Obes. 2023;16:1685–1696. doi:10.2147/DMSO.S409983
14. Armandi A, Bugianesi E. Dietary and pharmacological treatment in patients with metabolic-dysfunction associated steatotic liver disease. Eur J Intern Med. 2024;122:20–27. doi:10.1016/j.ejim.2024.01.005
15. Dhar D, Packer J, Michalopoulou S, et al. Assessing the evidence for health benefits of low-level weight loss: a systematic review. Int J Obes Lond. 2024;2024:1–15. doi:10.1038/s41366-024-01664-7
16. Wing RR, Lang W, Wadden TA, et al. Benefits of modest weight loss in improving cardiovascular risk factors in overweight and obese individuals with type 2 diabetes. Diabetes Care. 2011;34(7):1481–1486. doi:10.2337/dc10-2415
17. Ryan DH, Yockey SR. Weight Loss and Improvement in Comorbidity: differences at 5%, 10%, 15%, and Over. Curr Obes Rep. 2017;6(2):187–194. doi:10.1007/s13679-017-0262-y
18. Williamson DA, Bray GA, Ryan DH. Is 5% weight loss a satisfactory criterion to define clinically significant weight loss? Obesity. 2015;23(12):2319–2320. doi:10.1002/oby.21358
19. Sasso M, Beaugrand M, de Ledinghen V, et al. Controlled attenuation parameter (CAP): a novel VCTE™ guided ultrasonic attenuation measurement for the evaluation of hepatic steatosis: preliminary study and validation in a cohort of patients with chronic liver disease from various causes. Ultrasound Med Biol. 2010;36(11):1825–1835. doi:10.1016/j.ultrasmedbio.2010.07.005
20. Chen K, Shen Z, Gu W, et al. Prevalence of obesity and associated complications in China: a cross-sectional, real-world study in 15.8 million adults. Diabetes Obes Metab. 2023;25(11):3390–3399. doi:10.1111/dom.15238
21. Cui C, Qi Y, Song J, et al. Comparison of triglyceride glucose index and modified triglyceride glucose indices in prediction of cardiovascular diseases in middle aged and older Chinese adults. Cardiovasc Diabetol. 2024;23(1):185. doi:10.1186/s12933-024-02278-z
22. Tsai KZ, Chu CC, Huang WC, Sui X, Lavie CJ, Lin GM. Prediction of various insulin resistance indices for the risk of hypertension among military young adults: the CHIEF cohort study, 2014-2020. Cardiovasc Diabetol. 2024;23(1):141. doi:10.1186/s12933-024-02229-8
23. Huang W-C, Tsai K-Z, Yang K-T, Chen -H-H, Kwon Y, Lin G-M. A comparison of various insulin resistance indices and the possibility of hypertension in military adults: CHIEF study. Diabetol Metab Syndr. 2024;16(1):78. doi:10.1186/s13098-024-01323-x
24. Wang Z, Li W, Li J, Liu N. The Nonlinear Correlation Between a Novel Metabolic Score for Insulin Resistance and Subclinical Myocardial Injury in the General Population. Front Endocrinol. 2022;13:889379. doi:10.3389/fendo.2022.889379
25. Yang W, Cai X, Hu J, et al. The Metabolic Score for Insulin Resistance (METS-IR) Predicts Cardiovascular Disease and Its Subtypes in Patients with Hypertension and Obstructive Sleep Apnea. Clin Epidemiol. 2023;15:177–189. doi:10.2147/CLEP.S395938
26. Paublini H, López González AA, Busquets-Cortés C, Tomas-Gil P, Riutord-Sbert P, Ramírez-Manent JI. Relationship between Atherogenic Dyslipidaemia and Lipid Triad and Scales That Assess Insulin Resistance. Nutrients. 2023;15(9):2105. doi:10.3390/nu15092105
27. Wu Z, Zhou D, Liu Y, et al. Association of TyG index and TG/HDL-C ratio with arterial stiffness progression in a non-normotensive population. Cardiovasc Diabetol. 2021;20(1):134. doi:10.1186/s12933-021-01330-6
28. Oliveri A, Rebernick RJ, Kuppa A, et al. Comprehensive genetic study of the insulin resistance marker TG:HDL-C in the UK Biobank. Nat Genet. 2024;56(2):212–221. doi:10.1038/s41588-023-01625-2
29. Ibrahim MM. Subcutaneous and visceral adipose tissue: structural and functional differences. Obes Rev. 2010;11(1):11–18. doi:10.1111/j.1467-789X.2009.00623.x
30. Sears B, Perry M. The role of fatty acids in insulin resistance. Lipids Health Dis. 2015;14(1):121. doi:10.1186/s12944-015-0123-1
31. Cai X, Gao J, Hu J, et al. Dose-Response Associations of Metabolic Score for Insulin Resistance Index with Nonalcoholic Fatty Liver Disease among a Nonobese Chinese Population: retrospective Evidence from a Population-Based Cohort Study. Dis Markers. 2022;2022:4930355. doi:10.1155/2022/4930355
32. Oussaada SM, Kilicarslan M, de Weijer BA, et al. Tissue-specific inflammation and insulin sensitivity in subjects with obesity. Diabet Res Clin Pract. 2024;211:111663. doi:10.1016/j.diabres.2024.111663
33. Sanders FWB, Acharjee A, Walker C, et al. Hepatic steatosis risk is partly driven by increased de novo lipogenesis following carbohydrate consumption. Genome Biol. 2018;19(1):79. doi:10.1186/s13059-018-1439-8
 © 2024 The Author(s). This work is published and licensed by Dove Medical Press Limited. The
full terms of this license are available at https://www.dovepress.com/terms.php
and incorporate the Creative Commons Attribution
- Non Commercial (unported, 3.0) License.
By accessing the work you hereby accept the Terms. Non-commercial uses of the work are permitted
without any further permission from Dove Medical Press Limited, provided the work is properly
attributed. For permission for commercial use of this work, please see paragraphs 4.2 and 5 of our Terms.
© 2024 The Author(s). This work is published and licensed by Dove Medical Press Limited. The
full terms of this license are available at https://www.dovepress.com/terms.php
and incorporate the Creative Commons Attribution
- Non Commercial (unported, 3.0) License.
By accessing the work you hereby accept the Terms. Non-commercial uses of the work are permitted
without any further permission from Dove Medical Press Limited, provided the work is properly
attributed. For permission for commercial use of this work, please see paragraphs 4.2 and 5 of our Terms.