")
Back to Journals » International Journal of Nanomedicine » Volume 19
Biomimetic Morphogenesis of Strontium Chitosan-Gelatin Composite Aggregates via EPD and Biomineralization in vitro and in vivo
Authors Gong L , Jiang T, Xiao T, Feng B, Wei M, Liu C, Xiao W, Huang P, Huang D
Received 6 September 2024
Accepted for publication 31 October 2024
Published 9 November 2024 Volume 2024:19 Pages 11651—11669
DOI https://doi.org/10.2147/IJN.S476874
Checked for plagiarism Yes
Review by Single anonymous peer review
Peer reviewer comments 2
Editor who approved publication: Prof. Dr. Anderson Oliveira Lobo
Lingling Gong,1,2 Tao Jiang,3,4 Ting Xiao,1,2 Bo Feng,1,2 Mouda Wei,5 Chuanzi Liu,3 Weiwei Xiao,1,2 Pin Huang,5 Dan Huang6– 8
1Department of prosthodontics, Changsha Stomatological Hospital, Changsha, Hunan, People’s Republic of China; 2Department of prosthodontics, School of Stomatology, Hunan University of Chinese Medicine, Changsha, Hunan, People’s Republic of China; 3The State Key Laboratory Breeding Base of Basic Science of Stomatology (Hubei- MOST) & Key Laboratory of Oral Biomedicine Ministry of Education, School & Hospital of Stomatology, Wuhan University, Wuhan, People’s Republic of China; 4Department of Prosthodontics, Hospital of Stomatology, Wuhan University, Wuhan, People’s Republic of China; 5Department of Pediatric Dentistry, Ubcare Dental Clinic Co. Ltd, Changsha, Hunan, People’s Republic of China; 6Department of Stomatology, Tongji Hospital, Tongji Medical College, Huazhong University of Science and Technology, Wuhan, People’s Republic of China; 7Department of Prosthodontics and Implantology, School of Stomatology, Tongji Medical College, Huazhong University of Science and Technology, Wuhan, People’s Republic of China; 8Hubei Province Key Laboratory of Oral and Maxillofacial Development and Regeneration, Huazhong University of Science and Technology, Wuhan, People’s Republic of China
Correspondence: Pin Huang, Department of Pediatric Dentistry, Ubcare Dental Clinic Co. ltd, 768 Xiangzhang Road, Yuhua District, Changsha City, Hunan province, People’s Republic of China, Email [email protected] Dan Huang, Department of Stomatology, Tongji Hospital, Tongji Medical College, Huazhong University of Science and Technology, 1095 Jiefang Avenue, Wuhan, Hubei, People’s Republic of China, Email [email protected]
Introduction: Biomineralization has been increasingly adopted for the synthesis of advanced materials with superior properties. Hierarchical architecture growth mimicking biomineralization has been studied using various organic molecules to template inorganic materials with controlled morphology. In our previous study, self-assembled Sr/CS/G(SrCO3-chitosan-gelatin) aggregates were fabricated using electrophoretic deposition (EPD). This study is a further step toward understanding the morphogenesis of Sr/CS/G aggregates and its biomineralization.
Methods: Scanning electron microscopy (SEM), transmission electron microscopy (TEM), and X-ray diffraction (XRD) were used to investigate the biomimetic morphogenesis of Sr/CS/G composite under various EPD parameters, such as polymer concentration, time, and voltage. The Sr/CS/G aggregates were immersed in H2O, phosphate-buffered saline (PBS), and simulated body fluid (SBF) to study the bioactive apatite formation ability. In addition, biocompatibility of the composites were evaluated by Fluorescence staining, SEM in vitro. The osteogenic ability of the coatings induced by PBS were tested in vivo.
Results: The CS/G weight ratio, EPD time, and voltage were found to influence the morphogenesis of Sr/CS/G aggregates. SEM and TEM results showed that the Sr/CS/G aggregates exhibited fractal growth characteristics and morphological self-similarity. XRD results confirmed the formation of SrCO3 crystals within the framework of chitosan and gelatin organic templates. Chitosan played a vital role in branching growth of the crystals, whereas gelatin guided the formation of composite spheres. The microstructural and compositional results reveal that the Sr/CS/G-induced apatite coating yielded a large quantity of apatite. These apatite coatings promote the cytocompatibility and osteogenesis of rat bone marrow mesenchymal stem cells (rBMSCs) in vitro. The coatings induced by PBS enhanced proliferation and mineralization in vitro, and enhanced angiogenesis and osteogenesis in vivo.
Conclusion: Sr/CS/G composites prepared via EPD are promising organic-inorganic templates for biomineralization. These findings provide important insights into understanding the mineralization process and optimizing the design of advanced biological materials.
Keywords: biomineralization, EPD parameter, Sr/CS/G aggregates, morphogenesis, hydroxyapatite
Introduction
Biomineralization is a typical self-organized, evolutionarily optimized system dedicated to the regulation of nucleation, phase transitions, and morphogenesis of inorganic constituents of (bio)minerals.1 However, the process of biomineralization is complex and specific to each hard tissue. Hierarchical architecture growth mimicking biomineralization has been studied using various types of organic molecules to template inorganic materials with controlled morphologies.2–4 Organic molecules, as crystal modifiers, play an important role in controlling the shape and architecture of the crystallizing and growing inorganic materials.
Carbonates are the main inorganic components in exoskeletons and tissues of various mineralization organisms. The biomimetic synthesis of metal carbonates, especially calcium carbonate (CaCO3), in the presence of organic templates and/or additives has been intensively investigated in recent years.1 Similarly, strontium carbonate (SrCO3) is a simple mineral with only one polymorph, and its crystallization provides insights into the formation of the isostructural calcium carbonate phase (aragonite) and the mineralization process of other biominerals.5 In line with its chemical analogy to calcium, Sr is a bone-seeking element that is absorbed on the bone apatite surface or substitutes Ca positions in the bone crystal.6,7 In our previous research, self-assembled Sr/CS/G aggregates fabricated via electrophoretic deposition have been described.8 The SEM images showed dumbbell-like to flower-like morphologies with nanostructured subunits. The aggregates exhibited good mechanical properties and enhanced the proliferation and differentiation of preosteoblasts in vitro. However, the morphogenesis of these aggregates remains unknown. The formation of Sr/CS/G aggregates became more complicated when the ratio of chitosan to gelatin and other reaction parameters (such as deposition time and applied electric field) varied, which calls for further investigation into the underlying mechanism. In biosystems, apatite is one of the main inorganic minerals in vertebrate hard tissues such as bone and dental enamel. Biological apatite can generally be characterized as nonstoichiometric carbonated hydroxyapatite with a carbonate ion content of approximately 1–9 wt%.9 It has been reported that strontium can substitute calcium in the mineral phase of bone in the form of strontium hydroxyapatite (SrHA) because of the similar ionic radii of Ca2+ and Sr2+ ions.10–12 SrHA not only controls the sustained release of Sr2+ ions from SrHA, but also accelerates bone formation and overcomes the disadvantages of hydroxyapatite (HA) with no osteo-inductivity.13–15
To better understand the bioactivity of Sr/CS/G aggregates for apatite precipitation in solutions where ion concentrations resemble those of human blood plasma, the aggregates were immersed in PBS and SBF for predicting the in vivo bone bioactivity.16,17
The present work represents a further step in the morphogenesis of Sr/CS/G aggregates grown under different modulating factors (polymer concentration, time, atmosphere, and EPD voltage) using SEM, TEM, and XRD. Furthermore, the apatite formation ability of these aggregates is induced by different fluids as well as by the primary biological study of these apatites. Research into biomimetic strontium-chitosan-gelatin composites has led to a better understanding of the material from the atomic to mesoscale level.
Materials and Methods
Materials
Pure titanium disks (15 mm in diameter, 1 mm thick; Baoji Titanium Industry Co., Ltd) were carefully grit blasted, acid-etched, and ultrasonically cleaned. Chitosan (MW 1,000,000 Da) was supplied by the Golden-Shell Biochemical Co., Ltd. (Zhejiang, China). Gel powder (type A, G1890) was purchased from Sigma Chemical Co. (St. Louis, MO, USA). Strontium chloride was purchased from Aladdin (Shanghai, China). The phosphate buffered saline (1x) was purchased from HyClone (Utah, USA).
Preparation of Electrophoretic Solutions and EPD Process
Chitosan was dissolved in hydrochloric acid, and the pH value was adjusted to 4.0 using NaOH, then gelatin was dissolved into the chitosan solution at 60°C for 1.5 h. Strontium chloride was added to the above chitosan/gelatin solution to get the final EPD solution. A Ti disk and a platinum plate were used as the electrodes during the EPD process at a distance of 50 mm from each other. A direct-current power supply (Model 6614C, Agilent Technologies, California, USA) was used to conduct EPD. After deposition, the coated Ti disk was removed from the solution, rinsed gently with Milli-Q water, and air-dried overnight for future studies.
Factors Modulating the Formation of Sr/CS/G/ Composites During Deposition
CS/G Weight Ratio
The effect of the CS/G weight ratio on the formation of Sr/CS/G composites was investigated. The samples used are listed in Table 1. Field emission scanning electron microscopy (FESEM; Zeiss, Oberkochen, Germany) was used to observe the surface morphology of the membranes sputtered with gold. The crystalline states of the products were analyzed using an X-ray diffractometer (XRD; Bruker AXS D8 Advance, Karlsruhe, Germany) at 30 kV and 30 mA with CuKg radiation. The diffraction angle ranged from 51 to 601 (2y) with a step size of 0.021 (2y). The crystallinity index was also calculated.
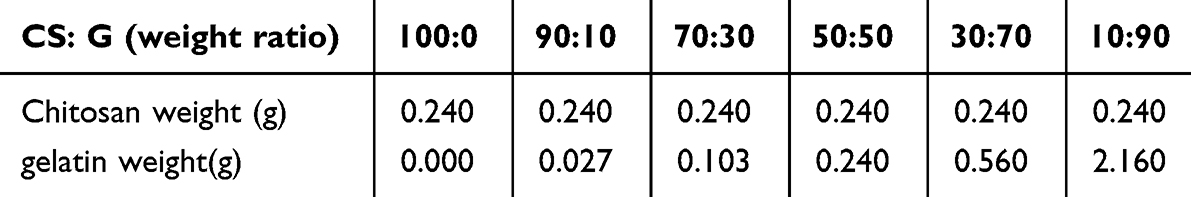 |
Table 1 CS: G Weight Ratio (Volume=40mL, voltage=3.5V, Time=180s, Sr=0.25g/40mL) |
EPD Parameters
Deposition Voltage
To investigate the influence of the EPD parameter on the product morphology, depositions were performed under different applied electric fields at 2V, 4V, 6V, 8V for 180s. The corresponding variation in the current intensity (mA) with time is shown (n=3). After each deposition, the power was turned off and the cathode electrode with the products was removed from the suspension. The surface morphologies of the composites were investigated by FESEM.
Operational pH
Operational pH measurements were performed in the samples (CS/G weight ratio=30:70, voltage=3.5V, time=180s, Sr=0.25g/40 mL, n=3) at different EPD time intervals. The pH was measured according to the ASTM D6423-19 standard protocol using a Thermo Scientific pH measurement. The pH electrode was calibrated using fresh Thermo Scientific buffers (pH 1.68, 4.01, and 7.00) prior to each measurement. The suspensions were then magnetically stirred. The pH probe was immersed in the stirred suspensions and the values were recorded 30s after immersion. The corresponding zeta potential of the EPD suspension was measured by photon correlation spectroscopy (Zetasizer 3000, Malvern Instruments, UK).
Deposition Time
To further understand the morphology of the products at different EPD time intervals, the EDP suspension near the cathode was sucked up and diluted 50 times with Milli-Q water, and the samples were examined using transmission electron microscopy. The morphology of the product was investigated at different time intervals using FESEM.
Biomineralization of Sr/CS/G Composites
Acellular in vitro Mineralization
The samples (CS/G weight ratio=30:70, voltage=3.5V, time=180s, Sr concentration in SrL group= 0.25g/40 mL, Sr concentration in SrH group= 1.0g/40 mL,) were chosen to investigate the level of acellular in vitro mineralization of the products, the samples were immersed in 5 mL Milli-Q water, PBS and SBF solutions (as showed in Table S1) separately and were then incubated at 37◦C for various time duration. At each time point, the samples were removed from the solution, rinsed with Milli-Q water, and air dried. The immersed samples were examined by SEM and XRD.
In vitro Cytocompatibility
Samples Preparation
The deposited samples (CS/G ratio=30:70, voltage=3.5V, time=180s, Sr=0.25g/40 mL) were immersed in Milli-Q water, PBS, and SBF for 24h, and then washed with Milli-Q water, and air-dried. The three groups were named H2O-Sr (H-Sr), PBS-Sr, (P-Sr), and SBF-Sr(S-Sr), respectively. Before cell culture, the samples were autoclaved for cytological evaluation.
Culture of rBMSCs
Primary rBMSCs were isolated from the bone marrow of femurs of 6-week-old male Wistar rats. This study was approved by the Animal Research Committee of Hunan University of Chinese Medicine (ethics approval number: LLBH −202310260002). The cells were maintained in alpha minimum essential medium (α-MEM, SH30265, Hyclone, Logan, UT, USA) containing 10% fetal bovine serum (FBS, SH30068, Hyclone, Logan, UT, USA) and 1% penicillin-streptomycin (SV30010, Hyclone, Logan, UT, USA). The cells were cultured at 37◦C in a humidified 5% CO2 atmosphere, and the medium was refreshed every three days. When the cells reached confluence, they were digested with 0.25% trypsin/EDTA (SH30042; Hyclone, Logan, UT, USA) and seeded at a density of 2×10⁴/cm2. Cells at passage 2–4 were used in subsequent experiments.
Early Cell Adhesion and Cytoskeleton Characteristics
DAPI and rhodamine phalloidin (RH) staining was performed to assess early cell adhesion and cytoskeletal properties. After culturing the cells on the samples for 24 h, they were fixed in 4% paraformaldehyde for 15 min. Cell membranes were permeabilized with 0.3% Triton X-100 for 15 min, followed by incubation in 1% bovine serum albumin (BSA) for 30 min to block non-specific binding sites. Next, RH (Molecular Probes, Invitrogen, USA) and DAPI (Invitrogen, Basel, Switzerland) were prepared, and the cells were stained in the dark for 20 and 15 min, respectively. Fluorescence microscopy (Nikon TE-2000, Japan) was used to observe the F-actin and cell nuclei.
Cell Morphology
FESEM was applied to observe the cell morphology and specifics of the cell-material interactions. After 24 h of culture, the samples were fixed in 2.5% glutaraldehyde overnight at 4◦C, dehydrated in a graded ethanol series, sputter-coated with gold, and observed using FESEM.
Cell Proliferation
Cell proliferation was evaluated using the cell counting kit-8 (CCK-8; Dojindo Laboratories, Japan) after the cells were co-cultured with various samples for 1, 4, and 7 days. At each time point, the culture medium was replaced with fresh medium containing 10% CCK-8 solution and the cells were incubated at 37◦C for 1 h. Next, 100 μL of the suspension was added to a 96-well plate and the absorbance at 450 nm was measured.
Extra Cellular Matrix Mineralization Assay
After cultured on the samples for 28 days, the cells were fixed in 70% ethanol for 1 h and stained with alizarin red solution (ARS) (Iwai Chemicals, Japan) for 30 min. The unbound red residue was rinsed with PBS and the samples were incubated with 10% cetylpyridinium chloride (CPC) (Sigma, USA) in 10 mm sodium phosphate (pH 7.0) at 37◦C overnight. Aliquots of the extracted stain were transferred to a 96-well plate and the OD value of the solution was read at 562 nm.
Osteogenic Ability in vivo
All animal experiments were approved by the Animal Research Committee of Hunan University of Chinese Medicine (ethics approval number: LLBH −202310260002), and all surgical procedures were conducted according to the National Institutes of Health Guide. Twenty-four Sprague Dawley rats (SD, male, 6–8 weeks old) were randomized into three groups (CS/G, SrL, and SrH groups). Before implantation, the membranes were immersed in PBS for 24h and then washed with Milli-Q water. After anesthesia, two critical-sized calvarial defects (5 mm in diameter) were established. Subsequently, every calvarial defects were treated with three pre-prepared membranes. After surgery, the rats were administered antibiotics for three days to prevent infection. The rats were sacrificed with an overdose of anesthetic 4 and 8 weeks postoperatively. Calvaria from rats were fixed with 4% paraformaldehyde. After decalcification, the samples were embedded in paraffin and sectioned, then the paraffin-embedded sections were subjected to Hematoxylin and eosin (HE) staining.
Statistical Analysis
One-way analysis of variance and post hoc Tukey’s testing were performed using SPSS 20.0 (SPSS Inc., Chicago, IL, USA) for statistical analysis. ***and *** stand for P< 0.05, P< 0.01, and P< 0.001, respectively. Statistical significance was set at P< 0.05.
Results
Morphogenesis of the Biomimetic Sr/CS/G Aggregates via EPD
Influence of EPD Parameter on Morphogenesis
CS/G Weight Ratio
To explore the role of chitosan and gelatin in morphogenesis, different weight ratios of CS:G (100:0, 90:10, 70:30, 50:50, 30:70, and 10:90) were applied to the EPD solution. The morphologies of the different aggregates are shown in Figure 1. In the 100:0 group, well-branched rod-like products with a diameter of approximately 400 nm were observed, presenting a branched structure that externalized the self-similarity of the fractal structure (Figure 1a). When different amounts of gelatin were added to the EPD suspension, the products present a trend to swell up, turning into flower-like and dumbbell-like structures (Figure 1b-e). High-magnification SEM images revealed that the flower-like particles were constructed nanoparticles, each approximately 20 nm in diameter, exhibiting a mesoporous structure (Figure 1d and e inset). Uniform spherical particles with diameter of 2–10 μm were observed in the 10:90 group (Figure 1f). The results indicate that the CS/G weight ratio had a significant impact on the morphology of the products.
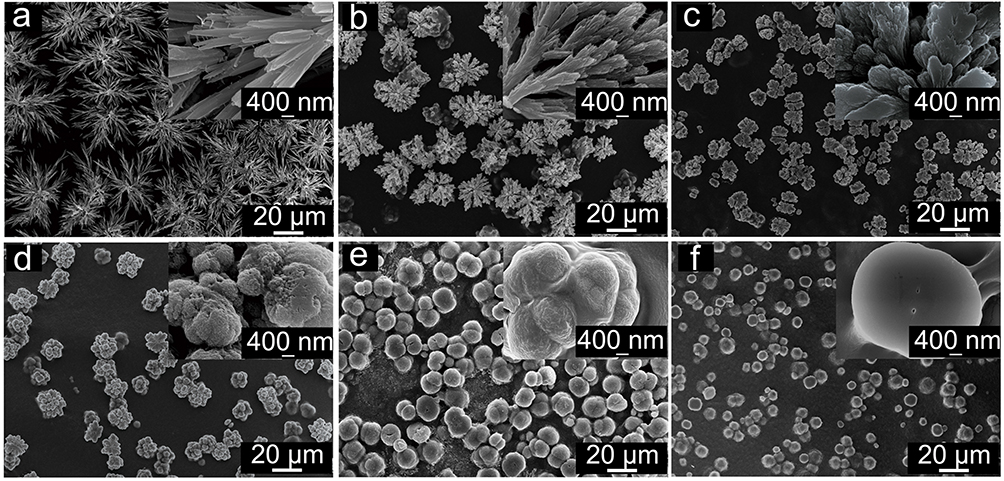 |
Figure 1 SEM images of Sr/CS/G membranes by different proportion of chitosan versus gelatin: (a) 100:0, (b) 90:10, (c) 70:30, (d) 50:50, (e)30:70, (f) 10:90. |
The corresponding XRD patterns are shown in Figure 2 and the detailed percentages of crystallinity are listed in Table 2. The main peaks in these patterns can be indexed as orthorhombic phase (JCPDS No. 84–0418) with lattice constants of a = 5.107 Å, b = 8.414 Å, c = 6.029 Å, and α = β = γ = 90. By comparing the XRD patterns of the as-synthesized SrCO3 crystal with the standard, the diffraction peaks located at 2θ (in degrees) of 20.53°, 25.35, 25.79, 29.71 and 31.59 are readily indexed as the (110), (111), (021), (002), and (012) planes for SrCO3, respectively, which proved the formation of SrCO3 in all groups. SrCO3 crystallized better in the 100:0 and 10:90 groups than that in group 50:50. Figure 2 also suggests that 021 merged with 111 into a single broad peak in the diffraction profiles of the 70:30, 50:50, and 30:70 groups, and that the diffraction peaks of these profiles were broadened. The broad peaks indicate a less well-ordered material and finer particles, which is in accordance with the SEM results (Figure 1c, d, and e inset).
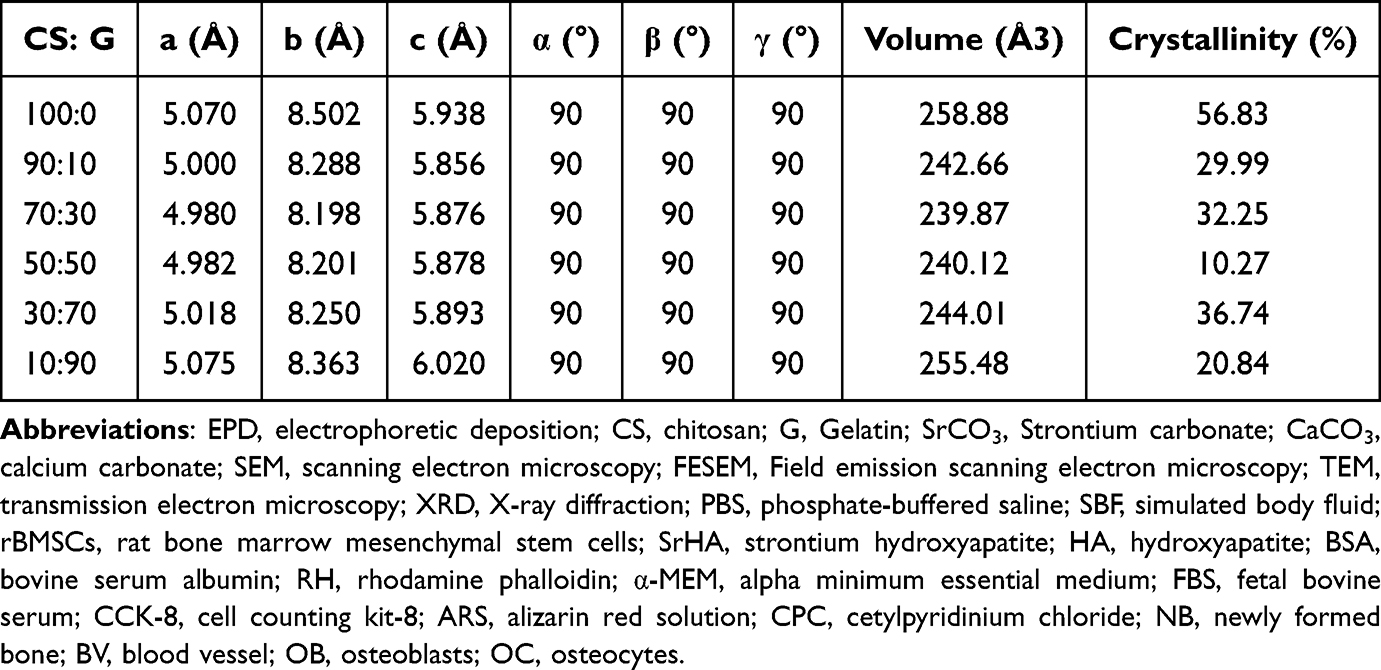 |
Table 2 Percentage of Crystallinity of CS/G/Sr Membranes in Various Chitosan/Gelatin Weight Ratios |
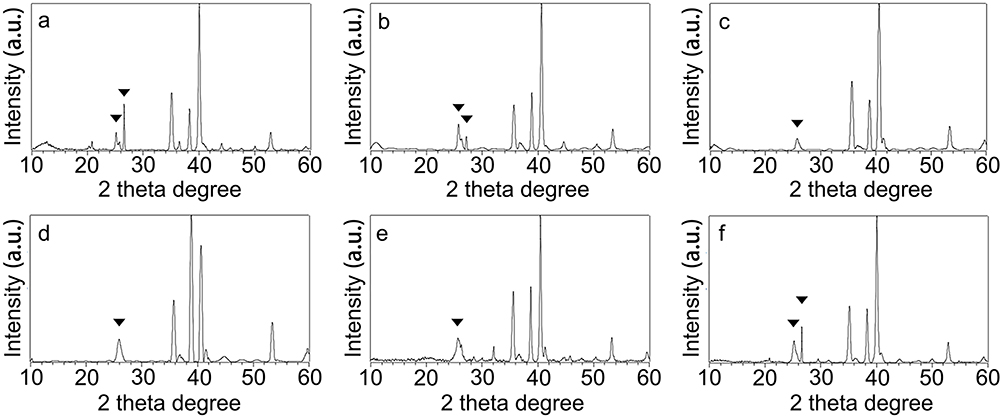 |
Figure 2 XRD patterns of CS/G/Sr membranes by different proportion of chitosan versus gelatin: (a) 100:0, (b) 90:10, (c) 70:30, (d) 50:50, (e)30:70, (f) 10:90. Typical SrCO3 crystals (marked with triangle) were detected. |
To further explore the morphogenesis of the structure, the growth states of two different groups (CS: G= 100:0 and CS: G= 30:70) were illustrated using a series of successive TEM and SEM images (Figure 3). Successive growth of Sr/CS aggregates (CS: G= 100:0) (Figure 3A(a)) was initiated from a 3 μm-long columelliform seed to dendritic structures, with a small opening angle of each branched column against the central axis of the primary seed. This fractal growth mode was in accordance with the diffusion-limited aggregation (DLA) model of fractal growth.18
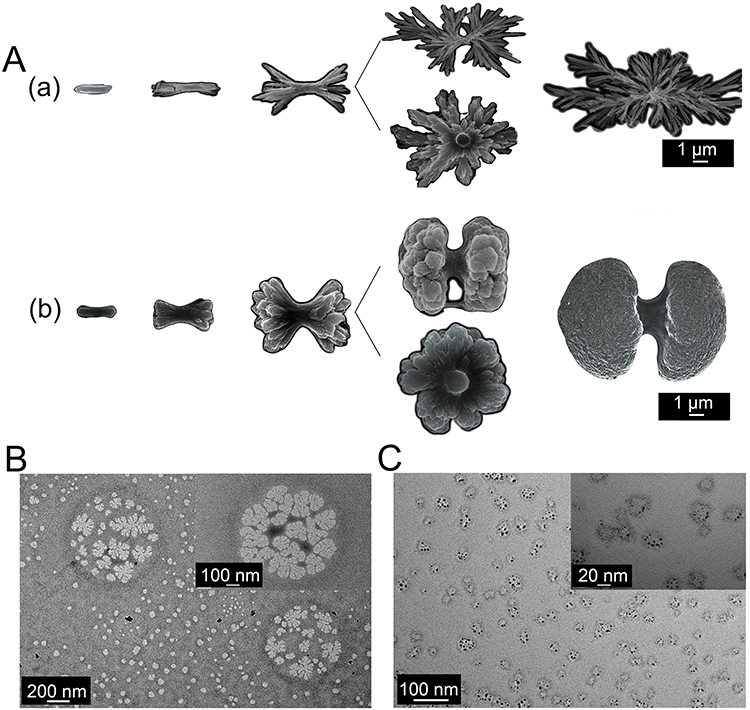 |
Figure 3 (A): Fractal growth mode by different weight ratio of chitosan versus gelatin: (a) 100:0, (b) 30:70. (B) TEM images of the EPD suspension (CS: G =30: 70) near the cathode and (C) the released nanoparticles from the Sr/CS/G membrane (CS: G =30: 70). |
The growth of the Sr/CS/G aggregates (CS: G=30:70) (Figure 3A(b)) differed from that of the Sr/G aggregates. The morphogenesis of the Sr/CS/G aggregates also initiated from nanosized spherical particles near the EPD cathode (Figure 3B) and then assembled into a central seed, but the successive growth of the branches was round tailed and gradually formed two parallel hemispheres with a sufficient central bridge. Finally, the dumbbell-like hemispheres turn into a fan-like morphology (dumbbells without sufficient central bridge) and further develop into closed spheres with radical symmetry. The surface of the aggregates consists of nanosized rods oriented vertically to the core; these rods are the nucleation centers and growing units of fractal growth. With further maturation of the aggregates, the surfaces of the spheres became smooth, indicating a decreased nucleation activity and increased aggregate stability. Furthermore, well-crystallized nanosized (~ 20 nm) spherical particles were released from the Sr/CS/G coating surfaces. In the Sr/CS groups, nanosized particles were not observed in either the near-EPD cathode suspension or the release suspension.
Deposition Voltage
A SEM analysis was performed to observe the morphology of the products deposited on the cathode at various applied voltages for 180s. As shown in Figure 4a–d, the deposition of the products gradually increased as the applied voltage increased from 2V to 8V for a fixed deposition time of 180s. When a relatively low voltage was applied, spherical or dumbbell-like macroparticles with stable and smooth surfaces formed on the substrate. As the voltage increased, the deposited products exhibited flower-like morphology with a rough surface. Cracks were observed on the particle surfaces of the 8v. It is also worth noting that the membranes are easily detached from the cathode substrate at 8V for over 180s.
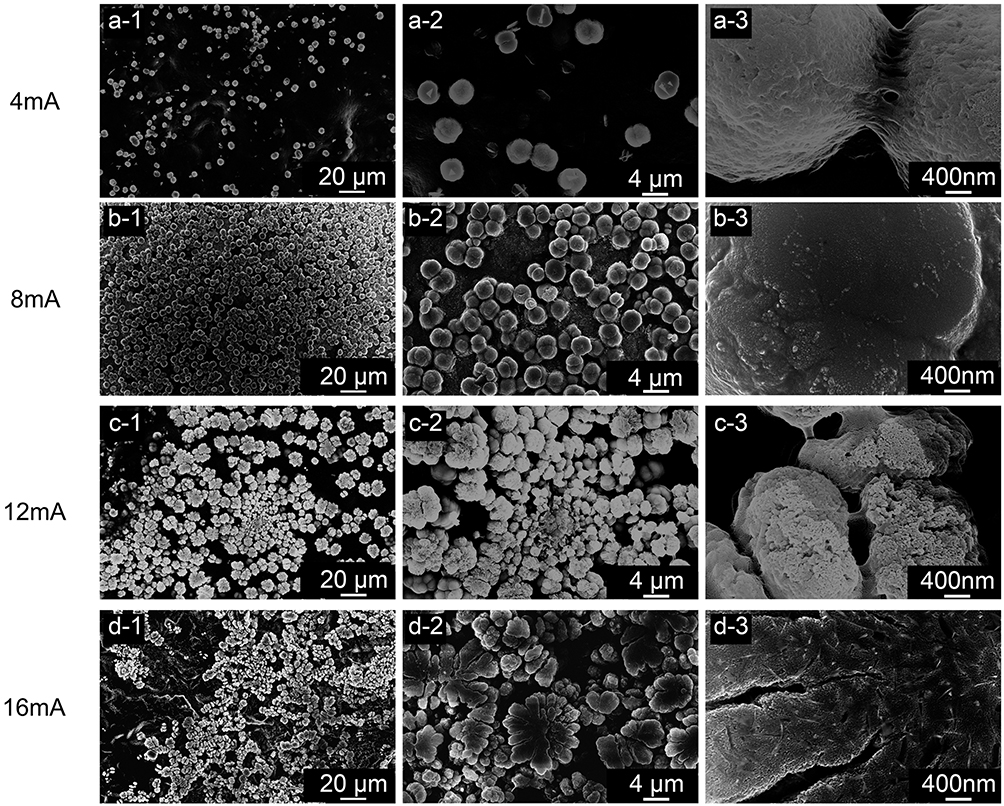 |
Figure 4 SEM images of CS/G/Sr membranes prepared under different currents during the EPD process are depicted as follows: (a) the membrane at 4mA, (b) the membrane at 8mA, (c) the membrane at 12mA, and (d) the membrane at 16mA. Each membrane is shown in varying magnifications: (a-1, b-1, c-1, and d-1) at low magnification, (a-2, b-2, c-2, and d-2) at medium magnification, and (a-3, b-3, c-3, and d-3) at high magnification. |
The deposition time versus current profile for a range of applied voltages is presented and compared in Figure 5a. The current intensity was proportional to the applied voltage. The data show that with an increase in the current intensity, the density of the macroparticles correspondingly increased. A slight current intensity drop at the beginning of the EPD process was observed before current stabilization, which was possibly due to a fast charge increase on the Ti surface in the vicinity of the negative electrode when the applied voltage was formed.19
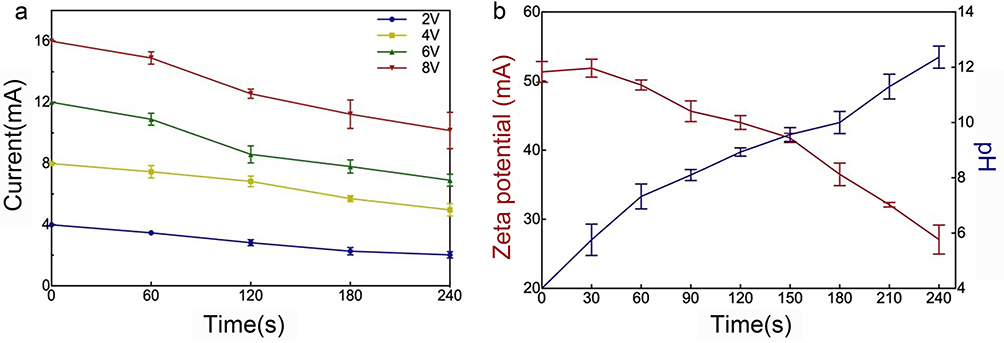 |
Figure 5 (a) Current intensity as function of deposition time for Sr/CS/G composites during EPD at different applied direct voltage (2V, 4V, 6V and 8V). (b) The zeta potential and the pH near cathode as a function of the deposition time. Three experiment repeats were performed to calculate the average and the standard deviation (error bars). |
A decrease in current intensity was observed, suggesting that the concentration potential formed at the beginning of the EPD process against the applied electric field slowed the movement of the products and decreased the current intensity. In addition, the potential difference between the electrodes remains constant at a constant applied voltage. Thus, the electric field influencing electrophoresis decreased as the deposition time increased, possibly due to the formation of SrCO3/CS/G layers on the cathode surface.
Operational pH
The trends of the zeta potential and pH near the cathode surface as a function of the deposition time are plotted in Figure 5b. The zeta potential governs several key parameters in EPD, such as the density of the deposit, particle direction and speed, and repulsive interactions between particles, which determine the stability of the suspension. The results showed that the zeta potential decreased and the pH near the cathode increased as a function of deposition time. This phenomenon was mainly ascribed to the depletion of hydrogen ions near the cathode.
Deposition Time
The Sr/CS/G nanospheres near the cathode were investigated by TEM, as shown in Figure 6a, which exhibited a nanoscale flower-like structure, resembling the microsphere morphology of the coating at the micrometer scale. The SEM images of the Sr/CS/G membranes after depositing for 30s, 60s, 90s, 120s and 180s are showed in Figure 6b-f. As the deposition time increased, both the macroparticle density and particle diameter increased, accompanied by the proliferation of nanoscale structures on the surface of the microspheres. However, as the deposition time further increased, the coating eventually reached saturation, resulting in a smoother microsphere surface texture.
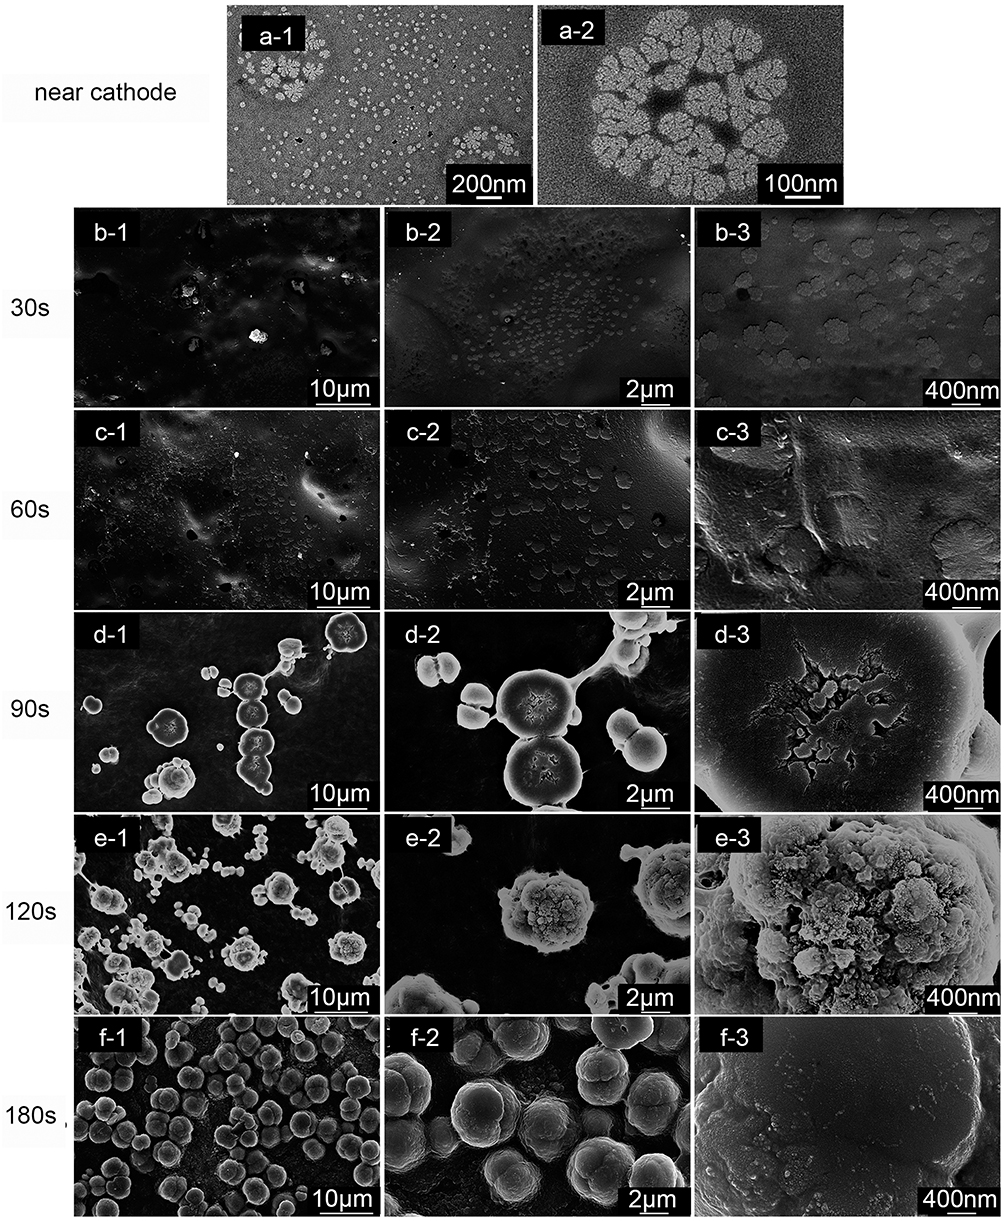 |
Figure 6 (a): TEM images illustrating the CS/G/Sr nanospheres adjacent to the cathode during the EPD process: depicted as (a-1) with low magnification, (a-2) with high magnification; SEM images follow of the CS/G/Sr membrane after various deposition times: (b) 30 seconds, (c) 60 seconds, (d) 90 seconds, (e) 120 seconds, and (f) 180 seconds. Each set of images is shown at different magnifications: (b-1, c-1, d-1, e-1, and f-1) at low magnification, (b-2, c-2, d-2, e-2, and f-2) at medium magnification, and (b-3, c-3, d-3, e-3, and f-3) at high magnification. |
Bioactive Apatite Formation of the Sr/CS/G Aggregates in vitro
In vitro mineralization analysis was performed by immersing Sr/CS/G membranes in PBS (Hyclone, 1X) and SBF (1X) at 36.5 °C ± 0.5°C. Figure 7 illustrates the morphological evolution of apatite formed by immersing the Sr/CS/G membranes in PBS (Hyclone, 1X) for 1, 3, and 7 days. In the SrL group after post-PBS treatment (Figure 7A (a-d)), nanosized lamellar crystals were observed on the coating surface and formed on the pre-existing organic framework of the composite microspheres. The peak at 31.9° (Figure 7B) in the corresponding XRD spectrum can be attributed to the (300) plane of SrHA, suggesting a precursor stage for SrHA formation. In contrast, in the SrH group (Figure 7A(e-h)), petal-like morphologies resembling needles were observed, indicating radial aggregation of crystals from the center of the microsphere to its surface. XRD analysis (Figure 7C) revealed the formation of typical SrHA crystals (JCPDS No.33–1348, P63/m), with the crystal size and crystallinity increasing with the immersion time.
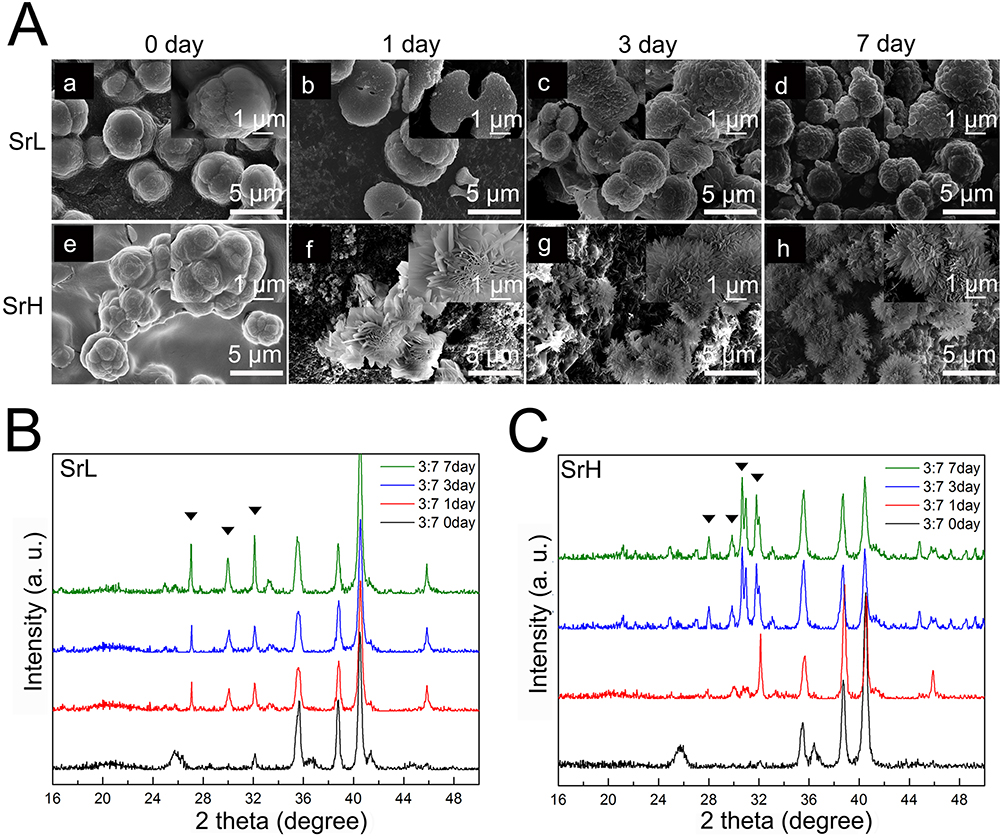 |
Figure 7 (A): SEM images of morphological evolution of apatite formed by immersing Sr/CS/G membranes (CS: G =30: 70, a and e) inside PBS (Hyclone, 1X) for 1 (b and f), 3 (c and g) and 7 (d and h) days (a - d: SrL group, e – h: SrH group). (B), (C) XRD patterns of Sr/CS/G membranes after immersing inside PBS (Hyclone, 1X) for 1, 3 and 7 days (B: SrL groups, (C) SrH groups). Typical SrHA crystals (marked with triangle) were detected. |
SBF were prepared according to the Kokubo’s procedure.17 The SEM images (Figure 8A) revealed that only a small amount of HA was generated on the surfaces of the SLA titanium discs (Figure 8A(a)) and CS/G coatings (Figure 8A(b)) after 72 h, as detected by XRD (Figure 8B), showing an absorption peak at 26.8°, which could not be attributed to any corresponding standard card index. We hypothesized that this peak represents the diffraction peak from the precursor stage of HA formation. After the immersion of the SrL and SrH groups in the SBF solution for 12 h (Figure 8A(c-h)), abundant spherical HA particles were formed on the surfaces of the samples. The fine HA particles grew and closely adhered to the substrate with diameters of approximately 4–6 μm. With increasing immersion time, the size of the HA particles gradually increased, without evident cracking. The XRD analysis (Figure 8B) revealed the formation of typical HA crystals.
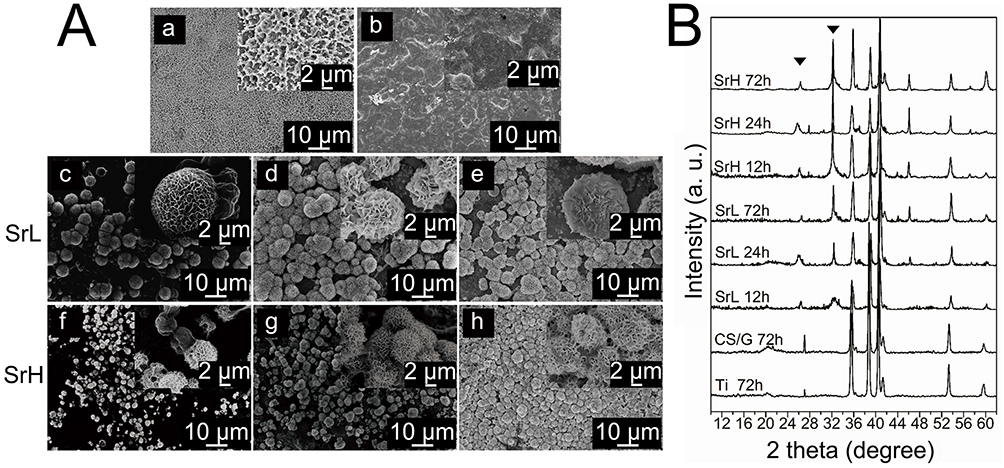 |
Figure 8 (A): SEM images of morphological evolution of apatite formed by immersing Sr/CS/G membranes (CS: G =30: 70) inside SBF for 12, 24 and 72 h (a: SLA titanium discs, b: CS/G coatings, both were immersed inside SBF for 72 hours, c and f: 12h, d and g: 24h, e and h: 72h). (B) XRD patterns of SLA titanium discs, CS/G coatings and Sr/CS/G membranes after immersing inside SBF for 12, 24 and 72 h. Typical HA crystals (marked with triangle) were detected. |
Biocompatibility in vitro
According to our previous research, the newly produced Sr/CS/G membrane presented a strongly alkaline surface, which hampered the direct adhesion and proliferation of bone marrow stromal cells. Therefore, membrane pretreatment is necessary to improve the surface biocompatibility of the products. To explore the effect of different pre-conditioning solutions on the biological behavior in vitro, Sr/CS/G membranes (SrL group) were immersed in H2O, PBS, and SBF for 24 h, followed by drying at 37°C. Subsequently, the coatings were co-cultured with rBMSCs. Figure 9A illustrates the morphology of the rBMSCs on the coatings and their adhesion to Sr/CS/G composite microspheres. Fluorescence microscopy (Figure 9A(a-c)) showed polygonal-shaped cells with extended filamentous and lamellar pseudopodia in the H-Sr, P-Sr, and S-Sr groups at a density of approximately 50–60%. SEM images (Figure 9A(d-i)) revealed that the cells on all three coatings exhibited good crawling and adhesion. The expression of cell seeding cytoskeleton exhibits a spike and spindle shape with extended filopodia that anchor onto the particles. Additionally, numerous granular protrusions or folds were observed on the cell surfaces in the P-Sr and S-Sr groups, suggesting active cellular functions and strong secretion capabilities.
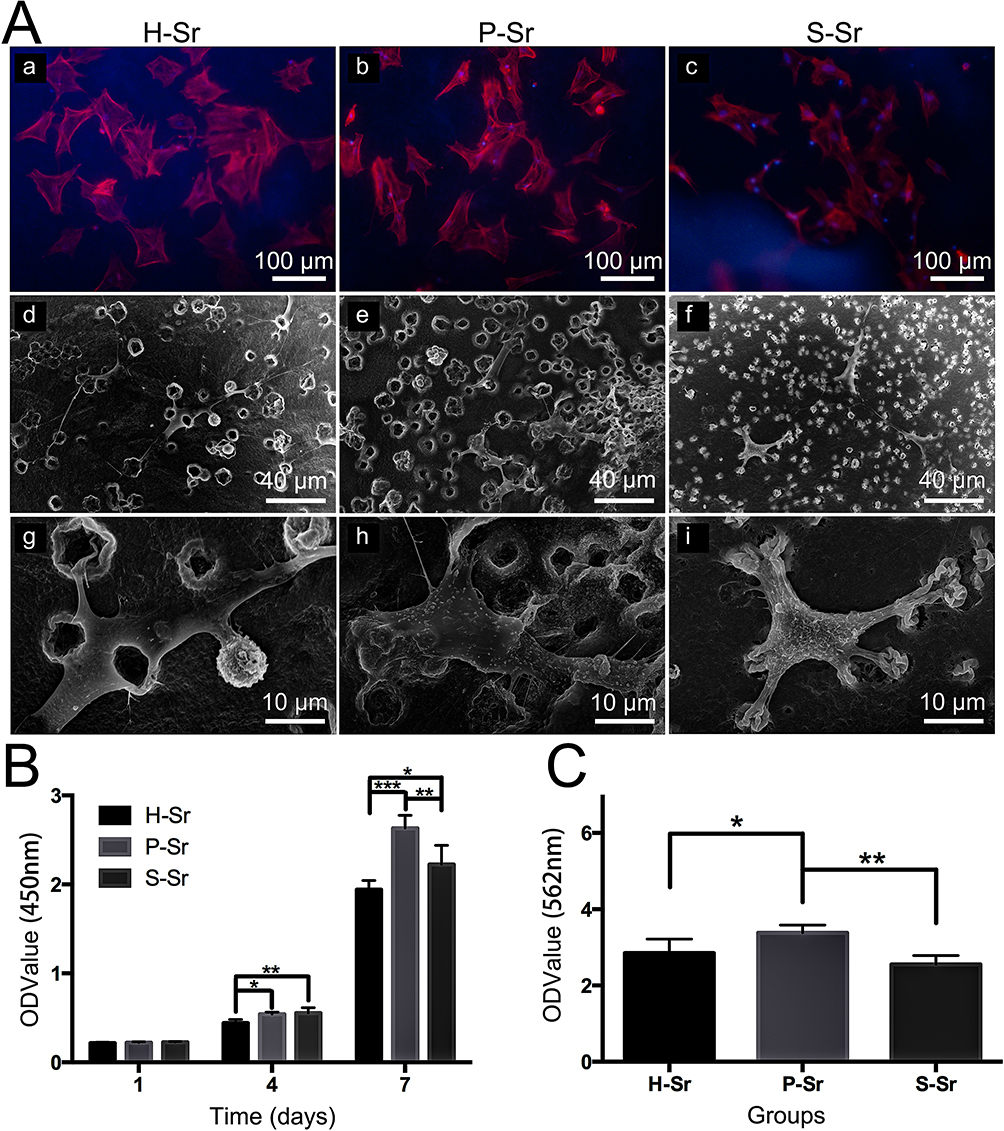 |
Figure 9 Cell responses to the samples: (A) (a-c): Fluorescence microscopy images of rBMSCs co-cultured with bio-mineralized Sr/CS/G membranes (CS: G =30: 70, SrL group) for 24 h. The nuclei show blue fluorescence with DAPI staining, and rBMSCs skeletons show red fluorescence with rhodamine phalloidin staining. (A) (d-i): SEM images of rBMSCs cultured on the bio-mineralized Sr/CS/G membranes (CS: G =30: 70, SrL group) for 24 h. The extended filamentous and lamellar pseudopodia of rBMSCs were observed. (B) Time-dependent cell viabilities of rBMSCs co-cultured with bio-mineralized Sr/CS/G membranes (CS: G =30: 70, SrL group) up to 7 days (n=5, *P< 0.05, **P< 0.01, ***P< 0.001). (C) Quantitative determination of Alizarin red S staining of rBMSCs co-cultured with bio-mineralized Sr/CS/G membranes (CS: G =30: 70, SrL group) for 28 days. (n=5, *P< 0.05, **P< 0.01). |
The CCK-8 results are shown in Figure 9B. On both days 4th and 7th days, the relative OD values of the P-Sr and S-Sr groups were significantly higher than that of the control group. Specifically, on the 4th day, the S-Sr group exhibited the highest OD value, whereas on the 7th day, the P-Sr group exhibited the highest OD value. This suggests that SrHA formed through PBS-induced mineralization has a more pronounced effect on promoting cell proliferation. The intracellular calcium content detection results, depicted in Figure 9C, showed that after 28 days of cultivation, the relative calcium content within the cells of the P-Sr group was significantly higher than that of the other two groups, which is consistent with the CCK-8 results.
Osteogenic Ability in vivo
The biomineralized coatings (CS/G weight ratio=30:70, voltage=3.5V, time=180s, Sr concentration in SrL group= 0.25g/40 mL, Sr concentration in SrH group= 1.0g/40 mL,) induced by PBS for 24 h were implanted into crucially sized rat calvarial defect sites to identify their in vivo ability to stimulate bone regeneration and biocompatibility. Hematoxylin and eosin staining was used to observe tissue morphology in the central regions of the defect. Histological analyses showed that at 4 weeks, a new paler pink bone was observed in the bone-defect regions (Figure 10A). In addition, more newly formed bones with osteocytes (OC) were observed in the SrL (Figure 10A (b-1, b-2 and b-3)) and SrH groups (Figure 10A (c-1, c-2 and c-3)) than in the CS/G group (Figure 10A (a-1, a-2 and a-3)). At 8 weeks, the newly formed bone consisted of woven bone partially covered the defect area (Figure 10B). The quantity of new bone, shown as woven bone, appeared to be greater in the SrL (Figure 10B (b-1, b-2 and b-3)) and SrH groups (Figure 10B (c-1, c-2 and c-3)) than in the CS/G group (Figure 10B (a-1, a-2 and a-3)). The osteoblasts (OB) were located on the surface as a single layer of mononuclear cells to evaluate the morphology of the regenerated bone tissue. Multiple interspersed newly formed blood vessels (BV) were observed in the SrL and SrH groups at 4 weeks, with the vascular network becoming denser at 8 weeks. In contrast, minimal blood vessel formation was detected at 4 weeks in the CS/G group; however, at 8 weeks, the density also increased. These results indicate the faster formation of newly formed bone and blood vessels within the SrL and SrH groups.
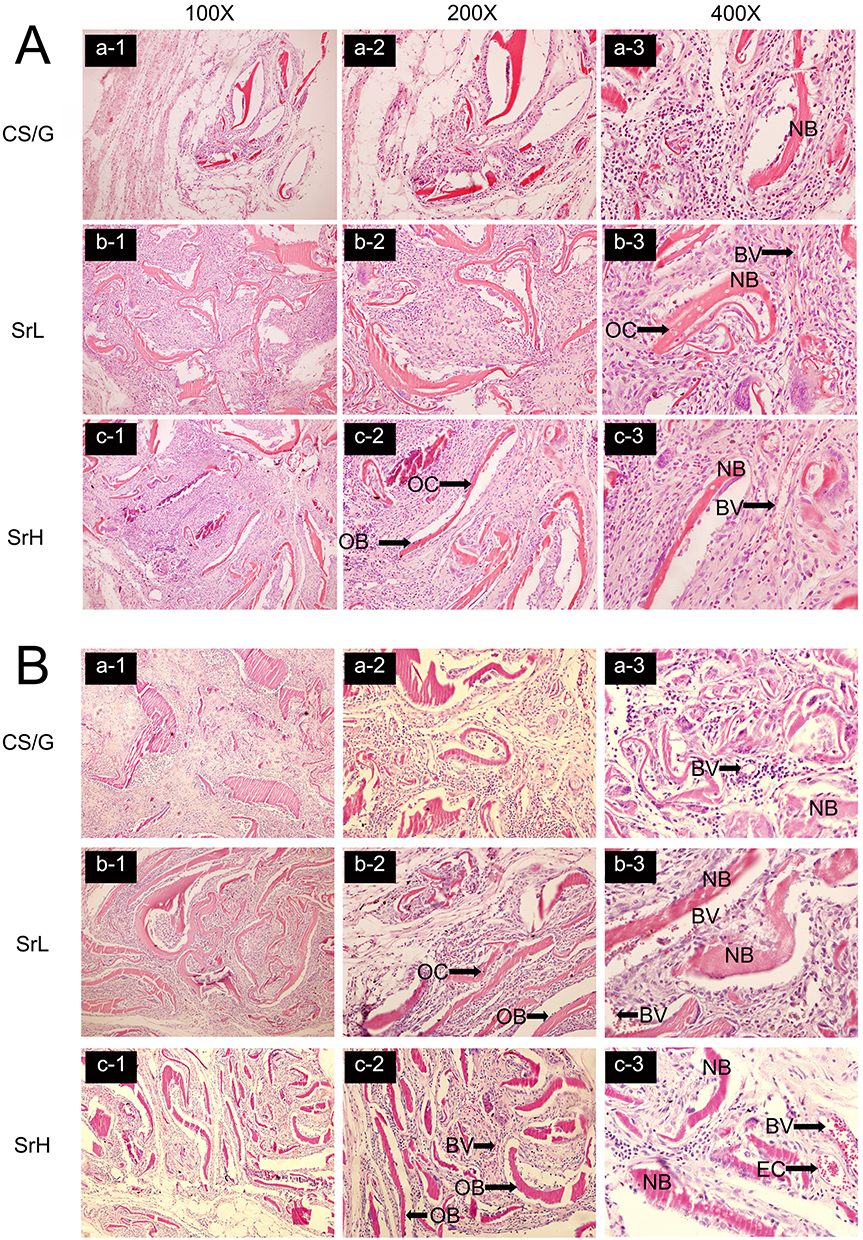 |
Figure 10 The biomineralized coatings (CS/G weight ratio=30:70, voltage=3.5V, time=180s, Sr concentration in SrL group= 0.25g/40 mL, Sr concentration in SrH group= 1.0g/40 mL,) induced by PBS for 24 h were implanted into crucially sized rat calvarial defect sites to identify osteogenic ability. Histological analyses of bone regeneration in a rat calvarial defect observed at 4 weeks (A) and 8 weeks (B) post-surgery. The H&E-stained sections illustrate the central defect regions across the distinct groups: CS/G (a), SrL (b) and SrH (c): each examined under different magnifications: (a-1, b-1, c-1) at 100x magnification, (a-2, b-2, c-2) at 200x magnification, and (a-3, b-3, c-3) at 400x magnification. Abbreviations: NB, newly formed bone; BV, blood vessel; OB, osteoblast; OC, osteocyte. |
Discussion
Biological mineralization is an essential process in bone formation and is usually represented by the composite nature of materials containing inorganic and organic components. In biosystems, the hierarchical and self-similar organization of nanocomposite structures is prominent relevance.20 Efforts have been made towards the construction of nanocomposite coatings with desirable structures and enhanced properties.21 Electrophoretic deposition is a straightforward and cost-effective method known for its ability to produce coatings at low processing temperatures and high production rates.22 Compared with other advanced shaping techniques, the EPD process exhibits notable versatility, as it can be readily tailored for specific applications.23 The effective parameters for EPD were categorized into two groups: those related to suspension and those related to process.22,23 Various modulating parameters, including the CS/G weight ratio and deposition parameters, were adjusted to elucidate the factors influencing the morphogenesis of Sr/CS/G aggregates.
Our previous study showed that a CS/G weight ratio of 30:70 promoted cell adhesion.24 However, the influence of CS/G weight ratio on the morphogenesis of Sr/CS/G aggregates remains unexplored. By depositing Sr/CS/G membranes with varying CS/G weight ratios onto Ti surfaces, we observed that the Sr/CS particles exhibited a well-branched rod-like morphology. The introduction of gelatin into the EPD solution transformed these well-branched rod-like structures into flower-like and dumbbell-like structures. SrCO3 was detected in all the weight ratio groups, although SrCO3 from the pure chitosan EPD solution exhibited well-developed crystal planes. Further morphological investigation using different weight ratios of chitosan versus gelatin (100:0 and 30:70) revealed self-assembled fractal growth of the Sr/CS and Sr/CS/G aggregates. The morphogenesis of the polymer exhibits self-similarity in structure and starts with an elongated hexagonal prismatic seed, which develops in outgrowth areas at both ends (central violet area). Subsequently, the Sr/CS/G particle aggregates form dumbbell-shaped structures and finally form a closed sphere (with an equatorial notch). Chitosan is a natural linear polymer with abundant functional amino groups in its molecular structure. The molecular chains of chitosan accumulate and present dendritic structures as reported,25 and intermolecular and intramolecular hydrogen bonds play key roles in chain interplay. According to DLA theory, it is speculated that the ion pairs of Sr2+CO32- form first, and then the ion pairs orientally accumulate around the functional groups of chitosan molecular chains through complexation. The locally high concentration of Sr2+ favored the nucleation of SrCO3 crystals and the branching of SrCO3 along the chitosan chains. The growth of Sr/CS/G aggregates differed in the presence of gelatin in the deposition solution. Gelatin is an ampholyte owing to its free acid content. The pKa of chitosan is 6.5,26 whereas that of type A gelatin is approximately 8.9, indicating an excess of positively charged amine groups.27 Gelatin molecules induce the formation of intrinsic electric dipole fields during the growth of the composite aggregates. The preferred growth direction of the molecular chains followed the C-N termini of gelatin and reached a bipolar state. Research has demonstrated that fan–like and fractal growth series may be characterized in terms of more “crystallographic” (straight, hard) and more “biological” (bent, soft), respectively.28 Chitosan played a vital role in the branching growth of crystals, whereas gelatin guided the formation of composite spheres. Kniep et al reported a similar morphogenesis of fluorapatite-gelatin composites, which took several days.28,29 In our study, the fractal morphogenesis of SrCO3/CS/G aggregates from seeds to microspheres took only a few minutes in electrophoretic fields. Chitosan molecules increase the anisotropy of crystal growth. In contrast, gelatin molecules have the opposite effect of decreasing the anisotropy of the crystal growth. It is difficult to form coatings on titanium in pure gelatin because chitosan imparts a charge to the particles, allowing for cathodic electrophoretic deposition of Sr/CS/G aggregates.26
With respect to the applied electric field and deposition time, our study confirmed that the amount of deposit increased with an increase in the applied potential and deposition time. The SEM results showed that increasing the process voltage led to coarser and more agglomerated particles in the coatings. Spherical or dumbbell-like macroparticles with stable and smooth surfaces are formed on the substrate at a relatively low voltage. When the voltage was increased, the deposited products exhibited a flower-like morphology with a rough surface. Cracks appeared on the particle surfaces in group the 8v. The current density is proportional to the applied potential. Research suggests that the current density tends to be unstable with increasing applied voltages.30 Although a high electric field (voltage) accelerates the deposition rate, it can also damage the deposit.23 Therefore, EPD should be performed at moderate voltages to achieve uniform and dense coating surface morphology.31 As the deposition time increased, both the particle number and the radius increased. As the composite microspheres evolved, both their size and surface structural features varied. This phenomenon arises from the formation of Sr/CS/G nanospheres near the cathode during deposition under the influence of electric field forces, which nucleate on the cathode surface. These nanoscale particles possess higher surface energy, facilitating their aggregation and assembly into hierarchical microspheres. As the microsphere volume increased, the surface free energy decreased, which promoted maturation and stability of the microspheres. It is also worth noting that the membranes are easily detached from the cathode substrate at 8V for over 3 minutes. This can be explained by the fact that higher voltages caused rapid deposition, along with the excess formation of gaseous bubbles generated by the electrolysis of water.32 The overproduction of bubbles entrapped in the membranes leads to their detachment. An increase in porosity has a twofold effect; one is the improved tissue ingrowth upon implantation in the body, and the other is the weakening of the coating adhesion strength and augmented corrosion rate.33
The zeta potential measures the magnitude of electrostatic repulsion/attraction between particles or macromolecular aggregates. Therefore, it has become one of the fundamental parameters that affects the stability of suspensions for EPD.34 The trends of zeta potential and pH as a function of deposition time showed that the zeta potential decreased, while the pH increased as a function of the deposition time. According to previous research,35 zeta potential decreases the deposition rate, and an increase in the pH of the suspension leads to a decrease in particle mobility. The decreasing particle mobility is another factor that causes a decrease in the EPD deposition rate with increasing deposition time. A strong alkaline surface hampers the direct adhesion and proliferation of bone marrow stromal cells. Thus, proper deposition time and voltage is recommended in EPD process, and according to our results mentioned above, the samples (CS/G weight ratio=3:7, voltage=3.5V, time=180s) were chosen for further study with low and high strontium concentration.
Because elaborate forms of biominerals are spontaneously produced in living organisms, biomineralization is a typical self-organized formation of hierarchical structures in an aqueous solution system in an ambient atmosphere.36 According to Kokubo and Takadama’s definition of bioactivity, a bioactive material is one on which bone-like hydroxyapatite forms selectively after it is immersed in a serum-like solution.17 Simulated body fluid (SBF) is a metastable aqueous solution consisting of inorganic ions at concentrations similar to those in human blood plasma. The extent of deposition of calcium phosphate phases from this solution is generally considered an indication of the biocompatibility or bioactivity of potential biomaterials.17,37 In vitro mineralization analysis was performed by immersing Sr/CS/G membranes in PBS (Hyclone, 1X) and SBF (1X), and different mineralization products were detected. The degree of mineralization product formation depends on the Sr2+ loading and immersion time.38 Nanosized lamellar crystals were observed on the coating surface after immersion in PBS and XRD confirmed the formation of SrHA. Upon immersion of the coating, Sr2+ ions bind with P4O3− and OH− anions in PBS solution to form SrHA nuclei. With increasing immersion time, the organic components (chitosan and gelatin) gradually degraded, providing space for the further growth of SrHA crystals, resulting in nanosized SrHA crystals. In the SrH group, owing to the increased exposure of Sr2+ ions, the surface energy of the composite microspheres increases, facilitating crystal formation. Additionally, the release of Sr2+ ions into the solution promotes longitudinal crystal growth, leading to the formation of more mature crystal morphologies. The Sr/CS/G coatings exhibited rapid nucleation and growth of HA in SBF, with a large quantity of HA forming and tightly binding to the substrate, indicating improved surface biomineralization properties. This enhancement is attributed to the hydrophilic nature of the coating surface, which facilitates rapid infiltration by SBF and the rapid dissolution of Sr2+. Chitosan and gelatin acted as organic templates, adsorbing and aggregating Ca2+ions from the solution and providing dense nucleation sites for HA. The small size and independent nature of spherical HA particles result in low internal stress, thus ensuring the stability of the HA layer and minimizing the likelihood of rupture. On the surfaces of the SrH group coatings, the size of spherical HA was smaller than that of the SrL group, attributed to the higher concentration of strontium ions, which led to denser nucleation sites within the organic template and, consequently, smaller crystal sizes.
The Sr/CS/G membranes (SrL group) were immersed in H2O, PBS, or SBF for 24 h and then co-cultured with rBMSCs. None of the groups showed cytotoxicity toward rBMSCs, and SrHA formed through PBS-induced mineralization had a more pronounced effect on promoting cell proliferation. The pseudopodia of rBMSCs were tightly wrapped around the surface of the Sr/CS/G composite microspheres, indicating a strong affinity and promotion of cell crawling and growth. Research has indicated a positive correlation between the activity of rBMSCs and intracellular concentration of calcium ions. Intracellular calcium ions can bind to various proteins and act as messengers to promote mineralization.39 Therefore, it can be inferred that the calcium ion uptake capacity of the P-Sr group was enhanced and the osteogenic activity correspondingly increased. Additionally, after one day of simulated body fluid (SBF) mineralization induction, the amount of spherical hydroxyapatite (HA) produced covered the surface of the coating, reduced the porosity, or even sealed it, which may paradoxically decrease the biocompatibility of the coating. Studies have reported that the composition, surface structure, and morphology of biomaterials can influence cell behavior.40 The interaction between materials and cell culture medium, reactions occurring in the mineralized layer, and the resulting changes in solution chemistry and pH can also affect cells.41 In fact, differences in the chemical composition and crystalline phase of mineralized deposition layers, as well as variations in the composition of mineralization-inducing solutions, have complex effects on the dissolution and remineralization of mineralized layers, directly affecting the chemical balance (mainly calcium and phosphate ion concentrations) in the culture medium, thereby significantly affecting the activity and differentiation capabilities of BMSCs.42 However, the specific mechanisms involved require further investigation.
Vasculature formation and osteoblast growth were observed at the center of the defect area after 4 weeks. Bone tissue formation became more apparent at 8 weeks, indicating that the kinetics of bone repair are time dependent. A higher percentage of bone islands was present in the SrL and SrH groups, which revealed greater osteoconductivity than that in the CS/G group. The subsequent formation of blood vessels was also observed in the SrL and SrH groups at 4 weeks, suggesting the development of vasculature in the defect area. After eight weeks, a denser network of blood vessels was detected across all groups. The SrL and SrH groups exhibited a higher density of blood vessels, which was attributed to SrHA induced by PBS. Angiogenesis is crucial for bone growth, cartilage production, and bone formation.43 The relationship between angiogenesis and osteogenesis has been well described; more oxygen, nutrients, and regenerative cells can be supplied to the defect site, and metabolic waste can be removed in time with a dense vascular network.44 Therefore, PBS-induced Sr/CS/G coatings have the potential to promote the efficient and rapid formation of functional vasculature, which is beneficial for tissue engineering applications.
Conclusion
Sr/CS/G composite microspheres were synthesized and modified via EPD. Under the influence of the electric field force, SrCO3 crystals formed within the framework of chitosan and gelatin organic templates. These Sr/CS/G composite microspheres were formed through layer-by-layer self-assembly of Sr/CS/G nanospheres and exhibited fractal growth characteristics and self-similarity in morphology. Chitosan and gelatin played crucial roles as organic templates in the regulation of fractal growth; chitosan guided the branching growth of crystals, while gelatin controlled the formation of composite spheres. The mineralization products of the Sr/CS/G composite microspheres differed in different isosmotic solution systems. In PBS, nanosized SrHA was mineralized based on the original microspheres, whereas in SBF, the formation of spherical HA was accelerated. The Sr/CS/G composite microspheres exhibited a good affinity for rBMSCs, promoting cell adhesion and growth. Coatings induced by PBS enhance rBMSCs proliferation and mineralization in vitro. Moreover, in vivo studies have indicated that PBS-induced coatings exhibit enhanced vascularization and have potential for bone tissue applications. However, further research is necessary to evaluate long-term outcomes.
Acknowledgments
This work was financially supported by the Natural Science Foundation of Hunan Province (2024JJ9534) and the Natural Science Foundation of Hubei Province (2024AFB096).
Disclosure
The authors report no conflicts of interest in this work.
References
1. Hong M-H, Lee JH, Jung HS, Shin H, Shin H. Biomineralization of bone tissue: calcium phosphate-based inorganics in collagen fibrillar organic matrices. Biomater Res. 2022;26(1):42. doi:10.1186/s40824-022-00288-0
2. Sun S, Mao LB, Lei Z, Yu SH, Cölfen H. Hydrogels from amorphous calcium carbonate and polyacrylic acid: bio‐inspired materials for “mineral plastics”. Angew Chem Int Ed. 2016;55(39):11765–11769. doi:10.1002/anie.201602849
3. Niu Y-Q, Liu J-H, Aymonier C, et al. Calcium carbonate: controlled synthesis, surface functionalization, and nanostructured materials. Chem Soc Rev. 2022;51(18):7883–7943. doi:10.1039/d1cs00519g
4. Yu Y, Guo Z, Zhao Y, et al. A flexible and degradable hybrid mineral as a plastic substitute. Adv Mater. 2022;34(9):2107523. doi:10.1002/adma.202107523
5. Divya A, Mathavan T, Harish S, et al. Synthesis and characterization of branchlet-like SrCO3 nanorods using triethylamine as a capping agent by wet chemical method. Appl Surf Sci. 2019;487:1271–1278. doi:10.1016/j.apsusc.2019.04.173
6. Li Z, Lam W, Yang C, et al. Chemical composition, crystal size and lattice structural changes after incorporation of strontium into biomimetic apatite. Biomaterials. 2007;28(7):1452–1460. doi:10.1016/j.biomaterials.2006.11.001
7. Xie H, Gu Z, He Y, et al. Microenvironment construction of strontium–calcium-based biomaterials for bone tissue regeneration: the equilibrium effect of calcium to strontium. J Mat Chem B. 2018;6(15):2332–2339. doi:10.1039/C8TB00306H
8. Ma K, Huang D, Cai J, et al. Surface functionalization with strontium-containing nanocomposite coatings via EPD. Colloids Surf B. 2016;146:97–106. doi:10.1016/j.colsurfb.2016.05.036
9. Schwarz K, Epple M. Biomimetic crystallization of apatite in a porous polymer matrix. Chemistry. 1998;4(10):1898–1903. doi:10.1002/(SICI)1521-3765(19981002)4:10<1898::AID-CHEM1898>3.0.CO;2-U
10. Chakhmouradian AR, Reguir EP, Mitchell RH. Strontium-apatite: new occurrences, and the extent of Sr-for-Ca substitution in apatite-group minerals. Can Mineral. 2002;40(1):121–136. doi:10.2113/gscanmin.40.1.121
11. Stipniece L, Wilson S, Curran J, et al. Strontium substituted hydroxyapatite promotes direct primary human osteoblast maturation. Ceram Int. 2021;47(3):3368–3379. doi:10.1016/j.ceramint.2020.09.182
12. David N, Nallaiyan R. Biologically anchored chitosan/gelatin-SrHAP scaffold fabricated on titanium against chronic osteomyelitis infection. Int J Biol Macromol. 2018;110:206–214. doi:10.1016/j.ijbiomac.2017.11.174
13. Lei Y, Xu Z, Ke Q, et al. Strontium hydroxyapatite/chitosan nanohybrid scaffolds with enhanced osteoinductivity for bone tissue engineering. Mater Sci Eng C. 2017;72:134–142. doi:10.1016/j.msec.2016.11.063
14. Luo X, Barbieri D, Duan R, Yuan H, Bruijn JD. Strontium-containing apatite/polylactide composites enhance bone formation in osteopenic rabbits. Acta Biomater. 2015;26:331–337. doi:10.1016/j.actbio.2015.07.044
15. Hao J, Chou J, Kuroda S, Otsuka M, Kasugai S, Lang N. Strontium hydroxyapatite in situ gel‐forming system–a new approach for minimally invasive bone augmentation. Clin Oral Implants Res. 2015;26(5):581–585. doi:10.1111/clr.12446
16. Lindahl C, Engqvist H, Xia W. Effect of strontium ions on the early formation of biomimetic apatite on single crystalline rutile. Appl Surf Sci. 2013;266:199–204. doi:10.1016/j.apsusc.2012.11.147
17. Kokubo T, Takadama H. How useful is SBF in predicting in vivo bone bioactivity? Biomaterials. 2006;27(15):2907–2915. doi:10.1016/j.biomaterials.2006.01.017
18. Gentile F, Coluccio M, Toma A, et al. Electroless deposition dynamics of silver nanoparticles clusters: a diffusion limited aggregation (DLA) approach. Microelectron Eng. 2012;98:359–362. doi:10.1016/j.mee.2012.07.041
19. Molaei A, Yari M, Afshar MR. Modification of electrophoretic deposition of chitosan–bioactive glass–hydroxyapatite nanocomposite coatings for orthopedic applications by changing voltage and deposition time. Ceram Int. 2015;41(10):14537–14544. doi:10.1016/j.ceramint.2015.07.170
20. García-Ruiz JM, Van Zuilen MA, Bach W. Mineral self-organization on a lifeless planet. Physics Life Rev. 2020;34:62–82. doi:10.1016/j.plrev.2020.01.001
21. Rehman MAU, Munawar MA, Schubert DW, Boccaccini AR. Electrophoretic deposition of chitosan/gelatin/bioactive glass composite coatings on 316L stainless steel: a design of experiment study. Surf Coat Technol. 2019;358:976–986. doi:10.1016/j.surfcoat.2018.12.013
22. Besra L, Liu M. A review on fundamentals and applications of electrophoretic deposition (EPD). Pro Mater Sci. 2007;52(1):1–61. doi:10.1016/j.pmatsci.2006.07.001
23. Cheng X, Liu Y, Liu O, et al. Electrophoretic deposition of coatings for local delivery of therapeutic agents. Pro Mater Sci. 2023; 136:101–111.
24. Jiang T, Zhang Z, Zhou Y, et al. Surface functionalization of titanium with chitosan/gelatin via electrophoretic deposition: characterization and cell behavior. Biomacromolecules. 2010;11(5):1254–1260. doi:10.1021/bm100050d
25. Varma AJ, Deshpande SV, Kennedy JF. Metal complexation by chitosan and its derivatives: a review. Carbohydr Polym. 2003;55(1):77–93. doi:10.1016/j.carbpol.2003.08.005
26. Sikkema R, Baker K, Zhitomirsky I. Electrophoretic deposition of polymers and proteins for biomedical applications. Adv Colloid Interface Sci. 2020;284:102272. doi:10.1016/j.cis.2020.102272
27. Song J, Chen Q, Zhang Y, et al. Electrophoretic deposition of chitosan coatings modified with gelatin nanospheres to tune the release of antibiotics. ACS Appl Mater Interfaces. 2016;8(22):13785–13792. doi:10.1021/acsami.6b03454
28. Rosseeva EV, Buder J, Simon P, Schwarz U, Frank-Kamenetskaya OV, Kniep R. Synthesis, characterization, and morphogenesis of carbonated fluorapatite− gelatine nanocomposites: a complex biomimetic approach toward the mineralization of hard tissues. Chem Mater. 2008;20(19):6003–6013. doi:10.1021/cm8005748
29. Tlatlik H, Simon P, Kawska A, Zahn D, Kniep R. Biomimetic fluorapatite–gelatine nanocomposites: pre‐structuring of gelatine matrices by ion impregnation and its effect on form development. Angew Chem Int Ed. 2006;45(12):1905–1910.
30. Negishi H, Sakai N, Yamaji K, Horita T, Yokokawa H. Application of electrophoretic deposition technique to solid oxide fuel cells. J Electrochem Soc. 2000;147(5):1682. doi:10.1149/1.1393418
31. Zielinski A, Bartmanski M. Electrodeposited biocoatings, their properties and fabrication technologies: a review. Coatings. 2020;10(8):782. doi:10.3390/coatings10080782
32. Ervina J, Ghaleb Z, Hamdan S, Mariatti M. Colloidal stability of water-based carbon nanotube suspensions in electrophoretic deposition process: effect of applied voltage and deposition time. Composites Part A. 2019;117:1–10. doi:10.1016/j.compositesa.2018.11.002
33. Mehdipour M, Afshar A, Mohebali M. Electrophoretic deposition of bioactive glass coating on 316L stainless steel and electrochemical behavior study. Appl Surf Sci. 2012;258(24):9832–9839. doi:10.1016/j.apsusc.2012.06.038
34. Cheng X, Long D, Chen L, Jansen JA, Leeuwenburgh SC, Yang F. Electrophoretic deposition of silk fibroin coatings with pre-defined architecture to facilitate precise control over drug delivery. Bioact Mater. 2021;6(11):4243–4254. doi:10.1016/j.bioactmat.2021.03.046
35. Patel KD, Singh RK, Lee J-H, Kim H-W. Electrophoretic coatings of hydroxyapatite with various nanocrystal shapes. Mater Lett. 2019;234:148–154. doi:10.1016/j.matlet.2018.09.066
36. Arnold A, Dennison E, Kovacs CS, et al. Hormonal regulation of biomineralization. Nat Rev Endocrinol. 2021;17(5):261–275. doi:10.1038/s41574-021-00477-2
37. Bohner M, Lemaitre J. Can bioactivity be tested in vitro with SBF solution? Biomaterials. 2009;30(12):2175–2179. doi:10.1016/j.biomaterials.2009.01.008
38. Manzoor F, Golbang A, Dixon D, et al. 3D printed strontium and zinc doped hydroxyapatite loaded PEEK for craniomaxillofacial implants. Polymers. 2022;14(7):1376. doi:10.3390/polym14071376
39. Liu J, Yao R, Guo J, et al. The regulating effect of trace elements Si, Zn and Sr on mineralization of gelatin-hydroxyapatite electrospun fiber. Colloids Surf B. 2021;204:111822. doi:10.1016/j.colsurfb.2021.111822
40. Kim H-W, Kim H-E, Salih V. Stimulation of osteoblast responses to biomimetic nanocomposites of gelatin–hydroxyapatite for tissue engineering scaffolds. Biomaterials. 2005;26(25):5221–5230. doi:10.1016/j.biomaterials.2005.01.047
41. Ma Y, Han J, Wang M, Chen X, Jia S. Electrophoretic deposition of graphene-based materials: a review of materials and their applications. J Materiom. 2018;4(2):108–120. doi:10.1016/j.jmat.2018.02.004
42. Li Y, Liu C, Liu W, et al. Apatite formation induced by chitosan/gelatin hydrogel coating anchored on poly (aryl ether nitrile ketone) substrates to promote osteoblastic differentiation. Macromol biosci. 2021;21(11):2100262. doi:10.1002/mabi.202100262
43. Bi L, Jung S, Day D, et al. Evaluation of bone regeneration, angiogenesis, and hydroxyapatite conversion in critical‐sized rat calvarial defects implanted with bioactive glass scaffolds. J Biomed Mater Res Part A. 2012;100(12):3267–3275. doi:10.1002/jbm.a.34272
44. Baheiraei N, Nourani MR, Mortazavi SMJ, et al. Development of a bioactive porous collagen/β‐tricalcium phosphate bone graft assisting rapid vascularization for bone tissue engineering applications. J Biomed Mater Res Part A. 2018;106(1):73–85. doi:10.1002/jbm.a.36207
 © 2024 The Author(s). This work is published and licensed by Dove Medical Press Limited. The
full terms of this license are available at https://www.dovepress.com/terms.php
and incorporate the Creative Commons Attribution
- Non Commercial (unported, 3.0) License.
By accessing the work you hereby accept the Terms. Non-commercial uses of the work are permitted
without any further permission from Dove Medical Press Limited, provided the work is properly
attributed. For permission for commercial use of this work, please see paragraphs 4.2 and 5 of our Terms.
© 2024 The Author(s). This work is published and licensed by Dove Medical Press Limited. The
full terms of this license are available at https://www.dovepress.com/terms.php
and incorporate the Creative Commons Attribution
- Non Commercial (unported, 3.0) License.
By accessing the work you hereby accept the Terms. Non-commercial uses of the work are permitted
without any further permission from Dove Medical Press Limited, provided the work is properly
attributed. For permission for commercial use of this work, please see paragraphs 4.2 and 5 of our Terms.