")
Back to Journals » Cancer Management and Research » Volume 17
Blood-Based Prognostic Prediction Model for Glioblastoma: Construction and Validation
Authors Gao S, Liu Y, Kong J, Huangfu L, Yang Y, Cui H, Sun X, Shi S, Yang D
Received 16 January 2025
Accepted for publication 2 April 2025
Published 18 April 2025 Volume 2025:17 Pages 835—850
DOI https://doi.org/10.2147/CMAR.S510217
Checked for plagiarism Yes
Review by Single anonymous peer review
Peer reviewer comments 4
Editor who approved publication: Dr Ahmet Emre Eşkazan
Shibo Gao,* Yukun Liu,* Jinglin Kong, Linkuan Huangfu, Yuchuan Yang, Haiyang Cui, Xiaocong Sun, Shuling Shi, Daoke Yang
Department of Radiation Oncology, The First Affiliated Hospital of Zhengzhou University, Zhengzhou, Henan, People’s Republic of China
*These authors contributed equally to this work
Correspondence: Daoke Yang, Department of Radiation Oncology, The First Affiliated Hospital of Zhengzhou University, Henan, People’s Republic of China, Email [email protected]
Objective: Objective: To explore the prognostic factors affecting patients with glioblastoma (GBM) treated with the Stupp regimen and establish a prediction model based on hematological indicators to guide future clinical decision - making.
Methods: A total of 271 GBM patients meeting the screening criteria were recruited. They were randomly divided into a training set (190 cases) and a validation set (81 cases) at a 7:3 ratio. The training set was utilized to establish a comprehensive hematology prognostic scoring system (CHPSS), and the validation set was employed to verify the CHPSS. A Risk Score (RS) was computed from the CHPSS, and a nomogram model was constructed to predict patients’ overall survival (OS) based on the RS. Additionally, the relationship between RS and the surgery - to - radiotherapy interval (SRI) was analyzed.
Results: Patients were categorized into low - risk and high - risk groups according to the RS calculated by CHPSS. The overall survival of patients in these two groups differed significantly. The C - indices of the nomogram model constructed based on RS and clinical features were 0.79 and 0.73 in the training and validation sets, respectively. The clinical decision curve showed that when the threshold probability exceeded 20%, the model’s prediction provided the greatest net benefit for GBM patients receiving the Stupp regimen. In the overall cohort, a correlation between RS and SRI was observed, allowing for the classification of SRI into different risk subgroups based on RS.
Conclusion: The nomogram model based on CHPSS can effectively evaluate the prognosis of glioblastoma patients.
Keywords: prognostic scoring system, risk score, preoperative hematologic indicators, surgery-to-radiotherapy interval
Introduction
Glioblastoma (GBM) is the most prevalent and aggressive cerebral malignancy in adults, characterized by a dismal prognosis.1 The median survival of GBM patients treated with surgery and the Stupp regimen ranges from only 14 to 24 months, and the 5-year survival rate is merely 10%.2 Numerous factors, including age, race, tumor location, tumor size, metastasis, epilepsy, surgical intervention, radiotherapy, chemotherapy, and the interval between surgery and radiotherapy, have been shown to significantly influence the prognosis of GBM patients.3,4 Although the Stupp regimen combined with surgery has improved overall survival to some extent, there remains substantial inter-patient variability in survival time.5 This situation highlights the urgent requirement for a more comprehensive prognostic index to enable more precise prediction of patient prognosis. In recent years, an increasing number of studies have revealed that hematologic biomarkers reflecting patients’ preoperative inflammatory, coagulation, and nutritional status play a crucial role in prognosis.6–9 Biomarkers such as the preoperative neutrophil-to-lymphocyte ratio (NLR), monocyte-to-lymphocyte ratio (MLR), platelet-to-lymphocyte ratio (PLR), systemic immune-inflammation index (SII), and prognostic nutritional index (PNI) have been associated with the prognosis of various malignancies, especially GBM.10–13 However, previous research on the impact of preoperative hematologic markers on GBM prognosis mainly concentrated on single - aspect indicators of the patient’s functional status, lacking a comprehensive assessment of the patient’s preoperative physical condition. Therefore, the objective of this study is to develop a comprehensive hematologic prognostic scoring system that incorporates patients’ preoperative inflammatory, coagulation, and nutritional status, aiming to enhance the predictive power of hematologic biomarkers for the overall survival of GBM patients.
Furthermore, the latest version of the WHO Classification of Tumors of the Central Nervous System (2021) indicates that the diagnosis of “glioblastoma, IDH mutant, WHO grade 4” as outlined in the 2016 classification has been reclassified as “astrocytoma, IDH mutant, WHO grade 4”.14 Consequently, in order to guarantee the precision and clinical relevance of the findings, cases with a prior diagnosis of “glioblastoma, IDH mutant, WHO grade 4” were excluded from this study.
Materials and Methods
Patients
Glioblastoma patients treated at the First Affiliated Hospital of Zhengzhou University between January 2019 and January 2023 were retrospectively enrolled. Using the random number generator in SPSS 25.0 with a predefined random seed number, all samples were randomly split in a 7:3 ratio, with labels “1” assigned to the training set and “0” to the validation set. The training and validation datasets were used to develop and validate a Comprehensive Hematology Prognostic Scoring System (CHPSS). The study population was selected according to the following inclusion criteria: (1) All patients underwent maximal surgical resection within safe limits and were histopathologically diagnosed as “glioblastoma, IDH wild-type, WHO grade 4” (2) Primary glioblastoma without any relevant preoperative treatments. (3) Receiving the Stupp treatment regimen: Patients underwent maximal surgical resection followed by standard chemoradiotherapy. Radiotherapy was delivered at a total dose of 60 Gy in 2 Gy fractions over 30 fractions (5 fractions per week). Concurrent temozolomide was administered orally at 75 mg/m²/day for 42 consecutive days during radiotherapy. After a 4-week interval, adjuvant chemotherapy was initiated in 28-day cycles, with temozolomide administered at 150 mg/m²/day for 5 days in cycle 1, followed by 200 mg/m²/day for 5 days in cycles 2–6, totaling 6 cycles. (4) Having preoperative complete test results of blood routine, blood biochemistry, coagulation function, and clinical history data. (5) Age >18 years. Patients were excluded if they met any of the following criteria: (1) the presence of other malignant tumors in combination; (2) the presence of hematologic disorders, autoimmune diseases, severe hepatic or renal insufficiency, or obvious infections; (3) the occurrence of surgery-related deaths during the perioperative period; and (4) history of surgery, traumatic injuries, cerebrovascular disease, and heparin therapy within one month. All patients were followed up through outpatient clinics or by telephone at intervals of three to six months, with the final follow-up occurring in July 2024. The study was conducted in accordance with the Declaration of Helsinki and received approval from the Ethics Committee of the First Affiliated Hospital of Zhengzhou University. Ethical number: 2024-KY-1485-001.
Data Collection
Clinical data such as gender, age, preoperative KPS score, first presenting symptom, tumor location, tumor size, tumor number, extent of resection, history of diabetes, history of hypertension, the interval between surgery and the start of radiotherapy, and results of imaging and pathology were collected from the electronic medical record system of the First Affiliated Hospital of Zhengzhou University. The patients’ blood routine, coagulation function, blood biochemistry and other related indexes were collected within 1 week before the operation. The surgery-to-radiotherapy interval (SRI) was defined as the time between the date of surgery and the date of the first start of radiotherapy. NLR was defined as neutrophil count divided by lymphocyte count. MLR was defined as monocyte count divided by lymphocyte count. PLR is defined as platelet count divided by lymphocyte count. SII is defined as the product of the platelet count and neutrophil count divided by the lymphocyte count. PNI is defined as albumin concentration (g/L) plus 5 times the lymphocyte count (×10^9/L). The albumin-globulin ratio (AGR) is defined as the albumin content divided by the globulin content. Overall survival (OS) was defined as the time interval from the date of surgery to the date of the last follow-up or death.
Basic Clinical Data
In accordance with the findings of previous related studies, patients’ age, KPS score, maximum tumor diameter, and surgery-to-radiotherapy interval (SRI) were all dichotomized. Patients aged over 55 years were assigned a value of 1, while those below this age were assigned 0; patients with a KPS score below 80 were assigned 1, while those with a score above this were assigned 0; patients with a maximum tumor diameter above 4.5 cm were assigned 1, while those with a diameter below this value were assigned 0; patients with an SRI above 21 were assigned 0, while those with an SRI below this value were assigned 1.
Hematologic Data
In the entire database, receiver operating characteristic (ROC) curves for individual hematological parameters were plotted using SPSS 25.0. The optimal cutoff values for each parameter were determined as the point maximizing the Youden index. In the training set, the pertinent hematological indicators were transformed into binary variables in accordance with the optimal cutoff values. When the value of an indicator in a patient exceeded the cutoff value, the indicator was assigned a value of 1; otherwise, it was assigned a value of 0. In the validation set, the data were processed in a similar manner using the identical cutoff values.
Construction and Validation of CHPSS
Firstly, univariate Cox regression analysis was performed on each hematological index in the training set to preliminarily screen nine variables related to prognosis. Subsequently, a Lasso-Cox regression analysis was performed on the preliminarily screened variables. Finally, RDW, BASO, FIB, NLR, MLR, and PNI were identified as the variables to be used for constructing a comprehensive hematological prognostic scoring system (CHPSS). Subsequently, the RS of each patient was calculated using the scoring system, and the optimal cut-off value of RS was determined based on the ROC curve. Patients were then categorized into a high-risk scoring group and a low-risk scoring group. The Kaplan-Meier method was employed to calculate the survival rates of the two groups separately, and the Log rank test was also utilized to assess the discrepancy between the survival curves of the two groups. The prognostic efficacy of the CHPSS on the overall survival of the patients was initially evaluated by the area under the ROC curve of the RS at 1 year, 2 years, and 3 years. In the validation set, patients were grouped using the same RS cutoff values. The predictive efficacy of CHPSS was subsequently validated by comparing the variability between the survival curves of the two groups and the area under the ROC curve of RS at 1, 2, and 3 years. Ultimately, the training set demonstrated that CHPSS is an independent prognostic factor for GBM patients, as evidenced by univariate Cox regression analysis and multivariate Cox regression analyses. These findings were subsequently validated in the validation set.
Construction and Evaluation of the Nomogram Model
In the training set, all collected clinical variables were initially included in univariate Cox regression analysis. Variables identified as significant (KPS score, resection extent, SRI, tumor number, and RS) were subsequently entered into multivariate Cox regression analysis, which retained KPS score, resection extent, tumor number, SRI, and RS as independent prognostic factors. Simultaneously, based on multivariate Cox regression results, a nomogram was constructed using the regplot function from the regplot package in R 4.1.1. Predictive performance of the nomogram was evaluated via the C-index and calibration curves, while clinical utility was assessed using decision curve analysis. In the validation set, predictive accuracy of the nomogram was similarly validated using the C-index and calibration curves.
Subgrouping of SRI by RS
In the overall population of 271 patients, we conducted a further investigation into the relationship between RS and a number of clinical variables. This revealed that RS could be used to subgroup patients according to their prognostic risk based on SRI. The capacity of RS to categorize patients according to their prognostic risk based on SRI was further substantiated by dividing patients into two groups based on SRI ≤ 21 days and SRI > 21 days, subsequently subdividing these two groups based on RS, and comparing the discrepancies in survival curves between the different subgroups.
Statistical Methods
The data analysis was conducted using SPSS 25.0 and GraphPad Prism 8 statistical software. Continuous variables were analyzed using a two-independent samples t-test, while categorical variables were evaluated through a chi-square test. A p-value of less than 0.05 was considered statistically significant. The nomogram model was constructed and validated using R 4.1.1 software, and its predictive efficacy was evaluated using discrimination, calibration, and clinical decision curves.
Results
Patient Data Characteristics
This study included a total of 271 GBM (IDH wild-type, WHO grade 4) patients who met the screening criteria and were randomly assigned to a training set (190 cases) and a validation set (81 cases) in a 7:3 ratio, as shown in Figure 1, the research flowchart. Table 1 shows the baseline characteristics of the patients in the training and validation sets. There were no statistically significant differences in age, gender, smoking and alcohol history, first presenting symptom, KPS score, tumor location, tumor number, maximum tumor diameter, extent of resection, the interval between surgery and radiotherapy, and various hematological indicators between the two groups. The mean OS of the training and validation groups were 21.7 (6–65) months and 23.1 (6–59) months, respectively, and the survival rates were 18.9% and 21%, respectively.
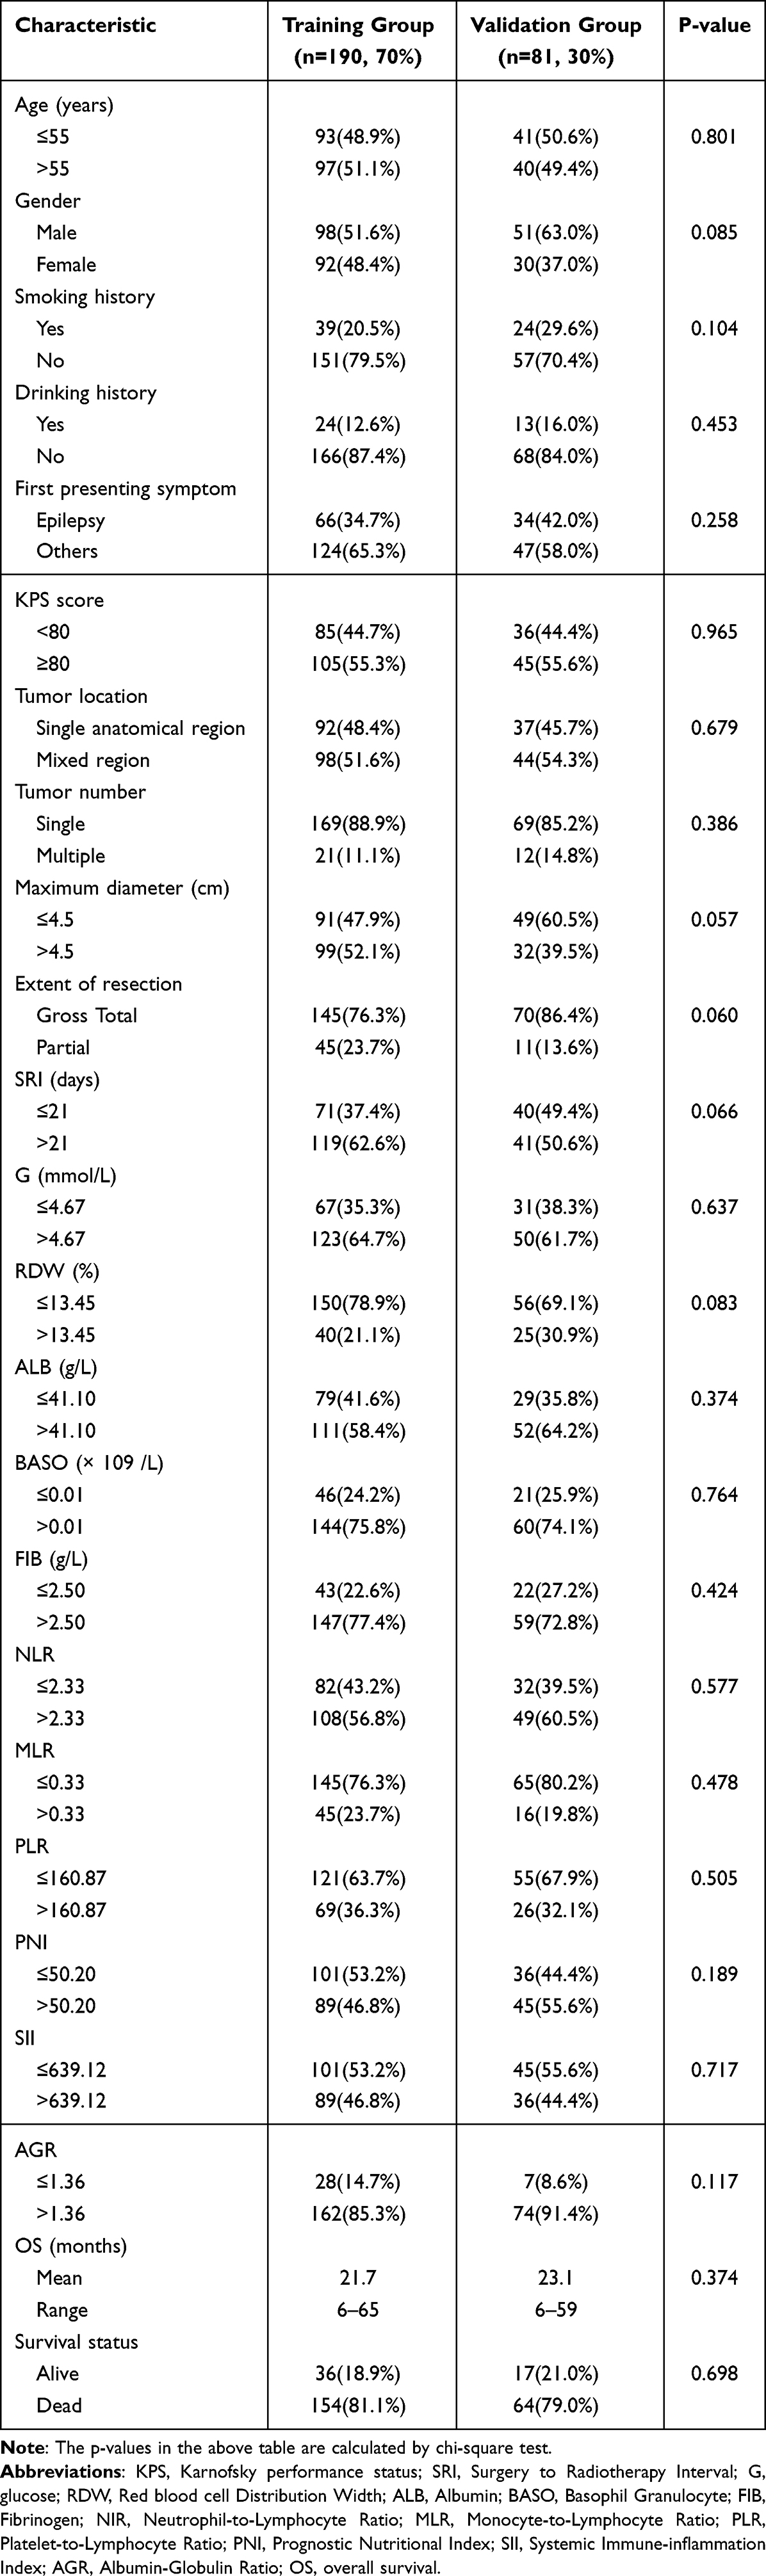 |
Table 1 Baseline Characteristics of GBM Patients |
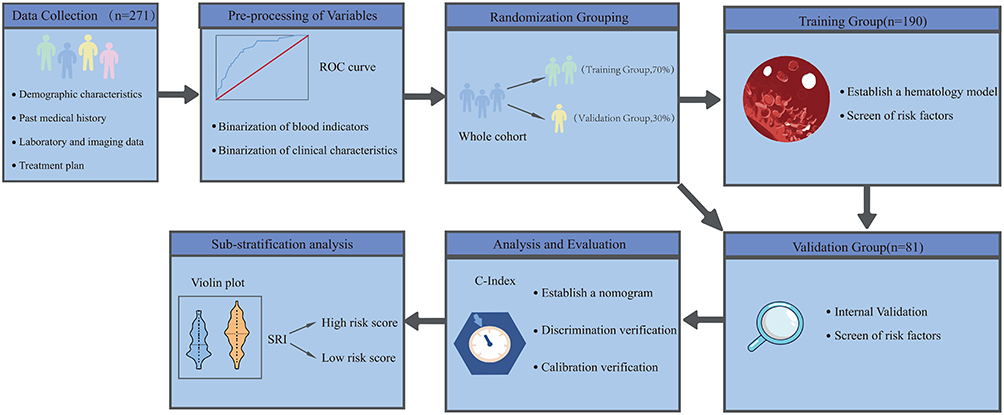 |
Figure 1 Flow chart of the study. Abbreviations: ROC Curve, Receiver Operating Characteristic Curve; SRI, Surgery to Radiotherapy Interval. |
Screening of Hematological Indicators and Construction and Validation of CHPSS
In the training set, a univariate Cox regression analysis was performed on 12 hematological indicators to assess their correlation with patients’ OS, as shown in Figure 2A. Among them, RDW, BASO, NLR, MLR, PLR, ELR, FIB, SII, and PNI had a P-value of less than 0.1, and these 9 hematological indicators were included in the Lasso-cox regression analysis, as shown in the coefficient distribution plot in Figure 2B and the cross-validation plot in Figure 2C, and then screened out RDW, BASO, NLR, MLR, FIB, and PNI were used to construct the CHPSS, and the optimal cutoff values and their coefficients of the 6 hematological markers for constructing CHPSS are shown in Table 2. Ultimately, the CHPSS was derived from the linear combination of these six markers weighted by their coefficients. The risk score (RS) of each patient was calculated from the CHPSS. The optimal cutoff value of RS was 0.415, and based on the cutoff value, the patients were categorized into high-risk and low-risk groups. Compared with the high-risk group, patients in the low-risk group had significantly better OS (P < 0.001), as shown in Figure 2D and E comparing the survival curves of the two groups in the training and validation sets, respectively, which indicated that the RS had a better discriminatory effect on the prognosis of patients. In the training set, the area under the curve of the ROC curve of RS at 1, 2, and 3 years was 0.79, 0.73, and 0.73, respectively, as shown in Figure 3A; in the validation set, the area under the curve of the ROC curve of RS at 1, 2, and 3 years was 0.81, 0.74, and 0.69, respectively, as shown in Figure 3B, which indicated that the RS calculated by CHPSS had better differentiation of patients’ long-term survival still has a good predictive ability. Figure 3C and Figure 3D show the ROC curves of RS at 1 year in the training and validation sets, respectively, with areas under the curve of 0.79 and 0.81, which are larger than any other single hematological index, indicating that the predictive value of RS for patient prognosis is better than that of a single hematological index. To evaluate the predictive capacity of RS in comparison to other clinical variables, we constructed time-dependent ROC curves for these variables, as illustrated in Figure 3E and F for the training and validation sets, respectively. The results demonstrate that RS consistently exhibits superior predictive ability compared to KPS score, extent of resection, SRI, and tumor number for the prognosis of GBM (IDH wild-type, WHO grade 4) patients, when compared to other clinical features.
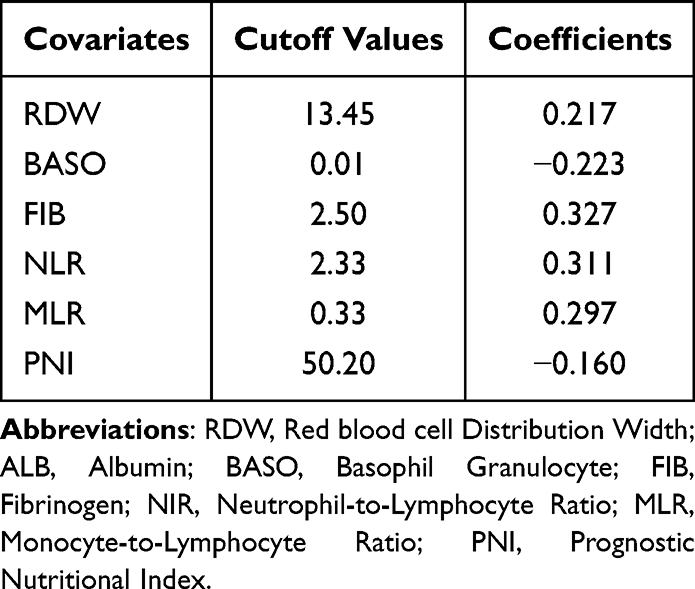 |
Table 2 The Optimal Cut-off Values and Weighting Coefficients of Covariates Used to Construct the CHPSS |
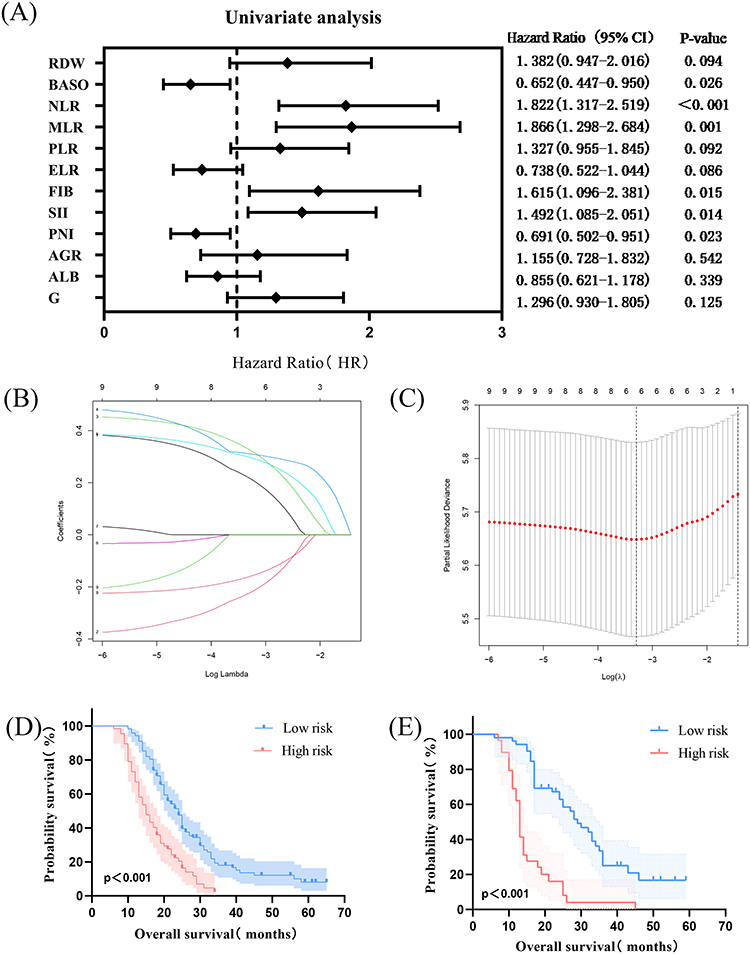 |
Figure 2 The development of the CHPSS. (A) Univariate Cox regression analysis forest plot of the initially hematological markers. (B) Coefficient Distribution Plot. (C) Cross-validation Plot. (D) Survival Curve of Training Group. (E) Survival curve in internal validation Group. Abbreviations: RDW, Red blood cell Distribution Width; BASO, Basophil Granulocyte; NIR, Neutrophil-to-Lymphocyte Ratio; MLR, Monocyte-to-Lymphocyte Ratio; PLR, Platelet-to-Lymphocyte Ratio; ELR, Eosinophil to Lymphocyte Ratio; FIB, Fibrinogen; SII, Systemic Immune-inflammation Index; PNI, Prognostic Nutritional Index; AGR, Albumin-Globulin Ratio; ALB, Albumin; G, glucose. |
 |
Figure 3 Evaluation of CHPSS. (A) The AUCs of RS at 1, 2, and 3 years in the training group. (B) The AUCs of RS at 1, 2, and 3 years in the validation group. (C) The build results of the CHPSS were shown in the form of ROC curves at 1-year in the training group. (D) The verification results of the CHPSS were shown in the form of ROC curves at 1-year in the validation group. (E) Time-dependent ROC curves of the RS and important clinical characteristics in the training group. (F) Time-dependent ROC curves of the RS and important clinical characteristics in the validation group. Abbreviations: AUC, Area Under the Curve; RDW, Red blood cell Distribution Width; BASO, Basophil Granulocyte; NIR, Neutrophil-to-Lymphocyte Ratio; MLR, Monocyte-to-Lymphocyte Ratio; FIB, Fibrinogen; PNI, Prognostic Nutritional Index; KPS, Karnofsky performance status; SRI, Surgery to Radiotherapy Interval. |
Construction and Evaluation of Nomogram Model Based on CHPSS and Clinical Characteristics
To ascertain whether RS could be utilized as an independent prognostic factor for GBM (IDH wild-type, WHO grade 4) patients, we conducted univariate and multivariate Cox regression analyses. In the training set, univariate Cox regression analysis was performed on all variables, including RS. The results demonstrated that the KPS score (P < 0.001), extent of resection (P < 0.001), SRI (P < 0.001), tumor number (P = 0.036), and RS (P < 0.001). Figure 4A illustrates the strong correlation between these variables and the survival prognosis of the patients. The combination of KPS score, extent of resection, SRI, tumor number, and RS were included in the multivariate Cox regression analysis, and the results demonstrated that KPS score (P = 0.009), extent of resection (P = 0.001), SRI (P = 0.038), tumor number (P = 0.036), and RS (P < 0.001) were the independent prognostic factors for the patients, as shown in Figure 4B. In the validation set, we performed univariate Cox regression analysis for each variable, and the results showed that KPS score (P < 0.001), extent of resection (P = 0.026), SRI (P = 0.018), tumor number (P = 0.055), and RS (P < 0.001) were strongly correlated with the survival prognosis of the patients, as shown in Figure 4C. The multivariate Cox regression analysis included the KPS score, extent of resection, SRI, tumor number, and RS. The results demonstrated that the KPS score (P = 0.002), extent of resection (P = 0.02), SRI (P = 0.021), and RS (P < 0.001) were independent prognostic factors for patients, as illustrated in Figure 4D. The univariate and multivariate Cox regression analyses of the validation set yielded results consistent with those of the training set.
 |
Figure 4 CHPSS is an independent prognostic factor for GBM patients. (A) Forest plot of univariate Cox regression analysis of all clinical covariates in the training group. (B) Forest plot of multivariate Cox regression analysis of all significant clinical covariates in the training group. (C) Forest plot of univariate Cox regression analysis of all clinical covariates in the validation group. (D) Forest plot of multivariate Cox regression analysis of all significant clinical covariates in the validation group. Abbreviations: KPS, Karnofsky performance status; SRI, Surgery to Radiotherapy Interval. |
Furthermore, in order to enhance the predictive capacity for the prognosis of GBM (IDH wild-type, WHO grade 4) patients, we constructed a nomogram based on the findings of the multivariate Cox regression analysis in the training set, as illustrated in Figure 5A. This nomogram presents a total score, calculated by adding the hazard point scores of the tumor number, SRI, KPS score, extent of resection, and RS, for a total of five covariates. In the training set, the C-index of this nomogram was 0.79, and the calibration plot demonstrated that the nomogram model exhibited general concordance with the observed outcomes in predicting 1-year and 2-year overall survival, as illustrated in Figure 5B. In the validation set, the C-index of the nomogram was 0.73, and the calibration plot demonstrated that the nomogram model exhibited good agreement with the observed results in predicting 1-year and 2-year overall survival, as illustrated in Figure 5C. And the clinical decision curve in the training set demonstrates that when the threshold probability exceeds 20%, the model predicts the greatest net benefit for GBM (IDH wild-type, WHO grade 4) patients treated with the Stupp regimen, which has good clinical utility, as shown in Figure 5D.
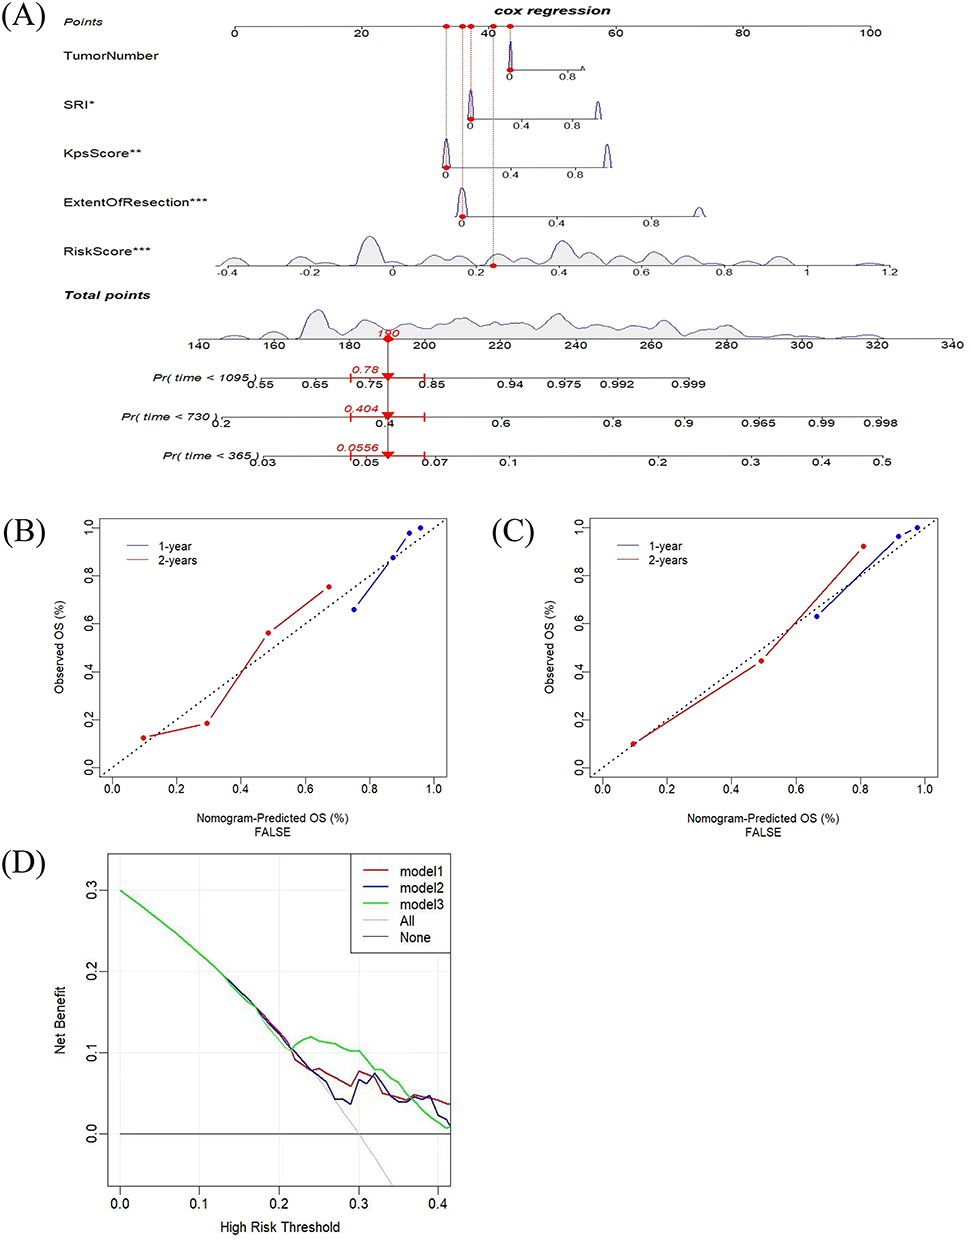 |
Figure 5 Construction and Evaluation of Column Chart. (A) Nomogram to predict the probability of patient mortality based on RS and clinical characteristic. (B) Calibration chart in the training group to verify the accuracy of the nomogram. (C) Calibration chart in the validation group to verify the accuracy of the nomogram. (D) Decision curve analysis of nomogram in the training group; model 1: Four preoperative clinical parameters: KPS score, Extent of resection, SRI, Tumor number; model 2: Risk Score; model 3: Risk Score and four postoperative clinical parameters. Abbreviation: SRI, Surgery to Radiotherapy Interval; KPS, Karnofsky performance status. |
Subgroup Analysis of SRI by RS
To enhance the clinical applicability of CHPSS, we employed RS for risk stratification of each clinical feature. Our findings revealed that RS in the SRI > 21 days group was markedly lower than that in the SRI ≤ 21 days group, with a statistically significant difference between the two groups, as illustrated in the violin plot of Figure 6A. This suggests that the earlier a patient receives postoperative radiotherapy, the higher their prognostic risk score is and the more detrimental it is to long-term survival. Subsequently, the patients were regrouped based on RS risk grouping, as defined by SRI. The resulting groups were as follows: Group 1: SRI ≤ 21, RS ≤ 0.415; Group 2: SRI > 21, RS ≤ 0.415; Group 3: SRI ≤ 21, RS > 0.415; and Group 4: SRI > 21, RS > 0.415. By comparing the difference between the survival curves of Group 1 and Group 3 and the difference between the survival curves of Group 2 and Group 4, it was determined that RS could be utilized to more precisely subgroup patients based on the prognostic risk grouping of GBM (IDH wild-type, WHO grade 4) patients by SRI. Figure 6B illustrates that when SRI is ≤21 days, the prognosis of patients in the RS ≤ 0.415 group is more favorable. Figure 6C demonstrates that when SRI is >21 days, patients in the RS ≤ 0.415 group have a more favorable prognosis, and the differences between their survival curves are all statistically significant (P < 0.001). The subdivision of SRI by RS enables the expedient identification of high-risk GBM (IDH wild-type, WHO grade 4) patients in clinical settings.
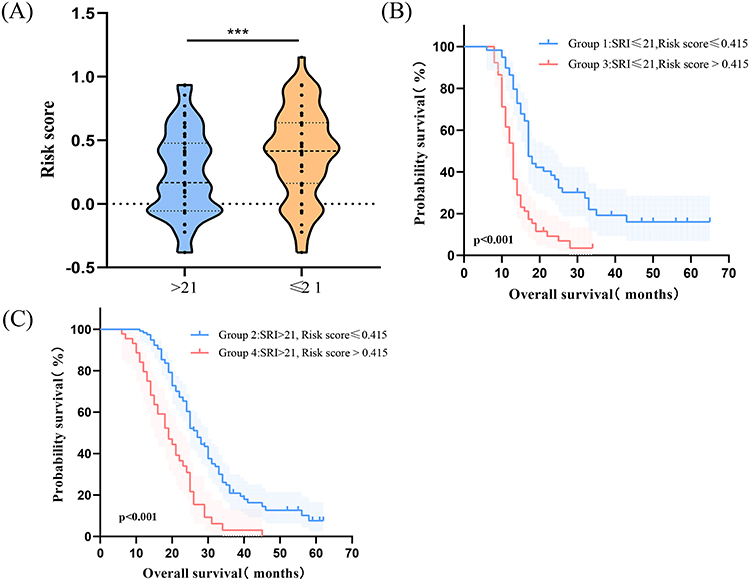 |
Figure 6 The relationship between SRI and CHPSS. (A) Violin plot of RS values of patients in SRI ≤ 21 days group and SRI> 21 days group. (B) Survival curves of group 1 and group 3. (C) Survival curves of group 2 and group 4. Abbreviation: SRI, Surgery to Radiotherapy Interval. Note: p<0,001***. |
Discussion
In recent years, the factors affecting the prognosis of glioblastoma (GBM) patients have been a focus of extensive research. GBM is a highly malignant tumor, and the Stupp regimen, which combines maximum safe surgical resection with postoperative external beam radiotherapy and concurrent temozolomide chemotherapy, is the most commonly used clinical treatment approach.15 Despite this, the five-year survival rate of patients undergoing surgery, radiotherapy, and chemotherapy remains low. Thus, it is of great urgency to comprehensively explore the prognostic factors related to GBM patients and establish a predictive model that can identify high-risk GBM patients at an early stage, aiming to provide evidence for clinical decision-making. Andrea Bianconi et al16 developed a predictive model for the prognosis of elderly patients with high-grade gliomas, which offers a valuable reference for clinicians to decide whether to perform neurosurgical interventions on such patients. Ozden Demir et al17 established a hematological predictive model for GBM patients using hemoglobin, albumin, lymphocytes, and platelets. However, this model did not incorporate inflammatory factors and had limited predictive ability. Mauro Dobran et al18 used preoperative hematological variables to predict GBM outcomes, but their analysis was restricted by a small sample size and the lack of internal validation. Changjun Rao et al19 constructed a GBM prognostic model based on peripheral blood genes, which showed high predictive accuracy. Nevertheless, these variables are difficult to obtain clinically, limiting the model’s practical application in routine practice.
Current research indicates that inflammation plays a crucial role in the pathogenesis and progression of glioblastoma.20 Inflammatory cells in the tumor microenvironment can influence the proliferation, differentiation, and invasion of tumor cells. Hematological indicators such as the neutrophil-to-lymphocyte ratio (NLR), monocyte-to-lymphocyte ratio (MLR), and platelet-to-lymphocyte ratio (PLR) can help assess the degree of the inflammatory response and predict the prognosis of GBM patients.21–23 An elevated NLR suggests a reduction in lymphocyte availability and a decline in the lytic activity of immune cells, ultimately resulting in an impaired anti-tumor immune response and a poor prognosis for patients.24 Moreover, monocytes can stimulate tumor cell proliferation by secreting inflammatory factors such as tumor necrosis factor (TNF), interleukin-6 (IL-6), and interleukin 1 (IL-1). Therefore, an elevated MLR often indicates a poor prognosis.25,26 This study also found a correlation between preoperative basophil levels and the prognosis of GBM patients. Higher basophil counts were associated with a more favorable prognosis. The possible mechanisms are as follows: First, basophils can secrete chemokines C-C motif chemokine ligand 3 (CCL3) and C-C motif chemokine ligand 4 (CCL4),27 which can attract CD8-positive T cells to enter tumor tissues. The infiltration of CD8-positive T cells in tumor tissues is related to a better prognosis for GBM patients.28,29 Second, basophils contain high levels of histamine, which can increase the permeability of tumor tissue cells,30 thereby enhancing the efficacy of anti-tumor chemotherapeutic drugs. Additionally, basophils can directly secrete inflammatory cytokines, such as tumor necrosis factor, which can induce apoptosis in tumor cells.31 However, further basic research is needed to clarify the detailed mechanism of basophils’ action.
In addition, PNI has been demonstrated to be a valuable indicator of patient nutritional status in numerous studies, with a correlation observed between PNI and the prognosis of various solid tumors, including hepatocellular carcinoma, non-small-cell lung cancer, and glioblastoma, among others.32–34 PNI, which considers both serum albumin and lymphocytes, offers a more comprehensive reflection of the nutritional status of patients. A higher PNI is typically associated with a more favorable prognosis for GBM patients. Additionally, it has been demonstrated that the preoperative coagulation status of patients is associated with the prognosis of GBM.35 Elevated levels of FIB have been linked to a poor prognosis in GBM patients36 Additionally, a positive correlation has been demonstrated between the pathological grade of glioma and the level of FIB in patients.37,38 As the grade increases, the invasiveness of tumor cells also rises, potentially due to FIB’s role in promoting tumor angiogenesis, tumor cell invasion, and metastasis.39,40 Similarly, RDW has been linked to the prognosis of GBM patients. It has been demonstrated that RDW may be associated with inflammatory status, oxidative stress in the body, and poorer nutritional status. High levels of RDW have been shown to predict poorer OS in patients.41 In this study, common hematological inflammatory markers were included in the Lasso-Cox regression analysis, and NLR, MLR, PNI, FIB, BASO, and RDW were ultimately selected for the construction of CHPSS. This approach allows for the simultaneous assessment of three key aspects of the patient’s inflammatory status, nutritional status, and coagulation status, offering a more comprehensive and advantageous representation compared to traditional single hematological index assessments.
For GBM patients, timely postoperative radiotherapy is usually required. However, the optimal timing of postoperative radiotherapy remains controversial. Blumenthal et al found that the median survival of patients who received radiotherapy within a 4-week delay was significantly longer than that of patients who received radiotherapy within a 2-week delay.42 They concluded that a moderate delay of up to 6 weeks would not affect the OS of GBM patients. Buszek et al43 analyzed data from 45,942 GBM patients in the National Cancer Data Bank and found that an interval of 4–8 weeks between surgery and radiotherapy could improve patients’ OS, while either too early or too late radiotherapy would reduce survival. Another study investigated the impact of the surgery-to-radiotherapy interval on the prognosis of IDH wild-type GBM patients and found that an appropriately prolonged SRI did not negatively affect OS.44 A modeling study in rats showed that early postoperative radiotherapy for brain tumors caused more severe brain tissue damage than radiotherapy started more than three weeks after surgery.45 In this study, patients were divided into two groups based on their SRI (≤21 days and >21 days), and the correlation between SRI and patients’ OS was analyzed. The results showed that patients with an SRI >3 weeks had a significantly better OS than those with an SRI ≤3 weeks. Moreover, SRI was an independent prognostic factor affecting the OS of GBM patients. This may be because residual tumor tissues are in a relatively hypoxic state after surgery, with reduced blood perfusion and a lack of neovascularization, leading to radioresistance.46 In addition, premature radiotherapy increases the risk of severe neurological impairment, which is detrimental to the patient’s prognosis. However, if an appropriate time for radiotherapy can be determined after this unsuitable period, it may improve the prognosis of GBM patients.
The Karnofsky Performance Status (KPS) score is a widely used tool for evaluating the physical function of cancer patients. A higher KPS score indicates a better physical condition and greater tolerance to treatments such as surgery, radiotherapy, and chemotherapy. Li et al demonstrated that a lower preoperative KPS score was associated with a poorer prognosis in glioma patients.47 In this study, we also found that a higher KPS score was associated with a better prognosis in GBM patients. Patients with a KPS score of 80 or above had a significantly improved OS compared to those with a score below 80. The extent of surgical resection is another independent factor affecting the prognosis of GBM patients. A large number of previous studies have shown a significant correlation between the extent of surgical resection and the survival of high-grade glioma patients.48–50 The presence of postoperative residual lesions can facilitate the infiltration and growth of malignant cells into surrounding normal tissues, increasing the risk of postoperative recurrence. The findings of this study are consistent with previous studies, indicating that patients who underwent total surgical resection had a better prognosis. This study also found a significant correlation between the number of tumors and the prognosis of GBM patients. Patients with multiple tumor foci had a much worse prognosis than those with a single tumor.
The CHPSS model constructed in this study revealed the complex relationship with GBM prognosis by integrating three - dimensional hematological indicators of inflammation (NLR, MLR, BASO), nutrition (PNI), and coagulation (FIB, RDW). Elevated NLR and MLR reflected an immunosuppressive microenvironment (such as TAM polarization and CD8+ T-cell depletion), while BASO recruited anti-tumor immune cells through CCL3 and CCL4. A decreased PNI suggested immunosuppression caused by malnutrition. Elevated FIB promoted tumor angiogenesis and invasion, and abnormal RDW was associated with oxidative stress and chemoresistance. The synergy between CHPSS and clinical features (such as SRI, KPS score, and resection extent) indicated that even in the high-risk group with an SRI≤21 days, patients with a low RS could still gain a survival advantage through a better systemic status. Compared with the traditional RTOG-RPA model (which depends on clinical parameters) and the MGMT single - molecular model, CHPSS significantly enhanced the predictive efficacy through multidimensional integration (C-index 0.79 vs 0.65–0.72) and had the ability for dynamic updating.
However, this study has several limitations. First, it was a single-center retrospective study with a limited sample size. The patient cohort in this study may not be fully representative of the entire GBM patient population, which may introduce biases in statistical analysis. Second, due to the small sample size, this study was unable to conduct a more refined grouping of SRI to explore its correlation with patient prognosis in depth. Additionally, molecular markers such as MGMT methylation and EGFR amplification were not considered in this study, which may have led to potential confounding factors. Finally, the prognostic model in this study was only internally validated. In future research, more relevant molecular markers should be incorporated, and a larger sample size, multicenter external validation, and mechanistic studies (such as the immune regulatory network of BASO and the pro-coagulant-promoter metastatic mechanism of the FIB-RDW axis) are needed to further optimize the model. This will help guide individualized therapeutic strategies (such as combined anticoagulant and immune modulation interventions) and promote the development of GBM precision medicine.
Conclusions
KPS score < 80, subtotal resection, SRI≤21 days, multiple tumors, and RS > 0.415 are risk factors for the prognosis of GBM patients. The nomogram model constructed based on CHPSS exhibits good predictive performance for the prognosis of GBM patients. The RS calculated by CHPSS serves as an independent prognostic factor for patients and can be utilized to stratify the prognosis of GBM patients based on SRI.
Data Sharing Statement
The original contributions presented in the study are included in the article, further inquiries can be directed to the corresponding author.
Ethics Statement
The studies involving humans were approved by the Ethics Committee of the First Affiliated Hospital of Zhengzhou University. Ethical number: 2024-KY-1485-001. The studies were conducted in accordance with the local legislation and institutional requirements. The participants provided their written informed consent to participate in this study. Written informed consent was obtained from the individual(s) for the publication of any potentially identifiable images or data included in this article.
Acknowledgments
We appreciate the Department of Radiation Oncology of the First Affiliated Hospital of Zhengzhou University.
Author Contributions
All authors made a significant contribution to the work reported, whether that is in the conception, study design, execution, acquisition of data, analysis and interpretation, or in all these areas; took part in drafting, revising or critically reviewing the article; gave final approval of the version to be published; have agreed on the journal to which the article has been submitted; and agree to be accountable for all aspects of the work.
Funding
The authors declare financial support was received for the research, authorship, and/or publication of this article. This study was supported by Provincial-Ministry Joint Project of Medical Science and Technology Tackling Program in Henan Province (SB201901037).
Disclosure
The authors declare that the research was conducted in the absence of any commercial or financial relationships that could be construed as a potential conflict of interest.
References
1. Wirsching HG, Galanis E, Weller M. Glioblastoma. In: Handbook of Clinical Neurology. Vol. 134. Elsevier;2016:381–397. doi:10.1016/B978-0-12-802997-8.00023-2
2. Ma R, Taphoorn MJB, Plaha P. Advances in the management of glioblastoma. J Neurol Neurosurg Psychiatry. 2021;92(10):1103–1111. doi:10.1136/jnnp-2020-325334
3. Niu X, Chang T, Yang Y, Mao Q. Prognostic nomogram models for predicting survival probability in elderly glioblastoma patients. J Cancer Res Clin Oncol. 2023;149(15):14145–14157. doi:10.1007/s00432-023-05232-w
4. Press RH, Shafer SL, Jiang R, et al. Optimal timing of chemoradiotherapy after surgical resection of glioblastoma: stratification by validated prognostic classification. Cancer. 2020;126(14):3255–3264. doi:10.1002/cncr.32797
5. Ostrom QT, Cote DJ, Ascha M, Kruchko C, Barnholtz-Sloan JS. Adult glioma incidence and survival by race or ethnicity in the United States from 2000 to 2014. JAMA Oncol. 2018;4(9):1254. doi:10.1001/jamaoncol.2018.1789
6. Qian BZ. Inflammation fires up cancer metastasis. Semi Cancer Biol. 2017;47:170–176. doi:10.1016/j.semcancer.2017.08.006
7. Barahona Ponce C, Scherer D, Brinster R, et al. Gallstones, body mass index, c‐reactive protein, and gallbladder cancer: Mendelian randomization analysis of Chilean and European genotype data. Hepatology. 2021;73(5):1783–1796. doi:10.1002/hep.31537
8. Sasaki M, Miyoshi N, Fujino S, et al. The geriatric nutritional risk index predicts postoperative complications and prognosis in elderly patients with colorectal cancer after curative surgery. Sci Rep. 2020;10(1):10744. doi:10.1038/s41598-020-67285-y
9. Satragno C, Schiavetti I, Cella E, et al. Systemic inflammatory markers and volume of enhancing tissue on post-contrast T1w MRI images in differentiating true tumor progression from pseudoprogression in high-grade glioma. Clin Transl Radiat Oncol. 2024;49:100849. doi:10.1016/j.ctro.2024.100849
10. Madhugiri VS, Moiyadi AV, Shetty P, et al. Analysis of factors associated with long-term survival in patients with glioblastoma. World Neurosurg. 2021;149:e758–e765. doi:10.1016/j.wneu.2021.01.103
11. hao ZS, lan HJ, Chen M, long WB, Shui OQ, Yue HS. Diagnostic value of preoperative inflammatory markers in patients with glioma: a multicenter cohort study. J Neurosurg. 2018;129(3):583–592. doi:10.3171/2017.3.JNS161648
12. Yang C, Wen HB, Zhao YH, Huang WH, Wang ZF, Li ZQ. Systemic inflammatory indicators as prognosticators in glioblastoma patients: a comprehensive meta-analysis. Front Neurol. 2020;11:580101. doi:10.3389/fneur.2020.580101
13. Wang C, Jin S, Xu S, Cao S. High systemic immune-inflammation index (sii) represents an unfavorable prognostic factor for small cell lung cancer treated with etoposide and platinum-based chemotherapy. Lung. 2020;198(2):405–414. doi:10.1007/s00408-020-00333-6
14. Louis DN, Perry A, Wesseling P, et al. The 2021 WHO classification of tumors of the central nervous system: a summary. Neuro-Oncology. 2021;23(8):1231–1251. doi:10.1093/neuonc/noab106
15. Stupp R, Weller M, Belanger K, et al. Radiotherapy plus concomitant and adjuvant temozolomide for glioblastoma. New Engl J Med. 2005;352(10):987–996. doi:10.1056/NEJMoa043330
16. Bianconi A, Presta R, La Cava P, et al. A novel scoring system proposal to guide surgical treatment indications for high grade gliomas in elderly patients: DAK-75. Neurosurg Rev. 2024;47(1):823. doi:10.1007/s10143-024-03052-1
17. Demir O, Demirag G, Cakmak F, et al. Hemoglobin, albumin, lymphocytes and platelets (HALP) score as a predictor of survival in patients with glioblastoma (GBM). BMC Neurol. 2024;24(1):260. doi:10.1186/s12883-024-03639-7
18. Marini A, Dobran M, Aiudi D, et al. Pre-operative hematological markers as predictive factors for overall survival and progression free survival in glioblastomas. Clin Neurol Neurosurg. 2020;197:106162. doi:10.1016/j.clineuro.2020.106162
19. Rao C, Jin J, Lu J, et al. A multielement prognostic nomogram based on a peripheral blood test, conventional MRI and clinical factors for glioblastoma. Front Neurol. 2022;13:822735. doi:10.3389/fneur.2022.822735
20. Alorfi NM, Ashour AM, Alharbi AS, et al. Targeting inflammation in glioblastoma: an updated review from pathophysiology to novel therapeutic approaches. Medicine. 2024;103(21):e38245. doi:10.1097/MD.0000000000038245
21. Sharma G, Jain SK, Sinha VD. Peripheral inflammatory blood markers in diagnosis of glioma and IDH status. JNRP. 2021;12:88–94. doi:10.1055/s-0040-1721166
22. Bao Y, Yang M, Jin C, et al. Preoperative hematologic inflammatory markers as prognostic factors in patients with glioma. World Neurosurg. 2018;119:e710–e716. doi:10.1016/j.wneu.2018.07.252
23. Hsu EJ, Thomas J, Maher EA, et al. Neutrophilia and post-radiation thrombocytopenia predict for poor prognosis in radiation-treated glioma patients. Front Oncol. 2022;12:1000280. doi:10.3389/fonc.2022.1000280
24. Balkwill F, Mantovani A. Inflammation and cancer: back to Virchow? Lancet. 2001;357(9255):539–545. doi:10.1016/S0140-6736(00)04046-0
25. Neela Sivapurapu PFL. Monocyte-induced prostate cancer cell invasion is mediated by chemokine ligand 2 and nuclear factor-κB activity. J Clin Cell Immunol. 2015;06(02). doi:10.4172/2155-9899.1000308
26. Caverzán MD, Beaugé L, Oliveda PM, et al. Exploring monocytes-macrophages in immune microenvironment of glioblastoma for the design of novel therapeutic strategies. Brain Sci. 2023;13(4):542. doi:10.3390/brainsci13040542
27. Sektioglu IM, Carretero R, Bulbuc N, et al. Basophils promote tumor rejection via chemotaxis and infiltration of CD8+ T cells. Cancer Res. 2017;77(2):291–302. doi:10.1158/0008-5472.CAN-16-0993
28. Yang I, Tihan T, Han SJ, et al. CD8+ T-cell infiltrate in newly diagnosed glioblastoma is associated with long-term survival. J Clin Neurosci. 2010;17(11):1381–1385. doi:10.1016/j.jocn.2010.03.031
29. Kmiecik J, Poli A, Brons NHC, et al. Elevated CD3+ and CD8+ tumor-infiltrating immune cells correlate with prolonged survival in glioblastoma patients despite integrated immunosuppressive mechanisms in the tumor microenvironment and at the systemic level. J Neuroimmunol. 2013;264(1–2):71–83. doi:10.1016/j.jneuroim.2013.08.013
30. Crivellato E, Nico B, Ribatti D. The history of the controversial relationship between mast cells and basophils. Immunol Lett. 2011;141(1):10–17. doi:10.1016/j.imlet.2011.06.008
31. Gordon JR, Galli SJ. Mast cells as a source of both preformed and immunologically inducible TNF-alpha/cachectin. Nature. 1990;346(6281):274–276. doi:10.1038/346274a0
32. Hong S, Zhou T, Fang W, et al. The prognostic nutritional index (PNI) predicts overall survival of small-cell lung cancer patients. Tumor Biol. 2015;36(5):3389–3397. doi:10.1007/s13277-014-2973-y
33. Chan AWH, Chan SL, Wong GLH, et al. Prognostic nutritional index (PNI) predicts tumor recurrence of very early/early stage hepatocellular carcinoma after surgical resection. Ann Surg Oncol. 2015;22(13):4138–4148. doi:10.1245/s10434-015-4516-1
34. Kim YJ, Oh H, Lee SJ, et al. Prognostic significance of the postoperative prognostic nutritional index in patients with glioblastoma: a retrospective study. BMC Cancer. 2021;21(1):942. doi:10.1186/s12885-021-08686-8
35. Navone SE, Guarnaccia L, Locatelli M, et al. Significance and prognostic value of the coagulation profile in patients with glioblastoma: implications for personalized therapy. World Neurosurg. 2019;121:e621–e629. doi:10.1016/j.wneu.2018.09.177
36. Zhao C, Li LQ, Yang FD, et al. A hematological-related prognostic scoring system for patients with newly diagnosed glioblastoma. Front Oncol. 2020;10:591352. doi:10.3389/fonc.2020.591352
37. Wang PF, Meng Z, Song HW, et al. Preoperative changes in hematological markers and predictors of glioma grade and survival. Front Pharmacol. 2018;9:886. doi:10.3389/fphar.2018.00886
38. Wu Y, Song Z, Sun K, et al. A novel scoring system based on peripheral blood test in predicting grade and prognosis of patients with glioma. OTT. 2019;12:11413–11423. doi:10.2147/OTT.S236598
39. Schwartzbaum JA, Lal P, Evanoff W, et al. Presurgical serum albumin levels predict survival time from glioblastoma multiforme.
40. Vilar R, Fish RJ, Casini A, Neerman-Arbez M. Fibrin(ogen) in human disease: both friend and foe. Haematologica. 2020;105(2):284–296. doi:10.3324/haematol.2019.236901
41. Fei LR, Li M, Yang Y, Mao Q, hui LY. Significance of pretreatment red blood cell distribution width in patients with newly diagnosed glioblastoma. Med Sci Monit. 2017;23:3217–3223. doi:10.12659/MSM.905204
42. Blumenthal DT, Won M, Mehta MP, et al. Short delay in initiation of radiotherapy for patients with glioblastoma-effect of concurrent chemotherapy: a secondary analysis from the NRG Oncology/Radiation Therapy Oncology Group database. Neuro Oncol. 2018;20(7):966–974. doi:10.1093/neuonc/noy017
43. Buszek SM, Al Feghali KA, Elhalawani H, Chevli N, Allen PK, Chung C. Optimal timing of radiotherapy following gross total or subtotal resection of glioblastoma: a real-world assessment using the national cancer database. Sci Rep. 2020;10(1):4926. doi:10.1038/s41598-020-61701-z
44. Li S, Guo F, Wang X, Zeng J, Hong J. Timing of radiotherapy in glioblastoma based on IMRT and STUPP chemo-radiation: may be no need to rush. Clin Transl Oncol. 2022;24(11):2146–2154. doi:10.1007/s12094-022-02867-y
45. Peker S, Abacioglu U, Sun I, Yuksel M, Pamir MN. Irradiation after surgically induced brain injury in the rat: timing in relation to severity of radiation damage. J Neurooncol. 2004;70(1):17–21. doi:10.1023/B:NEON.0000040820.78643.0a
46. Nathan JK, Brezzell AL, Kim MM, Leung D, Wilkinson DA, Hervey-Jumper SL. Early initiation of chemoradiation following index craniotomy is associated with decreased survival in high-grade glioma. J Neurooncol. 2017;135(2):325–333. doi:10.1007/s11060-017-2577-7
47. Li F, Zhang Y, Wang N, et al. Evaluation of the prognosis of neuroglioma based on dynamic magnetic resonance enhancement. World Neurosurg. 2020;138:663–671. doi:10.1016/j.wneu.2020.01.087
48. Liu G, Jiang R, Xu C, et al. Zhong Nan da Xue Xue Bao Yi Xue Ban. J Central South Univ Med Sci. 2018;43(4):388–393. 10.11817/j.issn.1672-7347.2018.04.008
49. Hong JB, Roh TH, Kang SG, et al. Survival, prognostic factors, and volumetric analysis of extent of resection for anaplastic gliomas. Cancer Res Treat. 2020;52:1041–1049. doi:10.4143/crt.2020.057
50. Li YM, Suki D, Hess K, Sawaya R. The influence of maximum safe resection of glioblastoma on survival in 1229 patients: can we do better than gross-total resection? JNS. 2016;124(4):977–988. doi:10.3171/2015.5.JNS142087
 © 2025 The Author(s). This work is published and licensed by Dove Medical Press Limited. The
full terms of this license are available at https://www.dovepress.com/terms.php
and incorporate the Creative Commons Attribution
- Non Commercial (unported, 4.0) License.
By accessing the work you hereby accept the Terms. Non-commercial uses of the work are permitted
without any further permission from Dove Medical Press Limited, provided the work is properly
attributed. For permission for commercial use of this work, please see paragraphs 4.2 and 5 of our Terms.
© 2025 The Author(s). This work is published and licensed by Dove Medical Press Limited. The
full terms of this license are available at https://www.dovepress.com/terms.php
and incorporate the Creative Commons Attribution
- Non Commercial (unported, 4.0) License.
By accessing the work you hereby accept the Terms. Non-commercial uses of the work are permitted
without any further permission from Dove Medical Press Limited, provided the work is properly
attributed. For permission for commercial use of this work, please see paragraphs 4.2 and 5 of our Terms.