")
Back to Journals » Journal of Inflammation Research » Volume 18
CLEC3B as a Prognostic and Immunological Biomarker in Pan-Cancer: Multi-Omics Profiling and Validation in Pancreatic Cancer and Exosomes
Authors Nan K, Zhang L, Peng Y, Huang J, Yin S, Zou Y, He K, Zhang M
Received 7 February 2025
Accepted for publication 13 May 2025
Published 19 May 2025 Volume 2025:18 Pages 6381—6396
DOI https://doi.org/10.2147/JIR.S517595
Checked for plagiarism Yes
Review by Single anonymous peer review
Peer reviewer comments 2
Editor who approved publication: Professor Ning Quan
Kai Nan,1,* Lei Zhang,2,* Yulong Peng,3 Jing Huang,3 Su Yin,3 Yujia Zou,4 Kaikai He,4 Ming Zhang5
1Department of Joint Surgery, Honghui Hospital, Xi’an Jiaotong University, Xi’an, Shaanxi, 710054, People’s Republic of China; 2Department of Pharmacy, Shaanxi Provincial Hospital of Chinese Medicine, Xi’an, Shaanxi, 710003, People’s Republic of China; 3Department of Orthopaedics, The Second Affiliated Hospital of Xi’an Jiaotong University, Xi’an, Shaanxi, 710000, People’s Republic of China; 4Department of Rehabilitative Medicine, Affiliated Hospital of Shaanxi University of Chinese Medicine, Xianyang, Shaanxi, 712046, People’s Republic of China; 5Department of General Practice, Honghui Hospital, Xi’an Jiaotong University, Xi’an, Shaanxi, 710054, People’s Republic of China
*These authors contributed equally to this work
Correspondence: Ming Zhang, Department of General Practice, Honghui Hospital, Xi’an Jiaotong University, Xi’an, Shaanxi Province, 710054, People’s Republic of China, Email [email protected]
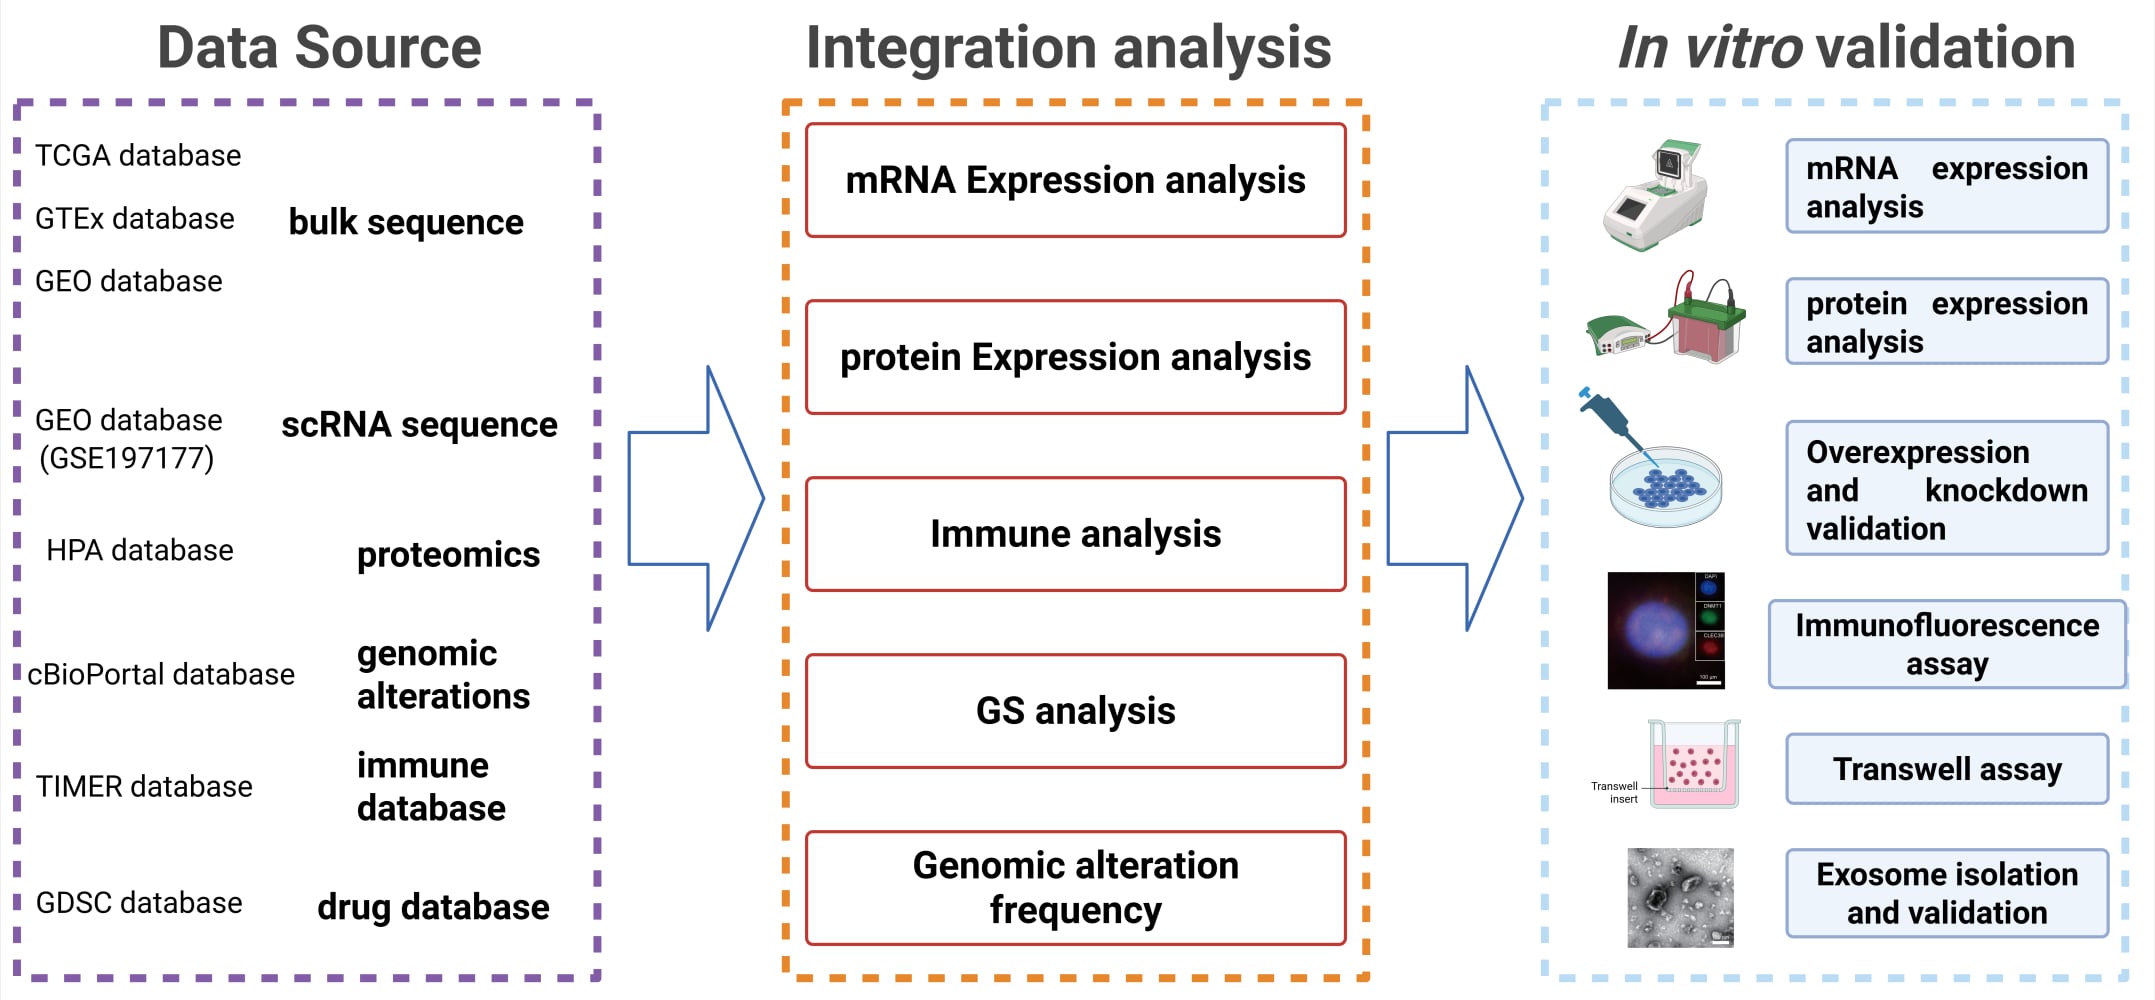
Background: Despite the emergence of in vitro and in vivo experiments validating the connection between CLEC3B and various cancers, a comprehensive pan-cancer investigation remains elusive. In this study, we explored the potential roles of CLEC3B as a tumor suppressor and in immune function across multiple cancer types.
Methods: We visualized outcomes derived from Gene Expression Omnibus (GEO) and diverse online databases. The relationship between tumor-infiltrating cells, gene set enrichment analysis (GSEA) and CLEC3B expression and was examined using R. Additionally, we explored the potential role of CLEC3B in tumor malignant behavior by using siRNA-mediated knockdown.
Results: Our study identifies CLEC3B’s low expression in majority of cancers compared with adjacent normal tissues. Reduced CLEC3B expression correlated with advanced clinical stages, inferior overall survival (OS) and DNA methylation levels. We observed significant positive associations between CLEC3B expression and infiltration levels of various immune cell subtypes. Furthermore, markers linked with immune checkpoints, immunomodulation and RNA modification exhibited a favorable correlation with CLEC3B expression. Intriguingly, silencing CLEC3B (si-CLEC3B) augmented the migratory capabilities of pancreatic adenocarcinoma (PAAD) cells. Additionally, CLEC3B expression was notably enriched in metastatic PAAD endothelial cells and extracellular vesicles, potentially implicating its involvement in tumor vascular function by way of extracellular vesicle.
Conclusion: In conclusion, our initial pan-cancer analyses of CLEC3B provide insights into its associations with clinical prognosis, DNA methylation, immune cell infiltration, and tumor mutation burden, highlighting its potential as a tumor suppressor and mediator of immune infiltration in pan-cancer.
Keywords: CLEC3B, pan-cancer, methylation, immune infiltration, tumor microenvironment
Graphical Abstract:
Introduction
Cancer constitutes a significant contributor to global morbidity and mortality, presenting a substantial threat to both human health and socioeconomic stability. In 2020, there were 19.3 million reported new cancer cases and nearly 10 million cancer-related deaths worldwide.1 Despite considerable advancements in cancer treatments, a majority of cases are diagnosed at advanced stages, leading to suboptimal treatment outcomes.2 Hence, there is an urgent need to identify potential biomarkers for early cancer detection and treatment.
CLEC3B belongs to the C-type lectin domain superfamily, encoding tetranectin (TN). It regulates various physiological processes including fibrinolytic proteolysis, osteogenesis calcification, muscle development, and the occurrence of cardiovascular disease.3–5 Recent studies have indicated the involvement of CLEC3B in tumorigenesis, progression, and its close association with tumor metastasis and angiogenesis.6–10 However, previous research on CLEC3B function has been predominantly limited to specific cancer types. Therefore, investigating the functions and molecular pathways of CLEC3B across pan-cancer datasets becomes imperative, offering novel insights for clinical cancer treatment.
This study comprehensively characterizes the expression profile, mutation patterns, and prognostic implications of CLEC3B across various cancers. Utilizing data from GEPIA, UALCAN, and TIMER databases, we explore the relationship between CLEC3B expression and protein expression, clinical staging, DNA methylation, and immune cell infiltration in pan-cancer. Furthermore, we evaluate the correlations between CLEC3B expression and tumor mutational burden (TMB), microsatellite instability (MSI), as well as various immune-related genes associated with checkpoints, immunomodulation, RNA modification, and tumor stemness. Finally, we investigate the biological functions of CLEC3B using GSEA. Our findings suggest that CLEC3B may influence immune responses by interacting with immune cell infiltration and signaling pathways such as Ca2+, MAPK, and autophagy in cancer, and it positively correlates with immune checkpoints, thus influencing immune response occurrence.
Material and Methods
Data Collection
The Human Protein Atlas (HPA) database (https://www.proteinatlas.org/) provides comprehensive protein expression data across normal tissues, cells, and tumor tissues via its tissue atlas, cell atlas, and pathology atlas.11 In this study, we examined the expression of CLEC3B mRNA in human tissues using data from HPA. We utilized the “ggplot2” R package to analyze CLEC3B expression across 33 types of normal tissues and cancers, integrating data from the Genotype-Tissue Expression (GTEx) and The Cancer Genome Atlas (TCGA), which acquired from UCSC Xena (http://xena.ucsc.edu/). Single-cell RNA sequencing (scRNA-seq) datasets for PAAD, including GSE197177, were obtained from GEO database (https://www.ncbi.nlm.nih.gov/geo/). Additionally, the UALCAN database (http://ualcan.path.uab.edu/analysis-prot.html) was utilized to explore protein expression and DNA methylation levels using data from the Clinical Proteomic Tumor Analysis Consortium (CPTAC) and TCGA, respectively. We specifically examined the “Total protein”, “Methylation”, and “TP53 mutation status” within the “expression” module of UALCAN to compare protein expression levels, methylation status, and expression profiles of CLEC3B between cancers and corresponding adjacent tissues. Statistical significance was determined using a P-value threshold of < 0.05, assessed by Students’t-test. Abbreviations and corresponding full names of various types of tumors were shown in Table S1.
Genomic Alterations Analysis
The cBioPortal web platform (https://www.cbioportal.org/) facilitates interactive exploration of various cancer genomics datasets.12 Genomic alteration frequency data for CLEC3B, including mutation, copy number amplification, deep deletion, and multiple alterations, were extracted from the TCGA database via this platform.
Survival and Prognosis Analysis
We investigated the correlation between CLEC3B expression and patient prognosis, focusing on OS. A forest plot was employed to visualize Hazard Ratio (HR) and associated P-values across different cancer types.
Correlation Between CLEC3B Expression and Immunity
TIMER online database (https://cistrome.shinyapps.io/timer/) was utilized to explore the correlation between CLEC3B expression and immune infiltration levels. Spearman correlation analysis was employed to generate heatmaps depicting the correlation between CLEC3B and immune genes related to checkpoints across various cancer types. The horizontal axis represents different cancer types, while the vertical axis represents different inhibitory and stimulatory markers. Correlation coefficients are depicted in different colors, with red indicating significant p-values (< 0.05). TMB is defined as the number of mutations per DNA megabases (Mb), which emerged for predicting immunotherapy response as a promising biomarker.13 MSI is any change in the length of a microsatellite caused by the insertion or deletion of a repeat unit in a tumor, and a new phenomenon of microsatellite alleles appears.14 We assessed TMB, MSI and their correlation with CLEC3B expression using Spearman correlation analysis. A lollipop map was generated to visualize the correlation coefficients between CLEC3B and TMB/MSI across different tumor types, with dot size representing the magnitude of correlation and red color indicating significant p-values.
Protein–Protein Interaction (PPI) Network Construction
The GeneMANIA prediction web platform (http://www.genemania.org) was utilized to construct the PPI network for CLEC3B in this study.15 The platform integrates various types of association data, including physical interactions, co-expression, predicted interactions, co-localization, genetic interactions, pathway data, and shared protein domains.
GSEA Analysis
GSEA was employed to explore biological signaling pathways by comparing high and low expression groups based on the median level of CLEC3B expression. Four terms from Kyoto Encyclopedia of Genes and Genomes (KEGG) were analyzed and presented.
Correlation Between CLEC3B Expression and Genes of Immunomodulatory, RNA Modification and Tumor Stemness
The correlation between CLEC3B expression and genes associated with immunomodulation, RNA modification, and tumor stemness was investigated using the “pan-cancer analysis” module within the SangerBox online tool (http://vip.sangerbox.com/login.html), leveraging TCGA data.
Cell Culture and Real-Time Quantitative PCR (qPCR)
Normal human pancreatic ductal epithelial cells (hTERT-HPNE) and two pancreatic cancer cell lines (MIA PaCa-2, BXPC-3 and CFPAC-1) were obtained from the Cell Bank of Type Culture Collection of the Chinese Academy of Sciences (Shanghai, China). Cells were cultured under specified conditions, and total RNA was extracted using the Fastgen 200 RNA isolation kit. Reverse transcription into cDNA was performed using the Prime Script RT reagent kit, followed by RT-qPCR using the CFX Manager 2.1 system. GAPDH served as an internal control. All primers used are listed below: CLEC3B, 5’-GCCTCTTCTCCCTCCTGAC-3’ (forward) and 5’-ATCTTTGTGTTCACAACATCTTTCT-3’ (reverse); GAPDH, 5’-TCGTCCCGTAGACAAAATGG-3’ (forward) and 5’-TTGAGGTCAATGAGGGGGTC-3’ (reverse).
Western Blotting and Cell Transfection
The Western blotting experimental procedure is as described in previous studies.16 The following antibodies and ladders were used: anti-CLEC3B (#R25891, zenbio), anti-β-actin (#AC038, ABclonal) and Epizyme Biotech (WJ102). Human CLEC3B siRNA sequences were synthesized by MIAOLING BIOLOGY. Transient transfection of pancreatic cancer cells was conducted using Lipo8000 and DMEM, following the manufacturer’s instructions. After 48 h’s transduction, cells were harvested for further experiments.
Invasion, Migration and CCK-8 Experiment
For the transwell migration assay, cells suspended in 200 μL serum-free DMEM were seeded into the upper chambers of transwell plates (8 μm pore polycarbonate membrane). For Matrigel-coated invasion assays, 8×10⁴ cells in 200 μL serum-free DMEM were plated in the upper chambers 4 hours post-Matrigel coating. In both assays, the lower chambers were supplemented with 700 μL DMEM containing 20% FBS as a chemoattractant. Following incubation, cells were fixed, stained, and imaged using an upright microscope. Image analysis was performed by Image J. MIA PaCa-2 cells, infected with si-CLEC3B or si-NC, were inoculated into 96-well culture plates (1×10³ cells per well). Then, 200 μL complete medium was added to each well. Each well was added with 10 μL CCK-8 reagent at 0 h, 24 h, 48 h and 72 h, respectively, and incubated at 37°C for 2 h. Finally, the absorbance at 450 nm wavelength was measured according to the CCK-8 kit instruction manual (WLA074, China).
Isolation and Validation of Exosomes
The specific process of isolating exosomes is shown in previous studies. In brief, dead cells and cell debris were removed by centrifugation at 300g, 2000g, and 1000g, respectively, and exosomes were separated by ultracentrifugation at 110000g. The final precipitate was resuspended in pre cooled PBS and stored at 4°C or −80°C for later use. Extracellular vesicles were suspended in PBS and dripped on carbon-coated grids. And then, the grid was air-dried and images were captured using a transmission electron microscopy (TEM) device at 80 kV for TEM analysis. In addition, NanoSight NS300 device was used to assess the size of extracellular vesicles. For identification of surface markers, lysed extracellular vesicles were subjected to immunoblotting using anti-TSG101 (#612696, BD Biosciences), anti-CD63 (#25682-1-AP, Proteintech) and anti-CLEC3B (#R25891, zenbio).
Statistical Analysis
The expression level of CLEC3B in cancer compared to normal tissues was assessed using Student’s t-tests. The HR and p-value were determined through univariate Cox regression analysis. Kaplan-Meier analysis was employed to examine patients’ survival time based on CLEC3B expression levels. Spearman correlation was utilized to evaluate the associations between CLEC3B expression and immune infiltration. GSEA was performed using R software (version 4.1.1) with packages including ggplot2, org.Hs.eg.db, clusterProfiler, DOSE, and enrichplot. Experimental data analysis and figure generation were conducted using GraphPad Prism 8.0. A significance threshold of p < 0.05 was established for all statistical analyses.
Results
Expression Patterns and Clinical Associations of CLEC3B
A CLEC3B demonstrates downregulation in pan-cancer and late-stage malignancies. In the HPA database (Figure 1A), elevated CLEC3B expression is observed in non-cancerous tissues compared to other cancer tissues. To elucidate the correlation between CLEC3B expression and cancers, we conducted differential expression analysis using data from TCGA and GTEx database via SangerBox online tool. Decreased CLEC3B expression is consistently found in tumor tissues across various cancer types (Figure 1B). Protein expression analysis from CPTAC database further confirms significant downregulation of CLEC3B in breast, colon, ovarian, clear renal cell carcinoma (RCC), lung adenocarcinoma, and uterine corpus endometrial carcinoma (UCEC) (Figure 1C). Additionally, CLEC3B expression exhibits significant upregulation in tumors with TP53 mutations in numerous cancer types (Figure S1A). Furthermore, CLEC3B downregulation correlates with advanced pathological stages in several cancers (Figure S1B).
 |
Figure 1 CLEC3B downregulated in pan-cancer setting and non-cancerous tissues. (A) Expression profile for CLEC3B mRNA in human different tissues displayed by HPA. (B) Expression profile for CLEC3B based on TCGA and GTEx database. (C) The protein expression of CLEC3B in UALCAN database. **p<0.01, ****p<0.001, ns p>0.05. |
Prognostic Significance of CLEC3B
Immunohistochemistry results showed that compared with normal tissues, CLEC3B expression in cancer tissues was much lower (Figure 2A). Positive rate results showed that few colorectal, breast, endometrial, lung, testicular, stomach and liver cancers showed moderate cytoplasmic positivity. Other cancers were generally negative (Figure 2B). A univariate Cox regression model was utilized to examine the correlation between CLEC3B expression and OS as well as DFS across various cancer types. The findings of the Cox regression analysis across multiple cancers revealed a significant correlation between CLEC3B expression and OS in ten cancer types, including GBMLGG, KIRC, LIHC, PAAD, LGG, CESC, HNSC, LUAD, KIPAN, and KICH (Figure 2C). Overall, these results underscore the potential of CLEC3B as a novel prognostic biomarker.
 |
Figure 2 CLEC3B expression and prognosis in pan-cancer. (A) The immunohistochemical staining of CLEC3B in UALCAN database. (B) Immunohistochemistry positivity rate of CLEC3B in pan-cancer. (C) A forest plot of OS of CLEC3B in pan-cancer. The text highlighted in red in the chart refers to the data of cancer types with P<0.05. |
Epigenetic Modifications and Genetic Alterations of CLEC3B
As an epigenetic mechanism, DNA methylation significantly influences tumorigenesis and progression by regulating gene expression.17 To explore the DNA methylation status of CLEC3B, we utilized UALCAN and TCGA datasets. Our analysis revealed an increase in methylation levels of CLEC3B across various cancers including BRCA, COAD, ESCA, HNSC, LUAD, LUSC, and READ, while a decrease was observed in KIRC, LIHC, PAAD, and TGCT (Figure 3). Our findings revealed that, compared to normal cells, DNA methyltransferase DNMT1 was significantly upregulated in pancreatic cancer cells (Figure S2A). In contrast, CLEC3B expression was downregulated in pancreatic cancer cells, and a negative correlation was observed between the two. Following knockdown of DNMT1, CLEC3B expression was markedly upregulated in the pancreatic cancer cell line PANC-1 (Figure S2B and S2C).
 |
Figure 3 The level of CLEC3B DNA methylation in pan-cancer compared with that in normal tissues using the UALCAN database. |
Pan-cancer alterations of CLEC3B were assessed using the “TCGA PanCancer Atlas Studies” module within the cBioPortal database. The analysis revealed the highest alteration frequency of CLEC3B, approximately 4%, among patients with DLBC. Notably, deep deletion emerged as the most prevalent alteration type across various genetic alterations (Figure 4A). We identified 39 mutation sites within CLEC3B spanning amino acids 0 to 202, with AA Change: R151H/C and D166E/N/Y being the most common mutation modes (Figure 4B). Additionally, we investigated the mutation landscape of UCEC and UVM, yet found no discernible difference between high and low expression of CLEC3B and the expression of other highly mutated genes (Figure 4C).
 |
Figure 4 The mutation features of CLEC3B in pan-cancer. (A) The alteration frequency of CLEC3B in pan-cancer was evaluated by cBioPortal database. (B) Mutation diagram of CLEC3B in different cancer types across protein domains from cBioPortal database. (C) Oncoplot displaying the somatic landscape of UCEC and UVM. |
PPI Network and Functional Enrichment Analysis of CLEC3B
Subsequently, the GeneMANIA online tool was employed to elucidate the potential mechanisms through which CLEC3B participates as a putative tumor suppressor in cancers by constructing a PPI network, as depicted in Figure 5B. This network revealed robust physical interactions between CLEC3B and Plasminogen (PLG), a key mediator implicated in macrophage recruitment,18,19 inflammation and fibrinolysis.20 Among the top 100 genes exhibiting the strongest correlations with CLEC3B in GEPIA, notable candidates included TNXB, RP11-855A2.5, RP11-467I17.1, SCARA5, CD248, RNASE1, and GRK5, as illustrated in Figure 5A. By intersecting the 20 genes identified by GeneMANIA with the top 100 genes from GEPIA, RNASE1 and GRK5 were selected for further analysis (Figure 5C). Furthermore, GSEA was conducted to discern the functional enrichment associated with CLEC3B expression. KEGG enrichment analysis revealed that heightened expression of CLEC3B was primarily associated with cell adhesion pathway, calcium signaling pathway and focal adhesion signaling pathway (Figure 5D). Further immunofluorescence co-localization assays confirmed the interaction between CLEC3B and GRK5, suggesting that this binding may exert tumor-suppressive effects by modulating protein stability (Figure S3).
 |
Figure 5 PPI Network of CLEC3B in pan-cancer. (A) We selected the top five of the 100 genes with the strongest correlation with CLEC3B in GEPIA including TNXB, RP11-855A2.5, RP11-467I17.1, SCARA5 and CD248 and analyzed the expression correlation in pan-cancer. (B) The PPI network of CLEC3B was constructed in GeneMANIA. (C) An intersection analysis of CLEC3B-binding and correlated genes was conducted. (D) GSEA was performed to identify the functional enrichment of CLEC3B expression. |
The Relationship Between CLEC3B Expression and Immune Cell Infiltration Across Pan-Cancer
TIMER2 database was employed to assess the relationship between CLEC3B expression, prognosis, and immune cell infiltration. Results revealed a negative correlation between CLEC3B expression and infiltration of B cells, CD4+ T cells, macrophages, neutrophils, and dendritic cells in LGG. Elevated levels of these immune cells were associated with poorer prognosis (Figure 6A). Furthermore, in HNSC and LUAD, the infiltration level of B cells positively correlated with CLEC3B expression and was associated with a favorable prognosis (Figure 6B and C). Conversely, in STAD, high CLEC3B expression potentially increased macrophage infiltration, leading to reduced patient survival time (Figure 6D). Additionally, using the TISIDB online database, the immune and molecular subtypes of CLEC3B across pan-cancer were evaluated, indicating that the C3 subtype (inflammatory) predominated across various cancer types, aligning with previous findings,21 and suggesting a better prognosis in LUAD, STAD, and LIHC (Figure S4).
 |
Figure 6 The relationship among CLEC3B expression, prognosis and immune cells infiltration of (A) LGG, (B) HNSC, (C) LUAD and (D) STAD. |
The Correlation Between CLEC3B Expression and Immune Checkpoint, TMB, and MSI Across Pan-Cancer
The surveillance function of the immune system through immune checkpoints is intricately linked to the survival and prognosis of cancer patients. In this study, we conducted a comprehensive investigation into the associations between CLEC3B expression and immunoinhibitor and immunostimulator gene expression using a pan-cancer dataset (Figure 7A and B). Notably, we observed a positive correlation between CLEC3B expression and most immunoinhibitor and immunostimulator genes in ACC, COAD, LUSC, OV, SARC and UCS. Conversely, in KICH, KIRC and THCA, CLEC3B demonstrated a negative correlation with most checkpoint genes. These findings underscore the potential role of CLEC3B expression in immune activation across various cancers.
 |
Figure 7 Correlation between the CLEC3B gene expression and (A) Immunoinhibitor genes, (B) Immunostimulator genes. (C) TMB and (D) MSI in pan-cancer. |
Moreover, we assessed the correlation between CLEC3B expression and immunotherapy response using two immune-related biomarkers: TMB and MSI. In several tumors, including GBM/LGG, LGG, CESC, LUAD, COAD, COADREAD, LAML, BRCA, STES, KIPAN, STAD, PRAD, HNSC, LUSC, LIHC, THCA, READ, PAAD, SKCM, BLCA, and DLBC, CLEC3B expression exhibited a negative correlation with TMB (Figure 7C). Furthermore, we investigated the correlation between CLEC3B expression and MSI across different cancer types. Negative correlations were observed in STES, STAD, LUSC, LIHC, and OV, while a positive correlation was noted in GBM/LGG (Figure 7D).
The Correlation Between CLEC3B Expression and Genes of Immunomodulatory, RNA Modification and Tumor Stemness
The pan-cancer analysis reveals five distinct immune pathways, including chemokine and MHC gene markers. Across various tumors, the expression level of CLEC3B demonstrates a positive correlation with immunomodulatory genes, notably observed in ACC, KIRP, SARC and TGCT. Conversely, a negative correlation is evident in THCA and KIRC (Figure 8A). Furthermore, Figure 8B illustrates the relationship between CLEC3B and MHC gene markers. While ACC, KIRP, LUSC, OV, SARC, SKCM, TGCT, UCEC, UCS and UVM exhibit significant positive correlations, a different trend is observed in KICH, KIRC and THCA.
 |
Figure 8 Correlation between the CLEC3B Expression and Genes of (A) Chemokine, (B) MHC and (C) DNAss genes. |
Additionally, we explored the correlation between CLEC3B expression and DNA stemness scores (DNAss), calculated based on pan-tumor methylation characteristics. The results indicate significant correlations with 24 tumors; among them, four tumors show significant positive correlations, including KIRP, KIPAN, KIRC, and MESO, while 20 tumors exhibit significant negative correlations. These include GBMLGG, LGG, CESC, LUAD, COAD, BRCA, ESCA, STES, SARC, STAD, HNSC, LUSC, LIHC, THCA, PAAD, TGCT, PCPG, SKCM, BLCA, and DLBC (Figure 8C).
Validation of the Expression and Function of CLEC3B in PAAD and Exosomes
Subsequently, the expression and functionality of CLEC3B were investigated utilizing GEO datasets. Consistent with prior findings (Figure 1B), CLEC3B expression was observed to be diminished in multiple cancers compared with normal or adjacent tissues (Figure 9A). Additionally, the expression of CLEC3B in tumor tissues was lower than that in adjacent normal tissues in GSE62452 and GSE28735 datasets of PAAD (Figure 9B). Kaplan–Meier survival analysis revealed that high CLEC3B expression independently influenced the prognosis of PAAD patients (Figure 9C, Figure S5). And then, qPCR was utilized to explore the expression of CLEC3B in PAAD cells. The results showed that CLEC3B expression was downregulated in HPNE than that in MIA PaCa-2, BXPC-3 and CFPAC-1 (Figure 9D). Subsequently, we validated the knockdown efficiency of CLEC3B in BXPC-3 cells, and qPCR and Western blotting results confirmed that the knockdown effect of sequence 1 (#1) was more significant (Figure 9E and F). CCK-8 assay results demonstrated that knockdown CLEC3B significantly increases the proliferation of pancreatic cancer cells (Figure 9G). Invasion and migration assay results demonstrated that the migratory capacity of BXPC-3 cells was enhanced in the CLEC3B-siRNA group compared to the CLEC3B-siNC group (Figure 10A). Finally, single-cell sequencing of normal pancreatic tissue (ZC), primary (YF), and metastatic PDAC (ZY) samples were visualized using UMAP and categorized by disease status (Figure 10B). Violin plot visualization of CLEC3B expression levels revealed enrichment primarily in endothelial cells (Figure 10C). The expression levels of CLEC3B in HUVEC cells treated with BXPC-3 CM (TEC) were significantly higher than those in wild-type HUVEC cells (Figure 10D), consistent with the findings in Figure 10C. Finally, we explored the location of CLEC3B in cell and found that CLEC3B mainly functions as a secreted protein (Figure 10E). Furthermore, we further isolated and characterized the exosomes of pancreatic cancer (Figure 10F and G). At the same time, it was found that CLEC3B was highly expressed in its extracellular vesicles (Figure 10H). The above results confirm that CLEC3B, as a tumor suppressor gene for various tumors, may exert its effects through secretion to the extracellular environment.
 |
Figure 9 Validation of the Expression and Function of CLEC3B in multiple cancers. (A) The expression of CLEC3B was downregulated in diverse GEO datasets. (B) The expression of CLEC3B was downregulated in tumor than that in adjacent tissue in PAAD. (C) Kaplan–Meier survival curves revealed that high expression of CLEC3B was independent factors affecting the prognosis of PAAD patients. (D) The expression of CLEC3B was downregulated in PAAD cells than that in HPNE. (E) RT-qPCR validation of knockdown efficiency of pancreatic cancer cell line CLEC3B. (F) Western blotting validation of knockdown efficiency of pancreatic cancer cell line CLEC3B. (G) Detection of proliferation ability of pancreatic cancer cells after knockdown of CLEC3B. *p<0.05, **p<0.01, ***p<0.001, ****p<0.0001. |
 |
Figure 10 Validation of the Expression of CLEC3B in PAAD exosome. (A) Invasion and migration assay indicated that the migration ability of PANC-1 cells was enhanced in the CLEC3B-siRNA group compared with the CLEC3B-siNC group. (B) Normal pancreatic tissue (ZC), primary (YF) and metastatic PDAC (ZY) samples were visualized by UMAP grouped by disease status. (C) Violin plot visualization of expression levels of CLEC3B in normal pancreatic tissue (ZC), primary (YF) and metastatic PDAC (ZY) cancer cells. (D) The expression levels of CLEC3B in HUVEC and CM treated HUVEC (TEC). (E) Expression of CLEC3B protein inside and outside cells. (F) Electron microscopy image of from MIA PaCa-2 cells with a scale of 100 nm. (G) NTA particle size analysis of extracted. (H) Expression of CD63, TSG101 and CLEC3B in pancreatic cancer cells and extracellular vesicles. *p<0.05, **p<0.01. |
Discussion
The heightened prevalence and fatality rates of cancer on a global scale represent a substantial threat to human health. Tumors commonly exhibit poor responsiveness to treatment during advanced stages, underscoring the critical importance of early tumor detection and intervention.22 Pan-cancer analysis has emerged as a promising approach to uncovering the expression patterns and functional roles of specific genes across diverse cancer types, potentially facilitating early detection and prevention strategies.23,24 Numerous studies focusing on pan-cancer analysis are underway to elucidate gene expression variations among different cancers and propose effective clinical interventions.25–28
CLEC3B, the gene encoding tetranectin involved in extracellular proteolysis, has garnered attention for its significant impact on multiple cancers.6,7,29,30 This study extensively explored the expression patterns of CLEC3B across various cancer types. Our analysis of pan-cancer datasets revealed a consistent downregulation of CLEC3B expression, which correlated with adverse clinical outcomes such as inferior overall survival, disease-free survival, and clinical stage in multiple cancers, highlighting its considerable clinical relevance. Furthermore, CLEC3B expression exhibited a significant positive correlation with immune cell infiltration and immune checkpoint markers across diverse cancers.
DNA methylation, a pivotal epigenetic modification, primarily involves the addition of a methyl group to the fifth carbon of cytosine residues within CpG dinucleotides, predominantly occurring in gene promoter regions. This modification exerts a suppressive effect on gene expression through multiple mechanisms.31 DNA methylation was found to be elevated in the promoter region of CLEC3B in several tumor types compared to adjacent normal tissues, consistent with its downregulation, which modulates its interactions with immune-related factors and chemokines. Investigation of genetic alterations in CLEC3B across multiple cancers identified deep deletion as the most prevalent alteration, suggesting a need for further exploration of its underlying mechanisms. While previous studies have associated CLEC3B missense variant p.S106G with longevity,32 its role in tumors remains unexplored. Our analysis identified R151H/C and D166E/N/Y as specific mutation sites in CLEC3B across various cancers, warranting further investigation of their functional implications.
Recent studies have highlighted the involvement of CLEC3B in tumor immune infiltration.9,33–36 Our results showed that CLEC3B was positively correlated with most part of immune cells and immune checkpoint markers. It shows that CLEC3B can promote immune cell infiltration and has a good ability to respond to immune checkpoint inhibitors, which provides a new strategy for clinical treatment. Experiments in-depth about the mechanism between CLEC3B and immune infiltration requires further exploration.
PPI analysis showed that CLEC3B is significantly correlated with PLG, which participate in macrophage recruitment, inflammation and fibrinolysis. In addition, the 100 genes with the strongest correlation with CLEC3B that we searched from GEPIA are also consistent with this result. GSEA analysis showed that high expression of CLEC3B was mainly associated with cell adhesion pathway, calcium signaling pathway and focal adhesion signaling pathway. Emerging studies proved that CLEC3B protected H9c2 cardiomyocytes from apoptosis via PI3K/Akt pathway.37 CLEC3B located in exosome regulated metastasis and angiogenesis via AMPK and VEGF signals in hepatocellular carcinoma.7 At last, the markers of immunomodulatory, RNA modification and tumor stemness have a positive relationship with CLEC3B expression, which further proves that this interaction existing in CLEC3B expression and TIME (tumor immune microenvironment).
GEO datasets and qPCR assay verified that CLEC3B was lower in diverse cancers than that in normal tissues and cells. In addition, knockdown of CLEC3B promotes the proliferation and migration of pancreatic cancer cells, which confirms that CLEC3B, as a tumor suppressor gene, participates in the malignant behavior of pancreatic cancer. The protein localization of CLEC3B revealed that it can act as a secreted protein and circulate in the body through exosomes, which is consistent with previous research results. The above results confirm that CLEC3B can serve as a novel tumor suppressor as an inhibitor of tumor progression. However, there are also shortcomings in this study, and further exploration is needed to determine the specific molecular mechanism of action of CLEC3B.
Conclusion
In summary, we integrated multi-omics analysis of CLEC3B. Studies have found that CLEC3B can be used as an effective target to predict immune infiltration and immunotherapy. In addition, CLEC3B inhibited the proliferation, invasion and migration of pancreatic cancer and was expressed in the corresponding exosomes, which may be involved in the regulation of immune infiltration through secretion.
Data Sharing Statement
PAAD RNA-seq dataset and Genotype-Tissue Expression project (GTEx) data used in this study are available via the UCSC Xena (http://xena.ucsc.edu/) and GEO datasets (https://www.ncbi.nlm.nih.gov/geo/); further inquiries can be directed to the corresponding author.
Ethics Statement
This study was approved by the Ethics Committee of the Xi’an Honghui Hospital.
Author Contributions
All authors made a significant contribution to the work reported, whether that is in the conception, study design, execution, acquisition of data, analysis and interpretation, or in all these areas; took part in drafting, revising or critically reviewing the article; gave final approval of the version to be published; have agreed on the journal to which the article has been submitted; and agree to be accountable for all aspects of the work.
Funding
This work was funded by Natural Science Basic Research Plan in Shaanxi Province of China (2024JC-YBQN-0896); Project of Xi’an Municipal Health Commission (2024qn11).
Disclosure
The authors declare no competing interests in this work.
References
1. Sung H, Ferlay J, Siegel RL. et al. Global cancer statistics 2020: GLOBOCAN estimates of incidence and mortality worldwide for 36 cancers in 185 countries. CA Cancer J Clin. 2021;71(3):209–249. doi:10.3322/caac.21660
2. Jung JH, Hwang J, Kim JH, et al. Phyotochemical candidates repurposing for cancer therapy and their molecular mechanisms. Semin Cancer Biol. 2021;68:164–174. doi:10.1016/j.semcancer.2019.12.009
3. Ho JE, Lyass A, Courchesne P, et al. Protein biomarkers of cardiovascular disease and mortality in the community. J Am Heart Assoc. 2018;7(14). doi:10.1161/JAHA.117.008108
4. Valdes AM. Involvement of the CLEC3B gene in osteoarthritis. Osteoarthritis Cartilage. 2011;19(2):249. doi:10.1016/j.joca.2010.09.012
5. Maguire PB, Parsons ME, Szklanna PB, et al. Comparative platelet releasate proteomic profiling of acute coronary syndrome versus stable coronary artery disease. Front Cardiovasc Med. 2020;7:101. doi:10.3389/fcvm.2020.00101
6. Zhu HF, Zhang XH, Gu CS, et al. Cancer-associated fibroblasts promote colorectal cancer progression by secreting CLEC3B. Cancer Biol Ther. 2019;20(7):967–978. doi:10.1080/15384047.2019.1591122
7. Dai W, Wang Y, Yang T, Wang J, Wu W, Gu J. Downregulation of exosomal CLEC3B in hepatocellular carcinoma promotes metastasis and angiogenesis via AMPK and VEGF signals. Cell Commun Signal. 2019;17(1):113. doi:10.1186/s12964-019-0423-6
8. Wang X, Li C, Chen T, et al. Identification and validation of a five-gene signature associated with overall survival in breast cancer patients. Front Oncol. 2021;11:660242. doi:10.3389/fonc.2021.660242
9. Zhou C, Li C, Peng S, Zhou L, Li H. Comprehensive analysis of the relationships between tumor mutation burden with immune infiltrates in cervical cell carcinoma. Front Mol Biosci. 2020;7:582911. doi:10.3389/fmolb.2020.582911
10. Peng H, Pan S, Yan Y, et al. Systemic proteome alterations linked to early stage pancreatic cancer in diabetic patients. Cancers. 2020;12(6):1534. doi:10.3390/cancers12061534
11. Fagerberg L, Hallstrom BM, Oksvold P, et al. Analysis of the human tissue-specific expression by genome-wide integration of transcriptomics and antibody-based proteomics. Mol Cell Proteomics. 2014;13(2):397–406. doi:10.1074/mcp.M113.035600
12. Cerami E, Gao J, Dogrusoz U, et al. The cBio cancer genomics portal: an open platform for exploring multidimensional cancer genomics data. Cancer Discov. 2012;2(5):401–404. doi:10.1158/2159-8290.CD-12-0095
13. Greillier L, Tomasini P, Barlesi F. The clinical utility of tumor mutational burden in non-small cell lung cancer. Transl Lung Cancer Res. 2018;7(6):639–646. doi:10.21037/tlcr.2018.10.08
14. Hause RJ, Pritchard CC, Shendure J, Salipante SJ. Classification and characterization of microsatellite instability across 18 cancer types. Nat Med. 2016;22(11):1342–1350. doi:10.1038/nm.4191
15. Warde-Farley D, Donaldson SL, Comes O, et al. The GeneMANIA prediction server: biological network integration for gene prioritization and predicting gene function. Nucleic Acids Res. 2010;38(Web Server issue):W214–220. doi:10.1093/nar/gkq537
16. Wang J, Guo T, Zhang X, et al. Comprehensive investigation in oncogenic functions and immunological roles of NCBP2 and its validation in prostate cancer. Transl Oncol. 2024;47:102049. doi:10.1016/j.tranon.2024.102049
17. Mehdi A, Rabbani SA. Role of methylation in pro- and anti-cancer immunity. Cancers. 2021;13(3):545. doi:10.3390/cancers13030545
18. Vago JP, Sugimoto MA, Lima KM, et al. Plasminogen and the plasminogen receptor, Plg-RKT, regulate macrophage phenotypic, and functional changes. Front Immunol. 2019;10:1458. doi:10.3389/fimmu.2019.01458
19. Miles LA, Lighvani S, Baik N, et al. New insights into the role of Plg-RKT in macrophage recruitment. Int Rev Cell Mol Biol. 2014;309:259–302.
20. Ny L, Parmer RJ, Shen Y, et al. The plasminogen receptor, Plg-RKT, plays a role in inflammation and fibrinolysis during cutaneous wound healing in mice. Cell Death Dis. 2020;11(12):1054. doi:10.1038/s41419-020-03230-1
21. Thorsson V, Gibbs DL, Brown SD, et al. The immune landscape of cancer. Immunity. 2018;48(4):812–830e814. doi:10.1016/j.immuni.2018.03.023
22. Siegel RL, Miller KD, Fuchs HE, Jemal A. Cancer statistics, 2021. CA Cancer J Clin. 2021;71(1):7–33. doi:10.3322/caac.21654
23. Meng Q, Que T, Yan T, et al. Prognostic implications and immune infiltration in the nod-like receptor signaling pathway: a comprehensive analysis across pan-cancer. iCell. 2024;1(1). doi:10.71373/ZAGA8611
24. Lin Y, Xu X, Liu Z, et al. Pan-cancer analysis for identification of tumor antigens and immune subtypes in mRNA vaccine development. iCell. 2024;1(1). doi:10.71373/FEHU5094
25. Nguyen L, J WMM, Van Hoeck A, Cuppen E. Pan-cancer landscape of homologous recombination deficiency. Nat Commun. 2020;11(1):5584. doi:10.1038/s41467-020-19406-4
26. Dohlman AB, Arguijo Mendoza D, Ding S, et al. The cancer microbiome atlas: a pan-cancer comparative analysis to distinguish tissue-resident microbiota from contaminants. Cell Host Microbe. 2021;29(2):281–298e285. doi:10.1016/j.chom.2020.12.001
27. Ma X, Liu Y, Liu Y, et al. Pan-cancer genome and transcriptome analyses of 1,699 paediatric leukaemias and solid tumours. Nature. 2018;555(7696):371–376. doi:10.1038/nature25795
28. Lin Y, Li J, Liang S, et al. Pan-cancer analysis reveals m6A variation and cell-specific regulatory network in different cancer types. Genomics Proteomics Bioinf. 2024;22(4). doi:10.1093/gpbjnl/qzae052.
29. Zhang J, Lou W. A key mRNA-miRNA-lncRNA competing endogenous RNA triple sub-network linked to diagnosis and prognosis of hepatocellular carcinoma. Front Oncol. 2020;10:340. doi:10.3389/fonc.2020.00340
30. Liu J, Liu Z, Liu Q, et al. CLEC3B is downregulated and inhibits proliferation in clear cell renal cell carcinoma. Oncol Rep. 2018;40(4):2023–2035. doi:10.3892/or.2018.6590
31. Esteller M. Epigenetics in cancer. N Engl J Med. 2008;358(11):1148–1159. doi:10.1056/NEJMra072067
32. Tanisawa K, Arai Y, Hirose N, et al. Exome-wide association study identifies CLEC3B missense variant p.S106G as being associated with extreme longevity in East Asian populations. J Gerontol a Biol Sci Med Sci. 2017;72(3):309–318. doi:10.1093/gerona/glw074
33. Sun J, Xie T, Jamal M, et al. CLEC3B as a potential diagnostic and prognostic biomarker in lung cancer and association with the immune microenvironment. Cancer Cell Int. 2020;20(1):106. doi:10.1186/s12935-020-01183-1
34. Xie XW, Jiang SS, Li X. CLEC3B as a potential prognostic biomarker in hepatocellular carcinoma. Front Mol Biosci. 2020;7:614034. doi:10.3389/fmolb.2020.614034
35. Liu Z, Sun D, Zhu Q, Liu X. The screening of immune-related biomarkers for prognosis of lung adenocarcinoma. Bioengineered. 2021;12(1):1273–1285. doi:10.1080/21655979.2021.1911211
36. Li P, Lin Z, Liu Q, et al. Enhancer RNA SLIT2 inhibits bone metastasis of breast cancer through regulating P38 MAPK/c-Fos signaling pathway. Front Oncol. 2021;11:743840. doi:10.3389/fonc.2021.743840
37. Lv F, Wang Z, Huang Y, Si A, Chen Y. CLEC3B protects H9c2 cardiomyocytes from apoptosis caused by hypoxia via the PI3K/Akt pathway. Braz J Med Biol Res. 2020;53(9):e9693. doi:10.1590/1414-431x20209693
 © 2025 The Author(s). This work is published and licensed by Dove Medical Press Limited. The
full terms of this license are available at https://www.dovepress.com/terms.php
and incorporate the Creative Commons Attribution
- Non Commercial (unported, 4.0) License.
By accessing the work you hereby accept the Terms. Non-commercial uses of the work are permitted
without any further permission from Dove Medical Press Limited, provided the work is properly
attributed. For permission for commercial use of this work, please see paragraphs 4.2 and 5 of our Terms.
© 2025 The Author(s). This work is published and licensed by Dove Medical Press Limited. The
full terms of this license are available at https://www.dovepress.com/terms.php
and incorporate the Creative Commons Attribution
- Non Commercial (unported, 4.0) License.
By accessing the work you hereby accept the Terms. Non-commercial uses of the work are permitted
without any further permission from Dove Medical Press Limited, provided the work is properly
attributed. For permission for commercial use of this work, please see paragraphs 4.2 and 5 of our Terms.
Recommended articles
Prognostic and Immunological Roles of Cell Cycle Regulator CDCA5 in Human Solid Tumors
He J, Zhou X, Wang X, Zhang Q, Zhang L, Wang T, Zhu W, Liu P, Zhu M
International Journal of General Medicine 2022, 15:8257-8274
Published Date: 21 November 2022
Overexpression of TREM1 is Associated with the Immune-Suppressive Microenvironment and Unfavorable Prognosis in Pan-Cancer
Zhou X, Lin K, Fu L, Liu F, Lin H, Chen Y, Zhuang B, Liang H, Deng Q, Wang Z, Chen W, Luo J, Cao J, Li P
Journal of Inflammation Research 2023, 16:1375-1391
Published Date: 27 March 2023
Leucyl and Cystinyl Aminopeptidase as a Prognostic-Related Biomarker in OV Correlating with Immune Infiltrates
Ma Q, Chang L, Wang W, Che L, Song X, Li G, Zhang Y, Chen Y, Gu Z, Ge X
Pharmacogenomics and Personalized Medicine 2023, 16:551-568
Published Date: 2 June 2023
Comprehensive Analysis of SLC35A2 in Pan-Cancer and Validation of Its Role in Breast Cancer
Sun X, Yuan Z, Zhang L, Ren M, Yang J, Xu Y, Hao J
Journal of Inflammation Research 2023, 16:3381-3398
Published Date: 11 August 2023
Role of Kinetochore Scaffold 1 (KNL1) in Tumorigenesis and Tumor Immune Microenvironment in Pan-Cancer: Bioinformatics Analyses and Validation of Expression
Ding Y, Wang K, Zhao S, Li Y, Qiu W, Zhu C, Wang Y, Dong C, Liu J, Lu Y, Qi W
International Journal of General Medicine 2023, 16:4883-4906
Published Date: 31 October 2023