")
Back to Journals » International Journal of Nanomedicine » Volume 19
Cold Exposure Alleviates T2DM Through Plasma-Derived Extracellular Vesicles
Authors Li FXZ, Xu F, Li CC, Lei LM, Shan SK, Zheng MH, Lin X, Guo B, Tang KX, Duan JY, Wu YY, Cao YC, Liu JJ, Yuan LQ
Received 26 October 2023
Accepted for publication 14 June 2024
Published 2 October 2024 Volume 2024:19 Pages 10077—10095
DOI https://doi.org/10.2147/IJN.S441847
Checked for plagiarism Yes
Review by Single anonymous peer review
Peer reviewer comments 2
Editor who approved publication: Prof. Dr. RDK Misra
Fu-Xing-Zi Li,1 Feng Xu,1 Chang-Chun Li,1 Li-Min Lei,1 Su-Kang Shan,1 Ming-Hui Zheng,1 Xiao Lin,2 Bei Guo,1 Ke-Xin Tang,1 Jia-Yue Duan,1 Yun-Yun Wu,1 Ye-Chi Cao,1 Jun-Jie Liu,3 Ling-Qing Yuan1
1Department of Metabolism and Endocrinology, National Clinical Research Center for Metabolic Disease, The Second Xiangya Hospital, Central South University, Changsha, Hunan, 410011, People’s Republic of China; 2Department of Radiology, The Second Xiangya Hospital, Central South University, Changsha, Hunan, 410011, People’s Republic of China; 3Department of Periodontal Division, Hunan Xiangya Stomatological Hospital, Central South University, Changsha, Hunan, 410008, People’s Republic of China
Correspondence: Ling-Qing Yuan, Department of Metabolism and Endocrinology, National Clinical Research Center for Metabolic Disease, The Second Xiangya Hospital, Central South University, Changsha, Hunan, 410011, People’s Republic of China, Email [email protected]
Purpose: Anecdotal reports have praised the benefits of cold exposure, exemplified by activities like winter swimming and cold water immersion. Cold exposure has garnered acclaim for its potential to confer benefits and potentially alleviate diabetes. We posited that systemic cold temperature (CT, 4– 8°C) likely influences the organism’s blood components through ambient temperature, prompting our investigation into the effects of chronic cold exposure on type 2 diabetic (T2DM) mice and our initial exploration of how cold exposure mitigates the incidence of T2DM.
Methods: The effects of CT (4– 8°C) or room temperature (RT, 22– 25°C) on T2DM mice were investigated. Mice blood and organ specimens were collected for fully automated biochemical testing, ELISA, HE staining, immunohistochemistry, and immunofluorescence. Glucose uptake was assessed using flow cytometry with 2-NBDG. Changes in potential signaling pathways such as protein kinase B (AKT), phosphorylated AKT (p-AKT), insulin receptor substrates 1 (IRS1), and phosphorylated IRS1 (p-IRS1) were evaluated by Western blot.
Results: CT or CT mice plasma-derived extracellular vesicles (CT-EVs) remarkably reduced blood glucose levels and improved insulin sensitivity in T2DM mice. This treatment enhanced glucose metabolism, systemic insulin sensitivity, and insulin secretion function while promoting glycogen accumulation in the liver and muscle. Additionally, CT-EVs treatment protected against the streptozocin (STZ)-induced destruction of islets in T2DM mice by inhibiting β-cell apoptosis. CT-EVs also shielded islets from destruction and increased the expression of p-IRS1 and p-AKT in adipocytes and hepatocytes. In vitro experiments further confirmed its pro-insulin sensitivity effect.
Conclusion: Our data indicate that cold exposure may have a potentially beneficial effect on the development of T2DM, mainly through the anti-diabetic effect of plasma-derived EVs released during cold stimulation. This phenomenon could significantly contribute to understanding the lower prevalence of diabetes in colder regions.
Keywords: cold exposure, plasma-derived extracellular vesicles, type 2 diabetes, insulin sensitivity, β‑cell destruction
Introduction
In cold environments, the human body undergoes a series of physiological reactions. However, due to individual variations in response to cold, there is currently no definitive conclusion. Mammals, as warm-blooded animals, adjust their energy metabolism pathways in response to changes in the external environment to maintain stable core body temperature.1 Core body temperature is maintained within a certain range to support normal life activities. Generally, the human core temperature is around 37°C, and when it drops to around 35°C or lower, hypothermia occurs. Decreased body temperature can impair the normal function of vital organs, including the brain and heart. However, moderate cold exposure can be beneficial, as exposure to mild cold may be a healthy and sustainable alternative method to increase energy expenditure.2 Some studies have reported the benefits of moderate cold exposure on the human body. The latest research this year had shown significant changes in signaling levels in young individuals following a 2 h exposure to low temperatures at 4–5°C; furthermore, changed in ω-6 and ω-3 fatty acids under cold stimulation are negatively correlated with obesity, blood sugar balance, lipid levels and liver function, contributing to further improvement in cardiac metabolic health.3 Cao et al proposed an anti-tumor “cold therapy”, where their research found that exposure to 4°C promotes glucose uptake in brown adipose tissue (BAT) and inhibits glucose uptake in tumor cells, thereby inhibiting their growth.4,5 Moderate cold exposure also has the effects of increasing insulin sensitivity,6 combating autoimmune diseases,7 anti-aging,8 weight loss,5,9 enhancing immune function7,10 and extending lifespan.11,12 Diabetes is an ancient chronic metabolic disease, but its prevalence has never been so high as it is at present.13,14 Overnutrition is one of the reasons, but the role of lifestyle change cannot be ignored.14 Today, we wear gorgeous clothes that can be decorated and keep us warm. However, due to the lack of materials, our ancestors only used a small number of clothes to keep out the cold and hide their shame. Does the cold environment play a role in the development of type 2 diabetes (T2DM)? This is a fascinating question that troubles us.
In the past few decades, cold exposure as a tool to reduce insulin resistance has aroused many scientific interests. The effects and mechanisms of cold exposure on metabolic response, diabetes and insulin resistance have been studied.5,15 Previous studies have shown that cold stimulation has beneficial effects on improving insulin sensitivity and the metabolism in human peripheral tissues.16,17 Some of them are explained as a non-insulin dependent pathway similar to exercise; cold exposure increases contractual activity in skeletal muscles, which results in an increase of glycolysis and glucose oxidation. Another explanation is that through the insulin-dependent pathway, which plays a decreasing blood glucose role by enhancing the sensitivity of peripheral tissue to insulin.18 However, a study conducted by Carlijn and others in 2021 indicates that cold stimulus failed to improve insulin sensitivity, postprandial blood glucose, fat metabolism, or liver lipid content. It only marginally affected overnight fasting fat oxidation, postprandial energy consumption, and aortic enlargement index.19 Generally, the frequency, intensity, duration, and nature of cold exposure yield varying impacts on the condition.6
Extracellular vesicles (EVs) are nanoscale bilayer membrane structures spontaneously secreted by living organisms, with sizes ranging from nanometers to micrometers. EVs derived from eukaryotic organisms are mainly divided into exosomes, microparticles/vesicles, and apoptotic bodies. Among them, exosomes have the most distinctive characteristics and are the most extensively and deeply studied. Exosomes, the smallest EVs with the size range of 30–150 nm in diameter, have a bilayer structure and saucer-like morphology.20 EVs are found in body fluids, including blood,21 saliva,22 urine,23 cerebrospinal fluid,24 and milk.25 Due to the limited purity achieved by current isolation techniques, the majority of studies on exosomes or other types of EVs typically only characterize them based on their size, morphology, and molecular markers without clearly defining their origin and identity. The International Society for Extracellular Vesicles (ISEV) recommends using EVs as the universal term. Therefore, in the subsequent discussion of exosomes or other EVs, this article will refer to them collectively as EVs.
Due to the unique functions of EVs, they demonstrate significant potential in the clinical treatment of diabetes. Studies have revealed that EVs sourced from various origins can exert paracrine effects on cells by transporting intracellular substances like cytokines, proteins, nucleic acids, etc. to specific target cells or tissues to participate in intercellular substance exchange.26–28 EVs also participate in intercellular information exchange by regulating gene expression and altering signaling pathways to improve pancreatic cell damage and insulin resistance in diabetes.29–31 EVs secreted by insulin-sensitive tissues such as brain, liver, fat and muscle can be transferred to other metabolic organs, immune cells and endothelial cells to maintain glucose homeostasis or regulate insulin resistance.32,33 EVs have the capacity to transport pertinent components from their parent cells, effectively reaching their intended targets, thus serving as an extension of cell therapy.34,35 Some EVs can even serve as carriers for delivering drugs to pancreatic cells.36 Studies have also shown that EVs therapy has significant advantages such as safety, low immunogenicity, good biocompatibility, and high bioavailability.37–39 These studies indicate that EVs play an important role in T2DM.
Some studies have reported the relationship between cold exposure and EVs. Xu et al found that cold and warm stimuli induce depletion of the RNA EVs complex in the nucleoli but enrich it in the nucleoplasm.40 Another study conducted on rodents illustrated the occurrence of MTHFD1L-containing EVs in rat blood following the activation of brown adipose tissue (BAT) due to cold exposure.41 The research conducted by Okamatsu Ogura and others found that the miRNA composition in electric vehicles underwent changes after 2 h of cold exposure.42 These findings imply that EVs actively participate in and regulate the body’s response to cold exposure.
This study aimed to investigate the effects of moderate and long-term sustained cold exposure on the glucose metabolism of mice, as well as to uncover new mechanisms underlying the anti-diabetic effect of cold exposure.
Materials and Methods
Animal Care and Use
Five-week-old C57BL/6J male wide-type (WT) mice were purchased from Hunan SJA Laboratory Animal Co., LTD (Changsha, China). After 1-week adaptation, mice were divided into two groups: RT group and CT group (n = 6, 3 mice/cage). For RT group, mice were maintained at 22–25°C; for CT group, mice were exposed to cold exposure at 4–8°C until they were sacrificed. Mice fed with a high-fat diet (HFD, 60% fat calories, 20% protein calories, and 20% carbohydrate calories; 12492; Research Diets) for 6 weeks. After being fasted for 12 h with free access to water, streptozocin (STZ, V900890; Sigma, freshly dissolved in a 0.1 M phosphate-citrate buffer, pH 4.5) was intraperitoneally injected at a dose of 35 mg/kg STZ once every 2 days for 10 times in total. STZ-treated mice were subjected to another 3 days of HFD before blood glucose testing, followed by a 12 h fast. Mice with blood glucose levels exceeding 16.7 mmol/L, regardless if the mice were fasted or re-fed, were considered to be T2DM mice.43,44 The mice were fed with HFD before becoming T2DM models, and then they were fed with normal chow diet (NCD). Acclimatized animals were allocated to experimental groups based on their body weights and blood glucose levels to ensure equal starting points.
Mice Plasma Collection and Administration
PBS/CT plasma/CT-EVsfree plasma isolated from received 4–8°C cold exposed for 6 weeks mice, then T2DM mice were systemically treated with PBS/CT plasma/CT-EVsfree plasma (100 μL/injection) via tail intravenous injection 16 times over 48 days.45 Preparation method of CT-EVsfree plasma: dilute the plasma with PBS in a ratio of 1:5 and then ultracentrifuged 100,000 g for 18 h to collect the supernatant. After centrifugation, the EVs are concentrated at the bottom of the test tube, about 80% of the upper plasma is absorbed, 0.22 μm filter filtered, centrifuged at 4,000 ×g to approximately the initial plasma volume by ultrafiltration in a 15 mL Amicon Ultra-15 Centrifugal Filter Unit (Millipore). Then packed into −80°C for storage before use.
Plasma-Derived EVs Preparation and Uptake Assay
The blood samples from CT mice raised at 4–8°C for 6 weeks or RT mice at 22–25°C for 6 weeks (about 1–1.5 mL/mouse) were collected in EDTA-coated tubes and then were centrifuged for 20 min at 3,000 × g. The plasma was collected and centrifuged at 3,000 × g for 20 min to remove dead cells and cellular debris again. After centrifugation at 10,000 × g for 30 min, remove the bottom sediment and collect the plasma supernatant. Then, the 2 mL plasma was diluted with 10 mL PBS and ultracentrifuged at 100,000 × g for 2 h to pellet the EVs, which were then washed in a large volume of PBS and ultra-centrifuged again at the same high speed for 2 h. The supernatant was removed and the precipitate was fully resuspended with a small amount of PBS. Generally, the vesicles produced by 12 mL plasma were resuspended in 600 μL PBS. The resuspended solution was filtered through a 0.22 μm filter (Millipore, Billerica, USA). All centrifugations were performed at 4°C. The EVs pellet was resuspended in sterile PBS and stored at −80°C until use. The characteristics of EVs were identified by marker proteins (CD9, CD81, and TSG101), transmission electron microscopy (TEM, H-7650, Hitachi, Tokyo, Japan) and nanoparticle tracking analysis (NTA; ZetaView PMX 110, Particle Metrix, Germany) as previously reported.20,46–49 To monitor EVs uptake, EVs were labeled with PKH26 red fluorescent dye using the PKH26 fluorescent cell linker kit (Sigma). After PKH26 staining, the EVs were washed in PBS and collected by ultracentrifugation (100,000 × g for 70 min) at 4°C. Finally, PKH26-labeled EVs were resuspended in PBS. Next, EVs were incubated with cells at 37°C for 3 h. Cells were then washed with PBS and fixed with 4% paraformaldehyde (PFA) for 15 min.46,50 After washing with PBS, nuclei were stained with 0.5 µg/mL DAPI (C0065; Solarbia, Beijing, China). The signals were analyzed with a fluorescence microscope (Nikon Instruments Korea, Seoul, Korea).
CT-EVs and Insulin Administration
We isolated mice plasma-derived EVs raised at room temperature (RT-EVs) for 6 weeks or at cold temperature (CT-EVs) for 6 weeks by ultracentrifugation. T2DM mice were divided into five groups (n = 6/group): PBS, RT-EVs, CT-EVs, Insulin, and CT-EVs+Insulin. About 400 μg of RT-EVs/CT-EVs or an equal volume of PBS by intravenous injection (100 μL per mouse). CT-EVs were injected starting on the day of the first STZ injection and once every 3 days until mice were sacrificed. The two groups of mice with insulin intervention were intraperitoneal injection insulin (2 IU/kg/day; Gan&Lee, China) every day from the day when the blood glucose was greater than 16.7 mmol/L. CT-EVs+Insulin mice were administered CT-EVs (400 μg in 100 μL PBS) every 3 days and also given 2 IU/kg/day of insulin.
Metabolic Experiments
After the last injection of CT-EVs, glucose tolerance tests (OGTTs), serum insulin levels, insulin tolerance tests (ITTs), insulin releasing tests (IRTs), and insulin resistance index (HOMA-IR) were measured. Blood was collected from capillaries in the tail of mice and blood glucose levels were measured by a blood glucose meter (GA-3; Sinocare, China). For OGTTs, mice were given glucose (2 g/kg bw) intragastric after 12 h of nocturnal fasting, and blood glucose levels were measured at 0, 30, 60, 90, and 120 min after administration. For ITTs, mice were fasted for 6 h, followed by intraperitoneal insulin injection (0.75 IU/kg bw), and blood glucose levels were measured at 0, 15, 30, 45, 60, 90, and 120 min. For IRTs, mice were given glucose (2 g/kg bw) in an empty stomach for 8–12 h, then serum insulin levels were measured at 0, 30, 60, 90, 120, and 180 min after administration. Serum insulin levels were measured by mouse enzyme-linked immunosorbent assay (ELISA, E-EL-M1382c; Elabscience Biotechnology Co., Ltd, Wuhan, China). HOMA-IR index = Fasting blood glucose (FPG, mmol/L) × fasting insulin (FINS, μU/mL)/22.5. Before the mice were sacrificed, mice were starved for 12 h, and serum AST, ALT, TC, TG, BUN, and CREA were detected in an automatic biochemical analyzer (Chemray 240/800; Shenzhen Radu Life Technology, China).
In vivo Insulin-Stimulated AKT Phosphorylation Assay
In vivo insulin-stimulated AKT phosphorylation assay, 0.75 IU/kg recombinant insulin glargine was intraperitoneally injected into mice, the mice parts of the liver, skeletal muscle, and white adipose tissue (WAT) were collected at 3 min, 7 min and 10 min, respectively. These insulin target tissues were rapidly removed and frozen in liquid nitrogen before measuring the phosphorylation state of AKT.51
Cell Culture
Dulbecco’s modified Eagle’s medium (Gibco, Grand Island, USA) supplemented with 10% fetal bovine serum (FBS; Gibco, USA) and 100 μg/mL Penicillin–Streptomycin (PS; P1400; Solarbio, Beijing, China) was used to culture 3T3-L1 cells (Procell, Wuhan, China) with 4 to 10 passages, at 37°C in a 5% CO2 incubator. Sufficiently confluent (100%) cells were maintained in a differentiation induction medium consisting of 10 μg/mL of insulin (11061–68-0; Sigma), 1 μM dexamethasone (D4902; Sigma), 0.5 mM 3-isobutyl-1-methylxanthine (I5879; Sigma) and 1 mM rosiglitazone in DMEM for 3 days, followed by culture in maturation medium consisting of 10% FBS, 10 μg/mL of insulin and 1 mM rosiglitazone in DMEM was changed every 2 days. The induction was continued for 8–12 days, and the normal cell experiment was carried out when 90% lipid droplets appeared. L6 myoblasts was purchased from the Procell Life Science&Technology Co., Ltd. and maintained in a high glucose DMEM supplemented with 10% FBS at 37°C with 5% CO2. L6 myoblasts induced to differentiate into myotubes was achieved by culturing pre-confluent (80%) cells in differentiation media (2% FBS) for 7–14 days. The decrease of serum causes cells to fuse with cells and form myotubes. Primary hepatocytes were isolated from the mouse liver and the procedures were described in detail in the study published by Wei et al.51 Palmitic acid (PA)-induced insulin-resistant cell model. Three different kinds of cells were incubated with 0.25 mM PA (57–10-3; Sigma) for 24 h to establish an insulin-resistant cell model and washed three times by PBS and serum starved for 12 h. 400 μg/mL CT-EVs/RT-EVs (PBS as control) was added and incubated for 24 h. After being washed by ice-cold PBS three times, 100 nM insulin was added 30 min before being incubated with 100 μM 2-NBDG (N13195, Invitrogen, USA) for 1 h. Effect of cell uptake of 2-NBDG in different groups was detected by flow cytometry using a Becton Dickinson FACSscan (San Jose, CA, USA). Data were analyzed using Flowjo software.
In vitro Insulin/AKT Signaling Assay
3T3-L1 cells or primary hepatocytes were grown in a 6-well plate and differentiated as described above. For 3T3-L1 cells on the 12th day of differentiation, the complete medium was replaced by a basal serum-free medium (equal to 12 h of serum-free starvation). About 400 μg/mL CT-EVs or RT-EVs were added for 24 h and adipose cells or primary hepatocytes were treated with 0 or 100 nM insulin (Sigma) at 37°C for 30 min prior to protein lysis.
Western Blot
Lysates of cells or EVs were diluted at a ratio of 1:5 with protein loading buffer (Beyotime Biotechnology, Jiangsu, China) and heated at 95°C for 5 min. Protein extracts were separated by 8–12% SDS-PAGE and transferred to polyvinylidene fluoride membranes (Immobilon P, Millipore, USA). The membranes were blocked with 5% BSA in TBST (Tris-buffered saline, 10 mM Tris-HCl pH 7.5, 150 mM NaCl, 0.1% Tween-20) for 60 min at room temperature, incubated with primary antibodies at 4°C overnight and then incubated with the horseradish peroxidase-conjugated secondary antibodies at 37°C for 1 h. Primary antibodies and dilutions were used as follows: anti-CD9 (ab92726; Abcam, 1:2000), anti-CD81 (ab109201; Abcam, 1:1000), TSG101 (bs-1365R; Bioss, 1:500), t-AKT (60203-2-Ig; Proteintech, 1:5000), p-AKT (6444-1-Ig; Proteintech, 1:5000), t-IRS1 (ab52167; Abcam, 1:800) and p-IRS1 (ab1194; Abcam, 1:500). All the secondary antibodies (1:5000) were obtained from Proteintech. The immunoreactive bands were visualized with chemiluminescent assay using a chemiluminescence kit (RPN2232; Amersham Biosciences Ltd., UK) and then analyzed by Amersham Imager 600 (General Electric, USA) and Image-Pro Plus software (version 6.0 gra).
HE, IHC, IF and PAS Staining
The liver, pancreas, interscapular BAT (iBAT), inguinal subcutaneous and perigonadal visceral depots of the WAT (ingSAT and pgVAT, respectively) were fixed in 4% PFA, dehydrated with a series of graded ethanol, embedded in paraffin and then cut into 4 μm thick sections and stained with HE. For immunohistochemistry (IHC) staining, pancreatic sections were incubated with anti-insulin antibody (GB12334; Servicebio, 1:1000), followed by binding with HRP-conjugated secondary antibodies, and detected with a DAB Kit (DA1015; Solarbio, China) and counterstained with hematoxylin. Quantification was performed using ImageJ. For immunofluorescence (IF) staining, the pancreatic sections were permeabilized and blocked in PBS containing 5% BSA. Primary antibodies were incubated overnight at 4°C, followed by secondary antibody incubation at 37°C for 1 h. Anti-insulin antibody (GB12334; Servicebio, 1:1000) and anti-glucagon antibody (GB11097; Servicebio, 1:200) were used to detect β and α cells, respectively. Finally, the specimens were incubated with DAPI (C0065; Solarbia, Beijing, China) to stain nuclei. For periodic acid Schiff staining (PAS), use the PAS staining kit (G1280; Solarbio) to perform the procedure, referring to the manual user guide.
β Cell Mass
The pancreas was dissected in a standard way, weighed, frozen on dry ice, and continuously cut into 4 μm thick sections. The insulin secretion area and total section area of all islets were determined by dividing the pancreas into 9 sections from 3 parts. β-cell mass (mg) was calculated by multiplying the area of insulin-positive cells/total pancreatic area by the weight of the pancreas. Islet area and islet size were calculated on insulin immunostained sections using Image-Pro Plus 6 software.52,53
Proteomic Analysis
Three biological replicate samples for CT-EVs (CT-EVs1, CT-EVs2 and CT-EVs3) and RT-EVs (RT-EVs1, RT-EVs2 and RT-EVs3) were obtained and processed for label-free proteomic analysis by Genechem Co., LTD (Shanghai, China). LC-MS/MS analysis was performed on an Orbitrap Exploris 480 mass spectrometer (Thermo Fisher Scientific) that was coupled to Easy nLC (Thermo Fisher Scientific). MaxQuant software version 1.6.17.0. was used to process the resulting MS/MS data. An initial search was set at a precursor mass window of 6 ppm. The search followed an enzymatic cleavage rule of Trypsin/P and allowed maximal two missed cleavage sites and a mass tolerance of 20 ppm for fragment ions. Carbamidomethylation of cysteines was defined as fixed modification, while protein N-terminal acetylation and methionine oxidation were defined as variable modifications for database searching. The cutoff of global false discovery rate (FDR) for peptide and protein identification was set to 0.01. Protein abundance was calculated on the basis of the normalized spectral protein intensity (LFQ intensity). Proteins which Fold change >2 or <0.5 and p value (Student’s t test) <0.05 were considered to be differentially expressed proteins.
Statistics Analysis
All data represent at least 3 independent experiments and were shown as mean ± SD or plots include each datapoint. Unpaired t-test was conducted for comparisons between two groups. One- or two-way ANOVA with Bonferroni post hoc test was used for comparisons among multiple groups. Data analyses were performed using GraphPad Prism software version 7.0 (GraphPad, San Diego, USA). Results were considered significant when p < 0.05 in the respected statistical test and represented significance as ns > 0.05, *p < 0.05; **p < 0.01; ***p < 0.001; ****p < 0.0001.
Results
Cold Temperature Contributed to the Beneficial Effects of T2DM Mice
To address the potential relevance of ambient temperature on age-adjusted diabetes prevalence in adults 20–79 years, we performed human data analysis on the incidence of diabetes per capita and country worldwide54,55 and found a negative correlation between the incidence of diabetes and latitude (Figure 1a). Conversely, there was a positive correlation between the average temperature and diabetes incidence in adults 20–79 years old (Figure 1b). Therefore, there is a direct relationship between ambient temperature and the prevalence of diabetes. Moreover, cold exposure may inhibit the occurrence of diabetes. As we all know T1DM is a kind of autoimmune disease, and T2DM is a metabolic disease, accounting for 95% of diabetes, so we focus on the effect of cold exposure on T2DM. To directly test if cold temperatures exert a protective effect on T2DM, we raised 6-week-old mice with HFD for 9 weeks (from −6 weeks to 3 weeks) and exposed them to CT (4–8°C, T2DM+CT) or RT (22–25°C, T2DM+RT) from −6 weeks to 8 weeks for 14 weeks and use STZ to induce diabetes (The day of injection of STZ is defined as 0 day, Figure 1c). From 0 day to 18th day, T2DM was induced by intraperitoneal injection of 35 mg/kg STZ every other day. At the 7th week, OGTTs, serum insulin levels, ITTs, IRTs and HOMA-IR were performed. At the 8th week, the mice were sacrificed. Cold exposure lowered food intake as expected (data not shown). Strikingly, cold exposure reduced the blood glucose level in T2DM mice induced by HFD+STZ (Figure 1d) and significantly ameliorated glucose metabolism demonstrated by OGTTs (Figure 1g). In the first six weeks of experimental treatment in mice both T2DM+RT mice and T2DM+CT mice lost their weight after treated with STZ. However, the weight of the T2DM+CT mice was lower than that of T2DM+RT mice, indicating that cold exposure could cause the rapid emaciation of T2DM mice. In the next 2 weeks (to 8th week), the body weight of T2DM+CT mice slightly increased because their blood glucose level decreased, and hyperglycemia-induced weight loss was attenuated, while the body weight of T2DM+RT mice continued to decrease because a large amount of glucose was excreted in the urine, and the body could only decompose fat to supply energy (Figure 1e). The results of ITTs also showed that there was a significant improvement in systemic insulin sensitivity in the T2DM+CT group (Figure 1f). T2DM mice have damaged pancreatic β-cells, which leads to impaired insulin production.56 In the present study, CT reversed the impaired insulin-secreting function of T2DM mice demonstrated by serum insulin level detection and IRTs (Figure 1h and i). T2DM+CT mice exhibited lower fasting blood glucose levels and a decreased HOMA-IR index compared with those in the T2DM+RT mice (Figure 1j). Moreover, we did a rescue experiment at the 5th week, as shown in Figure 1k, when T2DM+CT mice moved from CT exposure to RT environment for 4 days, the reduced blood glucose in T2DM+CT mice began to increase again. When T2DM+CT mice were re-placed in CT environment, blood glucose gradually began to decrease. Therefore, CT exposure can reduce blood glucose levels, but only temporarily (Figure 1I). That is to say, the beneficial effects of cold exposure vary with the change of external temperature.
 |
Figure 1 Cold exposure correlated with reduced diabetes incidence in humans and prevented experimentally induced diabetes in mice. (a and b) Data analysis showing age-adjusted correlation between diabetes prevalence in adults per country versus the latitude of the country’s capitals (a) or versus the country’s average day temperature (b). (c) Schematic diagram of the experimental design for assessing the effects of CT and RT on insulin resistance phenotypes in T2DM mice (n = 6). Timeline analysis: Timeline Analysis: We defined the initiation of the first STZ injection as week 0 (0 W). Prior to this, a 6-week high-fat diet (HFD) was administered, with the starting time designated as −6W. (d) Blood glucose levels, (e) Body weight, (f) ITTs, (g) OGTTs, (h) IRTs, (i) Fasting serum insulin, (j) and HOMA-IR index (k) at different time point in T2DM mice exposed to CT (4–8°C, T2DM+CT) or RT (22–25°C, T2DM+RT). The experimental design diagram of CT-exposed T2DM mice returning to CT after being placed at RT. (I) Blood glucose levels of T2DM+CT mice under different environmental treatments. Values were analyzed using two-way ANOVA tests (d–h) and unpaired t-test (i and j). *p < 0.05; **p < 0.01; ***p < 0.001; ****p < 0.0001. |
Benefits of Systemic Blood CT Plasma Administration and CT-EVs Increased Insulin Sensitivity in vitro
Then, we tested whether these effects of cold exposure on T2DM mice could be transferred through the administration of cold-induced circulating factors. Plasma was isolated from age, sex-paired and 6-week cold-exposed mice. T2DM+RT mice were then intravenously injected with plasma from cold-treated mice or depleted EVs plasma from cold-treated mice (CT-EVsfree) every 3 days for 7 weeks (Figure 2a).45,57 T2DM+CT plasma group could result in a lower blood glucose level of 17.98 ± 1.28 mmol/L in T2DM mice compared with T2DM+PBS (29.23 ± 2.04 mmol/L) (Figure 2b). Although the blood glucose level decreased in T2DM+ CT-EVsfree plasma group (23.43 ± 2.29 mmol/L) compared with T2DM+PBS group (Figure 2b), the glucose metabolism of T2DM mice was significantly ameliorated by the treatment of CT plasma, as shown by the OGTTs (Figure 2c). Systemic blood plasma administration transfers the benefits of cold to T2DM mice. EVs play a key role in communication among cells or organs58,59 and are rich in plasma.37 We found that the anti-diabetic effect of plasma from cold-treated mice was reduced when EVs were removed. We further speculated that plasma-derived EVs play a major role in the anti-diabetic effect under cold exposure. To test this hypothesis, we isolated RT-EVs or CT-EVs from mice raised at room temperature or cold temperature for 6 weeks by ultracentrifugation. RT-EVs or CT-EVs were examined by TEM, which showed the presence of rounded particles with a membrane-like bilayer (Figure 2d), which was mainly concentrated at 100 nm in diameter (Figure 2e). Western blot demonstrated that the EVs expressed the classical exosomal markers CD9, CD81, and TSG101 (Figure 2f). These data indicated that the EVs derived from plasma were predominantly exosomes. Surprisingly, we found that the amount of CT-EVs was far more than the amount of RT-EVs (Additional file 1: Figure S1), suggesting that cold exposure could affect the production of EVs. To explore whether CT-EVs participate in the regulation of insulin sensitivity in vitro, firstly, adipocytes, myocytes and hepatocytes exhibited efficient uptake of EVs, as evidenced by the existence of red fluorescence inside these cells (Figure 2g). Furthermore, we evaluated the effects of CT-EVs on cellular insulin sensitivity. CT-EVs treatment significantly facilitated insulin-stimulated 2-NBDG uptake in 3T3-L1 adipocytes and L6 myoblasts (Additional file 1: Figure S2). To explore whether CT-EVs could promote glucose uptake under the insulin resistance condition, PA was used to induce insulin resistance. PA impaired 2-NBDG uptake of these three cell types can be partially reversed by CT-EVs, and this effect was more remarkable when combined with insulin (Figure 2h; Additional file 1: Figure S3). The percentage of cell 2-NBDG uptake in insulin-resistant cells was increased by CT-EVs (Figure 2i; Additional file 1: Figure S3). In addition, the insulin-stimulated activation of IRS1 and AKT phosphorylation in 3T3-L1 adipocytes and primary hepatocytes were activated by CT-EVs treatment (Additional file 1: Figure S4).
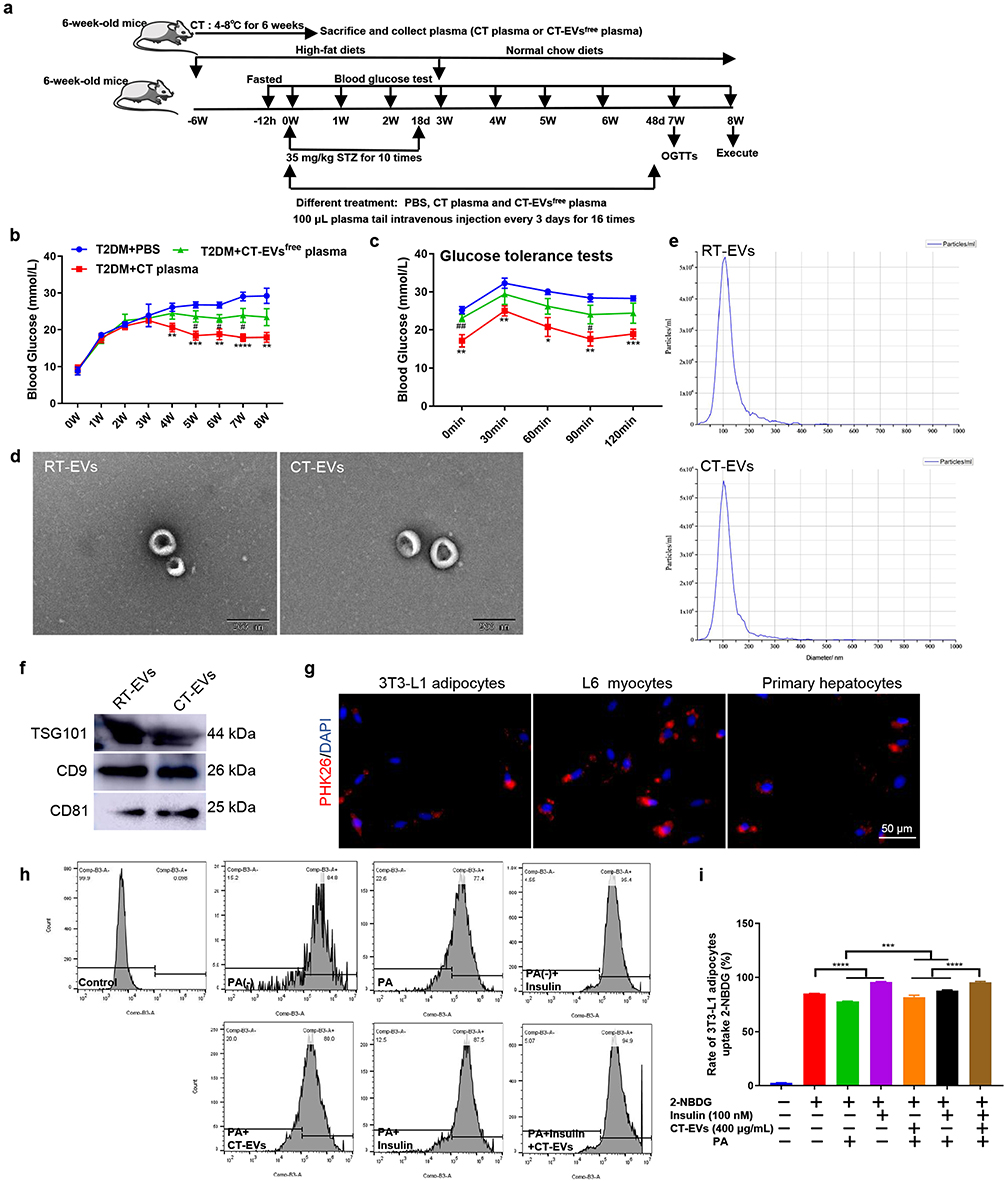 |
Figure 2 CT plasma or CT-EVs ameliorated insulin resistance. (a) Scheme of CT plasma and subsequent experiments (n = 6). (b) Blood glucose levels, and (c) OGTTs in T2DM mice intravenously injected with PBS (T2DM+PBS), or plasma from cold-treated mice (T2DM+CT plasma) or depleted EVs plasma from cold-treated mice (T2DM+CT-EVsfree plasma). (d) TEM micrograph of the EVs. Scale bar: 200 nm. (e) EVs size distribution measured by NTA. (f) Western blot analysis of the vesicles surface markers on EVs. (g) CT-EVs were marked with red fluorescence dye PKH26 and then cocultured with 3T3-L1 adipocytes, L6 myocytes, and primary hepatocytes, with red fluorescence representing EVs in these cells. Scale bar: 50 μm. (h) Effect of 3T3-L1 adipocytes uptake of 2-NBDG detected by flow cytometry (n = 3). (i) Rate of cell uptake of 2-NBDG in different groups of 3T3-L1 adipocytes. (*) Significant difference CT plasma group versus PBS group. *p < 0.05; **p < 0.01; ***p < 0.001; ****p < 0.0001. (#) Significant difference in the CT-EVsfree plasma group versus CT plasma group. Statistical significance was calculated by a one (i) or two-way ANOVA (b and c). #p < 0.05; ##p < 0.01. |
CT-EVs Improved Glucose Tolerance and Increase Insulin Sensitivity in T2DM Mice
To investigate the anti-diabetic effects of CT-EVs, we administrated T2DM mice with RT-EVs/CT-EVs (Figure 3a). As expected, CT-EVs treated T2DM mice had little change in blood glucose at the initial stage; of note, from the 5th week to the 8th week, the blood glucose level in T2DM+CT-EVs group (18.42 ± 4.19 mmol/L) significantly decreased compared with blood glucose level in T2DM+RT-EVs group (26.48 ± 6.87 mmol/L) (Figure 3b). Consistently, the weight of the T2DM+CT-EVs group was slightly higher than that of T2DM+RT-EVs group and T2DM+PBS group, although there was no significant difference, suggesting that CT-EVs therapy can alleviate rapid emaciation in T2DM mice to some extent (Figure 3c). OGTTs and insulin sensitivity were impaired in T2DM+CT-EVs mice, compared to Control+PBS treated mice, but were not as severe as in T2DM+RT-EVs mice (Figure 3d and e). Our results indicated that CT-EVs reversed the impaired insulin-secreting function of T2DM mice demonstrated by IRTs (Figure 3f). The HOMA-IR index in the T2DM+CT-EVs treated group was much lower than that in the T2DM+RT-EVs group (Figure 3g). The T2DM+CT-EVs group showed more glycogen accumulation in the liver and muscle, although no changes were observed in liver histology (Figure 3h; Additional file 1: Figure S5a). We also observed that T2DM+CT-EVs group had a decrease in average cell size compared with T2DM+RT-EVs group in iBAT, ingSAT and pgVAT via HE staining (Additional file 1: Figure S5b).
 |
Figure 3 CT-EVs administration increased insulin sensitivity in vivo. (a) Experimental design of the T2DM mice treated with PBS, CT-EVs, or RT-EVs by intravenous injection. (b) Blood glucose levels, (c) body weight, (d) OGTTs, (e) ITTs, (f) IRTs, (g) HOMA-IR index, and (h) PAS staining of liver and muscle sections in Control + PBS, T2DM + PBS, T2DM + CT-EVs, or T2DM + RT-EVs group. scale bar = 100 μm. (*) Significant difference T2DM+CT-EVs group versus T2DM+PBS group. *p < 0.05; **p < 0.01; ***p < 0.001; ****p < 0.0001. (#) Significant difference in the T2DM+CT-EVs group versus T2DM+RT-EVs group. Statistical significance was calculated by a one (g) or two-way ANOVA (b–f). #p < 0.05; ##p < 0.01; ###p < 0.001; ####p < 0.0001. |
CT-EVs Alleviated Insulin β Cell Dysfunction
We next analysed the effect of CT-EVs on β cell mass. HE and IHC staining for pancreatic tissue sections revealed that the count and area of islets in the T2DM+CT-EVs mice were higher than in the T2DM+RT-EVs mice (Figure 4a). Examination of the mouse islets showed that the endocrine cell tissue integrity, β and α cell distribution in the T2DM mice were significantly different from those in the Control+PBS group, but the distribution and number of β cells in the T2DM+CT-EVs mice were still relatively higher than those in the T2DM+RT-EVs group (Figure 4a–e). These results indicate that CT-EVs can alleviate STZ-induced pancreatic injury by protecting T2DM mice from pancreatic islet damage. After the T2DM mice were treated with PBS, CT-EVs or RT-EVs, respectively, the level of alanine aminotransferase (ALT), alanine aminotransferase/aminotransferase (ALT/AST), blood urea nitrogen (BUN), creatinine (CREA), total cholesterol (TC) or triglycerides (TG) had no significant difference among these groups (Figure 4f–k). These results suggest that the infusion of EVs does not affect the liver and kidney function of mice and does not significantly damage healthy tissue, which provides partial evidence for the safety of future clinical applications.
 |
Figure 4 CT-EVs can alleviate islets from further damage and physiology index of T2DM mice. (a) Upper: morphology of islets stained with HE. Middle: representative IHC staining for insulin (brown) in pancreatic islets. Lower: representative co-IF staining of insulin (INS; red), glucagon (GCG; green), and DAPI (blue) in pancreatic islets (n = 4) in Control + PBS, T2DM + PBS, T2DM + CT-EVs, or T2DM + RT-EVs group. Black scale bar = 200 μm, white scale bar = 50 μm. (b) β cell mass (n = 4). (c) Quantification and comparison of the β islet number in different experimental groups (n = 4). (d) The area of each islet was measured using ImageJ software and compared between groups. (e) Ratio of INS+/GCG+ cells through IF staining images in (a lower) islets stained with insulin and glucagon. (f–k) Mice in different groups (Control group treated with PBS, T2DM groups treated with PBS or CT-EVs or RT-EVs) were starved overnight, and blood samples were collected. (f) ALT. (g) ALT/AST. (h) CREA. (i) BUN. (j) TC. (k) TG in Control + PBS, T2DM + PBS, T2DM + CT-EVs, or T2DM + RT-EVs group. Statistical significance was calculated by a one-way ANOVA (b–k). ns > 0.05, *p < 0.05; ***p < 0.001; ****p < 0.0001. |
CT-EVs Combined with Insulin Had Stronger Anti-Diabetic Effect
To investigate whether CT-EVs combined with insulin have a better therapeutic effect on T2DM mice, we infused CT-EVs (400 μg/100 μL per mice), Insulin (2 IU/kg bw) and CT-EVs+Insulin into T2DM mice via the tail vein; T2DM mice were infused with PBS as a control, and the blood glucose levels were detected in different groups every 7 days for 8 weeks (detailed procedure is in Figure 5a). The results of continuous blood glucose tests displayed that CT-EVs considerably ameliorated hyperglycemia in T2DM mice (Figure 5b). After the last infusion of CT-EVs, blood glucose levels of CT-EVs-treated T2DM mice were maintained at 22.68 ± 2.20 mmol/L, which did not show significant differences compared to that of the Insulin group (19.53 ± 1.25 mmol/L). CT-EVs+Insulin group also could remarkably down-regulate blood glucose of T2DM mice and be maintained at 17.58 ± 0.94 mmol/L. On the contrary, the blood glucose levels of control T2DM mice increased to 32.25 ± 1.28 mmol/L (Figure 5b). OGTT results showed that CT-EVs administration improved glucose metabolism, and the effect of CT-EVs+Insulin administration on glucose metabolism was more obvious (Figure 5c). Compared with T2DM+PBS mice, T2DM+CT-EVs mice were a significant improvement in insulin sensitivity after treated with CT-EVs in T2DM mice (Figure 5d), but not as much as T2DM+Insulin mice. Furthermore, we found that T2DM+CT EVs+Insulin mice had the best improvement in glucose tolerance and insulin sensitivity (Figure 5c and d). CT-EVs+Insulin-treated T2DM mice showed higher levels of AKT phosphorylation in WAT and muscle (Figure 5e and f).
 |
Figure 5 Insulin could promote the anti-diabetic effect of CT-EVs. (a) Schematic flow diagram representing the in vivo treatment of CT-EVs with or without insulin in a T2DM mice model. Time point of different treatments to animal models (n = 6). (b–d) After adoptive transfer of CT-EVs or insulin. (b) Blood glucose levels, (c) OGTTs and (d) ITTs were performed in mice in T2DM + CT-EVs, T2DM + insulin, T2DM + PBS, or T2DM + CT-EVs + insulin group, respectively. (e and f) Insulin-stimulated AKT phosphorylation in the WAT and muscle of T2DM mice injected with CT-EVs or insulin or CT-EVs+insulin, respectively. (g) Summary diagram of the article. These blots were representative of 3 replicated independent experiments, each containing 3 samples. Data were presented as mean ± SD. (*) Significant difference T2DM+CT-EVs+Insulin group versus T2DM+CT-EVs group. (#) Significant difference in the T2DM+CT-EVs+Insulin group versus T2DM+Insulin group. Statistical significance was calculated by a one (f) or two-way ANOVA (b–d). *p < 0.05; **p < 0.01. |
Proteomic Analysis of RT-EVs and CT-EVs
Label-free proteomic analysis was applied to characterize and quantify proteins in RT-EVs and CT-EVs. In total, there were 628 proteins that were identified in RT-EVs and/or CT-EVs, among which 362 proteins were quantified (Figure 6a). The differentially expressed proteins (p < 0.05; | log2fold change|≥1.5) between RT-EVs and CT-EVs are listed in Table S1 and illustrated as a volcano plot in Figure 6b. In total, 19 proteins were much higher and 54 proteins were much lower in CT-EVs compared with RT-EVs (Figure 6b and Table S1). The expression ratios of the top 10 most abundant proteins and the top 10 most scarce proteins in CT-EVs relative to RT-EVs are shown in Figure 6c. Gene Ontology (GO) annotation was conducted to classify the proteins highly enriched in CT-EVs relative to RT-EVs according to their subcellular localizations. As shown in Figure 6d and Table S2, 36.8% of them were from extracellular and 38.7% of them were annotated as cytosol proteins. The remaining proteins were from plasma membrane (5.7%), endoplasmic reticulum (5.7%), cytoskeleton (2.8%), nucleus (4.7%) or mitochondria (4.7%) (Figure 6d). GO biological process enrichment analysis of the up-regulated proteins revealed that CT-EVs were enriched with proteins involved in the transport of positive regulation of glucose metabolic process, lipid metabolism, insulin receptor signaling pathway, etc. (Figure 6e and Table S3), suggesting a functional role of CT-EVs in glycolipid metabolism and insulin sensitivity. Kyoto Encyclopedia of Genes and Genomes (KEGG) pathway enrichment analysis showed that the up-regulated proteins in CT-EVs compared with RT-EVs were involved in β cell receptor signaling pathway and PI3K-Akt signaling pathway and down-regulated proteins in CT-EVs compared with RT-EVs were involved in pancreatic secretion, insulin resistance or glycolysis/gluconeogenesis (Figure 6f and Table S4). These findings indicate that CT-EVs are selectively enriched with various functional proteins.
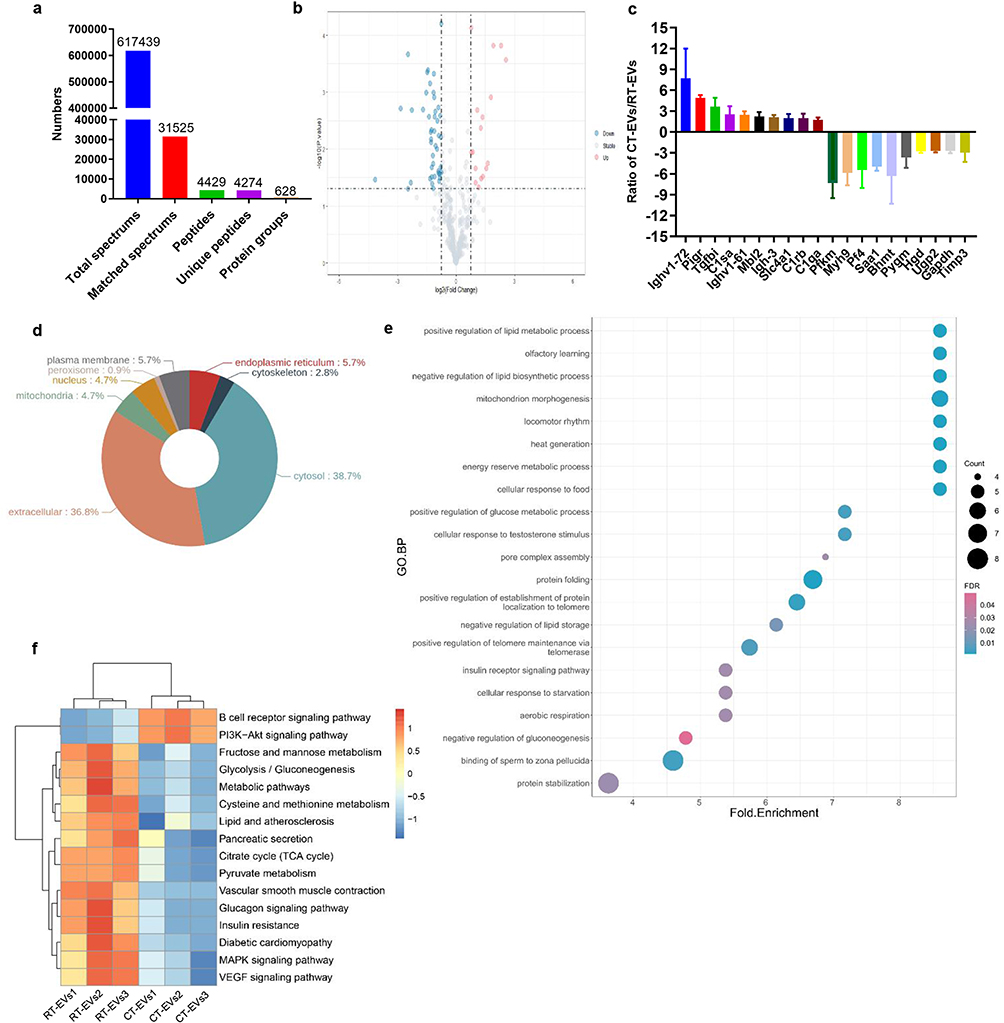 |
Figure 6 Proteomic analysis of RT-EVs and CT-EVs. (a) Summary of tandem mass spectrometry (MS/MS) database search results for RT-EVs and CT-EVs. (b) Volcano plot showing the numbers of differentially expressed proteins between RT-EVs and CT-EVs with the cutoff of p < 0.05 and |log2fold change|≥1.5. (c) The expression ratios of the top 10 most abundant proteins and the top 10 most scarce proteins in CT-EVs relative to RT-EVs. n = 3 per group. (d) GO annotation of the up-regulated proteins in CT-EVs relative to RT-EVs in terms of their subcellular localizations. (e) GO biological process enrichment analysis of the up-regulated proteins in CT-EVs relative to RT-EVs. (f) KEGG pathway enrichment analysis of the differentially expressed proteins in CT-EVs relative to RT-EVs. |
Discussion
Cold exposure is a very interesting topic for studying the effects of energy expenditure stimulation on diabetes and glucose metabolism under near-steady-state conditions.5 In fact, the absence of standardized criteria for quantifying the extent of cold exposure presents a significant challenge in this field. Scientists use terms such as “cold acclimation” or “cold adaptation” to describe the body’s adaptive responses to cold environments within its tolerance limits or prolonged repeated cold exposure lasting typically 3–6 weeks. These processes involve a gradual reduction in cold stress responses. In contrast to the negative effects of cold stress, appropriate cold exposure, especially cold adaptation, can also have numerous positive effects on the body.4,5,7–9,12,60 In this study, we employed a classic cold exposure model with a temperature range of 4–8°C, considered relatively mild temperature for mice.5,18 We expose the mice to 4–8°C for 6 weeks to represent a state of relative chronic mild cold exposure. We anticipate that the mice have reached a state of cold adaptation after 30 days of cold exposure.
In order to better test CT/CT-EVs reverses the T2DM mice, we chose to treat at the early stage of diabetes induction, that is, EVs were given on the same day of STZ injection to study the protective potential of EVs. Our study found that cold exposure and CT-EVs have anti-diabetic effects and can further protect the response of peripheral tissues to insulin, improving glucose tolerance and stimulating the glucose uptake of peripheral tissues (Figure 5g). However, intraperitoneal successive injection of 50 mg/kg STZ for 5 days after HFD is a very classic method to induce T2DM mice.43 In this study, we surprisedly found that HFD combined with a small dose of 35 mg/kg STZ was continuously injected intraperitoneally every other day to induce T2DM mice to have smaller differences in blood glucose within the group, and the model was better and more stable. In the initial stage of treatment with CT-EVs, the anti-diabetic effect is not obvious, but it starts to show a better anti-diabetic effect after multiple injections. The therapeutic effect of CT-EVs, which is not immediate and rapid, is different from that of insulin. Our study also found that T2DM mice can only show a good anti-diabetic effect after being placed in CT for a period of time, but the anti-diabetic effect will disappear quickly with the rise of ambient temperature, and blood glucose can be better controlled after being placed back in CT (Figure 1L). This means that T2DM mice need to live in CT all the time to achieve the well anti-diabetic effect, as we all know, human beings in our current society are rarely directly exposed to outdoor extreme cold temperatures, and our civilization even takes this as one of its purposes (clothes, houses and air conditioners). Therefore, it is difficult, if not impossible, to conduct large-scale clinical or epidemiological studies to prove the sustainable impact of cold exposure in the world, so the application of CT-EVs can better solve the inconvenience of living in CT for a long time. Cold increases insulin sensitivity, which may be explained as follows: when cold exposure, the body’s metabolism is accelerated. This systemic metabolism is similar to exercise, which can move the muscles all over the body, consume glucose, and increase the utilization of insulin.18 Cold can stimulate the sympathetic nerve directly innervating the islets by releasing norepinephrine.18 At the same time, cold exposure causes changes in the plasma composition of the body, making the body produce more beneficial EVs–CT-EVs, which can significantly reduce glucose levels, but significantly improve glucose tolerance, enhance the insulin sensitivity of peripheral tissues and increase the phosphorylation of IRS1 and AKT. As previously mentioned, during long-term cold exposure and after initial weight loss, the weight of mice in the CT or CT-EVs treatment group no longer decreased progressively but remained stable, indirectly suggesting that CT or CT-EVs effectively ameliorated hyperglycemia. The use of STZ chemical drugs destroyed the number and function of pancreatic β cells to a certain extent. Even in the islets of each animal, the number of insulin-positive cells varies, and not all cells in the islets are insulin-positive. These potential new islets were not fully mature after CT-EVs treatment, which could explain why, even after CT-EVs treatment, insulin-positive cells were still much less than those in Control+PBS group, but the number and size of islet β cells in T2DM+CT-EVs group were significantly better than those in T2DM+RT-EVs group. Therefore, we emphasize that CT-EVs have some potential in pancreatic regeneration.
These studies were conducted in mice, and whether similar effects will be observed in human studies remains to be evaluated. When designing human cold exposure experiments, it is crucial to consider the varied metabolic, cardiovascular, and thermal perception responses elicited by different cold stimuli. In fact, the lack of standardized criteria for defining the degree or intensity of cold exposure poses a significant challenge in this field. Humans adapt their behavior to optimize personal comfort in response to cold stimuli. Without such adjustments, cold-sensitive thermoreceptors in the skin will activate autonomic and somatic motor responses to limit heat loss to the environment and increase the generation of metabolic heat.61 Like all large mammals, humans rely on their large body mass to provide greater thermal inertia to counter temperature fluctuations, while their significant muscle mass servers as an important heat source.62 Initial studies discovered that human BAT can be stimulated to generate heat and clear circulating substrates during cold exposure.63 Subsequent studies have indicated that prolonged cold exposure shifts towards increased lipid utilization, especially in men exposed to 7.5°C air for 12–24 h.64 A study by Hanssen et al16 published in Nature Medicine involved eight T2DM patients undergoing ten days of cold exposure therapy. This therapy consisted of the patients wearing shorts and T-shirts in a room with a temperature of 14–15°C, without engaging in vigorous exercise or receiving injections or medications. After 10 days of cold adaptation, metabolic testing results showed a 43% increase in insulin sensitivity in these patients. Results from PET-CT imaging revealed a slight enhancement in glucose uptake by brown fat near the clavicle. Furthermore, scientists discovered through a series of biopsies and molecular biology tests that the expression of GLUT4, a glucose transporter protein, significantly increased in the skeletal muscles of these patients. Therefore, scientists speculate that it is likely the high expression of GLUT4 that enhances insulin sensitivity, improving the condition of diabetes patients. Our research focuses on explaining this miraculous phenomenon from the perspective of blood circulation and EVs, providing a novel explanatory mechanism for the cold-induced reduction in blood sugar.
For clinical transformation of CT-EVs, other factors are necessary to consider, such as the development of more standardized methods to purify EVs at the therapeutic level to stabilize the efficacy, the use of CT-EVs in combination with appropriate anti-diabetic agents, or modification of CT-EVs to further improve its efficacy. Furthermore, we can explore components or molecular proteins in the EVs that play a role and determine whether new drugs can be developed from them for treatment of T2DM. Considering that quivering heat production in skeletal muscle gradually changes to non-quivering heat production mainly in BAT during cold acclimation,16 BAT may represent an important site of glucose processing in cold adapted T2DM mice, which needs further investigation.16 It is of interest to determine whether CT-EVs produced by other tissues, such as β cells, iBAT, perivascular adipose tissue, hepatocytes, or myocytes, can have metabolic effects.
The hypothalamus, serving as a pivotal regulator for neural and fluid regulation, comprehensively regulates the balance of nutrient intake and utilization in the body.65,66 During exposure to cold, the neuroendocrine system acts as the first line of defense in maintaining and restoring internal homeostasis under cold stress. Stress signals primarily activate the hypothalamic–pituitary–adrenal (HPA) axis and the hypothalamic–pituitary–thyroid (HPT) axis, triggering a cascade of reactions.65 Therefore, we speculate that the neuroendocrine system of mice and some hormones in the body also participate in the anti-diabetic activity during cold exposure, which requires further investigation. Although the effects, pathways, and targets of cold exposure on the human body are not yet clear, cold exposure, as a safe and simple novel physical therapy, has great potential in treating T2DM. Similar to exercise training, the development of “cold therapy chambers” in the future will have a significant impact on human health and disease treatment. We advocate for temperature training and recommend incorporating it as part of a healthy lifestyle.
Conclusion
In this study, we demonstrate that prolonged cold exposure attenuates the diabetes in T2DM mice model. Systemic blood plasma administration transfers the benefits of cold exposure to T2DM mice. Surprisingly, we found that administration of circulating EVs in plasma from cold-exposed mice transferred the increased the insulin sensitivity and relieved β‑Cell destruction effects on T2DM mice, which may be an important reason to explain the low incidence of diabetes in cold regions, and EVs play a partially critical role in lowering blood glucose.
Ethics Approval and Consent to Participate
The animal investigation conformed to published guidelines (National Research Council, The Care and Use of Laboratory Animals, 7th ed. Washington, DC: National Academies Press; 1996). All animal studies were formally approved by the Ethics Committee of the Second Xiangya Hospital, Central South University (Cat#: 2022706).
Acknowledgment
We sincerely thank the animal care staff and technicians of the Animal Experimental Center of the Second Xiangya Hospital of Central South University for their care and special treatment of these mice. This study was supported by the National Natural Science Foundation of China (No. 82370892, 82070910, 82100944, 82200869, and 82100494), National Key Research & Development Program (No. 2021YFC2501701), National Clinical Key Specialties Major Research Projects (Z2023026). The Health Research Project in Hunan Province (No. 20231696 and 202103062278), Health Research Project of Hunan Provincial Health Commission (W20243019), the Natural Science Foundation of Hunan Province (No. 2022JJ40721 and 2022JJ40715), and the Scientific Research Launch Project for new employees of the Second Xiangya Hospital of Central South University (No. 7673).
Disclosure
The authors declare no conflicts of interest in this work.
References
1. Elmarzouki H, Aboussaleh Y, Bitiktas S, et al. Effects of cold exposure on behavioral and electrophysiological parameters related with hippocampal function in rats. Front Cell Neurosci. 2014;8:253. doi:10.3389/fncel.2014.00253
2. Lichtenbelt W, Kingma B, Van Der Lans A, et al. Cold exposure--an approach to increasing energy expenditure in humans. Trends Endocrinol Metab. 2014;25(4):165–167. doi:10.1016/j.tem.2014.01.001
3. Jurado-Fasoli L, Sanchez-Delgado G, Di X, et al. Cold-induced changes in plasma signaling lipids are associated with a healthier cardiometabolic profile independently of brown adipose tissue. Cell Rep Med. 2024;5(2):101387. doi:10.1016/j.xcrm.2023.101387
4. Seki T, Yang Y, Sun X, et al. Brown-fat-mediated tumour suppression by cold-altered global metabolism. Nature. 2022;608(7922):421–428. doi:10.1038/s41586-022-05030-3
5. Chevalier C, Stojanović O, Colin DJ, et al. Gut microbiota orchestrates energy homeostasis during cold. Cell. 2015;163(6):1360–1374. doi:10.1016/j.cell.2015.11.004
6. Ivanova YM, Blondin DP. Examining the benefits of cold exposure as a therapeutic strategy for obesity and type 2 diabetes. J Appl Physiol. 2021;130(5):1448–1459. doi:10.1152/japplphysiol.00934.2020
7. Spiljar M, Steinbach K, Rigo D, et al. Cold exposure protects from neuroinflammation through immunologic reprogramming. Cell Metab. 2021;33(11):2231–2246.e2238. doi:10.1016/j.cmet.2021.10.002
8. Zhao Z, Cao J, Niu C, et al. Body temperature is a more important modulator of lifespan than metabolic rate in two small mammals. Nat Metab. 2022;4(3):320–326. doi:10.1038/s42255-022-00545-5
9. Li G, Xie C, Lu S, et al. Intermittent fasting promotes white adipose browning and decreases obesity by shaping the gut microbiota. Cell Metab. 2017;26(4):672–685.e674. doi:10.1016/j.cmet.2017.08.019
10. Salehipour-Shirazi G, Ferguson LV, Sinclair BJ. Does cold activate the Drosophila melanogaster immune system? J Insect Physiol. 2017;96:29–34. doi:10.1016/j.jinsphys.2016.10.009
11. Simonsick EM, Meier HCS, Shaffer NC, et al. Basal body temperature as a biomarker of healthy aging. Age. 2016;38(5–6):445–454. doi:10.1007/s11357-016-9952-8
12. Lee HJ, Alirzayeva H, Koyuncu S, et al. Cold temperature extends longevity and prevents disease-related protein aggregation through PA28γ-induced proteasomes. Nat Aging. 2023;3(5):546–566. doi:10.1038/s43587-023-00383-4
13. Pillon NJ, Loos RJF, Marshall SM, et al. Metabolic consequences of obesity and type 2 diabetes: balancing genes and environment for personalized care. Cell. 2021;184(6):1530–1544. doi:10.1016/j.cell.2021.02.012
14. Franks PW, Mccarthy MI. Exposing the exposures responsible for type 2 diabetes and obesity. Science. 2016;354(6308):69–73. doi:10.1126/science.aaf5094
15. Wang TY, Liu C, Wang A, et al. Intermittent cold exposure improves glucose homeostasis associated with brown and white adipose tissues in mice. Life Sci. 2015;139:153–159. doi:10.1016/j.lfs.2015.07.030
16. Hanssen MJ, Hoeks J, Brans B, et al. Short-term cold acclimation improves insulin sensitivity in patients with type 2 diabetes mellitus. Nat Med. 2015;21(8):863–865. doi:10.1038/nm.3891
17. Hanssen MJ, Van Der LanS AA, Brans B, et al. Short-term cold acclimation recruits brown adipose tissue in obese humans. Diabetes. 2016;65(5):1179–1189. doi:10.2337/db15-1372
18. Bukowiecki LJ. Energy balance and diabetes. The effects of cold exposure, exercise training, and diet composition on glucose tolerance and glucose metabolism in rat peripheral tissues. Can J Physiol Pharmacol. 1989;67(4):382–393. doi:10.1139/y89-062
19. Remie CME, Moonen MPB, Roumans KHM, et al. Metabolic responses to mild cold acclimation in type 2 diabetes patients. Nat Commun. 2021;12(1):1516. doi:10.1038/s41467-021-21813-0
20. Guo B, Shan SK, Xu F, et al. Protective role of small extracellular vesicles derived from HUVECs treated with AGEs in diabetic vascular calcification. J Nanobiotechnology. 2022;20(1):334. doi:10.1186/s12951-022-01529-z
21. Venkat P, Zacharek A, Landschoot-Ward J, et al. Exosomes derived from bone marrow mesenchymal stem cells harvested from type two diabetes rats promotes neurorestorative effects after stroke in type two diabetes rats. Exp Neurol. 2020;334:113456. doi:10.1016/j.expneurol.2020.113456
22. Nawaz M, Malik MI, Zhang H, et al. Proteomic analysis of exosome-like vesicles isolated from saliva of the tick haemaphysalis longicornis. Front Cell Infect Microbiol. 2020;10:542319. doi:10.3389/fcimb.2020.542319
23. Chen CY, Rao SS, Ren L, et al. Exosomal DMBT1 from human urine-derived stem cells facilitates diabetic wound repair by promoting angiogenesis. Theranostics. 2018;8(6):1607–1623. doi:10.7150/thno.22958
24. Spaull R, Mcpherson B, Gialeli A, et al. Exosomes populate the cerebrospinal fluid of preterm infants with post-haemorrhagic hydrocephalus. Int J Dev Neurosci. 2019;73(1):59–65. doi:10.1016/j.ijdevneu.2019.01.004
25. Grossen P, Portmann M, Koller E, et al. Evaluation of bovine milk extracellular vesicles for the delivery of locked nucleic acid antisense oligonucleotides. Eur J Pharm Biopharm. 2021;158:198–210. doi:10.1016/j.ejpb.2020.11.012
26. Li FX, Liu JJ, Xu F, et al. Role of tumor-derived exosomes in bone metastasis. Oncol Lett. 2019;18(4):3935–3945. doi:10.3892/ol.2019.10776
27. Rezaie J, Aslan C, Ahmadi M, et al. The versatile role of exosomes in human retroviral infections: from immunopathogenesis to clinical application. Cell Biosci. 2021;11(1):19. doi:10.1186/s13578-021-00537-0
28. He X, Kuang G, Wu Y, et al. Emerging roles of exosomal miRNAs in diabetes mellitus. Clin Transl Med. 2021;11(6):e468. doi:10.1002/ctm2.468
29. Wang J, Li L, Zhang Z, et al. Extracellular vesicles mediate the communication of adipose tissue with brain and promote cognitive impairment associated with insulin resistance. Cell Metab. 2022;34(9):1264–1279.e1268. doi:10.1016/j.cmet.2022.08.004
30. Xiong Y, Chen L, Yan C, et al. Circulating exosomal miR-20b-5p inhibition restores Wnt9b signaling and reverses diabetes-associated impaired wound healing. Small. 2020;16(3):e1904044. doi:10.1002/smll.201904044
31. Ying W, Gao H, Dos Reis FCG, et al. MiR-690, an exosomal-derived miRNA from M2-polarized macrophages, improves insulin sensitivity in obese mice. Cell Metab. 2021;33(4):781–790.e785. doi:10.1016/j.cmet.2020.12.019
32. Kahn SE, Hull RL, Utzschneider KM. Mechanisms linking obesity to insulin resistance and type 2 diabetes. Nature. 2006;444(7121):840–846. doi:10.1038/nature05482
33. Guay C, Regazzi R. Exosomes as new players in metabolic organ cross-talk. Diabetes Obes Metab. 2017;19(Suppl 1):137–146. doi:10.1111/dom.13027
34. Zhu M, Wu J, Gao J. Exosomes for diabetes syndrome: ongoing applications and perspective. Biomater Sci. 2022;10(9):2154–2171. doi:10.1039/D2BM00161F
35. Binang HB, Perera CJ, Apte MV. Role of pancreatic tumour-derived exosomes and their cargo in pancreatic cancer-related diabetes. Int J Mol Sci. 2023;24(12):10203. doi:10.3390/ijms241210203
36. Burillo J, Fernández-Rhodes M, Piquero M, et al. Human amylin aggregates release within exosomes as a protective mechanism in pancreatic β cells: pancreatic β-hippocampal cell communication. Biochim Biophys Acta Mol Cell Res. 2021;1868(5):118971. doi:10.1016/j.bbamcr.2021.118971
37. Pegtel DM, Gould SJ. Exosomes. Annu Rev Biochem. 2019;88(1):487–514. doi:10.1146/annurev-biochem-013118-111902
38. Liang Y, Duan L, Lu J, et al. Engineering exosomes for targeted drug delivery. Theranostics. 2021;11(7):3183–3195. doi:10.7150/thno.52570
39. Li Y, Meng L, Li B, et al. The exosome journey: from biogenesis to regulation and function in cancers. J Oncol. 2022;2022:9356807. doi:10.1155/2022/9356807
40. Xu T, liao S, Huang M, et al. A ZTF-7/RPS-2 complex mediates the cold-warm response in C. elegans. PLoS Genet. 2023;19(2):e1010628. doi:10.1371/journal.pgen.1010628
41. Leow MK, Rengaraj A, Narasimhan K, et al. Activated brown adipose tissue releases exosomes containing mitochondrial methylene tetrahydrofolate dehydrogenase (NADP dependent) 1-like protein (MTHFD1L). Biosci Rep. 2022;42(5). doi:10.1042/BSR20212543
42. Okamatsu-Ogura Y, Matsushita M, Bariuan JV, et al. Association of circulating exosomal miR-122 levels with BAT activity in healthy humans. Sci Rep. 2019;9(1):13243. doi:10.1038/s41598-019-49754-1
43. Franko A, Von Kleist-Retzow JC, Neschen S, et al. Liver adapts mitochondrial function to insulin resistant and diabetic states in mice. J Hepatol. 2014;60(4):816–823. doi:10.1016/j.jhep.2013.11.020
44. Su ST, Yeh CL, Hou YC, et al. Dietary glutamine supplementation enhances endothelial progenitor cell mobilization in streptozotocin-induced diabetic mice subjected to limb ischemia. J Nutr Biochem. 2017;40:86–94. doi:10.1016/j.jnutbio.2016.10.010
45. Horowitz AM, Fan X, Bieri G, et al. Blood factors transfer beneficial effects of exercise on neurogenesis and cognition to the aged brain. Science. 2020;369(6500):167–173. doi:10.1126/science.aaw2622
46. Xu F, Zhong JY, Lin X, et al. Melatonin alleviates vascular calcification and ageing through exosomal miR-204/miR-211 cluster in a paracrine manner. J Pineal Res. 2020;68(3):e12631. doi:10.1111/jpi.12631
47. Luo ZW, Li FX, Liu YW, et al. Aptamer-functionalized exosomes from bone marrow stromal cells target bone to promote bone regeneration. Nanoscale. 2019;11(43):20884–20892. doi:10.1039/C9NR02791B
48. Lin X, Li F, Xu F, et al. Aberration methylation of miR-34b was involved in regulating vascular calcification by targeting Notch1. Aging. 2019;11(10):3182–3197. doi:10.18632/aging.101973
49. Li FX, Lin X, Xu F, et al. The role of mesenchymal stromal cells-derived small extracellular vesicles in diabetes and its chronic complications. Front Endocrinol. 2021;12:780974. doi:10.3389/fendo.2021.780974
50. Lin X, Shan SK, Xu F, et al. The crosstalk between endothelial cells and vascular smooth muscle cells aggravates high phosphorus-induced arterial calcification. Cell Death Dis. 2022;13(7):650. doi:10.1038/s41419-022-05064-5
51. Ying W, Riopel M, Bandyopadhyay G, et al. Adipose tissue macrophage-derived exosomal miRNAs can modulate in vivo and in vitro insulin sensitivity. Cell. 2017;171(2):372–384.e312. doi:10.1016/j.cell.2017.08.035
52. Xu H, Du X, Xu J, et al. Pancreatic β cell microRNA-26a alleviates type 2 diabetes by improving peripheral insulin sensitivity and preserving β cell function. PLoS Biol. 2020;18(2):e3000603. doi:10.1371/journal.pbio.3000603
53. Tuomi T, Nagorny CLF, Singh P, et al. Increased melatonin signaling is a risk factor for type 2 diabetes. Cell Metab. 2016;23(6):1067–1077. doi:10.1016/j.cmet.2016.04.009
54. Booth GL, Luo J, Park AL, et al. Influence of environmental temperature on risk of gestational diabetes. Cmaj. 2017;189(19):E682–e689. doi:10.1503/cmaj.160839
55. Magliano DJ, Boyko EJ. COMMITTEE IDFDATES. IDF Diabetes Atlas. Idf Diabetes Atlas. Brussels: International Diabetes Federation© International Diabetes Federation; 2021.
56. Ashcroft FM, Rorsman P. Diabetes mellitus and the β cell: the last ten years. Cell. 2012;148(6):1160–1171. doi:10.1016/j.cell.2012.02.010
57. Jeon OH, Mehdipour M, Gil TH, et al. Systemic induction of senescence in young mice after single heterochronic blood exchange. Nat Metab. 2022;4(8):995–1006. doi:10.1038/s42255-022-00609-6
58. Kalluri R, Lebleu VS. The biology, function, and biomedical applications of exosomes. Science. 2020;367(6478). doi:10.1126/science.aau6977
59. Kitagawa M, Wu P, Balkunde R, et al. An RNA exosome subunit mediates cell-to-cell trafficking of a homeobox mRNA via plasmodesmata. Science. 2022;375(6577):177–182. doi:10.1126/science.abm0840
60. Li FX, Liu JJ, Xu F, et al. Cold exposure protects against medial arterial calcification development via autophagy. J Nanobiotechnology. 2023;21(1):226. doi:10.1186/s12951-023-01985-1
61. Blondin DP, Haman F. Shivering and nonshivering thermogenesis in skeletal muscles. Handb Clin Neurol. 2018;156:153–173. doi:10.1016/B978-0-444-63912-7.00010-2
62. M UD, Raiko J, Saari T, et al. Human brown adipose tissue [(15)O]O2 PET imaging in the presence and absence of cold stimulus. Eur J Nucl Med Mol Imaging. 2016;43(10):1878–1886. doi:10.1007/s00259-016-3364-y
63. Ouellet V, Labbé SM, Blondin DP, et al. Brown adipose tissue oxidative metabolism contributes to energy expenditure during acute cold exposure in humans. J Clin Invest. 2012;122(2):545–552. doi:10.1172/JCI60433
64. Haman F, Mantha OL, Cheung SS, et al. Oxidative fuel selection and shivering thermogenesis during a 12- and 24-h cold-survival simulation. J Appl Physiol. 2016;120(6):640–648. doi:10.1152/japplphysiol.00540.2015
65. Chen XY, Li R, Wang M, et al. Identification of differentially expressed genes in hypothalamus of chicken during cold stress. Mol Biol Rep. 2014;41(4):2243–2248. doi:10.1007/s11033-014-3075-z
66. Tran LT, Park S, Kim SK, et al. Hypothalamic control of energy expenditure and thermogenesis. Exp Mol Med. 2022;54(4):358–369. doi:10.1038/s12276-022-00741-z
 © 2024 The Author(s). This work is published and licensed by Dove Medical Press Limited. The
full terms of this license are available at https://www.dovepress.com/terms.php
and incorporate the Creative Commons Attribution
- Non Commercial (unported, 3.0) License.
By accessing the work you hereby accept the Terms. Non-commercial uses of the work are permitted
without any further permission from Dove Medical Press Limited, provided the work is properly
attributed. For permission for commercial use of this work, please see paragraphs 4.2 and 5 of our Terms.
© 2024 The Author(s). This work is published and licensed by Dove Medical Press Limited. The
full terms of this license are available at https://www.dovepress.com/terms.php
and incorporate the Creative Commons Attribution
- Non Commercial (unported, 3.0) License.
By accessing the work you hereby accept the Terms. Non-commercial uses of the work are permitted
without any further permission from Dove Medical Press Limited, provided the work is properly
attributed. For permission for commercial use of this work, please see paragraphs 4.2 and 5 of our Terms.