")
Back to Journals » International Journal of Nanomedicine » Volume 19
Combination of DMDD with Nanoparticles Effective Against Diabetic Kidney Disease in vitro
Authors Huang XM, Guo YX, Pang QL, Yan XY, Yan H, Li JY, Tang GL, Jiang HX, Zhang HL
Received 3 July 2024
Accepted for publication 14 October 2024
Published 23 November 2024 Volume 2024:19 Pages 12439—12460
DOI https://doi.org/10.2147/IJN.S475840
Checked for plagiarism Yes
Review by Single anonymous peer review
Peer reviewer comments 2
Editor who approved publication: Professor Farooq A. Shiekh
Xiao-Man Huang,* Yan-Xiang Guo,* Qiu-Ling Pang, Xiao-Yi Yan, Hui Yan, Jing-Yi Li, Gan-Ling Tang, Hui-Xian Jiang, Hong-Liang Zhang
The First Affiliated Hospital of Guangxi Medical University, Nanning, Guangxi, 530021, People’s Republic of China
*These authors contributed equally to this work
Correspondence: Hong-Liang Zhang, The First Affiliated Hospital of Guangxi Medical University, Nanning, Guangxi, 530021, People’s Republic of China, Email [email protected]
Purpose: 2-Dodecyl-6-methoxy-2,5-diene-1,4-cyclohexanedione (DMDD), isolated from Averrhoa carambola L. root, has demonstrated the potential to reduce blood sugar levels. However, DMDD has poor solubility and bioavailability. This study aimed to formulate DMDD-loaded nanoparticles (DMDD-NPs) using chitosan crosslinked with sodium tripolyphosphate through the ionic crosslinking method and to investigate their effect on diabetic kidney disease (DKD) treatment by inhibiting the development of the epithelial-mesenchymal transition (EMT).
Methods: DMDD-NPs were prepared by ionic crosslinking with sodium tripolyphosphate, optimizing six factors that affect nanoparticle characteristics, including particle size and zeta potential. Encapsulation efficiency (EE) and drug loading rate (DL) were optimized using a Box-Behnken design. The structure and characteristics of DMDD-NPs, including size, EE, DL, and release rates, were analyzed. Cytotoxicity was assessed using the Cell Counting Kit-8 (CCK-8) assay, while the migration capacity of HK-2 cells was evaluated through scratch-wound assays. The expression of EMT-related markers (E-cadherin, Vimentin, and TGF-β 1) was assessed by qRT-PCR.
Results: The optimized formulation for DMDD-NPs was CS:TPP:DMDD = 10:3:3 (w), at pH 3.5, with 1.0 mg/mL of CS and stirring at 500 rpm for 30 min. In these conditions, the nanoparticles had a particle size of 320.37 ± 2.93 nm, an EE of 85.09 ± 1.43%, and a DL of 15.88 ± 0.51%. The DMDD-NPs exhibited a spherical shape, no leakage and minimal adhesion. The optimal freeze-drying protectant was a combination of 0.025% mannitol and 0.025% lactose. The drug release followed the Higuchi model. DMDD-NPs improved HK-2 cell proliferation at lower concentrations (< 24 μg/mL) and showed greater cell migration inhibition than DMDD. DMDD-NPs promoted E-cadherin expression and inhibited vimentin and TGF-β 1 expression, suggesting their potential role in preventing EMT for DKD treatment.
Keywords: DMDD, drug delivery system, nanoparticles, epithelial-mesenchymal transformation, diabetic kidney disease
Introduction
Diabetic kidney disease (DKD) represents a prevalent microvascular complication of diabetes and is the leading cause of end-stage renal disease (ESRD).1–3 Comprising more than 90% of renal parenchyma, the renal tubules and stroma are critical sites where excessive apoptosis of renal tubular epithelial cells plays a key role in the pathogenesis of DKD.4 The increasing prevalence of diabetes, driven by changes in lifestyle and dietary habits, has contributed to the increased incidence of DKD and its complications. The clinical manifestations of DKD include persistent proteinuria, edema, hypertension, and a decreased glomerular filtration rate. These symptoms follow pathological changes such as glomerular sclerosis and renal tubule fibrosis, which ultimately lead to renal insufficiency and uremia. As a significant cause of mortality among diabetic patients, DKD demonstrates the need for early and effective management of diabetes, in addition to timely diagnosis and treatment of DKD.5–7 Developing therapeutics that are both effective and have minimal adverse effects remains critical, in this context, Chinese herbal medicine has demonstrated promising potential.8–11 China and Indonesia, have many herbal plants that have been proven to be efficacious, but these have only been discovered to be efficacious based on “testimonial based medicine”, this research is very important to bridge testimonial based medicine and evidence based medicine.
The epithelial-mesenchymal transition (EMT) is a crucial process in the development of DKD, involving the loss of junctions and apical polarity by epithelial cells, cytoskeletal reorganization, changes in signaling pathways that govern cell shape, changes in gene expression, and the transition to mesenchymal cells. There are three recognized types of EMT: Type I, associated with implantation, embryonic development, and organogenesis; Type II, related to wound healing, tissue repair, and organ fibrosis; and Type III, related to malignancy. Type II EMT facilitates the conversion of epithelial cells into myofibroblasts, which are instrumental in repairing damaged tissues. However, in conditions of persistent chronic inflammation, this process can lead to abnormal accumulation of myofibroblasts, progressive fibrosis, and subsequent excessive deposition of the extracellular matrix, causing organ damage. Type II EMT plays a central role in renal interstitial fibrosis in DKD. Research using mouse models of diabetic nephropathy induced by streptozotocin and human proximal renal tubules cultured under high glucose conditions has demonstrated EMT-related changes, including increased expression of α-smooth muscle actin (α-SMA) and vimentin and decreased expression of E-cadherin.12 Numerous studies have corroborated a correlation between EMT and modulation of key biomarkers, including an increase in vimentin expression, a decrease in E-cadherin expression, and a reduction in Transforming Growth Factor-β1 (TGF-β1) levels.13–15
Chitosan (CS), a green and cationic polymer, interacts with polyanions such as sodium tripolyphosphate to form cross-links.16 The presence of these cross-linking agents induces a sol-gel transition within the polymer, facilitating the formation of nanoparticles. This method allows precise control of nanoparticle size and properties, enabling a wide range of applications in diverse fields such as drug delivery, tissue engineering, and food technology.17 The versatility of this approach, along with its scalability and reproducibility, makes it a preferred method for nanoparticle synthesis.18
In recent decades, nanotechnology has emerged as a novel research area in medicine, with nanomaterials increasingly being utilized for their exceptional properties.19–21 In comparison, traditional Chinese nanomedicine22 offers several advantages, including improved bioavailability of traditional Chinese medicine components, passive targeting, sustained release capabilities, and masking of unpleasant tastes.
DMDD, a compound isolated from the root of carambola with a purity of ≥ 95%,23,24 exhibits pharmacological effects such as lowering blood sugar, anti-inflammatory properties, and anti-tumor activity.25,26 When the aforementioned nanoparticles’ characteristics are considered, it is possible to address the solubility issues of DMDD and significantly enhance its effectiveness. This study aims to prepare DMDD chitosan nanoparticles (DMDD-NPs) using the ion crosslinking method27 and employs the response surface methodology to optimize the preparation formulation.28 This research also investigates the impact of DMDD-NPs on the expression of key markers such as E-cadherin, vimentin, and TGF-β1 in high glucose-induced HK-2 cells.29
Materials and Methods
DMDD was extracted by the research team led by Hong-Liang Zhang at the College of Pharmacy of Guangxi Medical University, achieving a purity of ≥ 95%, as tested by Li et al24 Chitosan (CS), with a degree of deacetylation greater than 95% and a relative molecular weight of 50,000, was purchased from Macklin (Shanghai, CN). Sodium tripolyphosphate (TPP) was obtained from Chongqing Chemical Wansheng Chuandong Chemical Co. Ltd. (Chongqing, CN). Acetic acid was procured from Tianjin Science & Trade Chemical Reagent Co., Ltd (Tianjin, CN). Acetic acid was procured from Chengdu Kelong Chemical Co., Ltd (Chengdu, Sichuan Province, CN). Dimethylsulfoxide (DMSO) and phosphate buffer solution (PBS) were purchased from Solarbio (Beijing, CN), and Dulbecco’s Modified Eagle Medium (DMEM) was purchased from Gibco (New York, USA). The Cell Counting Kit-8 (CCK-8) assay was acquired from Meilun Bio (Dalian, Liaoning Province, CN). The AxyPrep Total RNA Small Dose Preparation Kit was obtained from Axygen (New York, USA), and Prime Script RT Master Mix was purchased from Takara (Tokyo, Japan). All other chemical reagents used were analytical grade. Human renal tubular epithelial (HK-2) cells were obtained from Procell (Wuhan, Hubei Province, CN).
The Formation of Key Nanoparticles Using the Ion Cross-Linking Method
Preparation of Chitosan nanoparticles (CS-NPs): CS was prepared by dissolving 100.0 mg in 100 mL of 1% v/v acetic acid solution. This mixture was stirred with a magnetic stirrer (Lichen DF101S/Z, Shanghai, CN) at room temperature for 1 h until the CS was completely swollen. The solution was filtered through 0.45 μm filter. The pH was adjusted to the desired level using 1 mol/L sodium hydroxide and acetic acid. In a separate procedure, 50.0 mg of TPP was dissolved in 50 mL of pure water and filtered through 0.22 μm filters. 10 mL of the prepared CS solution was transferred to a beaker and stirred at 300 rpm. TPP was gradually added to the CS solution through a 1 mL sterile syringe. The stirring continued for an additional 30 min at room temperature until the mixture became clear. The resulting solution was double-filtered using 0.22 μm filters to obtain CS-NPs.
The procedure for DMDD-NPs was adapted from that used for CS-NPs. The DMDD powder was dissolved in absolute ethanol and sonicated for 30s to achieve a concentration of approximately 4 mg/mL. Subsequently, 10 mL of the previously prepared CS solution was transferred to a beaker. Using a 1 mL sterile syringe, 0.75 mL of the DMDD solution was added dropwise (1 mL/5 min) while stirring at 300 rpm for 10 min. The TPP solution was gradually added to the mixture, stirring for 30 min until the solution became clear and transparent. The DMDD-NPs solution was filtered twice using 0.22 μm filters to ensure purity.
Characterization
The size and zeta potential of the nanoparticles were measured using a Malvern Zetasizer ZS90 (Malvern Instruments Ltd., Malvern, UK). Before testing, the nanoparticles were filtered through 0.22 μm microporous membranes. The zeta potential was assessed in the designated zeta sample pool. To prepare for transmission electron microscopy (TEM), the DMDD-NPs solution was centrifuged at 8000 rpm for 10 min at 4°C and washed twice with pure water before being redissolved in the same. The solution was placed on a copper net covered with a supporting film and air dried for 10 min. Subsequently, a drop of phosphotungstic acid solution was added for staining. After a 5 min wait, the excess solvent was removed, and the samples were analyzed using a TEM (Hitachi, Tokyo, Japan) to observe and photograph the nanoparticle morphology.
Encapsulation Efficiency and Drug Loading Rate
UV spectrophotometry was used to quantify DMDD encapsulation in DMDD-NPs. To discern any potential interference at the maximum absorption peak of DMDD, solutions of DMDD (20 μg/mL), CS-NPs, and TPP (1 mg/mL) were analyzed using UV spectrophotometry. DMDD was dissolved in anhydrous ethanol and diluted to concentrations of 100, 50, 20, 10, and 5 μg/mL using pure water, resulting in five samples. The absorbance at 269 nm was measured using an Agilent Gary 3500 UV spectrophotometer (Santa Clara, CA, USA), with triplicate readings taken to establish a linear regression equation for DMDD. The absorbance of the centrifuged DMDD-NP solution was measured at 269 nm, and the free DMDD content was calculated based on the standard curve.
The encapsulation efficiency (EE) and drug loading efficiency (DL) of DMDD-NPs were calculated using the method described by Yen et al30


Single Factor Assays
Six factors were investigated for their impact on particle size, polydispersity index (PDI), and zeta potential of DMDD-NPs: concentration of the CS solution, formulation of TPP and DMDD, pH value, mixing speed, and duration. Each factor was evaluated at five levels, maintaining a constant chitosan amount of 10 mg. Particle size, PDI, and zeta potential were measured using a Malvern Zetasizer ZS 90 (Malvern, UK).
Concentration of CS Solution
This section investigated the impact of varying CS concentrations on the nanoparticles’ particle size, PDI, and zeta potential. The nanoparticles were prepared according to the previously established protocol for DMDD-NPs. CS tested concentrations were 0.5, 1.0, 1.5, 2.0, and 2.5 mg/mL while maintaining the mass ratio of CS to TPP to DMDD at 10:4:3 (mg).
Formulation of TPP
The formulation of TPP is critical to preparing DMDD-NPs, as deviations in its quantity can significantly affect the outcome. To assess the impact of different TPP formulations on the particle size, PDI, and zeta potential of DMDD-NPs, the preparation protocol was adjusted solely in terms of TPP quantity. The preparation varied only in the amount of TPP, based on the foundational ratio of CS:TPP:DMDD at 10:X:3 (mg), where “X” denotes the TPP quantity, set at 2, 3, 4, 5, and 6 mg.
Formulation of DMDD
The primary active ingredient in the nanoparticles was DMDD. This study explored the effects of various DMDD formulations on the nanoparticle characteristics. The preparations adhered to a mass ratio of CS:TPP:DMDD of 10:4:X (mg), where “X” indicates the DMDD amounts tested, specifically 1, 2, 3, 4, and 5 mg.
pH Value of CS Solution
pH levels may influence the stability of dispersed systems, notably impacting the properties of CS. Therefore, to investigate the effect of pH on DMDD-NPs, different pH values of the CS solution were set at 3.5, 4.0, 4.5, 5.0, and 5.5.31 The CS:TPP:DMDD mass ratio was maintained at 10:4:3 (mg).
Agitation Speed
In nanoparticle manufacturing, the collision frequency between particles increases proportionally with the stirring speed, thereby increasing the probability of particle breakup and size reduction.32 This study investigated the impact of varying stirring rates on the outcome of DMDD-NP preparation. The stirring rates tested were 100, 200, 300, 500, and 1000 rpm.
Agitation Time
The preparation of DMDD-NPs requires sufficient agitation time for the ionic cross-linking reaction, yet an excessive duration may disrupt the nanoparticles. This study examined the effect of varying the stirring times to determine the optimal duration. The stirring times tested were 15, 30, 45, 60, and 120 min, while all other conditions were maintained constant.
Box-Behnken Design
According to the results of the single-factor experiments, the key factors that affect particle size, zeta potential, and PDI were identified as TPP (X1), DMDD (X2), and pH value (X3). These variables were selected as independent variables for a Box-Behnken design experiment involving three factors, each at three levels, as listed in Table 1.33,34 The evaluation indices for the Box-Behnken design included particle size (Y1), EE (Y2), and DL (Y3).
 |
Table 1 Factors and Levels of Box-Behnken Design |
Optimum Prescription Verification
To assess the optimal formulation recommended by the Box-Behnken design (Design Expert V8.0.6.1 software), three batches of DMDD-NPs were synthesized based on this formulation. The particle size, EE, and DL were measured and compared with the predicted values. The deviation between the actual and predicted values was calculated as follows:

Stability of DMDD-NPs
This study aimed to assess the stability of DMDD-NPs at 25°C. Three batches of DMDD-NPs solutions were sealed and stored at 25°C. The samples were collected at specified time points (days 1, 7, 14, and 28) to measure the particle size, zeta potential, and PDI.
Freeze-Drying of DMDD-NPs
Freeze-drying is a widely used technique for removing water to enhance the long-term stability of heat-labile or complex pharmaceuticals, such as proteins, vaccines, and nanoparticles.35 The freezing step in the lyophilization process can affect nanoparticle stability due to the increased concentration of particles in the freeze-concentrate, often making the product difficult to dissolve after direct freeze-drying. To mitigate this problem, using protective agents during freeze-drying is essential to improve solubility, facilitate dispersion, and preserve the integrity of the nanoparticles.36
We systematically compared different types of saccharides and polyols, glucose, sucrose, mannitol, and lactose, as lyoprotectants, along with their potential ratios for phage freeze-drying. First, the DMDD-NPs solution was centrifuged using a G16-MS high-speed freezing centrifuge (Thermo Fisher Scientific Shier Co., Ltd, Shanghai, CN) for 10 min (8000 rpm, 4°C), after which the supernatant was discarded. The remaining pellet was rinsed twice with pure water, and 0.05% (w/v) of a freeze-drying agent solution dissolved in pure water was added. The mixture was subjected to ultrasonic dispersion for 30s, then split into culture plates and placed flat in a freezer at −20°C for 4 h to form ice, ensuring that the ice layer did not exceed 0.5 cm.
The culture plates were sealed with a film punctured with air holes to prevent pressure-related issues, then placed in a pre-cooled freeze dryer (Germany) for 6 h until complete sublimation of the ice. The resulting freeze-dried powder was stored in a sealed container. To reconstitute the nanoparticles, the freeze-dried powder was dissolved in 1% (v/v) acetic acid, subjected to ultrasonic treatment for 5 min, filtered through 0.22 μm filters, and the particle size and PDI were measured using a Malvern particle size analyzer. The change in particle size before and after freeze-drying was calculated to evaluate the impact of different lyoprotectants on nanoparticle stability.


Chemical Structures
Fourier-transform infrared (FTIR) spectroscopy was performed using a Nicolet iS20 FTIR spectrometer (Waltham, Massachusetts, USA) on various specimens, including DMDD, freeze-dried CS-NPs, freeze-dried DMDD-NPs, and a mixture of freeze-dried CS-NPs and DMDD. For each sample, 2 mg of potassium bromide was added and ground with the sample using an agate mortar. The resulting mixture was pressed into tablets, and the transparent tablets were selected for infrared spectrum analysis.
In vitro Drug Release from DMDD-NPs
The cumulative release rate of DMDD-NPs was measured in vitro using a G16-MS high-speed freezing centrifuge (Thermo Fisher Scientific Shier Co., Ltd, Shanghai, CN) at 4°C. A specific volume of DMDD-NP suspension was placed in a conical flask containing 100 mL of physiological saline, adjusted to a pH of 4.5 using glacial acetic acid as a release medium. The flask was covered with plastic wrap to prevent evaporation, and the experiment was conducted with magnetic stirring at 37°C and a shaking speed of 100 rpm. The samples were collected at 0.5, 1, 2, 4, 8, 12, 24, 36, 48, 72, 96, and 120 h, with 2 mL of fresh release medium added after each collection. Each sample was centrifuged at 12,000 rpm, filtered through a 0.22 μm microporous membrane, and analyzed at 269 nm using a UV spectrophotometer (Beijing Purkinje General Instrument Co., Ltd, Beijing, CN).
Cell Culture
HK-2 cells were cultured in DMEM supplemented with 10% fetal bovine serum (FBS) in an incubator maintained at 37°C with 5% CO2. Once cells reached 80% confluence, they were digested with 0.25% trypsin for subculture or cryopreservation.
Assessment of Cell Proliferation and Toxicity
The CCK-8 assay was used to assess the effects of DMDD-NPs on HK-2 cell viability and to determine the optimal concentration of DMDD-NPs. Initially, 8×10³ HK-2 cells in 100 µL of medium were seeded in 96-well plates and incubated overnight. The following day, cells were treated with normal glucose and various concentrations of DMDD-NPs (0.375, 0.75, 1.5, 3, 6, 12, 24, 48, 96, and 192 μg/mL) for 48 h. After treatment, the medium was replaced with 100 µL of fresh medium containing 10% CCK-8 reagent and incubated at 37°C in the dark for 1 h. Absorbance was measured at 450 nm using a multifunctional enzyme reader (Biotek Synergy H1, USA).

As:experimental well (CCK-8, DMDD-NPs), Ac:control well (CCK-8), Ab:void well (CCK-8)
Scratch Assay
HK-2 cells were seeded at a density of 104 cells per well in 96-well plates and cultured until 95% confluency. A scratch was created using a 10 µL pipette tip, after which the culture medium was discarded, and the suspended cells were removed with PBS. Fresh medium containing 10% FBS and the appropriate treatments were added to the corresponding groups. The cells were divided into six groups: NC group (high glucose medium), DMDD group (high glucose medium + DMDD 3.0 μg/mL), CS-NPs group (high glucose medium + CS-NPs 20.0 μg/mL), and DMDD-NPs group (high glucose medium + DMDD-NPs 20.0 μg/mL). In all groups, “high glucose” refers to DMEM supplemented with 60 mM glucose. The images were captured between 0 and 48 h using an inverted fluorescence microscope (Leica DMi8, Solms, GER) and analyzed using ImageJ software.
qRT-PCR Analysis
The cells were divided into six experimental groups: NC group, DMDD group, CS-NPs group, and low/medium/high (L/M/H) DMDD-NPs dose groups. The NC group was treated with high glucose alone, while the DMDD group received high glucose and DMDD at a concentration of 4.5 μg/mL. The CS-NPs group was treated with high glucose and CS-NPs at 30.0 μg/mL. The DMDD-NPs L/M/H groups were exposed to high glucose and DMDD-NPs at 15, 30, and 45 μg/mL concentrations, respectively. All groups were cultured for 48 h. Total RNA was extracted using the AxyPrep Total RNA Small Preparation Kit (Axygen, New York, USA). For each sample, 1 μg of total RNA was reverse transcribed to double-stranded cDNA using PrimeScript RT Master Mix (Takara, Tokyo, Japan). Real-time PCR was performed using TB Green Premix Ex Taq II (Takara, Tokyo, Japan) on the CFX 96 Touch Real-Time PCR Detection System (Hercules, CA, USA). Glyceraldehyde-3-phosphate dehydrogenase(GAPDH) was used as the internal control for relative expression, and gene expression levels were calculated using the 2−ΔΔCt method. The sequences of the primers used for qRT-PCR assays are listed in Table 2.
 |
Table 2 Primers Used in qRT-PCR |
Statistical Analysis
Data were analyzed using SPSS 25.0 and GraphPad Prism 9.3.0 software. Continuous data are presented as mean ± standard deviation (SD), while categorical and ordinal data are expressed as composition ratios or percentages. The Chi-square test was used for categorical data, and the nonparametric rank sum test was used for ordinal data. Before analysis, continuous data were assessed for normality. If the data followed a normal distribution, an independent sample t-test was used for comparisons between groups, and a one-way analysis of variance (ANOVA) was performed for comparisons between multiple groups. Post-hoc analysis was conducted using the Student-Newman-Keuls (SNK) test to determine significant differences between groups. If normality assumptions were violated, the Mann–Whitney U rank sum test was used for comparisons between groups, and the Kruskal–Wallis H rank sum test was used for comparisons between multiple groups. Multiple comparisons were performed using the Dwass-Steel-Critchlow-Fligner (DSCF) method. A significance level of P < 0.05 was considered statistically significant, with all tests being two-tailed. The significance levels were annotated as follows: *P < 0.05, **P < 0.01, ***P < 0.001, ****P < 0.0001.
Results
Preparation of Nanoparticles
CS-NPs prepared by ionic crosslinking exhibited a light blue (Figure 1A), with a particle size of 200.33 ± 0.85 nm, a PDI of 0.28 ± 0.00, and a zeta potential of 36.57 ± 0.32 mV. The average length of DMDD-NPs was 307.53 ± 11.47 nm, with a PDI of 0.29 ± 0.05 and a zeta potential of 49.7 ± 1.78 mV. These results indicated that encapsulation DMDD increased the average particle size compared to that of blank nanoparticles. The DMDD solution appeared light yellow, giving the DMDD-NPs a yellowish-blue hue (Figure 1B). An interesting observation was made when the DMDD-NPs solution was gently shaken; the nanoparticles displayed an iridescent film visible to the naked eye, which was not observed during the initial preparation of DMDD-NPs or in the CS-NPs solution. This suggests that the phenomenon is unique to DMDD-NPs.
 |
Figure 1 (A) The CS-NPs solution. (B) The DMDD-NPs solution. Abbreviations: CS-NPs, Chitosan nanoparticles. DMDD-NPs, DMDD-loaded nanoparticles. |
Characterization of DMDD-NPs
The particle size distribution ranged from 100 to 800 nm, with a peak at 300 nm (Figure 2). The zeta potential of the nanoparticles was measured at 48.6 mV, and its distribution is shown in Figure 3. TEM analysis revealed that the DMDD-NPs were spherical, with a uniform size, and did not exhibit signs of breakage or adhesion. After high-speed freeze centrifugation and rinsing with pure water, no free DMDD was detected. Figure 4A and B show that the background was almost transparent, with only a small amount of free CS visible.
 |
Figure 2 The size distribution of DMDD-NPs. Abbreviation: DMDD-NPs, DMDD-loaded nanoparticles. |
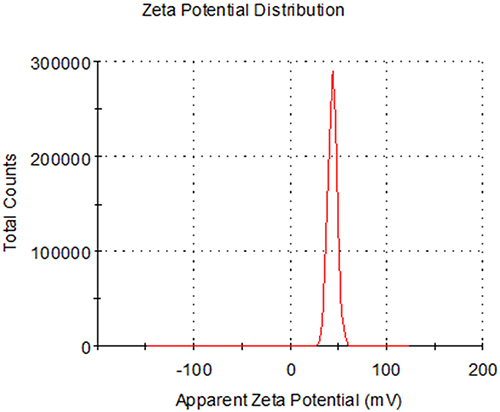 |
Figure 3 The zeta potential distribution of DMDD-NPs. Abbreviation: DMDD-NPs, DMDD-loaded nanoparticles. |
 |
Figure 4 The images of DMDD-NPs recorded by transmission electron microscopy. Abbreviation: DMDD-NPs, DMDD-loaded nanoparticles. |
Encapsulation Efficiency and Drug Loading Rate
DMDD exhibited maximum absorption at 269 nm, and the presence of DMDD-NPs did not interfere with this absorption. Figure 5 shows no additional peaks corresponding to DMDD, confirming that 269 nm was selected as the detection wavelength. The calibration curve for DMDD was linear over the concentration range of 3.125–100 μg/mL, with a correlation coefficient (R²) of 0.9995. The regression equation was as follows, where X represents the concentration of DMDD (μg/mL). The DMDD concentration was calculated using this calibration curve (Figure 6).

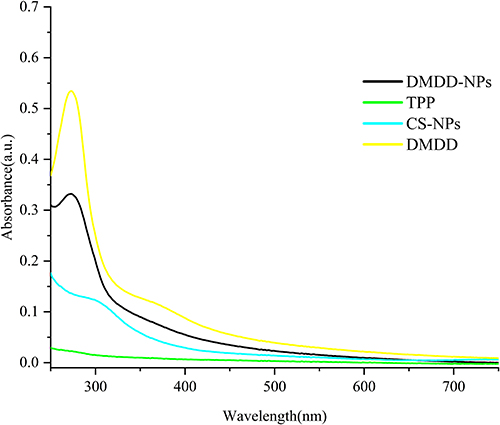 |
Figure 5 The UV absorption spectrums. Abbreviation: UV, ultraviolet. |
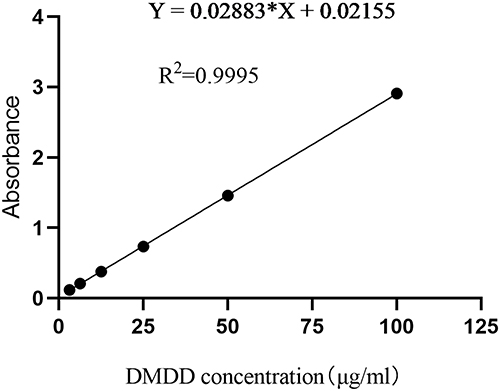 |
Figure 6 The standard curve of DMDD. Abbreviations: DMDD, 2-Dodecyl-6-methoxy-2,5-diene-1,4-cyclohexanedione. Notes: The excitation wavelength was set at 269 nm. |
Single Factor Assays
Concentration of CS Solution
According to Table 3, the optimal particle size, PDI, and zeta potential were achieved when the initial CS concentration was 1.0 mg/mL, resulting in the best overall performance. As the concentration of CS increased, the viscosity of the solution increased, leading to reduced stirring efficiency and excessive consumption of TPP. Conversely, a CS concentration of 0.5 mg/mL was too low relative to TPP, resulting in an excess of TPP upon addition to the CS solution, requiring longer reaction times and producing lower production efficiency. Based on these findings, the optimal concentration of CS was determined to be 1.0 mg/mL.
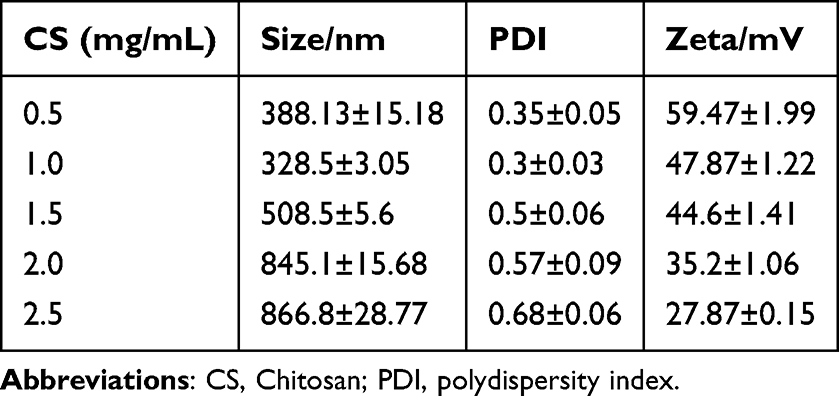 |
Table 3 Concentration of CS Solution |
Formulation of TPP
When the prescribed dose of TPP was 3 mg, corresponding to a CS:TPP:DMDD ratio of 10:3:3, the particle size was the smallest at 336.13 ± 6.85 nm, with a PDI of 0.30 ± 0.02 and a zeta potential of 50.53 ± 0.72 mV. Overall, this combination demonstrated the most favorable results (Table 4).
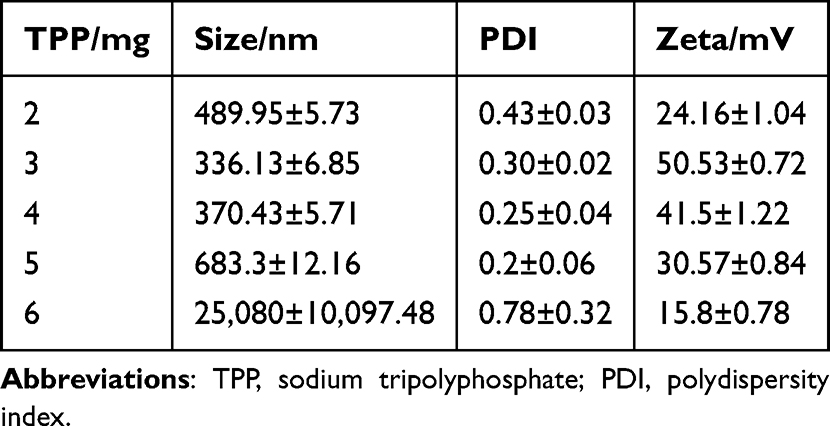 |
Table 4 Prescription of TPP |
Formulation of DMDD
As shown in Table 5, the particle size of the nanoparticles decreased with lower doses of DMDD. When the DMDD amount was 3 mg (CS:TPP:DMDD ratio 10:4:3), the particle size was 274.93 ± 3.59 nm, with a PDI of 0.38 ± 0.03 and a zeta potential of 44.1 ± 0.87 mV. However, when the DMDD concentration reached or exceeded 4 mg/mL, the particle size rapidly increased to over 400 nm, accompanied by an increase in PDI. Considering these factors, along with the drug loading efficiency of DMDD, the optimal DMDD concentration was determined to be 3 mg.
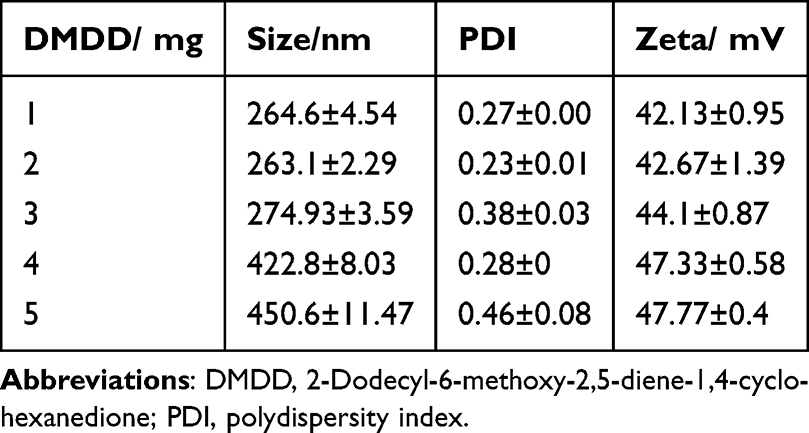 |
Table 5 Prescription of DMDD |
pH Value of CS Solution
The pH value of CS solution significantly affects the size and zeta potential of DMDD-NPs. As shown in Table 6, the particle size increased markedly at a pH of 5.5, exceeding 2000 nm, while the zeta potential dropped below 25 mV, indicating poor stability. In contrast, at a pH of 3.5, the particle size was the smallest, the zeta potential was the highest, and the PDI was within a reasonable range, leading to improved system stability and a simpler preparation process.
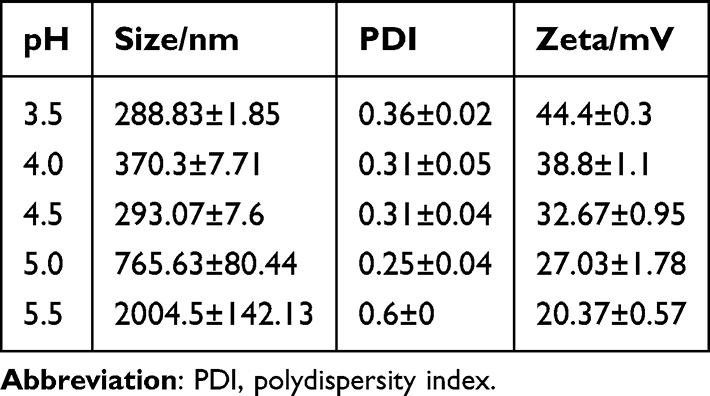 |
Table 6 pH Value of CS Solution |
Agitation Rate
According to Table 7, particle size and the PDI increased when the magnetic stirring speed was below 200 rpm. However, the particle size was minimized at an agitation speed of 500 rpm, indicating that 500 rpm is the optimal stirring speed.
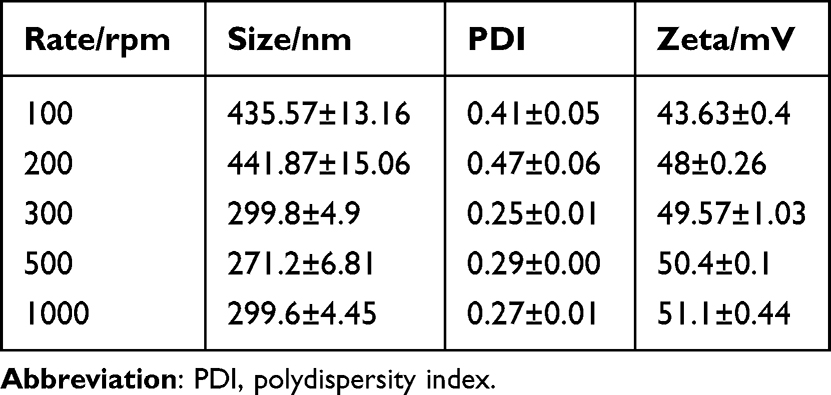 |
Table 7 Agitation Speed |
Agitation Time
When stirred for 15 min, the nanoparticle size and PDI were relatively large, likely indicating incomplete formation and instability of the nanoparticles. However, after stirring for more than 30 min, both the particle size and PDI decreased. Considering that longer stirring time also increases costs, stirring for 30 min appears to be the preferred option, as shown in Table 8.
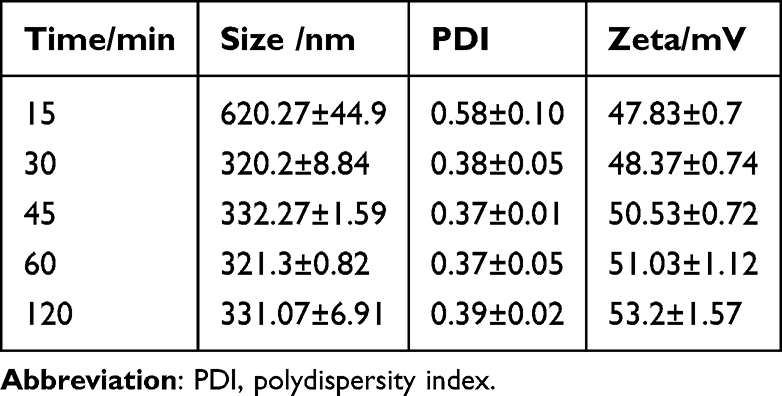 |
Table 8 Agitation Time |
Box-Behnken Design
Table 9 was generated using Design Expert 8.0.6 software to guide the experiment series. The results were documented after conducting experiments based on this design, and the particle size, EE, and DL were statistically analyzed.
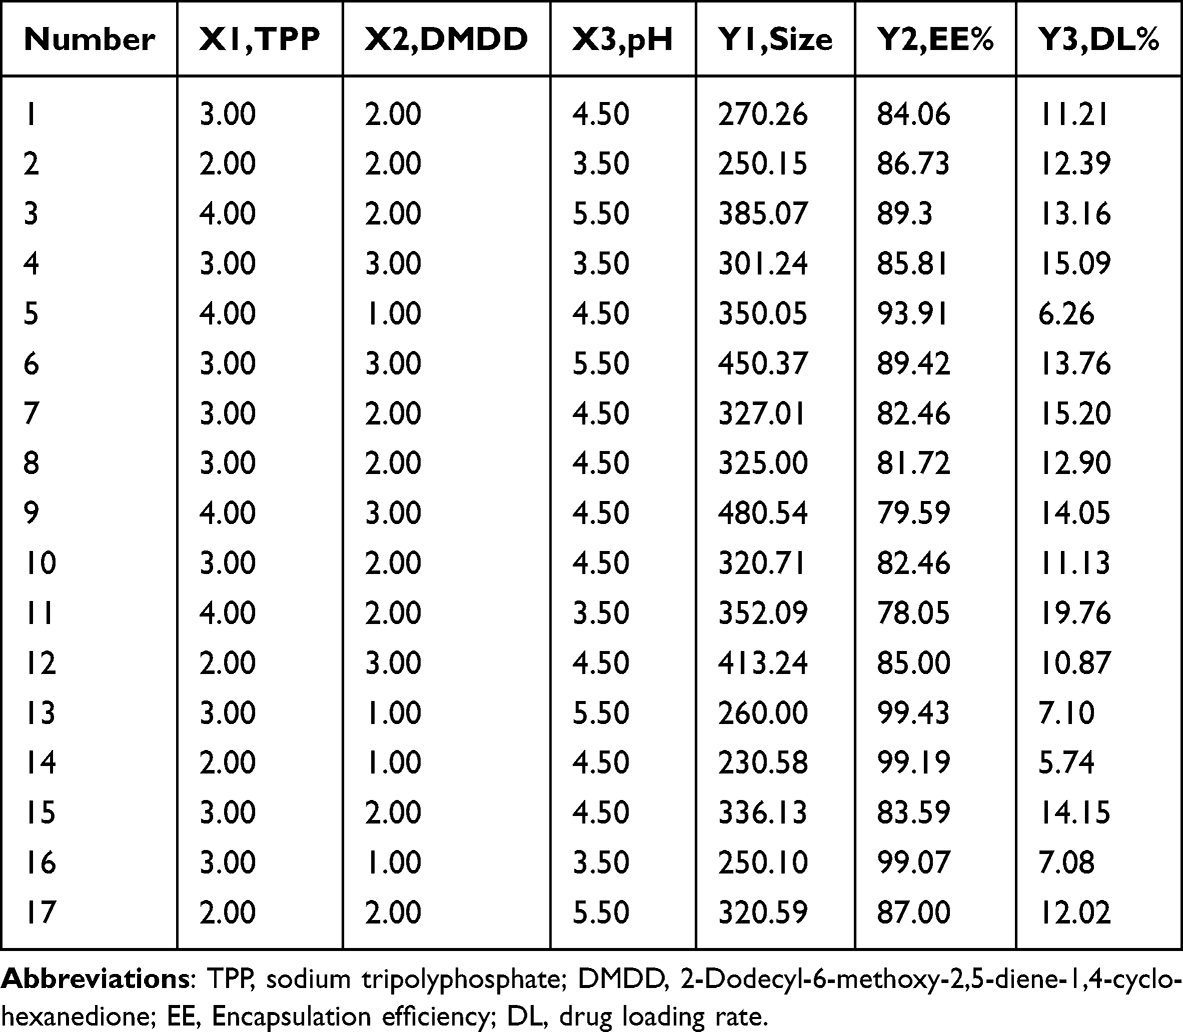 |
Table 9 Box-Behnken Design and Assay Result |
The regression equation for size is the following: Size = + 315.82 + 44.15A + 69.33B + 32.81C - 13.04AB −9.36AC + 34.81BC + 32.16A2 + 20.62B2 - 21.01C2. According to the equation, the factors influencing particle size are ranked in order B > A > C, corresponding to DMDD > TPP > pH. Additionally, there are interrelated factors that affect each other, with detailed analysis results shown in Table 10. The model indicates that factor B is the most significant factor (P < 0.0001), while factors A and C are also significant (P < 0.01). The interactions between BC and A² are statistically significant (P < 0.05). The surface plots that illustrate the influence of each factor are shown in Figure 7.
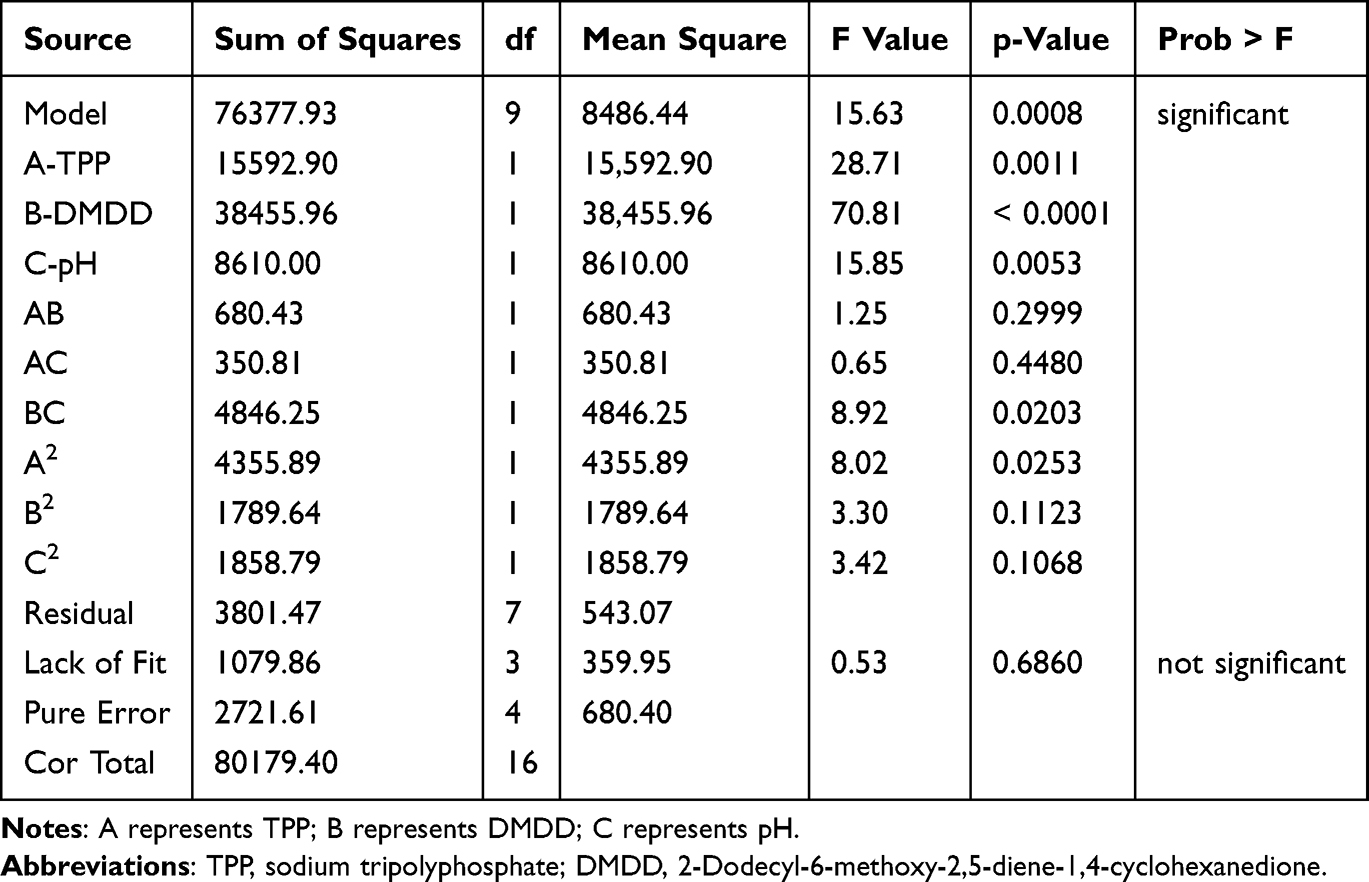 |
Table 10 Statistical Analysis of Box-Behnken Design |
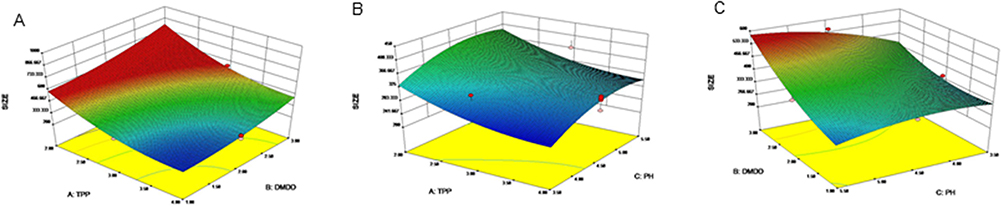 |
Figure 7 DMDD-NPs’ 3D surface fitting of particle size. (A) The side of TPP and DMDD. (B) The side of TPP and pH. (C) The side of DMDD and pH. Abbreviations: 3D, three dimension. DMDD-NPs, DMDD-loaded nanoparticles. |
The regression equation for the encapsulation efficiency is EE% = +82.86–2.13A - 6.47B + 1.93C - 0.033AB + 2.75AC + 0.81BC - 0.80A2 + 7.36B2 + 3.21C2. It can be observed from the formula that the factors influencing encapsulation efficiency, in descending order of importance, are B > A > C, corresponding to DMDD > TPP > pH. Table 11 and Figure 8 present the analysis of cross-influencing factors. According to the model, B and B² show the highest significance (P < 0.0001), while A, C, AC, and C² are also significant (P < 0.01).
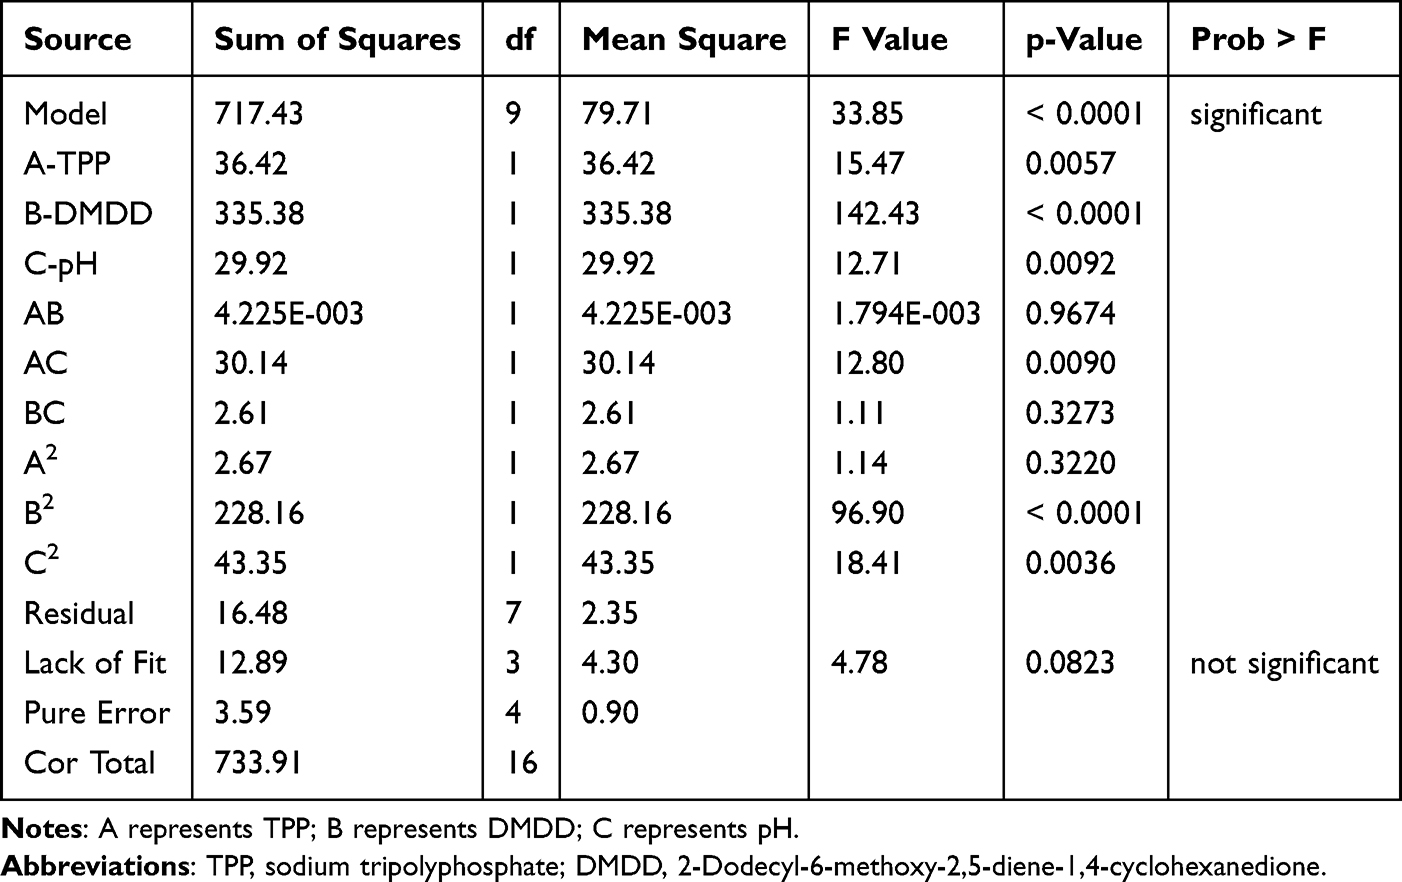 |
Table 11 The analysis of Encapsulation Efficiency |
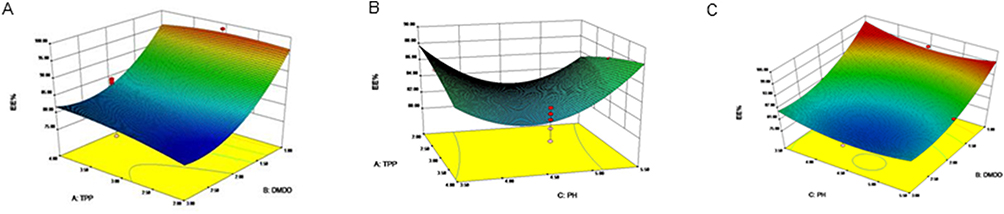 |
Figure 8 DMDD-NPs’ 3D surface fitting of encapsulation efficiency. (A) The side of TPP and MDD. (B) The side of TPP and pH. (C) The side of pH and DMDD. Abbreviations: 3D, three dimension. DMDD-NPs, DMDD-loaded nanoparticles. |
The regression equation for the drug loading rate is expressed as DL% = +12.92 + 1.53A + 3.45B - 1.04C + 0.66AB - 1.56AC - 0.34BC - 0.056A2 - 3.63B2 + 1.47C2. According to the equation, in descending order of importance, the factors that influence particle size are B > A > C, representing DMDD > TPP > pH. Table 12 presents the analysis of interrelated factors. The model indicates that factor B is highly significant (P < 0.001), B² is significant (P < 0.01), and factor A is also significant (P < 0.05). Surface interaction diagrams for each factor are shown in Figure 9.
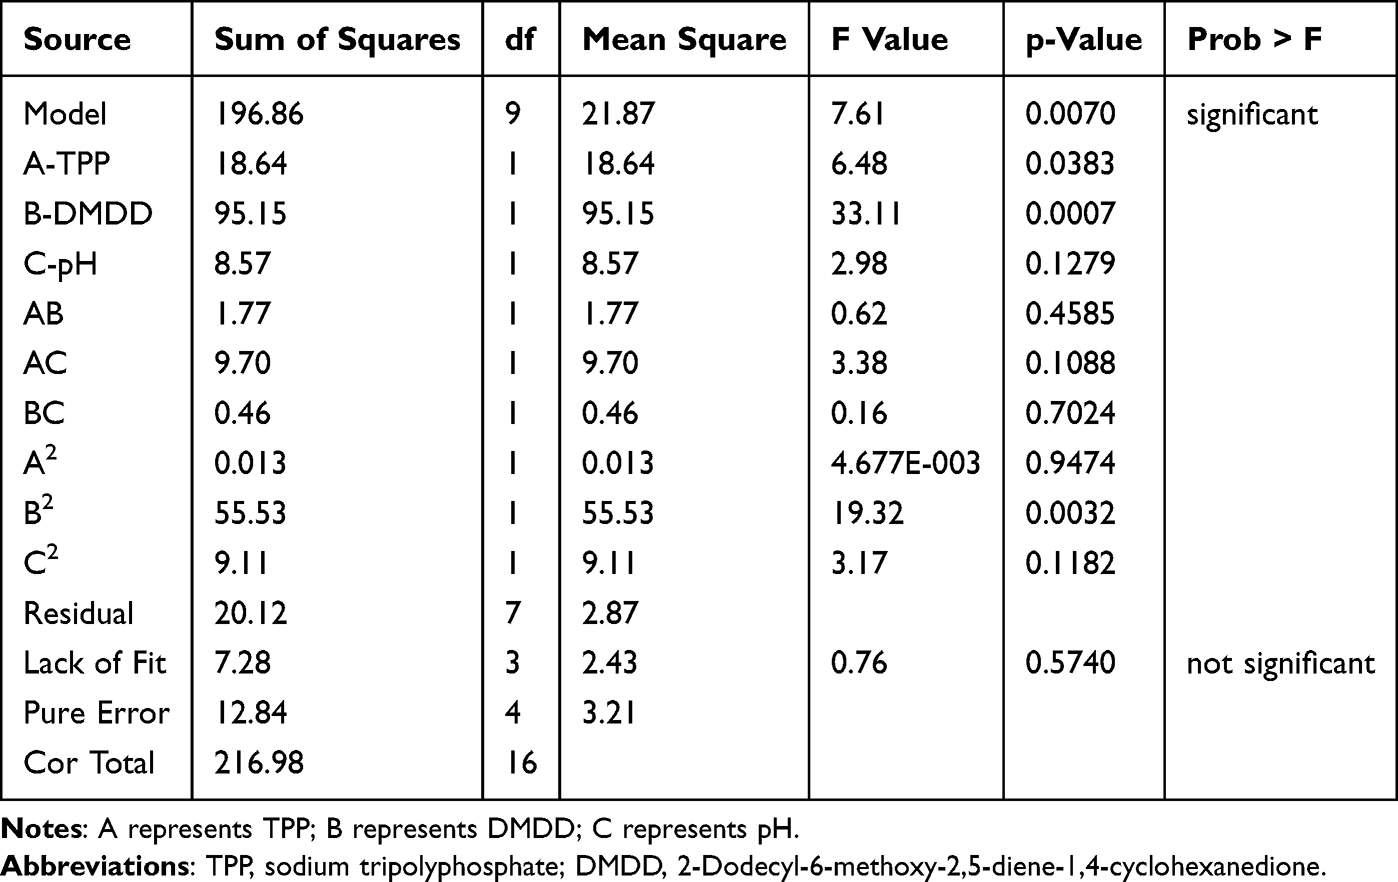 |
Table 12 The analysis of Drug Loading Rate |
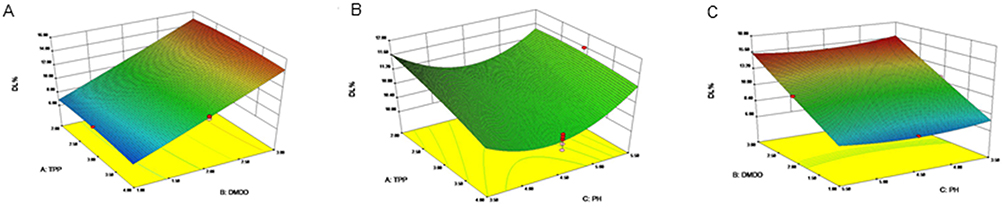 |
Figure 9 DMDD-NPs’ 3D surface fitting of drug loading rate. (A) The side of TPP and DMDD. (B) The side of TPP and pH. (C) The side of DMDD and pH. Abbreviations: 3D, three dimension. DMDD-NPs, DMDD-loaded nanoparticles. |
Verification of the Optimum Prescription
The average particle size of three batches of DMDD-NPs prepared using the optimal formula was 326.3 ± 3.56 nm, with an EE of 86.31 ± 2.17% and an average drug loading rate of 14.32 ± 0.97%. All values align closely with the predicted outcomes. Details are shown in Table 13.
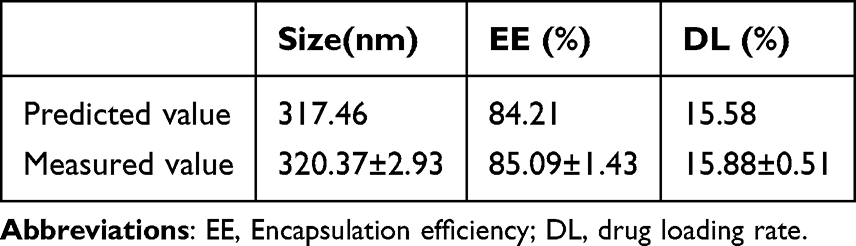 |
Table 13 Verification of the Best Prescription |
Stability of DMDD-NPs
DMDD-NPs maintained long-term stability at 25°C for the first 7 days, followed by an increase in PDI. After 14 days, the nanoparticle size and the zeta potential decreased, possibly due to leakage. By day 28, the leak had stabilized, resulting in more uniform particle size and a corresponding decrease in PDI. Table 14 summarizes these findings.
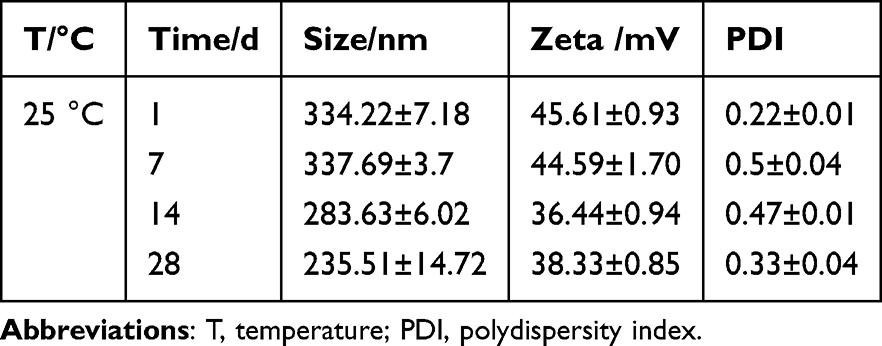 |
Table 14 The Stability test of DMDD-NPs |
Freeze-Drying of DMDD-NPs
Table 15 shows that the combination of 0.05% (w/v) mannitol and lactose exhibited excellent freeze-drying protective effects, with no significant changes in particle size or PDI after freeze-drying. This combination was identified as an ideal lyoprotectant, leading to only a 0.9% change in particle size and effectively maintaining the long-term stability of the freeze-dried nanoparticles.
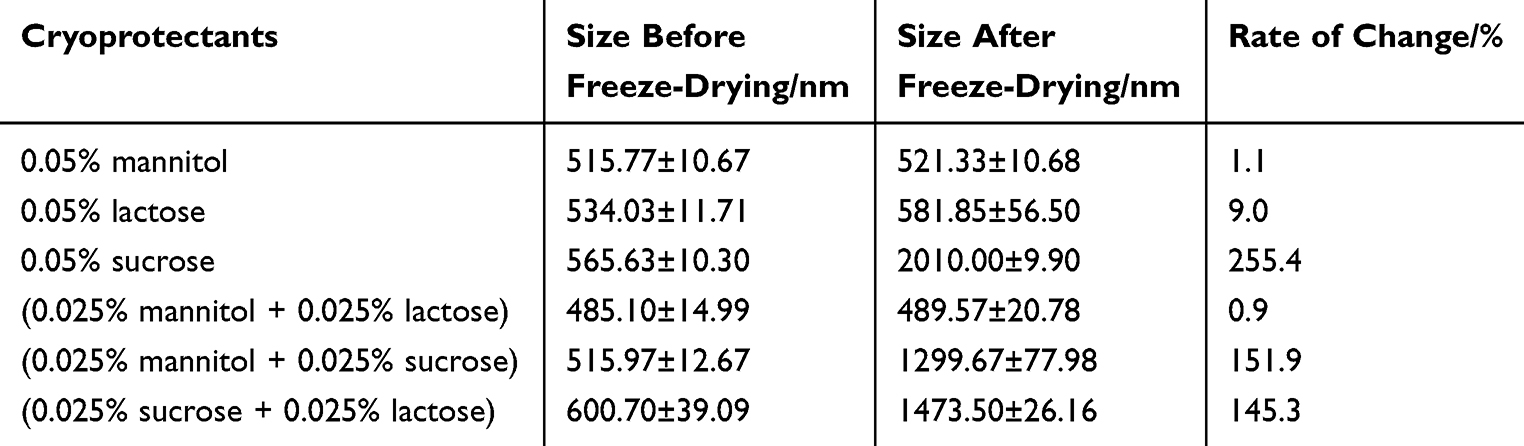 |
Table 15 The Freeze-Drying Test of DMDD-NPs |
Chemical Structure of DMDD-NPs
Figure 10A shows the infrared spectrum of DMDD, while Figure 10B represents the infrared spectrum of dry powder containing both DMDD and CS-NPs, and Figure 10C depicts CS-NPs alone. In Figure 10B, the characteristic absorption bands of DMDD and CS-NPs remain distinct, even after physical mixing. Furthermore, the spectrum in Figure 10D, corresponding to DMDD-NPs, combines the characteristic bands of the previous spectra without introducing any new peaks, indicating that no additional products were formed during the preparation of DMDD-NPs. The functional groups of DMDD-NPs, prepared via an aminoacylation reaction, were characterized using infrared spectroscopy.
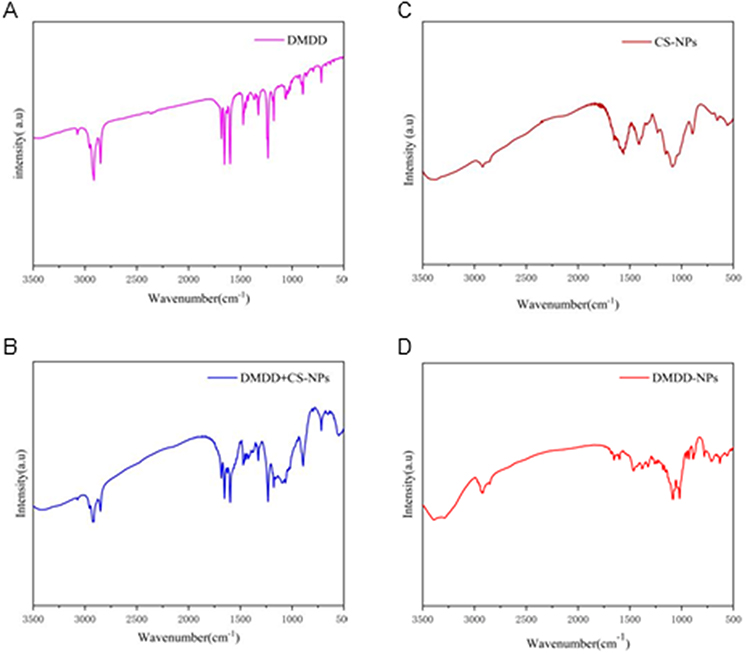 |
Figure 10 FTIR spectroscopy. (A) DMDD. (B) CS-NPs. (C) DMDD mixed with CS-NPs. (D) DMDD-NPs. Abbreviations: FTIR, Fourier-transform infrared (FTIR); DMDD, 2-Dodecyl-6-methoxy-2,5-diene-1,4-cyclohexanedione; CS-NPs, Chitosan nanoparticles; DMDD-NPs, DMDD-loaded nanoparticles. |
In vitro Drug Release from DMDD-NPs
As shown in Figure 11, the release of DMDD-NPs in physiological saline followed a slow-release pattern during the first 8 h, followed by a faster release phase between 8 and 72 h. The release rate had stabilized by the 72 h mark, resulting in a sustained slow release. The cumulative release rate after 120 h was measured at 88.05 ± 1.68%, demonstrating a significant sustained release effect. Upon analysis, the release of DMDD-NPs closely followed the Higuchi model, with an R² value of 0.98261.
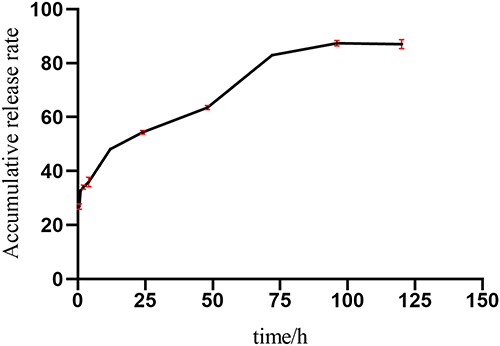 |
Figure 11 DMDD-NPs accumulative release diagram in vitro. Abbreviations: 3D, three dimension. DMDD-NPs, DMDD-loaded nanoparticles. |
DMDD-NPs Effects on HK-2 Cell
The Proliferate Activity of HK-2 Cells by the CCK-8 Assay
As shown in Figure 12, when the concentration of DMDD-NPs was below 24 μg/mL (with a drug loading rate of 15.2%), the survival rate of HK-2 cells exceeded 100%. This suggests that DMDD-NPs demonstrated excellent biological safety and promoted the proliferation of HK-2 cells at concentrations below this threshold, indicating a promising potential for drug development.
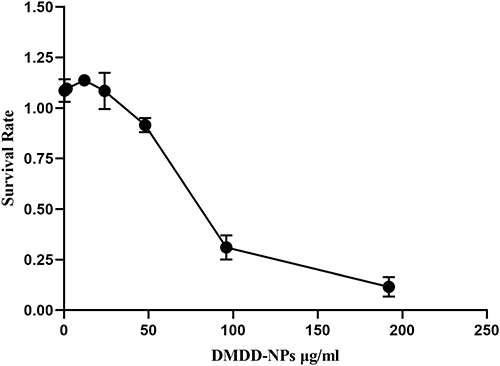 |
Figure 12 Cell proliferation activity test by CCK-8. Abbreviation: CCK-8, the Cell Counting Kit-8. |
Scratch Assay
After 48 h of high glucose stimulation, the scratch gap in the NC group of HK-2 cells appeared nearly healed. In contrast, the DMDD group showed relatively flat profiles, with significant gaps still present. The CS-NPs group exhibited larger scratch gaps than the NC group, although the uneven scratch area was also near healing. Notably, the DMDD-NPs group showed wider scratch gaps than those of both the DMDD and CS-NPs groups, with the scratch appearing as smooth as that in the DMDD group. These findings suggest that DMDD effectively inhibits HK-2 cell migration induced by high glucose and that the inhibitory effect of DMDD-NPs surpasses that of DMDD alone. These results are illustrated in Figure 13.
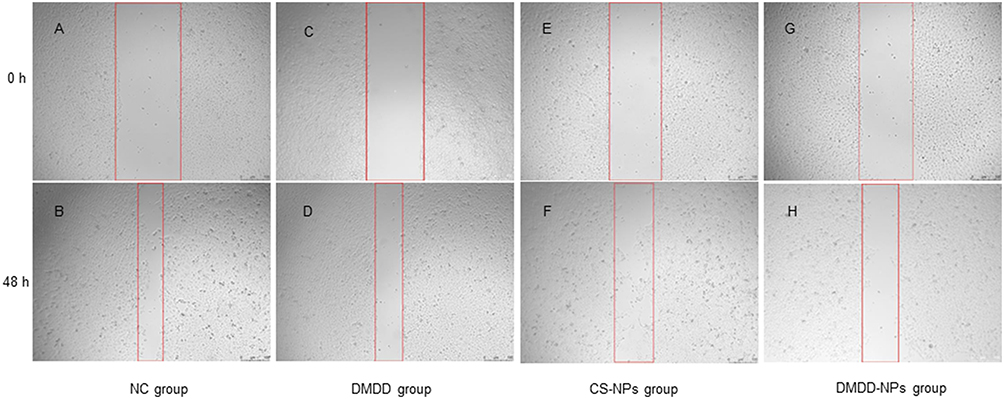 |
Figure 13 Cell experimental diagram of scratch at 0 h and 48 h. (A), (B) NC group. (C), (D) DMDD group. (E), (F) CS-NPs group. (G),(H) DMDD-NPs group. (A), (C), (E),and (G) were photoed at 0 h, (B), (D), (F),and (H) were photoed at 48 h. Abbreviations: DMDD, 2-Dodecyl-6-methoxy-2,5-diene-1,4-cyclohexanedione; CS-NPs, Chitosan nanoparticles; DMDD-NPs, DMDD-loaded nanoparticles. |
qRT-PCR Analysis
The Expression of E-Cadherin
As shown in Figure 14A, compared to the NC group, E-Cadherin expression increased in all DMDD-NPs L/M/H groups, indicating that DMDD-NPs increased E-Cadherin expression in a dose-dependent manner. Compared to the DMDD group, E-Cadherin expression was significantly higher in the DMDD-NPs M group and markedly higher in the DMDD-NPs H group. These results suggest that DMDD-NPs enhanced E-Cadherin expression more effectively than the same dose of DMDD, while CS-NPs did not exhibit a similar effect.
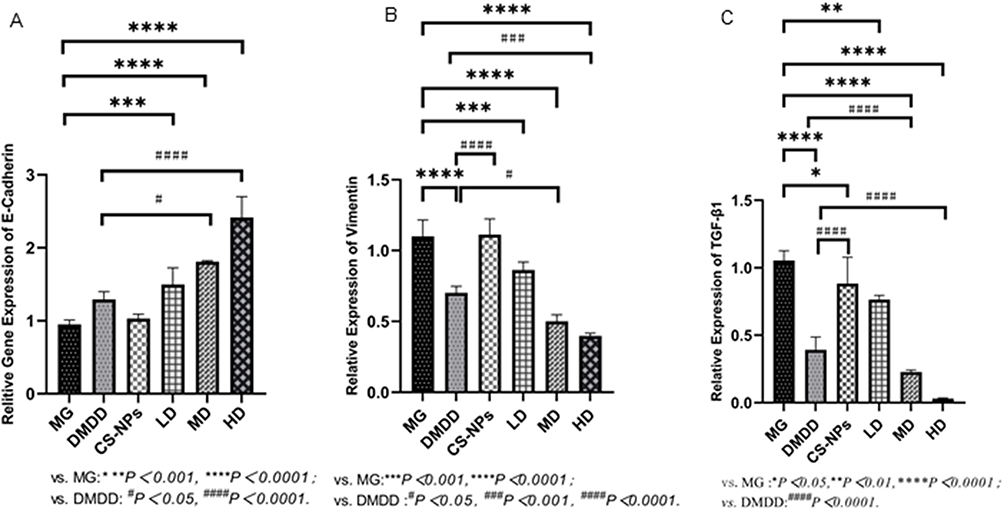 |
Figure 14 The qRT-PCR analysis. (A) The expression of E-cadherin. (B) The Expression of Vimentin. (C) The Expression of TGF-β1. Abbreviation: TGF-β1, Transforming Growth Factor-β1. |
The Expression of Vimentin
Figure 14B illustrates the expression of vimentin. Compared to the NC group, vimentin expression was significantly decreased in both the DMDD and DMDD-NPs groups, with the most pronounced reductions observed in the M and H dosage groups. This suggests that both DMDD and DMDD-NPs can inhibit vimentin expression, with statistically significant differences. In contrast, vimentin expression was significantly higher in the CS-NPs group compared to the DMDD group, indicating no inhibitory effect. Vimentin expression was further down-regulated in the DMDD-NPs M and H groups. In conclusion, DMDD-NPs exhibited a more substantial inhibitory effect on vimentin expression than DMDD alone.
The Expression of TGF-β1
Compared to the NC group, TGF-β1 expression was significantly reduced in the DMDD group and in the DMDD-NPs M and H dosage groups. The CS-NPs group also showed a slight reduction in TGF-β1 expression (*P < 0.05), but its levels were significantly higher than the DMDD group. In contrast, the DMDD-NPs M and H groups exhibited substantially lower TGF-β1 levels. Notably, the expression of TGF-β1 in the DMDD-NPs M dose group was similar to that of the DMDD group. These findings are supported by the statistical analysis presented in Figure 14C.
Discussion
In this investigation, drug-loaded nanoparticles exhibited a distinct visual appearance upon reaching a specific concentration. On visual observation, fine DMDD nanoparticles were suspended in the solution with an oil film-like color. In contrast, CS-NPs did not display this characteristic, likely due to their small size but large quantity. The DMDD encapsulated within the nanoparticles appeared to generate a fluctuating oil film resembling tiny oil droplets. When light interacted with this film’s front and rear surfaces, coated with a transparent chitosan layer, it produced varying colors.36 This optical effect became more pronounced when the container was agitated, and the small size of the DMDD-NPs contributed to this phenomenon.37 Furthermore, when DMDD was introduced into a chitosan solution without TPP, the solution appeared yellow and slightly cloudy. However, with the continued addition of TPP and stirring, the solution gradually became more apparent, indicating successful encapsulation of DMDD.
The single-factor experiments were to explore the basic preparation method of DMDD-NPs with acceptable size, zeta potential and PDI, and Box-Behnken design was to optimize. We found the particle size of the nanoparticles is influenced by the ratio of CS to TPP at 5:1 ratio results in larger particles due to incomplete crosslinking, while ratios of 10:3 or 10:4 yield smaller particles. However, a 5:3 ratio leads to flocculent precipitation caused by excess TPP, producing particles larger than 20,000 nm, far exceeding the acceptable range of 1 to 1000 nm.38 The ionic crosslinking method to prepare chitosan nanoparticles is based on the positive charge of the primary amino groups of chitosan in acidic solutions that react with the negatively charged TPP to form crosslinked nanoparticles.39 Strict control of TPP is crucial, as the reaction is irreversible. What’s more, the pH level affect the Ionic crosslinking also the stability of DMDD-NPs, pH 3.5 proved to be the best choice.
CS is a biopolymer known for its biodegradability, biocompatibility, and low toxicity. However, its limited solubility in non-acidic media poses a challenge for its use. pH has a significant influence on the chitosan molecules in solution. Under acidic conditions, protonation of -NH2 to -NH3+ results in strong electrostatic interactions between molecules. Additionally, chitosan hydroxyl and acetylamino groups promote strong intramolecular hydrogen bonds.24 As pH increases, the protonation of -NH3+ to -NH2, due to alkali neutralization, reduces electrostatic interactions while improving hydrogen bond formation, expanding the system viscosity. At a pH of 5.5, the interaction between chitosan and TPP becomes insufficient, reducing zeta potential, compromising nanoparticle structure, and increasing particle size, PDI, and reduced stability.
Based on the results of the Box-Behnken experiment, a series of alternative experimental schemes were developed based on varying particle size, drug loading rate, and encapsulation efficiency. The experiment focused on a particle size range of 250–350 nm. Within this range, the nanoparticles exhibited relatively high drug loading and encapsulation rates, with a preference for higher encapsulation efficiency. The optimal formulation identified was CS:TPP:DMDD = 10:3:3, resulting in small particle sizes, high encapsulation efficiency, and drug loading rates, which aligned well with the study objectives.
Diabetic nephropathy is one of the main microangiopathes associated with diabetes mellitus, characterized by persistent albuminuria and/or a progressive decline in glomerular filtration rate in clinical settings. The mortality rate due to disability is significant until the disease progresses to end-stage renal disease.40 Injury to renal tubular epithelial cells is closely related to diabetic nephropathy,41 with prolonged exposure to high glucose levels resulting in excessive production of reactive oxygen species (ROS) that damage renal cells. Research indicates that tubulointerstitial lesions correlate with worsening renal function in chronic kidney disease related to diabetes.42 E-cadherin, a calcium-dependent transmembrane glycoprotein that facilitates cell-cell adhesion, is crucial for maintaining the integrity and polarity of renal tubular epithelial cells. Reduced E-cadherin expression indicates EMT in renal tubular cells,43,44 a key event in the progression of diabetic nephropathy and renal fibrosis,45 the main pathological change observed in DKD.
Research has shown that in DKD, overexpression of miRNA-21 directly suppresses Smad7 and PTEN expression, resulting in the up-regulation of the mesenchymal markers vimentin and αSMA, downregulation of E-cadherin expression, and increased fibronectin (FN) levels, ultimately leading to renal fibrosis. DMDD-NPs have been shown to enhance E-cadherin expression and inhibit vimentin, thus preventing EMT, protecting HK-2 cells, and ameliorating renal fibrosis in DKD. Prolonged protein loss is associated with high TGF-betha levels. In DKD, where there is prolonged protein loss, this certainly causes a high potential for kidney fibrosis related to DKD.46 Studies highlight the crucial role of TGF-β1 and its downstream signaling proteins Smad3 and Smad7 in diabetic kidney injury. The TGF-β1/Smad pathway modulates the initiation and progression of diabetic nephropathy through various miRNAs and lncRNAs.47 DMDD-NPs can suppress TGF-β1 expression, thus impeding the onset and progression of DKD. In summary, DMDD-NPs slow EMT progression by enhancing E-cadherin expression and inhibiting vimentin and TGF-β1 expression, representing a promising therapeutic approach for DKD.
Advances in nanomedicine have revolutionized drug formulation, leading to improvements in bioavailability, reduced toxicity, and controlled release. Integrating hydrophobic drugs into nanomedicines has significantly improved solubility, stability, and efficacy while minimizing side effects.48 However, many researches on nano-drugs only lingered in the experimental stage in vitro, In vivo and clinical trials should be further strengthened.
Conclusion
DMDD-NPs were successfully prepared using the green ion cross-linking method, demonstrating optimal particle size, zeta potential, encapsulation efficiency, and drug loading rate. The nanoparticles exhibited excellent physical properties and sustained release behavior in vitro. DMDD-NPs revolutionized drug formulation, improved bioavailability, reduced toxicity, and allowed controlled release. DMDD-NPs showed better DKD treatment effect compared to DMDD, in vivo animal experiments of this delivery system need to be carried out in the future.
Acknowledgments
This work was supported by grants from the Guangxi Zhuangzu Autonomous Region Traditional Chinese Medicine Management Bureau (GZSY20-10), the Guangxi Key Research & Development Plan (2023AB23075) and the Guangxi Natural Science Foundation (2022JJA140478).
Disclosure
The authors report no conflicts of interest in this work.
References
1. Shahzad K, Ghosh S, Mathew A, et al. Methods to Detect Endoplasmic Reticulum Stress and Apoptosis in Diabetic Nephropathy. Methods Mol Biol. 2020;2067:153–173.
2. Selby NM, Taal MW. An updated overview of diabetic nephropathy: diagnosis, prognosis, treatment goals and latest guidelines. Diabetes Obes Metab. 2020;22(S1):3–15. doi:10.1111/dom.14007
3. Tuttle Katherine R, Anderson Pamela W. A novel potential therapy for diabetic nephropathy and vascular complications: protein kinase C beta inhibition. Am J Kidney Dis. 2003;42(3):456–465. doi:10.1016/S0272-6386(03)00741-8
4. Zhilong L, Junwei W, Peipei Z, et al. Acteosides alleviates apoptosis of HK2 cells induced by high glucose throughakt/Mtor signaling pathway. J Shanxi Med Univ. 2023;54(8):1092–1099.
5. Qiuyuan X. Research progress of diabetic renal angiopathy. Cardiovascular Dis J Integr Tradit Chin Western Med. 2016;4(35):135.
6. Alicic RZ, Rooney MT, Tuttle KR. Diabetic kidney disease: challenges, progress, and possibilities. Clin J Am Soc Nephrol. 2017;12(12):2032–2045. doi:10.2215/CJN.11491116
7. Klionsky DJ, Abdel-Aziz AK, Abdelfatah S, et al. Guidelines for the use and interpretation of assays for monitoring autophagy. Auto-Phagy. 2021;17(1):1–382.
8. Wei J, Wei X, Caihong W, et al. Traditional Chinese Medicine Intervenes Mitochondrial Autophagy to Treat Diabetic Nephropathy research progress. Maths Medical. 2024;37(2):136–143.
9. Hu Q, Chen Y, Deng X, et al. Diabetic nephropathy: focusing on patho-logical signals, clinical treatment, and dietary regulation. Biomed Pharma-Cother. 2023;159:114252. doi:10.1016/j.biopha.2023.114252
10. Liu Z, Nan P, Gong Y, et al. Endoplasmic reticulum stress-triggered ferroptosis via the XBP1-Hrd1-Nrf2 pathway induces EMT progression in diabetic nephropathy. Biomed Pharmacother. 2023;164:114897. doi:10.1016/j.biopha.2023.114897
11. Zhang L, H YL, Shergis J, et al. Chinese herbal medicine for diabetic kidney disease: a systematic review and meta-analysis of randomised placebo-controlled trials. BMJ Open. 2019;9(4):253–256.
12. Mingqi LI, Yuehong MA, Xiaolu ZHAO, et al. Research progress on the relationship between epithelial mesenchymal transformation and hepatic fibrosis. Chin J Pharmacovigi. 2024;2024 1–9.
13. Wenxia Y, Wen Y, Enlai D, et al. Role of podocyte injury signaling pathway in steroid-resistant nephrotic syndrome and research progress in traditional Chinese medicine intervention. China J Chin Metaria Medica. 2023;48(12):32–46.
14. Yanxu C, Xiaoxue J, Qinyuan Z, et al. Role of TGF-β /Smad signaling pathway in diabetic kidney disease and research progress of traditional Chinese medicine intervention. China J Chin Metaria Medica. 2023;48(10):26–30.
15. Yawen D, Jin L, Dongping C. Modified Fangji Huangqi Decoction alleviates renal interstitial fibrosis by inhibiting TGF-β1/Smad/Snail signaling pathway during epithelial-mesenchymal transition. China J Chin Mater Med. 2024. 49. 1–12.
16. Hoang NH, Le Thanh T, Sangpueak R, et al. Chitosan nanoparticles-based ionic gelation method: a promising candidate for plant disease management. Polymers. 2022;14(4):662. doi:10.3390/polym14040662
17. Gadziński P, Froelich A, Jadach B, et al. Ionotropic gelation and chemical crosslinking as methods for fabrication of modified-release gellan gum-based drug delivery systems. Pharmaceutics. 2023;15(1):1.
18. Wathoni N, Herdiana Y, Suhandi C, et al. Chitosan/Alginate-Based Nanoparticles for Antibacterial Agents Delivery. Int J Nanomed. 2024;19:5021–5044. doi:10.2147/IJN.S469572
19. Domingues C, Santos A, Alvarez-Lorenzo C, et al. Where Is Nano Today and Where Is It Headed? A Review of Nanomedicine and the Dilemma of Nanotoxicology. ACS Nano. 2022;16(7):9994–10041. doi:10.1021/acsnano.2c00128
20. Zhou Q, Xiang J, Qiu N, et al. Tumor Abnormality-Oriented Nanomedicine Design. Chem Rev. 2023;123(18):10920–10989. doi:10.1021/acs.chemrev.3c00062
21. Liu J, Li S, Wang J, et al. Application of Nano Drug Delivery System (NDDS) in Cancer Therapy: a Perspective. Recent Pat Anticancer Drug Discov. 2023;18(2):125–132. doi:10.2174/1574892817666220713150521
22. Qingwei W, Chunxia C, Xingmei L, et al. Isolation, Identification and Determination for Benzoquinone Compounds from Averrhoa carambola Roo. Chin J Exp Traditional Med Formulae. 2014;20(11):70–73.
23. Li J, Pang Q, Huang X, et al. 2-Dodecyl-6-Methoxycyclohexa-2, 5-Diene-1, 4-Dione isolated from Averrhoa carambola L. root inhibits high glucose-induced EMT in HK-2 cells through targeting the regulation of miR-21-5p/Smad7 signaling pathway. Biomed Pharmacother. 2024;172:116280. doi:10.1016/j.biopha.2024.116280
24. Lu S, Zhang H, Wei X, et al. 2-dodecyl-6-methoxycyclohexa-2,5-diene-1,4 -dione isolated from Averrhoa carambola L. root ameliorates diabetic nephropathy by inhibiting the TLR4/MyD88/NF-κB pathway. Diabetes Metab Syndr Obes. 2019;Volume 12:1355–1363. doi:10.2147/DMSO.S209436
25. Rensong S, Jianbin Z, Jiani F, et al. Application of chitosan nanoparticles as drug delivery system in cancer treatment. China J Clin Pharmacol Therapeut. 2021;26(1):65–75.
26. Tian B, Qiao X, Guo S, et al. Synthesis of β-acids loaded chitosan-sodium tripolyphosphate nanoparticle towards controlled release, antibacterial and anticancer activity. Int J Biol Macromol. 2024;257(Pt2):128719. doi:10.1016/j.ijbiomac.2023.128719
27. Xiqiang XU, Wang X, Wang Y, et al. Preparation process optimization of cinnamon essential oil-loaded chitosan nanoparticles by response surface methodology and their quality evaluation. China J Hospital Pharm. 2023;43(5):508–514.
28. Xiaoya N, Han D. Advances in the mechanism of. Pract J Clin Med. 2023;20(04):177–181.
29. Hongbin L, Xunlian G, Qian L, et al. Preparation process optimization and antibacterial activity analysis of nano-chitosan particles. Food Ferment Ind. 2020;46(3):110–117.
30. Weiyan S, Zhiwe S, Fan Z, et al. Preparation of Chitosan/Sulfobutyl-β-cyclodextrin Nanoparticles and Its Effect on Physical Properties of Sodium Alginate Film. Food Sci. 2021;42(4):161–167.
31. Agrawal M, Saraf S, Pradhan M, et al. Design and optimization of curcumin loaded nano lipid carrier system using Box-Behnken design. Biomed Pharmacother. 2021;141:111–119. doi:10.1016/j.biopha.2021.111919
32. Manimohan M, Pugalmani S, Sithique MA. Biologically active water soluble novel biopolymer/hydrazide based O-carboxymethyl chitosan Schiff bases: synthesis and characterisation. J Inorg Organomet Polym Mater. 2020;30(9):3658–3676. doi:10.1007/s10904-020-01487-9
33. Park K. Prevention of nanoparticle aggregation during freeze-drying. J Control Release. 2017;248:153. doi:10.1016/j.jconrel.2017.01.038
34. Weicheng CHEN, Junxiong YAN, Guojie CHEN. Development of Dust Measuring Appara-tus Based on Dynamic Light Scattering. Res Explorat Lab. 2011;30(7):23–25+33.
35. Luo WC, Zhang W, Kim R, et al. Impact of controlled ice nucleation and lyoprotectants on nanoparticle stability during Freeze-drying and upon storage. Int J Pharm. 2023;641:123084. doi:10.1016/j.ijpharm.2023.123084
36. Cui Z, Zhiju L, Dehai L. Light scattering technology in the study of polymer characterization. Acta Polym Sinica. 2022;53(01):90–106.
37. Chunhui L, Yue W. Research progress on application of nanoparticle technology in medicine field. Strait Pharm J. 2013;25(1):18–22.
38. Qun G, Guojian W, Wentao L. Study on Molecular Conformation of Chitosan in Dilute Solution. Chemistry. 2009;72:1–6.
39. Xingke L, wei Z, Yinliang Z, et al. The Effects of Deacetylation Degree, pH and Ionic Strength on Rheological Properties of Chitosan Solution. Mod Food Sci Technol. 2013;29(1):11–14.
40. Xiaochen W, Xiaoyan M, Chengjun G. Construction of Risk Factors and Predictive Models for the Progression of Diabetic Kidney Disease. J Liaoning Univ TCM. 2023;25(01):161–170.
41. Yuxin X, Yin Y. Research Progress of Diabetic Tubulopathy. J Kunming Med Univ. 2023;44(9):148–154.
42. Meiling Q, Chunli W, Yanling C, et al. Effect of ginkgolide B on renal tubular epithelial cell apoptosis induced by high glucose by regulating miR-155-5p. J North Sichuan Medl Coll. 2024;39(2):150–155.
43. Hongxin C, Xiaoping Y, Jin Z. E-cadherin and renal interstitial fibrosis. J Clin Exp Medi. 2010;9(15):1184–1186.
44. Liu M, Liu L, Bai M, et al. Hypoxia-induced activation of Twist/miR-214/ E-cadherin axis promotes renal tubular epithelial cell mesenchymal transition and renal fibrosis. Biochem Biophys Res Commun. 2018;495(3):2324–2330. doi:10.1016/j.bbrc.2017.12.130
45. Yanling P, Hongying F, Hongmin C, et al. Study on Tangtongyin Inhibiting Renal Fibrosis of Diabetic Kidney Disease by Targeting microRNA-21 to Regulate Smad7 and PTEN. J Chinese Med Mater. 2023;31(8):2023–2029.
46. Widiasta A, Wahyudi K, Sribudiani Y, et al. The level of transforming growth factor-β as a possible predictor of cyclophosphamide response in children with steroid-resistant nephrotic syndrome. Biomedicine. 2021;11(3):3):68–75. doi:10.37796/2211-8039.1205
47. Nuoqi Z, Guohui Y, Yaling W. Research progress of miRNA based on TGF-β1/ Smads signaling pathway in myocardial fibrosis. J Hebei Med Univ. 2024;45(1):89–93.
48. Suryani S, Chaerunisaa AY, Joni IM, et al. The Chemical Modification to Improve Solubility of Chitosan and Its Derivatives Application, Preparation Method, Toxicity as a Nanoparticles. Nanotechnol. Sci Appl. 2024;17:41–57.
 © 2024 The Author(s). This work is published and licensed by Dove Medical Press Limited. The
full terms of this license are available at https://www.dovepress.com/terms.php
and incorporate the Creative Commons Attribution
- Non Commercial (unported, 3.0) License.
By accessing the work you hereby accept the Terms. Non-commercial uses of the work are permitted
without any further permission from Dove Medical Press Limited, provided the work is properly
attributed. For permission for commercial use of this work, please see paragraphs 4.2 and 5 of our Terms.
© 2024 The Author(s). This work is published and licensed by Dove Medical Press Limited. The
full terms of this license are available at https://www.dovepress.com/terms.php
and incorporate the Creative Commons Attribution
- Non Commercial (unported, 3.0) License.
By accessing the work you hereby accept the Terms. Non-commercial uses of the work are permitted
without any further permission from Dove Medical Press Limited, provided the work is properly
attributed. For permission for commercial use of this work, please see paragraphs 4.2 and 5 of our Terms.