")
Back to Journals » Journal of Inflammation Research » Volume 18
Comprehensive Analysis of Multi-Omics Data on RNA Polymerase as an Adverse Factor in Head and Neck Squamous Cell Carcinoma
Authors Gu YJ, Zhang J, Liu YJ , Zhang Q, Geng QF
Received 27 September 2024
Accepted for publication 18 January 2025
Published 1 March 2025 Volume 2025:18 Pages 3067—3091
DOI https://doi.org/10.2147/JIR.S496748
Checked for plagiarism Yes
Review by Single anonymous peer review
Peer reviewer comments 2
Editor who approved publication: Dr Tara Strutt
Yu-Jia Gu,1,* Jie Zhang,2,* Yuan-Jie Liu,3 Qian Zhang,4 Qi-Feng Geng1
1The Fifth Outpatient Department, Nanjing Stomatological Hospital, Affiliated Hospital of Medical School, Institute of Stomatology, Nanjing University, Nanjing, Jiangsu, 210029, People’s Republic of China; 2Department of Gynecology, Jiangsu Province Hospital and Nanjing Medical University First Affiliated Hospital, Nanjing, Jiangsu, 210029, People’s Republic of China; 3Department of Oncology, Affiliated Hospital of Nanjing University of Chinese Medicine, Jiangsu Province Hospital of Chinese Medicine, Nanjing, Jiangsu, 210029, People’s Republic of China; 4No. 1 Clinical Medical College, Nanjing University of Chinese Medicine, Nanjing, Jiangsu, 210023, People’s Republic of China
*These authors contributed equally to this work
Correspondence: Qi-Feng Geng, Email [email protected]
Background: High transcription levels are essential for cancer cells to maintain their malignant phenotype. While RNA polymerases (POLRs) have been implicated in various transcriptional mechanisms, their impact on the tumor microenvironment (TME) remains poorly understood.
Methods: We analyzed publicly available pan-cancer cohorts to evaluate the expression and genomic alterations of POLRs. Focusing on head and neck squamous cell carcinoma (HNSC), we integrated bulk RNA sequencing, single-cell, and spatial transcriptome data to identify POLR2C expression patterns and its potential regulation by Yin Yang 1 (YY1). In vitro and in vivo experiments were conducted to validate the functional role of the YY1-POLR2C axis in cancer proliferation and immune modulation.
Results: POLRs were found to be aberrantly expressed in cancers and associated with genomic alterations. In HNSC, POLR up-regulation was linked to poor prognostic features. POLR2C was significantly up-regulated in malignant cells, and its expression appeared to be transcriptionally regulated by YY1. Functional studies demonstrated that the YY1-POLR2C axis drives cell-cycle dysregulation and malignant proliferation in HNSC. Additionally, high POLR expression negatively correlated with immune cell infiltration and facilitated immune evasion. Mechanistically, POLRs mediated frequent interactions between malignant and immune cells, potentially contributing to resistance to immunotherapy.
Conclusion: This study highlights the dual role of POLRs in promoting malignant proliferation and shaping an immunosuppressive TME. POLR2C, regulated by YY1, emerges as a critical mediator in HNSC and a promising target for precision therapies.
Keywords: head and neck squamous cell carcinoma, RNA polymerases, multi-omics analysis, immunosuppression, YY1 transcription factor, tumor microenvironment
Introduction
Head and neck squamous cell carcinoma (HNSC) originates in the squamous cells, which are the thin, flat cells lining the moist surfaces of the head and neck.1 These areas include the oral cavity, larynx (voice box), pharynx (throat), sinuses, and nasal cavity. HNSC is a highly aggressive cancer, with treatment and prognosis varying based on the stage, location, and other factors.2
RNA polymerases (POLRs) are pivotal enzymes in various biological systems, crucial for the transcription process. They catalyze RNA synthesis from DNA or RNA templates.3 Discovered in the 1960s by Samuel Weiss and Jacques Monod, POLRs have been a major focus of molecular biology research.4 The fundamental characteristic of POLRs lies in its ability to recognize and bind to specific DNA or RNA sequences, known as promoters, initiating the transcription process. The enzymes then synthesize an RNA strand complementary to the template strand.5 The structures of POLRs vary among organisms and typically comprises multiple protein subunits that function cooperatively.6,7 In summary, POLRs are crucial enzymes in the transcription machinery of all living organisms. Their ability to synthesize RNA from genetic templates is fundamental to gene expression and cellular process regulation.8
In cancer, the abnormal activation or suppression of certain genes drives tumor growth, progression, and metastasis.9 POLRs, due to their role in transcribing genetic information into RNA, are intricately linked to this deregulation. Altered expression or mutant forms of POLRs can contribute to cancer development by affecting the transcription of oncogenes, which promote tumor growth, or tumor suppressor genes, which inhibit tumor growth.10 Importantly, POLRs facilitate the transcription of key cell cycle regulatory genes, such as Cyclin D1 and Cyclin E1, driving cancer cells from the G1 to the S phase and accelerating cell division. Additionally, by downregulating tumor suppressor genes like p53 and p21, POLRs further impair cell cycle checkpoints, allowing cancer cells to evade growth control.
In this study, we analyzed the gene expression features of 34 POLRs in pan-cancer datasets, comparing normal and tumor tissues. Our findings revealed that genetic alterations, including mutations, DNA methylation, and copy number variations, significantly affect POLR expression. Focusing on HNSC, we identified POLRs as prognostic biomarkers in multiple independent publicly available datasets. Single-cell and spatial transcriptomics provided clear evidence that POLRs are associated with cell-cycle dysregulation. Further in vivo and in vitro experiments confirmed that the YY1-POLR2C axis stimulates cancer cell proliferation by promoting cell-cycle progression. Additionally, we established that high POLR expression may reduce immune infiltration and is linked to MIF signaling between cancer cells and T cells.
Materials and Methods
Supplementary material includes detailed information on all of the reagents and antibodies used in this investigation (Table S1). Antibody concentrations were employed as recommended by manufacturers or based on previous studies.
Public Bulk Datasets and Corresponding Processing
For the pan-cancer data in the Cancer Genome Atlas (TCGA), analyses were conducted using the Gene Set Cancer Analysis (GSCA) web tool.11 For the HNSC data, which included TCGA-HNSC and four Gene Expression Omnibus (GEO) datasets,12 we utilized the Biomarker Exploration of Solid Tumors (BEST) database13 to assign each HNSC sample a POLR score through built-in gene set variation analysis (GSVA).14 Subsequent analyses included clinical correlation analysis, functional enrichment, and immune estimation. Additionally, pathology image data were downloaded from the Genomic Data Commons (GDC) portal.15
Machine Learning
For key gene selection, we constructed a machine learning-based integration model from transcriptomic data (TCGA-HNSC) using the “Mime” package.16 The tool integrates multiple algorithms from traditional regression, machine learning and deep learning.
scRNA-Seq Data Analyses
The single-cell RNA-seq (scRNA-seq) data used in this study, including GSE103322 (HNSC), GSE172577 (oral squamous carcinoma, OSCC), and GSE150321 (laryngeal squamous carcinoma, LSCC), were obtained from the Tumor Immune Single Cell Hub (TISCH).17 We utilized the uniform manifold approximation and projection (UMAP) coordinates and cell annotation information provided by TISCH without additional processing. Basic visualization was performed using the “SCpubr” package, with all parameters set to default.18
Based on POLR information from the HUGO web tool, we scored all cells using the “AUCell” package.19 Higher AUC values indicate higher levels of POLR expression in the cells. The median level was set as the threshold; cells with AUC values above the threshold were defined as the high-POLR group, while those below were defined as the low-POLR group. To compare the differences in communication networks between these groups, we used the inbuilt ligand and receptor information from the “CellChat” package and performed relevant visualizations.20,21
Spatial Transcriptome (ST) Analysis
ST analyses were conducted on the SpatialTME online website.22
Tissue Collection and Immunohistochemical Staining (IHC)
Cancer and paracancerous tissues were extracted from the initial diagnostic biopsy. The patients had not undergone chemotherapy, radiation, or any other anticancer treatments. The ethics committee of the Affiliated Hospital of Nanjing University of Chinese Medicine approved the study protocol, and informed consent was obtained from both physicians and patients for the use of tissues in research (Ethics approval number: 2022NL-162-02). The tissues were embedded in paraffin, sliced, and mounted onto slides. IHC was conducted according to a standardized protocol.23 The IHC score, also known as the H-score, was calculated as previously described.24 Two pathologists independently performed the pathological diagnosis.
Cell Culture
The human tongue squamous carcinoma cell line CAL-27 (CL-0265) and the human pharynx squamous cancer cell line FaDu (CL-0083) were obtained from Wuhan Pu-nuo-sai Life Technology Co. Ltd. (Wuhan, China). These cell lines were cultured in Dulbecco’s modified Eagle medium (DMEM) supplemented with 10% fetal bovine serum (FBS) at 37°C in a 5% CO2 atmosphere. The identities of these cell lines were verified through short tandem repeat (STR) profiling.
Lentiviral Vector and Plasmid Construction and Transfection
All plasmids and lentiviruses were designed and manufactured by GeneChem. Detailed information on the creation of various plasmids, as well as the production of lentiviruses and plasmids, is provided in Table S2. The transfection process was carried out according to the manufacturer’s instructions. The accuracy of transduction, knockdown, and overexpression was assessed via Western blotting (WB) (Figure S1A-B). The protocol with the highest transfection efficacy was selected.
Western Blot Assay
The WB assay was conducted according to previously established protocols.25 Cell lysis was performed using radioimmunoprecipitation (RIPA) buffer to extract proteins, which were then quantified using the Bradford assay.26 Each sample was subjected to sodium dodecyl-sulphate polyacrylamide gel electrophoresis (SDS-PAGE) (10% or 15%) to isolate approximately 20 µg of protein, which was then transferred onto a PVDF membrane. The membrane was blocked with 5% bovine serum albumin (BSA), incubated with specific primary antibodies overnight at 4°C, washed three times with Tris-buffered saline + Tween-20 (0.05%), and subsequently incubated with corresponding secondary antibodies. β-actin and GAPDH served as internal controls.
Luciferase Reporter Assay
Luciferase reporter assay was performed as previously described.27 The luciferase reporter assay was conducted using the Dual-Luciferase Reporter Assay System (Promega). Cells were co-transfected with firefly luciferase reporter plasmids and Renilla luciferase plasmids as an internal control. After 48 hours of transfection, cells were lysed, and luciferase activity was measured using the dual luciferase assay kit. The assay involved the sequential addition of the Luciferase Assay Reagent II (LAR II) to measure firefly luciferase activity, followed by the Stop & Glo Reagent to measure Renilla luciferase activity. Luminescence was detected using a microplate luminometer. The firefly luciferase activity was normalized to the Renilla luciferase activity to control for transfection efficiency.
Colony Formation Assays
We seeded 500 CAL-27 and FaDu cells in 6-well plates with POLR2C overexpression (oe-POLR2C), POLR2C overexpression combined with YY1 knockdown (oe-POLR2C+si-YY1), negative control plasmid (NC), and control. The cells were incubated for approximately 14 days. After incubation, the cells were stained with 0.5% crystal violet for 10 minutes at room temperature (20–25 °C). The colonies were then counted under a stereomicroscope (SMZ-2T, Nikon, Tokyo, Japan).
TUNEL Staining Analysis
The TUNEL staining kit was used to perform the TUNEL assay, following standard techniques.28 CAL-27 and FaDu cells were seeded at a density of 5 × 10^5 cells per 60-mm plate using cell-climbing slices. After 48 hours of transfection with various plasmids, the cells were stained using the TUNEL assay. Cancer samples were preserved and processed using standard histopathology methods.29 Tissue sections or cell slices were treated in the dark with a TDT enzyme at 37 °C for one hour. Following this, they were rinsed with buffer to stop the reaction and then stained with DAPI. TUNEL-negative (blue) and TUNEL-positive (yellow) cells were observed using a fluorescent microscope (Olympus CKX-41, Japan) at ×200 magnification.
The Xenograft Tumor Model
The in vivo experiments were approved by the animal ethics committee of the Affiliated Hospital of Nanjing University of Chinese Medicine (Approval No. 2024DW-033-01). This study adhered to the Animal Research: Reporting of In Vivo Experiments (ARRIVE) guidelines. Male BALB/c nude mice (4 weeks old, 18–22 g) were purchased from Zhejiang Weitong Lihua Experimental Animal Technology Co., Ltd. (Certificate No. SYXK2019-0010). FaDu cells (5 × 10⁶) were injected subcutaneously into the right armpit of each mouse. The cells were stably transfected with oe-POLR2C, oe-POLR2C+si-YY1, NC, or a control group. Six mice were used in each experimental group. Tumor presence was detected 7 days post-injection. Tumor dimensions (largest and smallest diameters) were measured bi-weekly. On day 28, the mice were euthanized with CO2 in accordance with the American Veterinary Medical Association’s (AVMA) Guidelines for Humane Animal Euthanasia. Tumor volumes were calculated using the formula V = 1/2ab2 (where “a” and “b” denote tumor length and width in mm), and growth curves were generated.
Isolation of Human Peripheral Blood T Cells
T cells were isolated from the peripheral blood of newly diagnosed HNSC patients who had not undergone radiotherapy or chemotherapy. The process involved the following steps: first, peripheral blood mononuclear cells (PBMCs) were separated using Ficoll density gradient centrifugation; subsequently, CD3+ T cells were isolated from PBMCs using magnetic bead sorting according to the manufacturer’s instructions; finally, the purity of the sorted T cells was assessed, confirming a purity of over 95% (as shown in Figure S2). This method ensured the acquisition of highly pure T cells for subsequent functional and phenotypic studies.
Immunofluorescence
Cells were seeded onto glass slides in 24-well culture plates. After indicated treatment, cells were fixed with formaldehyde (4%) and permeabilized with 0.3% Triton X-100. The slides were then washed by PBS and incubated with primary antibodies overnight. Next, the slides were stained with appropriate secondary antibodies and 4, 6-diamidino-2-phenylindole (DAPI).
The tyramide signal amplification (TSA) system was employed to evaluate cancer samples via multicolor immunofluorescence. Briefly, the tissue specimens were sectioned, dewaxed, rehydrated, and subjected to hydrogen peroxide (H2O2) treatment for heat-induced epitope retrieval (HIER). They were then blocked with 3% bovine serum albumin (BSA) to prevent nonspecific interactions. Following this, the samples were labeled with primary antibodies and incubated with horseradish peroxidase (HRP)-conjugated anti-rabbit secondary antibodies and fluorescent tyramide. Subsequently, the sections underwent additional HIER, BSA blocking, and antibody staining. Finally, the nuclei were counterstained with DAPI and visualized using a fluorescence microscope (Nikon, DS-Qi1MC, Tokyo, Japan).
Results
Pan-Cancer Analysis of POLR Subunits
We obtained data on 34 RNA polymerase (POLR) subunit-coding genes from the Hugo Gene Nomenclature Committee (HUGO) database.30 The 34 genes are POLR1A, POLR1B, POLR1C, POLR1D, POLR1E, POLR1F, POLR1G, POLR1H, POLR2A, POLR2B, POLR2C, POLR2D, POLR2E, POLR2F, POLR2G, POLR2H, POLR2I, POLR2J, POLR2J2, POLR2J3, POLR2K, POLR2L, POLR2M, POLR3A, POLR3B, POLR3C, POLR3D, POLR3E, POLR3F, POLR3G, POLR3GL, POLR3H, CRCP, and POLR3K. We first generated a network diagram using the Network Analyst tool to illustrate the interactions between POLRs and related molecules (Figure S3). To determine the association between POLRs and the prognosis of cancer patients, we created two heatmaps showing overall survival (OS) and progression-free interval (PFI). As depicted in Figures 1A-B, high expression levels of POLRs were unfavorable prognostic factors in most tumors, except for bile duct cancer (CHOL), large B-cell lymphoma (DLBC), kidney clear cell carcinoma (KIRC), thymoma (THYM), and endometrioid cancer (UCEC). Next, we performed GSVA to convert the transcript levels of the POLR genes into enrichment scores, and employed the Wilcoxon test to compare POLR differences across 14 different cancer types (each containing more than 10 paired tumor and normal samples). The results indicated that POLRs were significantly up-regulated in a wide range of cancers (Figure 1C). Additionally, we analyzed POLR expression differences in cases with various pathological stages within the pan-cancer cohort and identified predominantly positive correlations (Figure 1D). These findings suggest that POLRs are hyperactivated in cancer and may contribute to disease progression. To further investigate the cause of POLR transcriptional dysregulation, we analyzed single nucleotide variations (SNVs) and copy number variants (CNVs) in the TCGA pan-cancer data. For SNVs, POLR1A, POLR2A, POLR2B, POLR3B, and POLR3A were found to be frequently mutated in UCEC and SKCM (Figure 1E). Among the 1271 patients analyzed, 982 (77.26%) exhibited at least one mutation (Figure 1F). POLR2A exhibited the highest mutation frequency (19%), followed by POLR1A (18%) and POLR2B (15%). Missense mutations were the most common mutation type, with melanoma (TCGA-SKCM) being the most frequently mutating cancer type (Figure 1F). Our results suggested that SNV may be a factor causing abnormal POLR expression in cancer. Other studies also reported frequent mutations of POLR genes.31 Next, we investigated the copy number variation (CNV) events of POLRs in pan-cancer. Individual POLR displayed a cancer type-dependent pattern of amplification or deletion. We found that the CNV events of 34 POLRs in pan-cancer varied considerably, with heterozygous amplifications and deletions being the most common (Figure S4A). Conversely, homozygous CNV events were less prevalent (Figure S4B and Figure 1G). We then confirmed that CNV is an important factor that can potentially affect the expression of POLRs. As shown in Figure 1H, CNV and mRNA expression levels were positively correlated in most cancer types, especially in breast cancer (BRCA). Additionally, we observed that the level of POLR gene methylation was negatively correlated with mRNA expression levels in most cancers (Figure S5). Hence, POLRs exhibit overall hyperactivation in cancer, and this dysregulation is closely related to genetic variation.
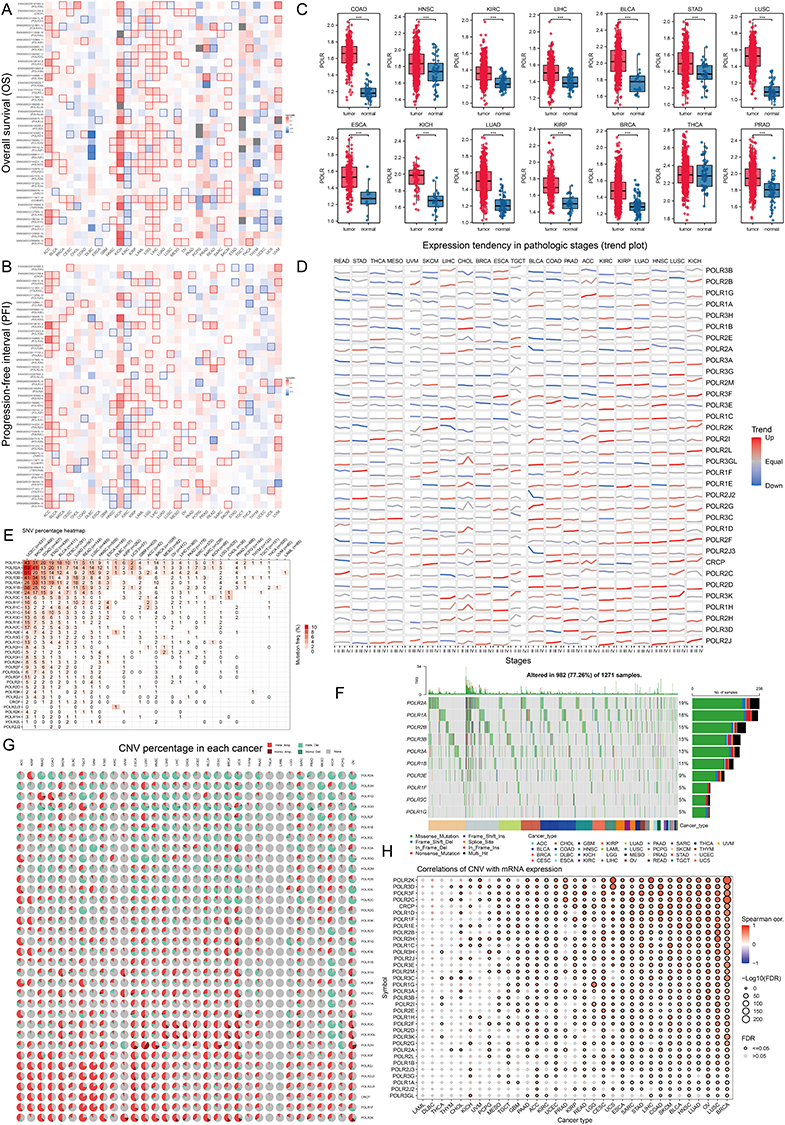 |
Figure 1 Analysis of RNA polymerases (POLRs) expression and prognosis in pan-cancer. (A and B) Pan-cancer survival analysis of the POLR subunits-coding genes, including overall survival (OS) (A), progression-free interval (PFI) (B). The blue and red colors respectively indicate whether high expression of a gene was “pro-survival” or “anti-survival” based on the significance of the survival analysis. The white squares indicate no significant impact on survival (P > 0.05) and the gray squares indicate that analysis could not be performed due to negligible overall gene expression in that cancer subtype. (C) Differences of POLR expression (gene set variation analysis, GSVA score) between tumor and normal tissues in The Cancer Genome Atlas (TCGA)-pan-cancer samples. The Kruskal–Walli’s test was conducted. (D) The expressions of POLRs in different clinical stages (I–IV) were analyzed in pan-cancer. Red represents an uptrend and blue represents a down trend. (E) The heatmap inferred the genetic relationship using single-nucleotide variations (SNV) data from The Cancer Genome Atlas (TCGA) pan-cancer database. The darker the color, the higher the percentage in the sample. (F) The waterfall diagram shows the somatic mutations of the 10 POLR molecules with the highest mutation frequency using pan-cancer analysis. 77.26% is the proportion of 982 samples with at least one mutation of the top 10 genes among 1271 samples with at least one mutation of 34 POLR molecules. The percentage figure of each line on the right of the picture is the number of samples with the corresponding gene mutation divided by 1271 samples with at least one mutation among the 34 POLR molecules. (G) Copy number variation (CNV) pie charts show the heterozygous/homozygous CNV for each gene in each cancer for this combination. (H) The bubble chart shows the correlation between CNV and mRNA expression level. Red indicates a positive correlation; blue indicates a negative correlation. The deeper color indicates a larger correlation index. The bubble size indicates the false discovery rate (FDR). ***P < 0.001. |
RNA Polymerase II Subunit C (POLR2C) Is up-Regulated in HNSC Tissues and Correlates With Clinical Features
In this study, we focused on the significance of POLRs in HNSC. To ensure the reliability of our findings, we included five independent HNSC datasets: E_MTAB_8588, GSE117973, GSE65858, GSE75538, and TCGA-HNSC. The POLR scores for each sample were calculated using GSVA (Figure 2A). In the TCGA-HNSC dataset, we observed that POLRs were associated with tissue type, tissue grade, and N stage (Figure 2B). Data from E_MTAB_8588 and GSE75538 also indicated that POLRs were up-regulated in cancer tissues, although these differences were not statistically significant (Figure 2B). Further survival analysis revealed that POLRs, as a group, were significant unfavorable prognostic factors for HNSC in the TCGA dataset, affecting OS, Disease-Free Survival (DFS), Disease-Specific Survival (DSS), and Progression-Free Survival (PFS) (Figures 2C-D). More importantly, nearly all POLRs were found to be unfavorable for HNSC prognosis (OS and DSS, HR > 1) (Table 1). These results underscore the potential pro-tumorigenic function of POLRs in HNSC.
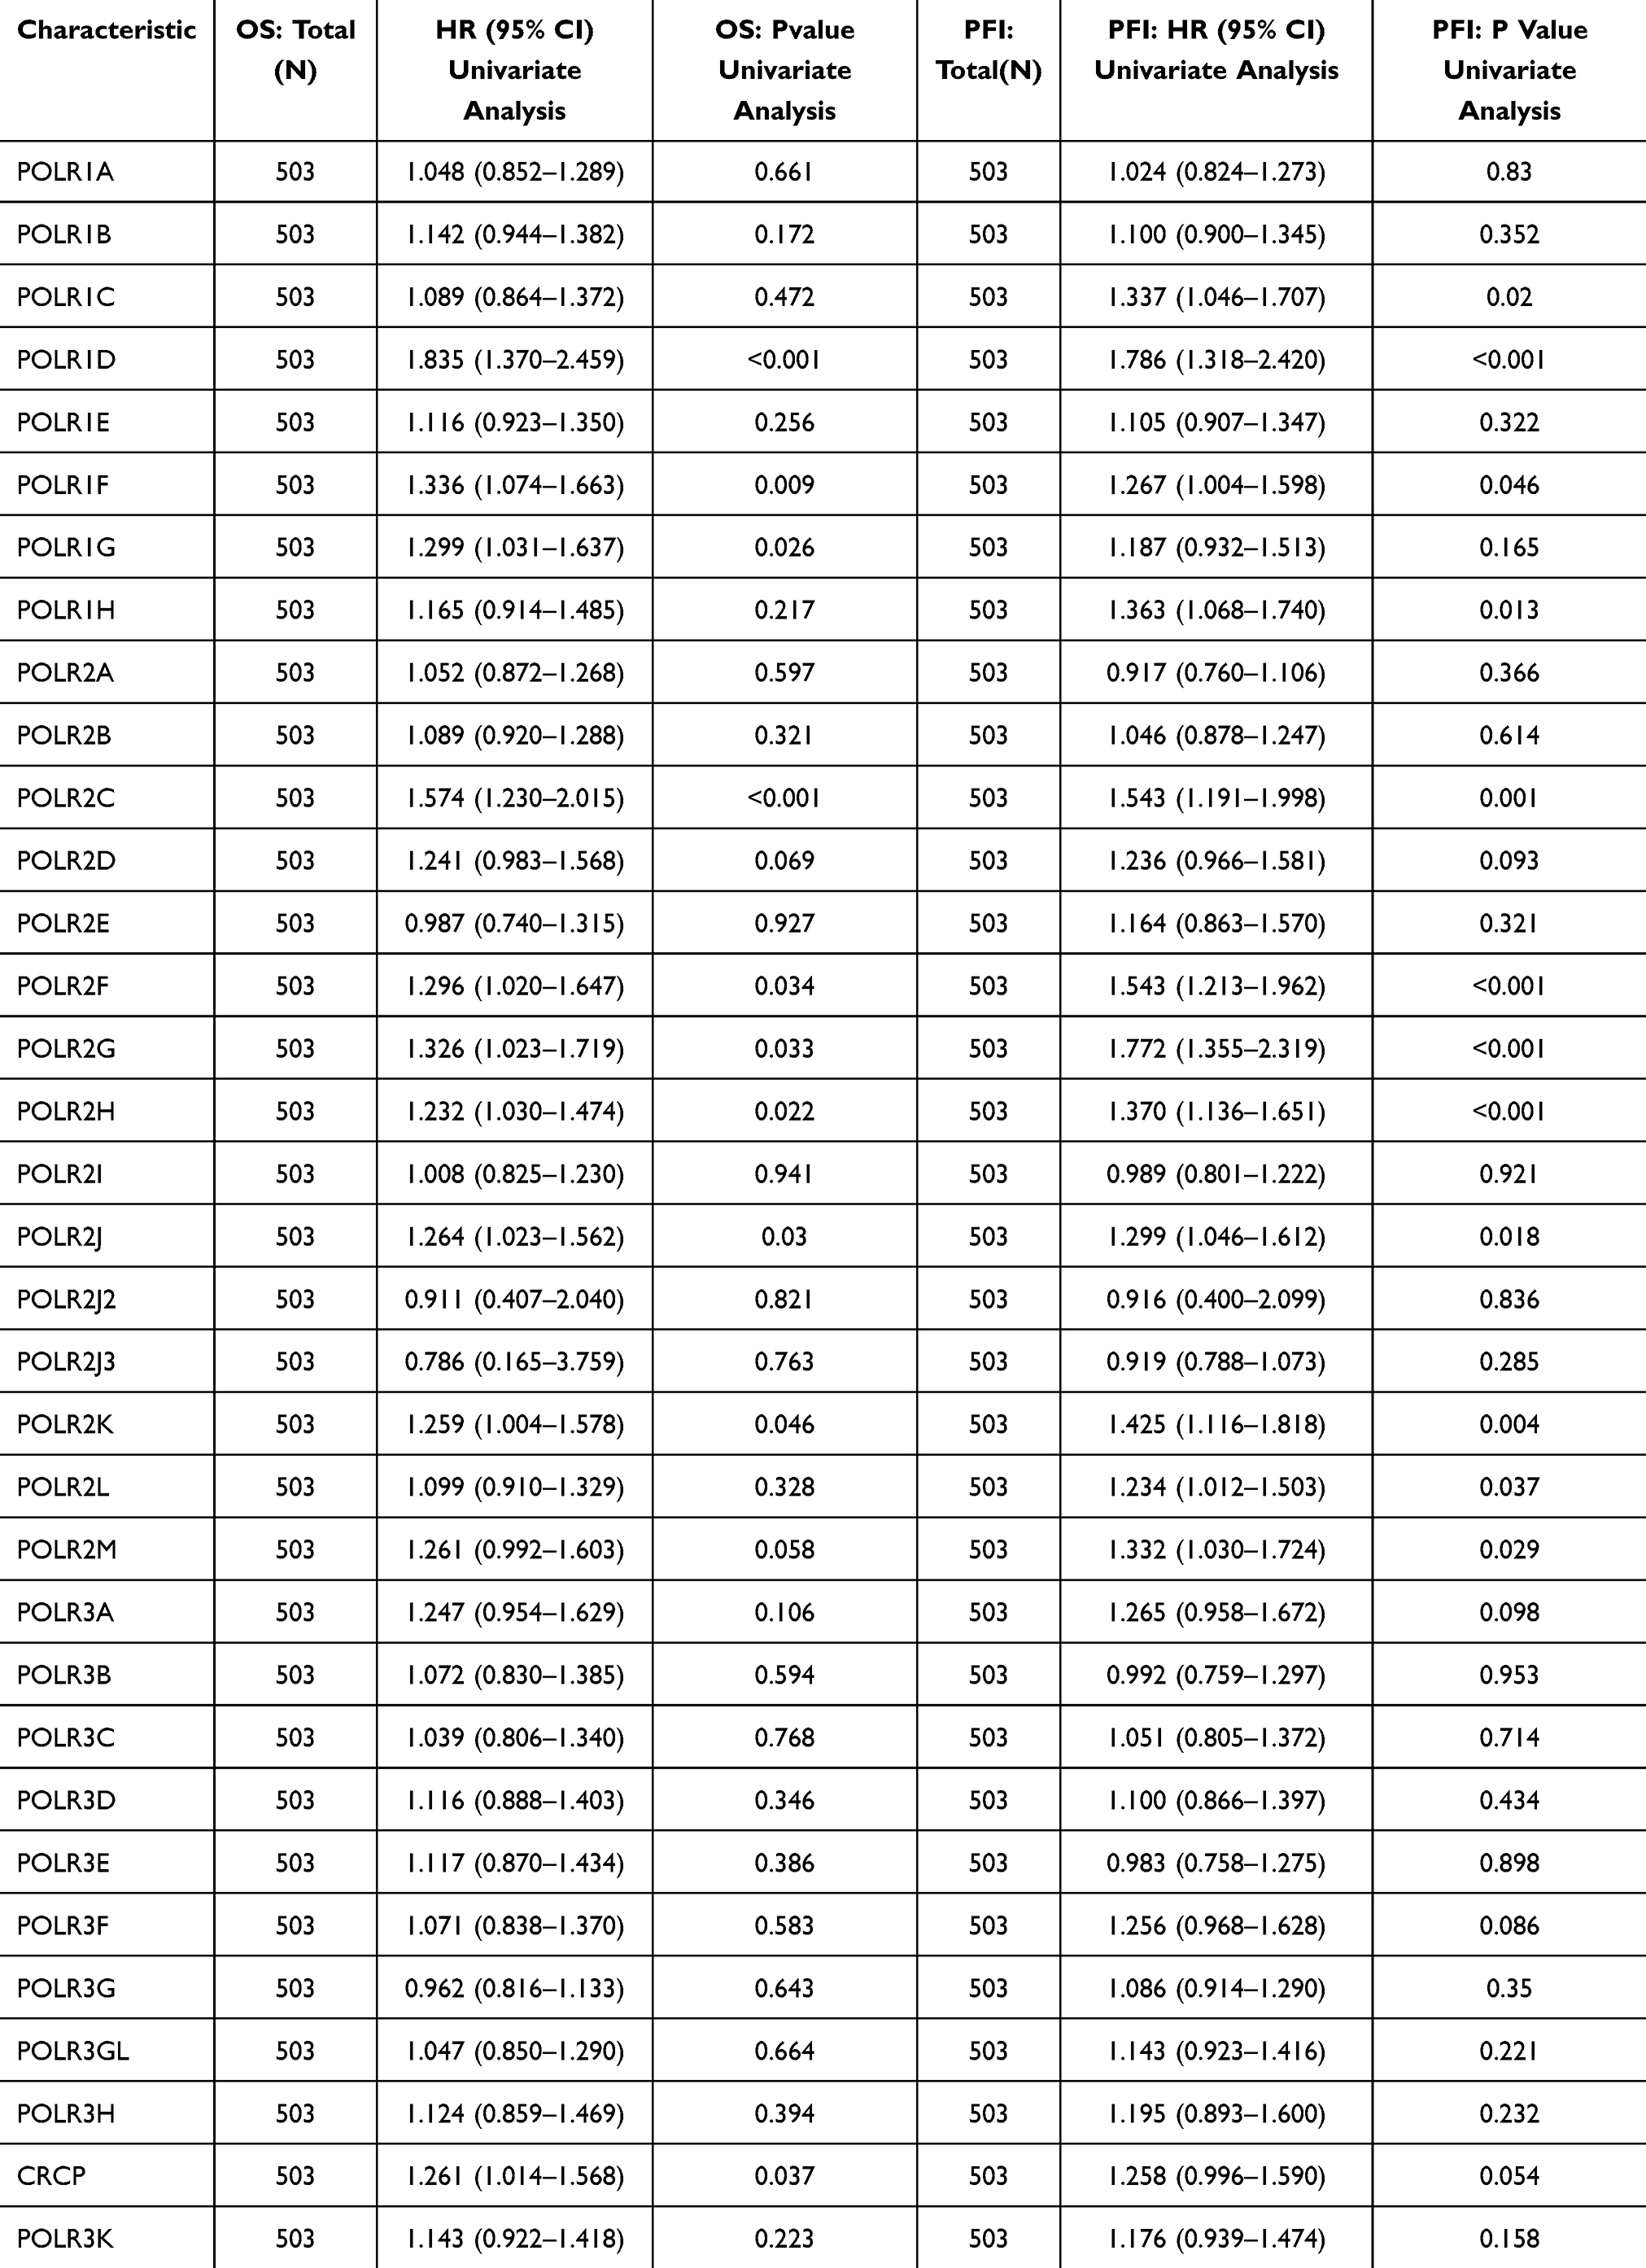 |
Table 1 Univariate Cox regression reveals POLRs are unfavorable factors in HNSC |
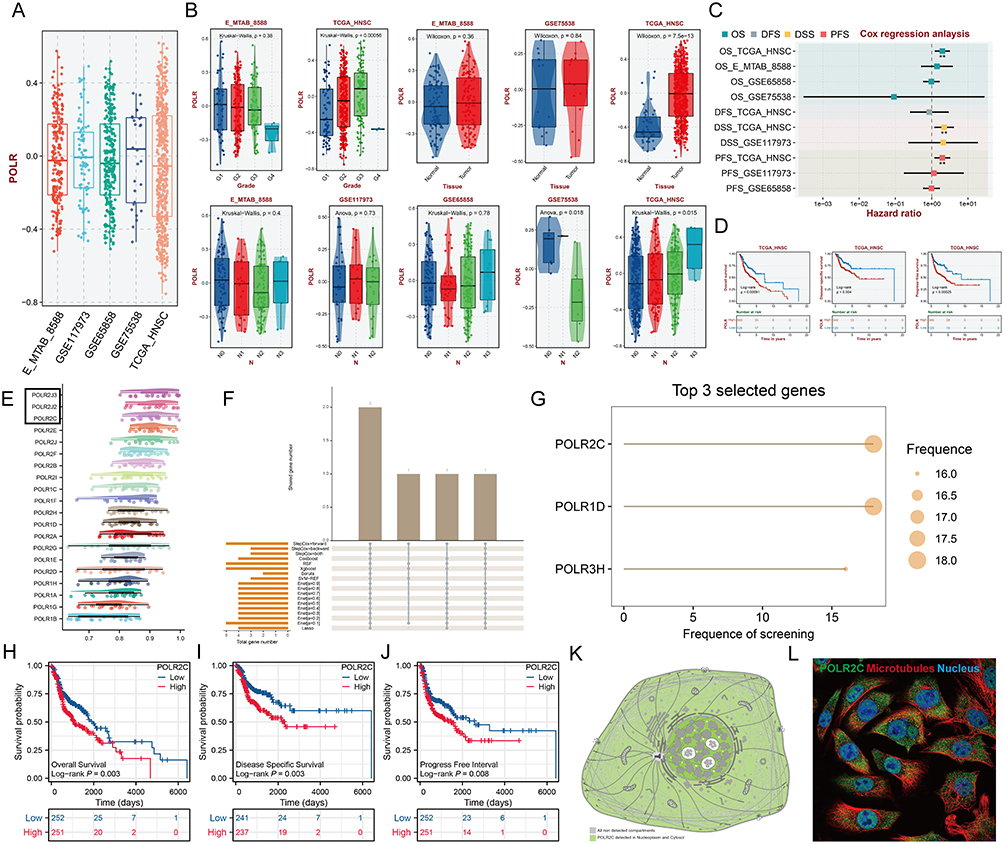 |
Figure 2 Continued. |
 |
Figure 2 RNA polymerase II subunit C (POLR2C) is up-regulated in HNSC tissues and correlated with clinical features. (A) The box plots show the scores of all POLR subunits quantified by the GSAV method across the five publicly available head and neck squamous cell carcinoma (HNSC) datasets. (B) Correlations between POLR levels and clinical parameters in five public HNSC datasets. (C) The forest plot shows the results of Cox regression analysis on the average OS, disease-free Survival (DFS), disease-specific survival (DSS), and progress-free survival (PFS) rate of POLR levels (GSVA score) in the Gene Expression Omnibus Datasets (GEO) cohort. (D) Kaplan–Meier analysis of the association between POLR expression (GSVA score) and OS, DSS, and PFS, in TCGA-HNSC. (E) Friends analysis of PLOR molecules (black boxes highlight the important genes). (F) Upset plot of core features (genes) filtered by different methods. (G) Bubble plot showing the rank of genes filtered by different methods. POLR2C was identified as the key member. (H-J) OS (H), DSS (I) and PFI (J) analyses according to the medium expression level of the POLR2C gene were performed using HNSC cases in the TCGA-HNSC cohort. (K-L) POLR2C protein mainly detected in nucleoplasm and cytosol (K). Multiplex immunofluorescence demonstrating the subcellular distribution of POLR2C protein in cell line sections [Human Protein Atlas (HPA) database] (L). (M) The representative immunohistochemical (IHC) staining images of POLR2C in normal nasopharynx and HNSC tissues from the online HPA database. (N) The expression levels of the POL2RC were analyzed based on the TCGA-HNSC data. (O-Q) Association of POL2RC mRNA levels with pathologic stage (O), histologic grade (P), and clinical stage (Q) were analyzed based on the TCGA- HNSC data. (R) Representative images of POL2RC protein IHC staining in OSCC (n = 10) and LSCC (n = 10). (S) We examined the relationships between POL2RC protein expression and clinical characteristics in patients with OSCC and LSCC, using data from our own cohort. *P < 0.05, **P < 0.01, ***P < 0.001. |
To facilitate subsequent specific analysis, we aimed to identify a representative molecule from the POLRs to focus on in our study. Friends analysis for POLRs showed that RNA Polymerase II Subunit J3 (POLR2J3), RNA Polymerase II Subunit J2 (POLR2J2), and POLR2C had relatively strong correlations with other POLRs, indicating their potential importance in POLR-related functions (Figure 2E, black box). Further screening using multiple machine learning approaches identified POLR1D, POLR2C, and POLR3H as the genes most strongly associated with HNSC survival (Figure 2F and G, black box). Therefore, we selected POLR2C (the intersecting gene) for follow-up studies. Figures 2H–J illustrate the correlation between POLR2C expression and prognosis outcomes in HNSC patients. High POLR2C expression was associated with unfavorable OS (P = 0.003), DSS (P = 0.003), and PFI (P = 0.008). Subcellular localization studies showed that POLR2C protein is predominantly located in the nucleoplasm and cytosol (Figure 2K). IF staining from the Human Protein Atlas (HPA) demonstrated that POLR2C co-localized with microtubules and the nucleus, suggesting a potential role in cell division (Figure 2L).
Additionally, IHC results from HPA showed no significant differences in POLR2C staining between normal and tumor tissues (Figure 2M), which was inconsistent with the transcriptomic results (Figure 2N, TCGA-HNSC). We also examined POLR2C gene expression across different clinical parameters of HNSC cases in the TCGA cohort. As shown in Figures 2O–Q, the high-expression was found to be associated with advanced tumor stage and poor tumor differentiation.
Considering the limitations of public data, we subsequently analyzed the IHC staining data and associated clinical information of 20 hNSC cases (10 OSCC cases and 10 LSCC cases) from Jiangsu Province Hospital of Chinese Medicine (Figure 2R and Table 2). The results showed that the expression of POLR2C did not significantly differ among the different cancer types but was significantly higher in cancer tissues compared to paracancerous tissues (Figures 2S, P < 0.001). Additionally, we analyzed the expression of POLR2C in different pathological subgroups and confirmed that high POLR2C expression was associated with advanced stage (P < 0.05).
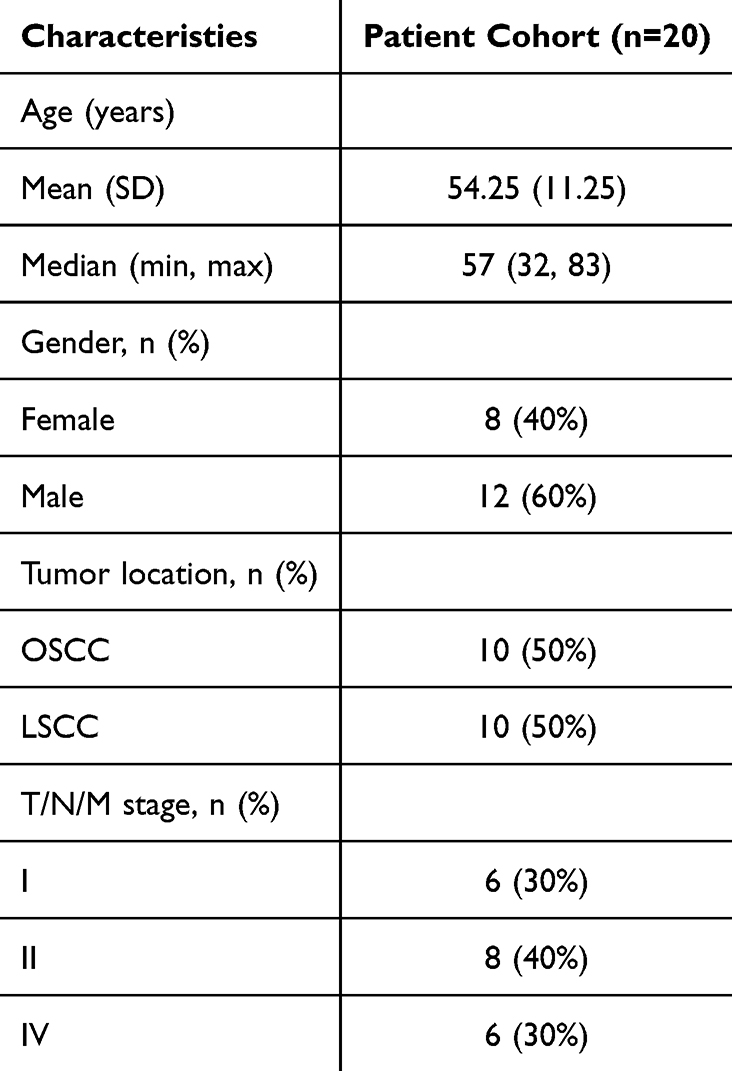 |
Table 2 Clinical characteristics of patients with OSCC and LSCC |
High POLR Expression in Malignant Cells May Be Associated With NSD1-Related Cell-Cycle Dysregulation
The widespread use of scRNA data allows researchers to understand the tumor microenvironment (TME) composition in tumor progression at a higher resolution. To better dissect the POLR expression pattern in the TME, we utilized four scRNA datasets of HNSC, including datasets for HNSC, OSCC, and LSCC. The processes of these four scRNA datasets were demonstrated in Figure S6 with UMAP (Figure S6A) and bubble plots (Figure S6B) displaying the recognized gene markers of each cell type. We also showed the proportion of different cells in each sample (Figure S6C). Subsequently, the “AUCell” R package was conducted to score all single cells. Generally, cells with high expression of POLRs had higher AUC values. As shown in Figure 3A, POLRs were up-regulated in malignant cells. Specifically, for HNSC, we compared POLR levels in samples of different T/N/M stages, and the results showed that POLRs were up-regulated in stage III samples in malignant cells. These findings corroborate the conclusions drawn from the bulk RNA-seq data, further emphasizing the potential role of POLRs in tumor progression.
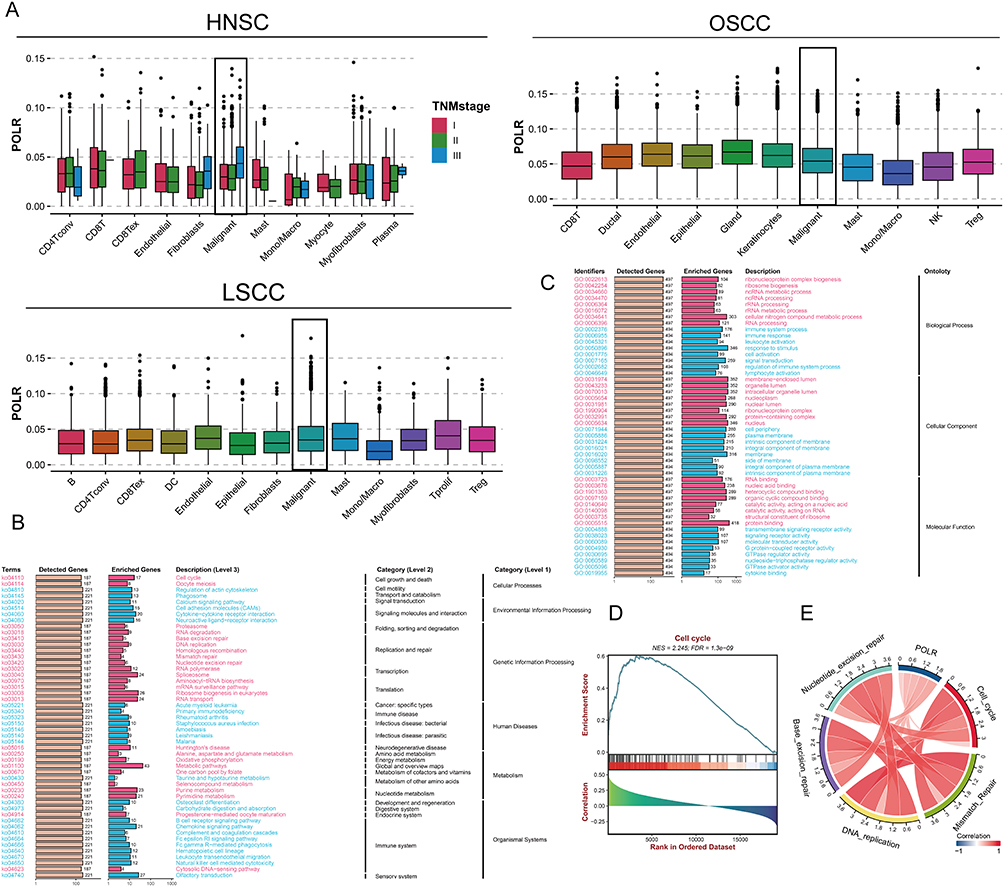 |
Figure 3 POLR expression is associated with tumor progression and cell-cycle regulation. (A) Box plots showing the scores of all POLR subunits quantified by the ACUell method among different cell types in scRNA-seq dataset GSE103322 (HNSC), GSE172577 (OSCC), and GSE150321 (LSCC). For HNSC, the expression of POLRs at different stages was specifically demonstrated. (B-C) Kyoto Encyclopedia of Genes and Genomes (KEGG, (B) and Gene Ontology (GO, (C) enrichment analysis of POLRs (BEST web tool). (D) Gene set enrichment analysis (GSEA) of POLRs (BEST web tool). (E) Correlation between POLRs and cell division-related signaling pathways (BEST web tool). |
We then investigated the functional characteristics of POLRs through enrichment analysis. The results indicated that POLRs were mainly involved in the cell cycle and RNA binding (positive correlation), and played significant roles in biological functions such as the B cell receptor signaling pathway, immune system processes, and lymphocyte activation (negative correlation) (Figures 3B – C). Further gene set enrichment analysis (GSEA) suggested that POLRs might have a positive regulatory effect on the cell cycle (Figure 3D). Additionally, GSVA results showed that cell division-related signaling pathways such as Cell Cycle, Mismatch Repair, DNA Replication, Base Excision Repair, and Nucleotide Excision Repair were positively correlated with POLRs (Figure 3E).
Oncogenesis is believed to be caused by a small number of key driver mutations (activate oncogenes or inhibit tumor suppressors) that induce cell growth and proliferation.32 To obtain evidence that POLRs support tumor growth from the perspective of genetic alterations, we compared the genomic mutation status under different POLR statuses using the TCGA-HNSC cohort. As shown in Figure 4A, the high-POLR group exhibited more frequent NSD1 mutations (black box) and more CNV events (both gains and losses). Importantly, loss-of-function alterations in NSD1 are a common event in cancer (Figure S7), activating downstream pro-oncogenic signaling pathways.33,34 Word cloud illustrated the biological pathways and genes associated with NSD1. The Wnt signaling pathway, RNA polymerase, and MAPK signaling pathway, indicating their significant enrichment in the context of NSD1. Additionally, the word cloud highlights diseases such as acute myeloid leukemia, glioma, and melanoma, which are potentially linked to NSD1. Key genes like PIK3CA, EZH2, WT1, NSD2, and YY1 are also prominently featured, reflecting their importance in NSD1-related studies (Figure 4B). However, the role of NSD1 in cancer remains elusive, with contradictory observations reported by different studies.35,36 A previous clinical study showed an association between inactivating mutations in the NSD1 gene and squamous cell carcinoma, suggesting that NSD1 may be a tumor suppressor gene in HNSC.37–39 In our study, we found that in HNSC, mutations in NSD1 are associated with decreased total mRNA levels (Figure 4C, TCGA-HNSC, P = 0.0018) and that there is a correlation between POLRs and NSD1 (Figure 4D, three scRNA-seq datasets). As a histone methyltransferase, NSD1 has a wide range of biological functions, and its lack of expression may cause various functional abnormalities, especially cell-cycle dysregulation.40,41 Data from the HPA also support the correlation between POLR expression and the cell cycle (Figure S8).
 |
Figure 4 NSD1 mutations and POLR2C expression are associated with cell-cycle dysregulation in malignant tissues. (A) Oncoplot displaying the differences in mutation and CNV profile between high- and low-POLR group. NSD1 is highlighted with a black box. (B) Word cloud illustrating the biological pathways and genes associated with NSD1. (C) Violin plot showing the expression levels of NSD1 in wild-type (WT) and mutated NSD1 groups. The distribution of NSD1 expression is depicted for each group, with the WT NSD1 group on the left (green) and the mutated NSD1 group on the right (red). The central white box within each violin plot represents the interquartile range (IQR) of the data, with the black line inside the box indicating the median expression level. Individual data points are overlaid as scatter dots. The Wilcoxon rank-sum test reveals a significant difference between the two groups, with a P = 0.0018. (D) Heatmaps demonstrating the difference in NSD1 expression between the high- and low-POLR groups in scRNA-seq datasets GSE103322 (HNSC), GSE172577 (OSCC), and GSE150321 (LSCC). (E) Spatial transcription sections in GSM5494475, GSM5494476, GSM5494477, and GSM5494478 show the spatial distribution of POLRs (average expression of POLRs), cancer cell, NSD1, and cell-cycle-related genes. The redder the color of the dot, the higher the level. (F) mIF staining images of OSCC and LSCC section indicates the co-expression of CK, CDK2 with POL2RC but not NSD1 (scale bar, 50 μm). The merged images (left) display the combined fluorescence signals, while the individual channels (right) show specific staining for CK (magenta), CDK2 (red), POLR2C (yellow), and NSD1 (green). Line plots showing the fluorescence co-localization (CK+POLR2C versus CK+NSD1 and CK+POLR2C versus CK+CDK2) across pixel distances in OSCC and LSCC tissues. The Spearman correlation coefficients (R) and 95% confidence intervals (CI) are provided for each pairwise comparison, with significant co-expression patterns highlighted. The graphs demonstrate a strong correlation between CK+POLR2C and CK+CDK2 (but not CK+NSD1), supporting the observations from the mIF images. Statistical significance is indicated with P-values < 0.0001. *P < 0.05, **P < 0.01, ****P < 0.0001. |
We further obtained ST data from SpatialTME to characterize the spatial overlap of POLRs, cancer cells, NSD1, and cell-cycle signaling in HNSC cancer tissues (Figure 4E). As expected, there was a large spatial overlap of POLRs and cancer cells, accompanied by strong cell-cycle signaling and weak NSD1 expression, highlighting the potential regulation of the cell cycle by POLRs in cancer cells. For experimental validation, we performed multiplex immunofluorescence (mIF) staining in HNSC paraffin sections (Figures 4F). The images of POLR2C (a representative molecule of POLRs), CK (cancer tissues), CDK2 (S phase marker), and NSD1 staining showed that NSD1 was hardly expressed in the CK-positive regions with high POLR expression, while CDK2 was strongly expressed. Conversely, in CK-positive regions with low POLR expression, NSD1 was more prominently expressed, and CDK2 was less expressed. These results demonstrated that the overexpression of POLRs in cancer cells is strongly associated with cell-cycle dysregulation.
POLR2C Is Transcriptionally Regulated by YY1 in Malignant Cells and Promotes Cell-Cycle Progression
NSD1 can di-methylate histone 3 Lys 36 (H3K36) and control the binding of transcription factors (TFs) to the promoters of various genes.42 To identify abnormal transcription factors associated with POLRs, we isolated malignant cells in four HNSC datasets and defined the POLR score for each malignant cell using the “AUCell” package. In HNSC, POLRs were up-regulated in cluster 7; and in OSCC and LSCC, POLR levels did not differ significantly across different clusters (Figures 5A–C and Figure S9). We then used the “DoRothEA” package to infer transcription factor activity in malignant cells. As shown in Figures 5D–F, YY1 was identified as a POLRs-associated transcription factor in all four independent datasets (black box). Furthermore, the importance of YY1 was highlighted by the POLR-related transcriptional regulatory network constructed based on built-in data from JASPAR,43 as shown in Figure 5G (black circle). Consistent with these findings, YY1 showed a positive correlation with all POLRs in the TCGA-HNSC dataset (Figure 5H).
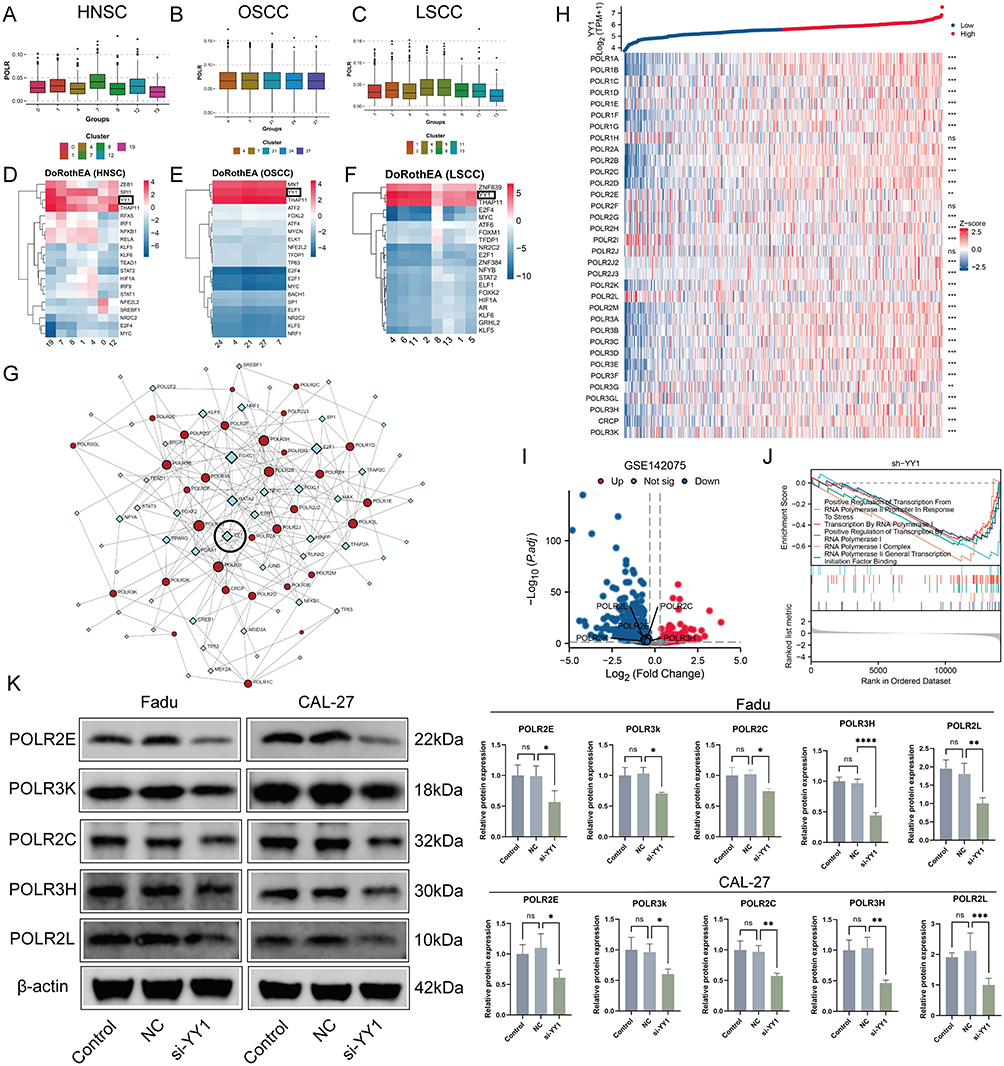 |
Figure 5 Continued. |
 |
Figure 5 YY1 regulates the transcriptional activation of POLRs, including POLR2C, promoting their expression and associated downstream effects. (A–C) Box plots showing the expression of POLR among different malignant clusters in scRNA-seq datasets GSE103322 (HNSC, (A), GSE172577 (OSCC, (B), and GSE150321 (LSCC, (C). (D-F) Heatmap showing active transcription factors (TFs) for each malignant cluster predicted by DoRothEA in scRNA-seq datasets GSE103322 (HNSC, (D), GSE150430, GSE172577 (OSCC, (E), and GSE150321 (LSCC, (F). YY1 is highlighted with black boxes because of being the only intersection TF among the 3 datasets. (G) The TF-gene interaction network constructed by JASPAR TF binding site profile database. Red circles represent POLRs and blue diamonds represent TFs. YY1 is highlighted with a black circle. (H) Heatmap showing the correlation between YY1 and POLR genes in Head and Neck Squamous Cell Carcinoma (HNSC) from the TCGA-HNSC dataset. Gene expressions were transformed into Z-scores. The top panel displays the log2(TPM+1) values of YY1 expression, with samples categorized into high (red) and low (blue) YY1 expression groups. Each row in the heatmap represents a different POLR gene, and each column represents a sample. The color gradient from blue to red indicates the Z-score of expression, with blue representing lower expression and red representing higher expression. Significance levels of the differences in expression between high and low YY1 groups are indicated on the right: ns (not significant). This heatmap illustrates the correlations between YY1 and POLR genes in HNSC samples. (I) Volcano plot showing the differential expression of POLR genes in the GSE142075 dataset (YY1 knockdown). The x-axis represents the log2 fold change in gene expression, and the y-axis represents the -log10 adjusted p-value (P.adj). Genes that are significantly up-regulated (log2 fold change > 1 and P.adj < 0.05) are highlighted in red, while significantly down-regulated genes (log2 fold change < −1 and P.adj < 0.05) are highlighted in blue. Non-significant genes are shown in grey. This plot highlights the key genes with significant differential expression in the dataset. (J) GSEA plot showing the enrichment of various transcription-related pathways in the YY1-knockdown dataset from GSE142075. (K) The Expressions of the POLR2C, POLR2E, POLR2L, POLR3H, and POLR3K proteins were examined using Western blotting after the transfection of the CAL-27 and FaDu cells with NC, si-YY1 constructs (t test). (L) The Bindings site of YY1 to POLR2C was predicted by JASPAR database. The x-axis shows the position within the binding site, while the y-axis represents the information content measured in bits. This visualization highlights the key nucleotide positions critical for YY1 binding to the POLR2C. (M) Structural model of the interaction between YY1 and the POLR2C promoter. The 3D structural model, generated using AlphaFold3, highlights the binding interface of YY1 (purple structure) with the POLR2C promoter. The DNA sequence is visualized in a ribbon representation, illustrating YY1’s interaction at the promoter region, potentially facilitating POLR2C transcriptional activation. (N) Relative luciferase activity of the POLR2C promoter in different experimental conditions. The results show a significant increase in luciferase activity when YY1 is present, indicating that YY1 positively regulates the POLR2C promoter. Data are presented as mean ± SD (n = 3). (O) IHC staining and correlation analysis of POLR2C and YY1 expression in tumor tissues (n = 20). The IHC images show representative tumor sections with high and low expression of POLR2C and YY1. POLR2C high expression is associated with elevated YY1 levels, while POLR2C low expression correlates with reduced YY1 levels. Scale bar = 20 µm. The scatter plot on the right quantifies the correlation between POLR2C and YY1 protein expression across samples. A significant positive correlation is observed (Spearman correlation, R = 0.687, P < 0.001), supporting the regulatory relationship between YY1 and POLR2C. ns: not significant, *P < 0.05, **P < 0.01, ***P < 0.001, ****P < 0.0001. |
We next aimed to establish the regulatory relationship between YY1 and POLRs to characterize the associated downstream effects. Using GPSAdb, we analyzed the transcriptomic differences generated by YY1 knockdown in the GSE142075 dataset (Figure 5I). We found that the levels of POLRs-related signaling pathways were significantly suppressed upon down-regulation of YY1 expression (Figure 5J), which was further verified by Western blotting (Figure 5K). We utilized the JASPAR web tool to identify the active binding site of YY1 in the promoter region of POLR2C (Figure 5L). Additionally, AlphaFold3 provided a prediction model showing the interaction between YY1 and POLR2C (Figure 5M). Further results from a luciferase reporter gene analysis validated this binding site (Figure 5N). To detect the pathological correlation between YY1 and POLR2C, IHC staining was performed on 20 hNSC cases. As shown in Figure 5O, there was a strong correlation between YY1 and POLR2C at the protein level (measured by H-score, R = 0.72). These data support the presence of YY1-POLR2C signaling in cancer cells (HNSC).
It is well known that YY1 promotes cancer cell growth, proliferation, migration, and metastasis, leading to poor prognosis.33,34 We therefore investigated the effect of the YY1-POLR2C axis on the malignant phenotype of cancer cells. The colony formation assays (Figure 6A) and TUNEL staining (Figure 6B) demonstrated that POLR2C overexpression significantly promoted cell proliferation and suppressed apoptosis, which was abolished by si-YY1. Cell cycle analysis revealed that overexpression of POLR2C promoted the transition of the cell cycle from the G1 phase to the S and G2 phases. This phenomenon was rescued by si-YY1 (Figure 6C). In the cell cycle, the main stages of cell proliferation are the S and G2 phases. Finally, we investigated the effects of YY1-POLR2C axis on tumor growth in a xenograft model. To do so, POLR2C-overpressing or control cells were injected subcutaneously into BALB/c nude mice in the presence or absence of si-YY1. We found that the overexpression of POLR2C resulted in a significantly increase of tumor volumes and weights, which was attenuated in mice carrying si-YY1 tumors (Figure 6D). We also performed TUNEL staining and Ki-67 (an indicator of cell proliferation and is mainly expressed in the cell nucleus) IHC staining in xenograft tumor tissues, and similar phenomena were observed as in the in vitro experiments (Figures 6E – F).
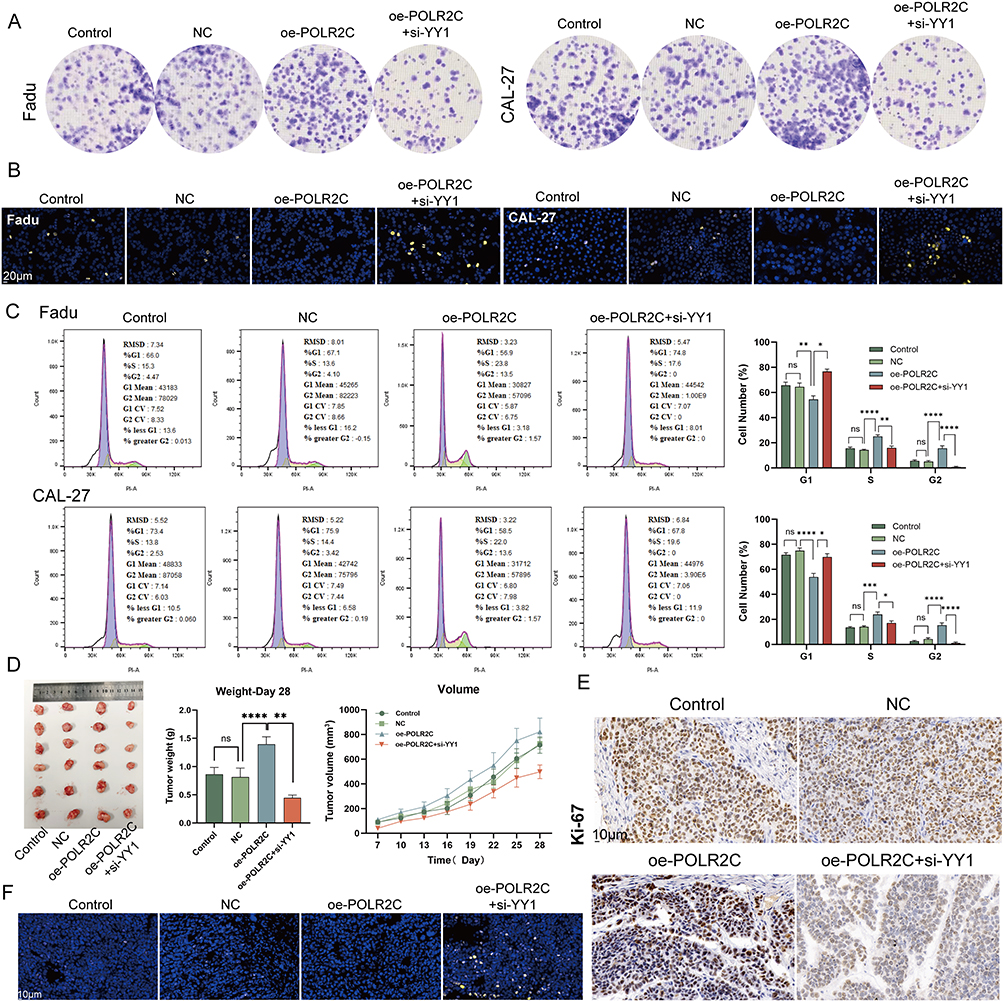 |
Figure 6 POLR2C promotes cell proliferation, cell-cycle progression, and tumor growth, regulated by YY1. (A) Colony formation assay of Fadu and CAL-27 cell lines under different conditions. The images show the results for control, negative control (NC), over-expression of POLR2C (oe-POLR2C), and overexpression of POLR2C with siRNA-mediated knockdown of YY1 (oe-POLR2C + si-YY1). The results indicate the role of POLR2C and YY1 in the regulation of colony formation in these cell lines. (B) TUNEL staining of POLR2C-overexpressing CAL-27 and Fadu cells in the presence or absence of si-YY1. Nuclei are stained blue with DAPI, and the yellow fluorescence indicates TUNEL-positive apoptotic cells. The scale bars represent 20 μm. This figure illustrates the impact of POLR2C over-expression and YY1 knockdown on apoptosis in these cell lines. (C) Impact of YY1-POLR2C axis on cell cycle. POLR2C over-expression increased the proportion of CAL-27 and FaDu cells in the S and G2 phases compared to the NC group (ANOVA). Knockdown of YY1 partially reversed the enhanced proliferation caused by POLR2C over-expression, significantly reducing the ratio of cells in the S and G2 phases and inducing G1 arrest (unpaired t test). (D) In vivo tumor growth analysis of FaDu cells with POLR2C over-expression and YY1 knockdown. The left panel shows photographs of the excised tumors from mice treated under different conditions. The middle panel presents the tumor weights at day 28, with statistical analysis indicating significant differences between groups. The right panel shows the tumor volume growth over time, measured in cubic millimeters (mm³), for each condition (ANOVA). (E) IHC staining for Ki-67, a proliferation marker, in xenograft tumor tissues. POLR2C overexpression increases Ki-67 levels, while YY1 knockdown reduces it. Scale bar = 10 µm. (F) Representative images of xenograft tumor sections stained for DAPI (nuclei) and TUNEL (apoptosis marker). POLR2C overexpression decreases apoptosis, which is partially restored by YY1 knockdown. Scale bar = 10 µm. ns: not significant, *P < 0.05, **P < 0.01, ****P < 0.0001. |
High Expression of POLRs Was Associated With Low CD8+ T Cell Levels
The work of Li et al reported that the inactivation of NSD1 in squamous cell carcinoma induces DNA hypomethylation, thereby leading to reduced tumor immune infiltration.35 Therefore, we investigated the relationship between POLRs and immune cells. GSEA results showed that POLR expression had significant negative correlations with macrophage activation, myeloid cell activation involved in immune response, B cell receptor signaling pathway, T cell activation involved in immune response, and T cell differentiation involved in immune response in HNSC patients (Figures 7A–E).
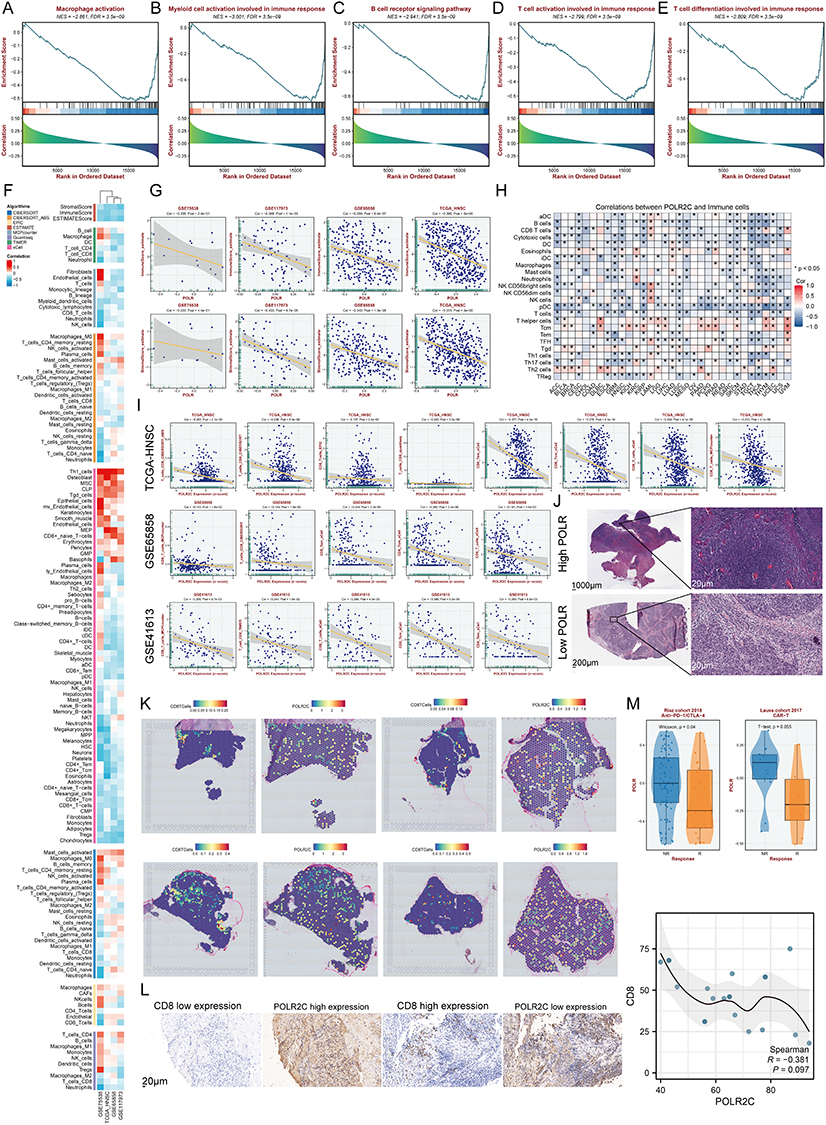 |
Figure 7 High expressions of POLRs correlate with low immune cell infiltration level. (A–E) GSEA highlights the negative correlation between POLR and immune-related pathways, including Macrophage activation (A), Myeloid cell activation involved in immune response (B), B cell receptor signaling pathway (C), T cell activation involved in immune response (D), and T cell differentiation involved in immune response (E). (F) Heatmap showing the correlation between POLR expression (GSVA score) and the infiltration level of immune cells. We conducted 8 immune infiltration estimations by BEST. Red represents positive correlation and blue represents negative correlation. (G) Correlation between POLR expression (GSVA score) and the TME components calculated by “ESTIAMTE” package in four datasets, including GSE75538, GSE117973, GSE65858, and TCGA-HNSC. (H) Correlation between POLR2C expression and the infiltration level of immune cells (TCGA-HNSC). CIBERSORT was applied. Red represents positive correlation and blue represents negative correlation. (I) Correlation between POLR2C expression and the infiltration level of CD8+ T cell in 3 datasets, including TCGA-HNSC, GSE65858, and GSE41613. 5 algorithms were applied. (J) Images representing the pathological section variation between high- and low-POLR groups (TCGA database). (K) Spatial transcription sections show the spatial distribution of CD8+ T cell and POLR2C. The redder the color of the dot, the higher the level. (L) IHC staining and correlation analysis of CD8 and POLR2C expression. The left panel shows representative IHC images with CD8 low expression and high expression (top row), and POLR2C high expression and low expression (bottom row). The scale bar represents 20 μm. The right panel presents a scatter plot with a fitted line depicting the correlation between CD8 and POLR2C expression levels, measured by H-score. The Spearman correlation coefficient (R) is −0.381, with a P = 0.097 (n = 20). (M) Box plot showing distinct POLR expression between responder and non-responder after immunotherapy in Riaz cohort and Lauss cohort. *P < 0.05. |
Next, we utilized eight algorithms to conduct subsequent studies in four HNSC datasets (bulk RNA-seq), finding that POLR expression was negatively correlated with most immune cells (Figure 7F). Importantly, POLRs were significantly negatively correlated with the stromal and immune scores defined by the “ESTIMATE” algorithm, further confirming previous findings (Figure 7G).
Subsequently, we analyzed the association between POLR2C (the focus of our study) and immune infiltration. As expected, POLR2C not only showed a broad negative correlation with the immune component in the pan-cancer data (Figure 7H, TCGA-pan-cancer), but also significantly negatively correlated with CD8+ T cells in HNSC (Figure 7I; TCGA-HNSC, GSE65858, and GSE41613). Pathology sections directly confirmed that there was more infiltration of immune cells in cases with low POLR2C expression, whereas cases with high POLR2C expression exhibited less immune cell infiltration (TCGA pathology slide, Figure 7J). We also utilized ST data to confirm that CD8+ T cell levels were maintained at low levels in POLR2C high-expressing spots (Figure 7K). Apart from the mRNA level results, IHC staining confirmed that an increase in POLR2C protein expression was synchronized with a decrease in CD8 protein expression (Figure 7L, R = −0.381). Considering that CD8+ T-cell tumor infiltration is a key feature of effective immunotherapy in HNSC patients, we tested the correlation between POLR expression and immunotherapy response. In two independent public immunotherapy cohorts, POLR expression was shown to be lower in responsive patients than in non-responder patients (Figure 7M). These findings suggest that high POLR expression may be an immunosuppressive factor.
Higher Overall POLR Expression Is Associated With More Frequent Communication Between Cancer Cells and T Cells
Considering that POLRs are not only expressed in malignant cells, we next investigated the significance of overall POLR expression in the tumor microenvironment (TME). For this purpose, all single cells were scored using the same method as described above. When the threshold score (AUC value) was set at the median level, all cells were divided into two groups: high-POLR group and low-POLR group (Figure 8A–C).
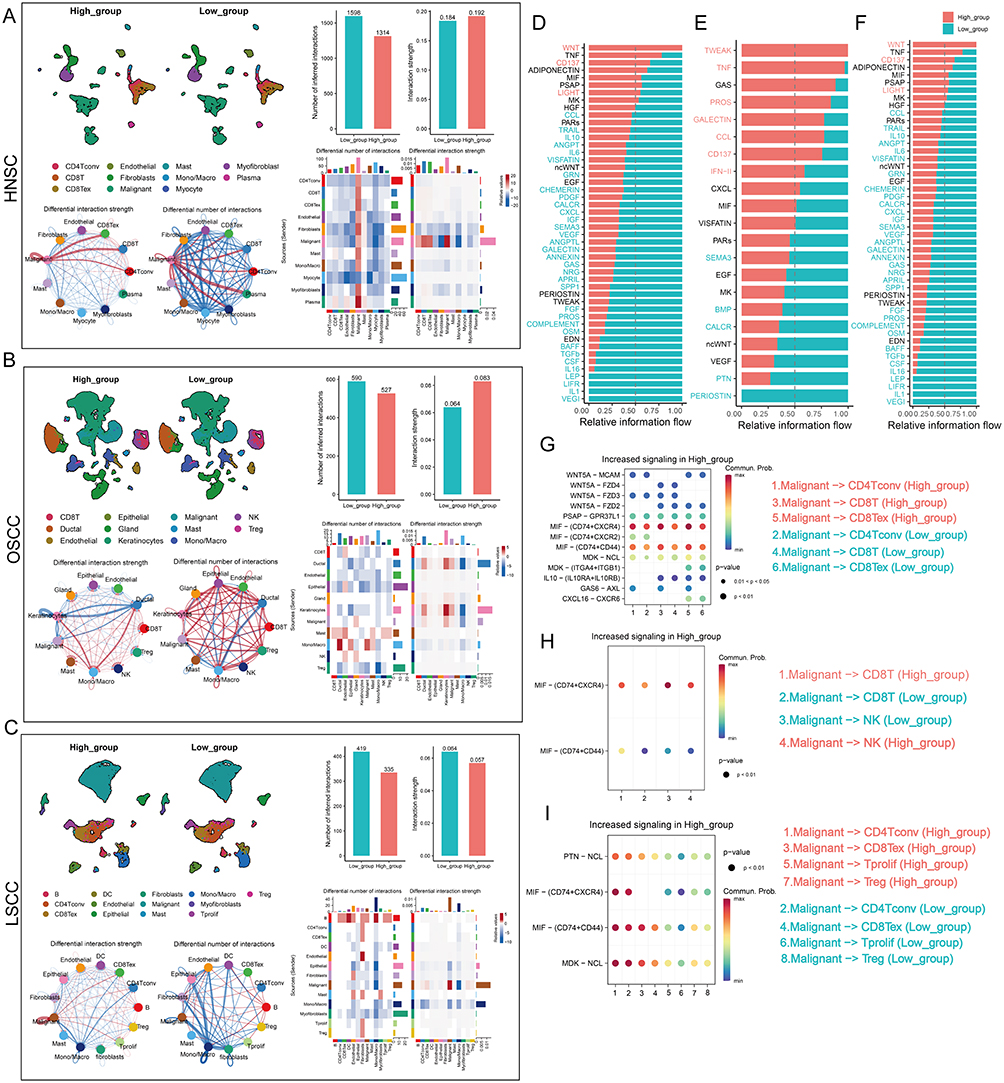 |
Figure 8 Continued. |
 |
Figure 8 Differences in cell-cell communication patterns at different POLR levels. (A-C) The POLR levels of all cells were assigned by the “AUCell” package and the “Cellchat” package was utilized to compare the differences in cellular communication patterns between the two groups. The differences in overall interaction number and strength, and the difference in the number and intensity of interactions per cell type were analyzed. (A) GSE103322 (HNSC), (B) GSE172577 (OSCC), (C) GSE150321 (LSCC). (D-F) Bar graphs demonstrating the differences in signaling pathways between the two groups in scRNA-seq datasets GSE103322 (HNSC, (D), GSE172577 (OSCC, (E), and GSE150321 (LSCC, (F). (G-I) Bubble plots showing that malignant cells may communicate with T cells and NK cells frequently through MIF signals in high-POLR groups in scRNA-seq datasets GSE103322 (HNSC, (G), GSE172577 (OSCC, (H), and GSE150321 (LSCC, (I). (J) Spatial transcriptomics analysis: UMAP plots highlight MIF signaling activity in malignant clusters, emphasizing its enrichment in regions with high POLR expression. (K) Representative images of tumor sections show co-localization of POLR2C, MIF, and CD74 in POLR2C-positive regions. MIF-CD74 interaction is observed predominantly in areas with high POLR2C expression, supporting the role of POLR2C in facilitating MIF-CD74-mediated immunosuppressive signaling. Scale bar = 20 µm. |
The “CellChat” package was then used to compare cellular interactions between the two groups. The results showed that while there was no significant difference in the number of ligands and receptors between the two groups, the interactions in high-POLR group were stronger than those in low-POLR group in OSCC (Figure 8A–C). Importantly, the number and strength of signaling pathways from malignant cells to CD4+ T cells and CD8+ T cells were significantly higher in high-POLR group than in low-POLR group. Additionally, the signal input/output patterns of the two groups differed significantly (Figure S10). These findings suggest that high POLR expression may enhance cellular interactions and signaling pathways within the TME, potentially impacting the immune response and tumor progression.
We further analyzed the specific signaling pathways between the different POLR groups (Figure 8D–F). It was found that MIF-CD74 signaling was more enriched in the high-POLR group compared to the low-POLR group. More importantly, malignant cells may frequently communicate with T cells and NK cells via MIF signaling pathways, impairing their infiltration levels in high-POLR groups (Figure 8G–I). Cell communication results from ST further confirmed that MIF signaling was present in regions with high levels of POLRs, and this result was then confirmed by mIF staining (Figure 8J and K).
POLR2C Overexpression Promotes the MIF Signaling Pathway
To further investigate this, we explored the expression patterns of MIF, CD74, CXCR4, and CD44 across four cancer types, including HNSC, OSCC, and LSCC (Figure 9A–C). Violin plots indicated that the expression levels of MIF (encoding MIF signaling ligand) of malignant cells and the expression levels of genes (CD74, CXCR4, and CD44) encoding MIF-associated receptors of T cells were higher in high-POLR groups than in low-POLR groups. IHC staining further confirmed that high POLR2C expression is associated with elevated levels of CD44, CD74, CXCR4, and MIF across tumor tissues (Figure 9D and E), a significant positive relationship between POLR2C and MIF, CD74, CXCR4, and CD44).
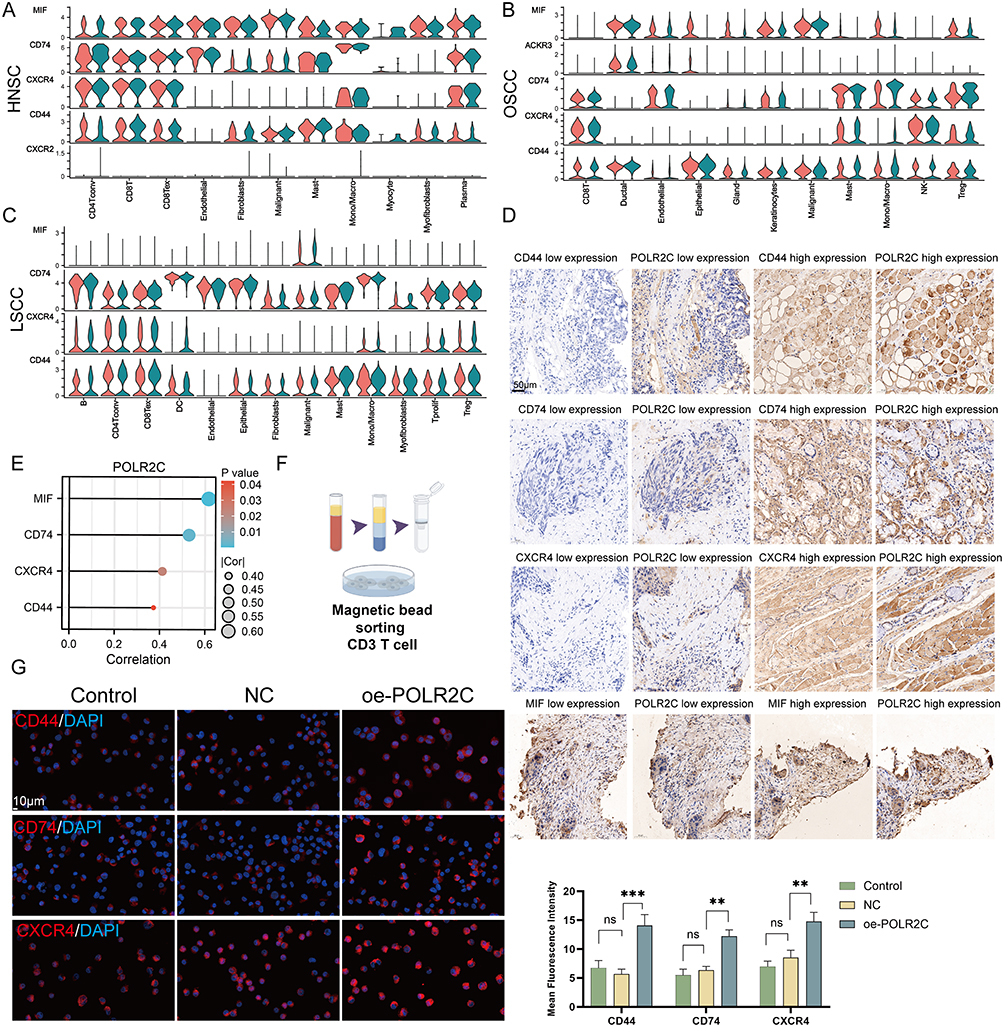 |
Figure 9 Continued. |
 |
Figure 9 POLR2C over-expression modulates the MIF signaling pathway. (A–C) Violin plots illustrating the expression of the members of MIF signaling (MIF, CD74, CXCR4, CD44, and ACKR3) across different cell types in HNSC (A), OSCC (B), and LSCC (C). Cell types analyzed include CD4+ T cell, CD8+ T cells, fibroblasts, endothelial cells, malignant cells, macrophages, and others. The red and blue colors indicate low- and high-POLR groups, respectively, across the various cell types. (D) IHC staining showing differential expression levels of CD44, CD74, CXCR4, and MIF in correlation with POLR2C expression in tissue samples. The panels display low and high expression levels of each marker (CD44, CD74, CXCR4, and MIF) alongside corresponding POLR2C expression in the same tissue sections. Scale bar: 50 μm. (E) The right bubble plot shows positive correlations between POLR2C and these markers, with the size of the circles representing the strength of the correlation (|Cor|) and the color representing the statistical significance (P-value). Larger circle size corresponds to a higher correlation coefficient, and lighter shades indicate lower P-values (greater statistical significance). (F) Human CD3+ T cells were obtained from peripheral blood mononuclear cells (PBMCs) using human CD3 T-cell sorting magnetic beads. (G) IF staining of CD44, CD74, and CXCR4 in CD3+ T cells subjected to different treatments: Control, NC (negative control), and oe-POLR2C (POLR2C overexpression). Red fluorescence represents the expression of the respective proteins (CD44, CD74, and CXCR4), while DAPI (blue) stains the nuclei. Quantification of mean fluorescence intensity shows a significant increase in CD44, CD74, and CXCR4 expression in the oe-POLR2C group compared to the NC groups. (H) IF staining of MIF (green) in CAL-27 and FaDu cell lines subjected to different treatments: Control, NC, and oe-POLR2C. DAPI (blue) was used for nuclear staining. POLR2C overexpression led to a significant increase in MIF expression in both cell lines compared to the NC groups. Quantification of mean fluorescence intensity reveals a statistically significant difference in the oe-POLR2C group. (I) Quantification of MIF levels (pg/mL) in the cell supernatant of CAL-27 and FaDu cell lines following treatments: Control, NC, and oe-POLR2C. MIF secretion was significantly elevated in the oe-POLR2C group in both CAL-27 and FaDu cell lines compared to the NC groups. Data are presented as mean ± SEM. Statistical significance was determined using one-way ANOVA: ns (not significant), *P < 0.05, **P < 0.01, ***P < 0.001. |
To investigate the function of POLR2C in T cells, we purified CD3 T cells from PBMCs to a purity of >95% by sorting with magnetic beads (Figure 9F). In vitro, IF experiments (Figure 9G) showed increased expression of CD44, CD74, and CXCR4 in CD3+ T cells over-expressing POLR2C compared to negative control (NC) groups. Quantification of the mean fluorescence intensity confirmed that POLR2C overexpression significantly enhances the expression of these receptors. Finally, we assessed MIF expression in CAL-27 and FaDu cell lines via IF (Figure 9H). POLR2C overexpression significantly upregulated MIF expression in both cell lines, as demonstrated by increased fluorescence intensity in the oe-POLR2C group. Additionally, MIF secretion was significantly elevated in the cell supernatants of CAL-27 and FaDu cells overexpressing POLR2C (Figure 9I), further supporting the role of POLR2C in promoting the MIF signaling pathway. These results revealed that POLR2C is a key factor affecting the immune features of HNSC. Targeting POLRs may be effective in inhibiting MIF signals to improve immune cell infiltration in HNSC.
Discussion
Alterations in POLRs-regulated transcription underlie virtually all human diseases, but the role of POLRs in cancer remains unclear.36,37 In this study, we characterized the genomic and transcriptomic heterogeneity of 34 POLRs across pan-cancer datasets and found that POLRs were up-regulated in cancerous tissues, potentially linked to genomic alterations. We focused on head and neck squamous cell carcinoma (HNSC) and defined POLR scores using the GSVA algorithm in five independent HNSC cohorts. Our analysis revealed that POLR expression was associated with poor clinical characteristics in HNSC patients and served as a negative prognostic factor. Previous studies have shown that increased POLR activity leads to unrestricted cell growth, commonly associated with tumors. Our scRNA-seq data further confirmed that POLR was up-regulated in malignant cells, reinforcing the association between POLRs and a cancerous phenotype.
Driver mutations are central mechanisms for activating carcinogenesis, and identifying cancer driver genes and their downstream effects is critical for designing targeted therapies.38,39 Recent studies have shown that NSD1 deletion promotes tumor progression in in vivo models of squamous cell carcinoma. Importantly, NSD1 is frequently mutated in HNSC, primarily through inactivating mutations.44 We demonstrated that NSD1 mutations were significantly more frequent in the high-POLR group compared to the low-POLR group, suggesting a potential oncogenic role for POLRs. Notably, NSD1 mutations involve dysregulation of G2/M checkpoint-related genes in the cell cycle. In this study, we integrated spatial transcriptomics (ST) data and clinical specimens to further confirm this correlation. Our findings support the hypothesis that POLR over-expression and NSD1 mutations jointly contribute to the oncogenic processes in HNSC.
Tumor development is invariably accompanied by aberrant gene expression changes, closely related to the shuttling of transcription factors due to chromatin reorganization.45 As a histone methyltransferase, NSD1 is critical for coordinated transcriptional control in many models.46 We demonstrate that in squamous carcinoma cells, YY1 regulates the transcription of POLR2C, promoting cell-cycle dysregulation and proliferative phenotypes. YY1 is a well-known oncogenic transcription factor that regulates enhancer-promoter junctions.47,48 Evidence suggests that YY1 is part of the POLR II and POLR III transcription systems, and that YY1-enriched nuclear puncta contain active POLR II. Collectively, these results support the existence of the YY1-POLR2C signaling axis in HNSC.49,50 Notably, the focus of this study was on POLR2C, but this does not mean that other POLR subunits are not important. POLR2C plays a pivotal role in the assembly and stabilization of the RNA polymerase II complex, particularly through dimerization with POLR2J.51 Dysregulation of POLR2C may enhance or alter Pol II activity, contributing to aberrant transcription in cancer cells.52 Besides, POLR2C expression may be specifically up-regulated in certain cancer types (eg HNSC), amplifying its impact on tumor progression.53 Beyond its role in RNA polymerase II, POLR2C may exhibit non-canonical functions, such as stabilizing protein complexes or participating in signaling pathways, which could specifically promote cancer development.54
In the TME, cancer cells evade immune cell-mediated antitumor immunity through various pathways. Although immune cells are diverse, the predominant effector cell type is the T cell.55 It is well known that a lack of T-cell infiltration in tumor tissue significantly contributes to poor prognosis in patients.56 Importantly, NSD1 inactivating mutations define an intrinsic HNSC subtype characterized by reduced macrophage and T-cell infiltration in the TME.44 In other words, NSD1 is considered a driver of immune-deserted tumors. Since high expression of POLR is accompanied by inactivating mutations in NSD1, it is plausible to associate POLR with reduced immune infiltration. We found that patients in the high-POLR group exhibited weaker immune infiltration. Additionally, immune-desert tumors typically respond poorly to immunotherapy, as effective immunotherapy requires robust tumor infiltration by immune cells. Our findings suggest that high POLR expression is associated with increased resistance to immunotherapy in HNSC patients, further indicating an immunosuppressive function of POLRs.
Given POLR’s wide range of expression, we initially investigated its potential impact on the TME. We found that high overall POLR expression may indicate frequent interactions between cancer cells and immune cells, particularly T cells, via MIF signals. Many studies have reported MIF signaling overexpression in various cancers and that MIF-CD74 signaling inhibits T-cell activation by promoting lactate survival and suppressing T-cell activation, a common mechanism through which cancer cells modulate inflammatory cells.57,58 Currently, tumor-TME crosstalk is emerging as an attractive therapeutic target. This suggests that targeting POLRs may be a potential therapeutic strategy to promote CD8+ T cell infiltration, thereby enhancing the immune response against tumors.
We acknowledge several limitations in this study. POLR is widely expressed across various cell types, and although we preliminarily investigated its oncogenic role in cancer cells, its role in other cell types requires further exploration. Additionally, the small sample size in this study may lead to inadequate findings, necessitating large-scale sequencing analysis in a larger cohort. While our results confirm that YY1 regulates POLR2C transcription, the mechanism by which YY1 regulates the entire POLR complex remains unclear. Our group is conducting further in-depth research on this topic.
Conclusion
Our comprehensive multi-omics analysis reveals that POLR is significantly up-regulated in HNSC and is associated with poor clinical outcomes. POLR2C, a key subunit, was identified as a central player in promoting malignant cell proliferation and dysregulation of the cell cycle. High POLR expression correlates with reduced immune cell infiltration, particularly CD8+ T cells, suggesting an immunosuppressive tumor microenvironment. Additionally, the interaction between POLR and MIF signaling pathways may contribute to this immunosuppressive state, leading to poorer responses to immunotherapy (Figure 10). Our findings highlight the potential of targeting POLR as a therapeutic strategy to mitigate malignant proliferation and improve immune infiltration in HNSC.
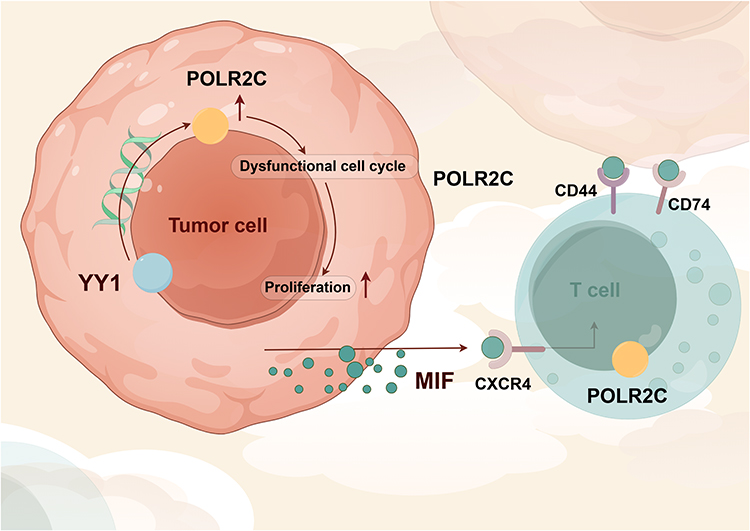 |
Figure 10 Mechanism diagram of this study. |
Data Sharing Statement
The data and materials in the current study are available from the corresponding author: Qi-feng Geng: [email protected].
Ethics Approval and Consent to Participate
The ethics committee of the Affiliated Hospital of Nanjing University of Chinese Medicine approved the study’s protocols, which complied with the Helsinki Declaration and the approved ethical guidelines for biomedical research involving human subjects (including human material or human data) (Ethics approval number: 2022NL-162-02). Before any specimens were collected for research, all subjects were provided with written information and granted their agreement in writing. The patients gave permission for publication. All participants provided written consent to the first author prior to data collection regarding their participation and the eventual publication of the study results. The animal ethics committee of the Affiliated Hospital of Nanjing University of Chinese Medicine approved all animal experiments, which were carried out in compliance with the Basel Declaration (Ethics approval number: 2024DW-033-01).
Consent for Publication
All authors have given their consent for publication.
Acknowledgments
We thank all authors for their contributions.
Author Contributions
All authors made a significant contribution to the work reported, whether that is in the conception, study design, execution, acquisition of data, analysis and interpretation, or in all these areas; took part in drafting, revising or critically reviewing the article; gave final approval of the version to be published; have agreed on the journal to which the article has been submitted; and agree to be accountable for all aspects of the work.
Funding
The present study was supported by Natural Science Foundation of China (82205212).
Disclosure
The authors declare no conflicts of interest in this work.
References
1. Johnson DE, Burtness B, Leemans CR, Lui VWY, Bauman JE, Grandis JR. Head and neck squamous cell carcinoma. Nature Reviews Disease Primers. 2020;6:92. doi:10.1038/s41572-020-00224-3
2. Marur S, Forastiere AA. Head and neck squamous cell carcinoma: update on epidemiology, diagnosis, and treatment. Mayo Clin Proc. 2016;91:386–396. doi:10.1016/j.mayocp.2015.12.017
3. Mooney RA, Landick R. RNA polymerase unveiled. Cell. 1999;98:687–690. doi:10.1016/S0092-8674(00)81483-X
4. Hurwitz J. The discovery of RNA polymerase. J Biol Chem. 2005;280:42477–42485. doi:10.1074/jbc.X500006200
5. Gelles J, Landick R. RNA polymerase as a molecular motor. Cell. 1998;93:13–16. doi:10.1016/S0092-8674(00)81140-X
6. Bae B, Feklistov A, Lass-Napiorkowska A, Landick R, Darst SA. Structure of a bacterial RNA polymerase holoenzyme open promoter complex. eLife. 2015;4. doi:10.7554/eLife.08504
7. Venkataraman S, Prasad B, Selvarajan R. RNA dependent RNA polymerases: insights from structure, function and evolution. Viruses. 2018;10. doi:10.3390/v10020076
8. Helmann JD. RNA polymerase: a nexus of gene regulation. Methods. 2009;47:1–5.
9. Quail DF, Joyce JA. Microenvironmental regulation of tumor progression and metastasis. Nature Med. 2013;19:1423–1437. doi:10.1038/nm.3394
10. Elhamamsy AR, Metge BJ, Alsheikh HA, Shevde LA, Samant RS. Ribosome biogenesis: a central player in cancer metastasis and therapeutic resistance. Cancer Res. 2022;82:2344–2353. doi:10.1158/0008-5472.CAN-21-4087
11. Hutter C, Zenklusen JC. The cancer genome atlas: creating lasting value beyond its data. Cell. 2018;173:283–285. doi:10.1016/j.cell.2018.03.042
12. Alameer A, Chicco D. geoCancerPrognosticDatasetsRetriever: a bioinformatics tool to easily identify cancer prognostic datasets on Gene Expression Omnibus (GEO. Bioinformatics. 2022;38:1761–1763. doi:10.1093/bioinformatics/btab852
13. Liu Z, Liu L, Weng S, et al. BEST: a web application for comprehensive biomarker exploration on large-scale data in solid tumors. J Big Data. 2023;10:165. doi:10.1186/s40537-023-00844-y
14. Hänzelmann S, Castelo R, Guinney J. GSVA: gene set variation analysis for microarray and RNA-Seq data. BMC Bioinf. 2013;14:7. doi:10.1186/1471-2105-14-7
15. Wilson S, Fitzsimons M, Ferguson M, et al. Developing cancer informatics applications and tools using the NCI genomic data commons API. Cancer Res. 2017;77:e15–e18. doi:10.1158/0008-5472.CAN-17-0598
16. Liu H, Zhang W, Zhang Y, et al. Mime: a flexible machine-learning framework to construct and visualize models for clinical characteristics prediction and feature selection. Comput Struct Biotechnol J. 2024;23:2798–2810. doi:10.1016/j.csbj.2024.06.035
17. Sun D, Wang J, Han Y, et al. TISCH: a comprehensive web resource enabling interactive single-cell transcriptome visualization of tumor microenvironment. Nucleic Acids Res. 2020;49:D1420–D1430. doi:10.1093/nar/gkaa1020
18. Blanco-Carmona E. Generating publication ready visualizations for single cell transcriptomics using SCpubr. bioRxiv. 2022;2022:2022–02.
19. Zhang P, Pei S, Gong Z, et al. By integrating single-cell RNA-seq and bulk RNA-seq in sphingolipid metabolism, CACYBP was identified as a potential therapeutic target in lung adenocarcinoma. Front Immunol. 2023;14:1115272. doi:10.3389/fimmu.2023.1115272
20. Chen LX, Zeng SJ, Liu XD, Tang HB, Wang JW, Jiang Q. Cell-cell communications shape tumor microenvironment and predict clinical outcomes in clear cell renal carcinoma. J Transl Med. 2023;21:113. doi:10.1186/s12967-022-03858-x
21. Lu H, Ping J, Zhou G, et al. CommPath: an R package for inference and analysis of pathway-mediated cell-cell communication chain from single-cell transcriptomics. Comput Struct Biotech J. 2022;20:5978–5983. doi:10.1016/j.csbj.2022.10.028
22. Shi J, Wei X, Xun Z, et al. The web-based portal SpatialTME integrates histological images with single-cell and spatial transcriptomics to explore the tumor microenvironment. Cancer Res. 2024;84:1210–1220. doi:10.1158/0008-5472.CAN-23-2650
23. Liu YJ, Li JP, Zhang Y, et al. FSTL3 is a prognostic biomarker in gastric cancer and is correlated with M2 macrophage infiltration. OncoTargets Ther. 2021;14:4099–4117. doi:10.2147/OTT.S314561
24. Campos MA, Macedo S, Fernandes MS, et al. Prognostic significance of RAS mutations and P53 expression in cutaneous squamous cell carcinomas. Genes. 2020;11. doi:10.3390/genes11070751
25. Wang Q, Chen P, Wang X, et al. piR-36249 and DHX36 together inhibit testicular cancer cells progression by upregulating OAS2. Non-Coding RNA Res. 2023;8:174–186. doi:10.1016/j.ncrna.2022.12.004
26. Balasubramanian S, Chen J, Wigneswaran V, Bang-Berthelsen CH, Jensen PR. Droplet-based microfluidic high throughput screening of Corynebacterium glutamicum for efficient heterologous protein production and secretion. Front Bioeng Biotechnol. 2021;9:668513. doi:10.3389/fbioe.2021.668513
27. Zhang Y, Cuevas S, Asico LD, et al. Deficient dopamine D2 receptor function causes renal inflammation independently of high blood pressure. PLoS One. 2012;7:e38745. doi:10.1371/journal.pone.0038745
28. Salvamoser R, Brinkmann K, O’Reilly LA, Whitehead L, Strasser A, Herold MJ. Characterisation of mice lacking the inflammatory caspases-1/11/12 reveals no contribution of caspase-12 to cell death and sepsis. Cell Death Diff. 2019;26:1124–1137. doi:10.1038/s41418-018-0188-2
29. Zhang Q, Huang H, Zheng F, et al. Resveratrol exerts antitumor effects by downregulating CD8(+)CD122(+) Tregs in murine hepatocellular carcinoma. Oncoimmunology. 2020;9:1829346. doi:10.1080/2162402X.2020.1829346
30. Eyre TA, Ducluzeau F, Sneddon TP, Povey S, Bruford EA, Lush MJ. The HUGO gene nomenclature database, 2006 updates. Nucleic Acids Res. 2006;34:D319–321. doi:10.1093/nar/gkj147
31. Goodfellow SJ, Zomerdijk JCBM. Basic mechanisms in RNA polymerase I transcription of the ribosomal RNA genes. In: Kundu TK, editor. Epigenetics: Development and Disease. Netherlands, Dordrecht: Springer; 2013:211–236.
32. Dakal TC, Dhabhai B, Pant A, et al. Oncogenes and tumor suppressor genes: functions and roles in cancers. MedComm. 2024;5:e582. doi:10.1002/mco2.582
33. Hosea R, Hillary S, Wu S, Kasim V. Targeting transcription factor YY1 for cancer treatment: current strategies and future directions. Cancers. 2023;15:3506. doi:10.3390/cancers15133506
34. Li B, Wang J, Liao J, et al. YY1 promotes pancreatic cancer cell proliferation by enhancing mitochondrial respiration. Can Cell Inter. 2022;22:287. doi:10.1186/s12935-022-02712-w
35. Li Y, Goldberg EM, Chen X, et al. Histone methylation antagonism drives tumor immune evasion in squamous cell carcinomas. Mol Cell. 2022;82:3901–3918.e3907. doi:10.1016/j.molcel.2022.09.007
36. Ferreira R, J.s. S Jr, Panov KI, Hannan KM, Hannan RD. Targeting the RNA polymerase I transcription for cancer therapy comes of age. Cells. 2020;9:266. doi:10.3390/cells9020266
37. Petrie JL, Swan C, Ingram RM, et al. Effects on prostate cancer cells of targeting RNA polymerase III. Nucleic Acids Res. 2019;47:3937–3956. doi:10.1093/nar/gkz128
38. Olaoba OT, Adelusi TI, Yang M, et al. Driver mutations in pancreatic cancer and opportunities for targeted therapy. Cancers. 2024;16:1808. doi:10.3390/cancers16101808
39. Colaprico A, Olsen C, Bailey MH, et al. Interpreting pathways to discover cancer driver genes with moonlight. Nat Commun. 2020;11:69. doi:10.1038/s41467-019-13803-0
40. Topchu I, Bychkov I, Gursel D, Makhov P, Boumber Y. NSD1 supports cell growth and regulates autophagy in HPV-negative head and neck squamous cell carcinoma. Cell Death Discovery. 2024;10:75. doi:10.1038/s41420-024-01842-6
41. Topchu I, Pangeni RP, Bychkov I, et al. The role of NSD1, NSD2, and NSD3 histone methyltransferases in solid tumors. Cell Mol Life Sci. 2022;79:285. doi:10.1007/s00018-022-04321-2
42. Choufani S, Cytrynbaum C, Chung BH, et al. NSD1 mutations generate a genome-wide DNA methylation signature. Nat Commun. 2015;6:10207. doi:10.1038/ncomms10207
43. Rauluseviciute I, Riudavets-Puig R, Blanc-Mathieu R, et al. JASPAR 2024: 20th anniversary of the open-access database of transcription factor binding profiles. Nucleic Acids Res. 2024;52:D174–d182. doi:10.1093/nar/gkad1059
44. Brennan K, Shin JH, Tay JK, et al. NSD1 inactivation defines an immune cold, DNA hypomethylated subtype in squamous cell carcinoma. Sci Rep. 2017;7:17064. doi:10.1038/s41598-017-17298-x
45. Okabe A, Kaneda A. Transcriptional dysregulation by aberrant enhancer activation and rewiring in cancer. Cancer Sci. 2021;112:2081–2088. doi:10.1111/cas.14884
46. Tauchmann S, Schwaller J, Huang M. NSD1: a lysine methyltransferase between developmental disorders and cancer. Life. 2021;12:11. doi:10.3390/life12010011
47. Meliala ITS, Hosea R, Kasim V, Wu S. The biological implications of Yin Yang 1 in the hallmarks of cancer. Theranostics. 2020;10:4183–4200. doi:10.7150/thno.43481
48. Gordon S, Akopyan G, Garban H, Bonavida B. Transcription factor YY1: structure, function, and therapeutic implications in cancer biology. Oncogene. 2006;25:1125–1142. doi:10.1038/sj.onc.1209080
49. Wang W, Qiao S, Li G, et al. A histidine cluster determines YY1-compartmentalized coactivators and chromatin elements in phase-separated enhancer clusters. Nucleic Acids Res. 2022;50:4917–4937. doi:10.1093/nar/gkac233
50. Kurose K, Hata K, Hattori M, Sakaki Y. RNA polymerase III dependence of the human L1 promoter and possible participation of the RNA polymerase II factor YY1 in the RNA polymerase III transcription system. Nucleic Acids Res. 1995;23:3704–3709. doi:10.1093/nar/23.18.3704
51. Lynch CJ, Bernad R, Calvo I, et al. The RNA polymerase II factor RPAP1 is critical for mediator-driven transcription and cell identity. Cell Reports. 2018;22:396–410. doi:10.1016/j.celrep.2017.12.062
52. Muste Sadurni M, Saponaro M. Deregulations of RNA Pol II subunits in cancer. Appl Biosci. 2023;2:459–476. doi:10.3390/applbiosci2030029
53. Huang J, Ji X. Never a dull enzyme, RNA polymerase II. Transcription. 2023;14:49–67. doi:10.1080/21541264.2023.2208023
54. Kolodziej P, Young RA. RNA polymerase II subunit RPB3 is an essential component of the mRNA transcription apparatus. Mol Cell Biol. 1989;9:5387–5394. doi:10.1128/mcb.9.12.5387-5394.1989
55. Sadeghi Rad H, Monkman J, Warkiani ME, et al. Understanding the tumor microenvironment for effective immunotherapy. Med Res Rev. 2021;41:1474–1498. doi:10.1002/med.21765
56. Anderson KG, Stromnes IM, Greenberg PD. Obstacles posed by the tumor microenvironment to T cell activity: a case for synergistic therapies. Cancer Cell. 2017;31:311–325. doi:10.1016/j.ccell.2017.02.008
57. Noe JT, Mitchell RA. MIF-dependent control of tumor immunity. Front Immunol. 2020;11:609948. doi:10.3389/fimmu.2020.609948
58. Figueiredo CR, Azevedo RA, Mousdell S, et al. Blockade of MIF-CD74 signalling on macrophages and dendritic cells restores the antitumour immune response against metastatic melanoma. Front Immunol. 2018;9:1132. doi:10.3389/fimmu.2018.01132
 © 2025 The Author(s). This work is published and licensed by Dove Medical Press Limited. The
full terms of this license are available at https://www.dovepress.com/terms.php
and incorporate the Creative Commons Attribution
- Non Commercial (unported, 3.0) License.
By accessing the work you hereby accept the Terms. Non-commercial uses of the work are permitted
without any further permission from Dove Medical Press Limited, provided the work is properly
attributed. For permission for commercial use of this work, please see paragraphs 4.2 and 5 of our Terms.
© 2025 The Author(s). This work is published and licensed by Dove Medical Press Limited. The
full terms of this license are available at https://www.dovepress.com/terms.php
and incorporate the Creative Commons Attribution
- Non Commercial (unported, 3.0) License.
By accessing the work you hereby accept the Terms. Non-commercial uses of the work are permitted
without any further permission from Dove Medical Press Limited, provided the work is properly
attributed. For permission for commercial use of this work, please see paragraphs 4.2 and 5 of our Terms.
Recommended articles
Overexpression of NRP1 is Associated with Poor Prognosis via Accelerating Immunosuppression in Head and Neck Squamous Cell Carcinoma
Yang X, Xu T, Song X, Wu Y
International Journal of General Medicine 2023, 16:2819-2829
Published Date: 4 July 2023
Chronic Inflammatory and Immune Microenvironment Promote Hepatocellular Carcinoma Evolution
Chen S, Zhang L, Chen Y, Zhang X, Ma Y
Journal of Inflammation Research 2023, 16:5287-5298
Published Date: 15 November 2023
HDAC1 Mediates Immunosuppression of the Tumor Microenvironment in Non-Small Cell Lung Cancer

Fan Y, Ji X, Yuan K, Wu Q, Lou M
Journal of Inflammation Research 2025, 18:3333-3347
Published Date: 8 March 2025