")
Back to Journals » Nature and Science of Sleep » Volume 17
Construction and Validation of a Machine Learning-Based Risk Prediction Model for Sleep Quality in Patients with OSA
Authors Tong Y, Wen K, Li E, Ai F, Tang P , Wen H, Guo B
Received 20 January 2025
Accepted for publication 20 May 2025
Published 12 June 2025 Volume 2025:17 Pages 1271—1289
DOI https://doi.org/10.2147/NSS.S516912
Checked for plagiarism Yes
Review by Single anonymous peer review
Peer reviewer comments 2
Editor who approved publication: Dr Valentina Alfonsi
Yangyang Tong,1 Kuo Wen,2 Enguang Li,3 Fangzhu Ai,4 Ping Tang,5 Hongjuan Wen,3 Botang Guo5
1Department of Pulmonary Oncology, Affiliated Hospital of Changchun University of Traditional Chinese Medicine, Changchun, Jilin, 130117, People’s Republic of China; 2College of Traditional Chinese Medicine, Changchun University of Traditional Chinese Medicine, Changchun, Jilin, 130117, People’s Republic of China; 3College of Health Management, Changchun University of Traditional Chinese Medicine, Changchun, Jilin, 130117, People’s Republic of China; 4School of Nursing, Jinzhou Medical University, Jinzhou, Liaoning Province, 121000, People’s Republic of China; 5Department of General Practice, the Affiliated Luohu Hospital of Shenzhen University Medical School, Shenzhen, 518001, People’s Republic of China
Correspondence: Botang Guo, Department of General Practice, The Affiliated Luohu Hospital of Shenzhen University Medical School, Shenzhen, 518001, People’s Republic of China, Email [email protected] Hongjuan Wen, College of Health Management, Changchun University of Traditional Chinese Medicine, Changchun, Jilin, 130117, People’s Republic of China, Email [email protected]
Objective: The aim of this study was to establish a risk prediction model for sleep quality in patients with obstructive sleep apnea (OSA) based on machine learning algorithms with optimal predictive performance.
Methods: A total of 400 OSA patients were included in this study. A LightGBM model was constructed and compared with other machine learning models, in terms of performance metrics such as the area under the receiver operating characteristic curve (AUC), calibration curves, and decision curve analysis (DCA). The SHapley Additive exPlanation (SHAP) analysis was used to interpret the model and identify key predictors of sleep quality.
Results: The LightGBM model demonstrated the best predictive performance, with an AUC of 0.910 in the validation set, outperforming support vector machine and random forest. SHAP analysis identified six key predictors of sleep quality: depressive symptoms, OSA duration, oxygen desaturation index (ODI), anxiety symptoms, exercise frequency, and coffee consumption. The model’s calibration curve indicated a high degree of agreement between predicted and observed outcomes, and DCA confirmed its clinical utility.
Conclusion: The LightGBM model is the best choice for predicting sleep quality in patients with OSA. Depressive symptoms and ODI were the most influential factors negatively associated with sleep quality. This study not only deepens understanding of the factors affecting sleep quality in OSA patients, but also provides a powerful predictive tool for clinical doctors. Future research can explore the potential of incorporating these predictive factors into comprehensive treatment strategies to improve patient prognosis and overall quality of life.
Keywords: machine learning, risk prediction, sleep quality, OSA, SHAP
Introduction
Obstructive Sleep Apnea (OSA), also known as Obstructive Sleep Apnea Hypopnea Syndrome (OSAHS), is a common chronic sleep breathing disorder. The typical manifestation of OSA is repeated collapse or obstruction of the upper respiratory tract during sleep, leading to obstruction of airflow, which in turn causes intermittent hypoxia, hypercapnia, decreased blood oxygen saturation, and sleep-wake problems.1 According to global statistics in 2019, about 1 billion people suffer from OSA, and the prevalence rate in some countries is even over 50%.2 China has the largest number of affected individuals, followed by the United States, Brazil, and India.3 Due to factors such as repeated symptoms, limited treatment effects and economic burden, OSA patients often face great physical and mental stress, which in turn exacerbates sleep quality problems and forms a vicious circle.4
Sleep quality is crucial to the body’s recovery, immune system regulation, endocrine balance and nerve function repair, and directly reflects an individual’s overall health.5,6 Good sleep helps restore all body systems, while poor sleep quality may lead to endocrine disorders, decreased immune function, cognitive decline and other problems.7 Chronic sleep deprivation may also increase the risk of mental disorders, cardiovascular disease, diabetes, obesity and other chronic diseases.8,9 OSA patients often feel drowsy during the day due to frequent awakenings and are unable to enter deep sleep, which affects work efficiency and quality of life. In severe cases, it may even lead to safety issues such as traffic accidents.10,11 The high prevalence of OSA and its negative impact on sleep quality have become major challenges to global public health. Therefore, timely screening and improving the sleep quality of OSA patients helps improve their quality of life and effectively reduces health risks and the burden on society and the medical system.
Although there are currently some screening tools for assessing the sleep quality of OSA patients, there are still many challenges. Traditional screening questionnaires often rely on subjective feedback from patients, which is easily affected by factors such as emotions and cultural background, affecting the accuracy of predictions. Statistical models such as logistic regression also have limitations when dealing with high-dimensional data. They are prone to overfitting, resulting in poor generalization ability and difficulty effectively coping with complex feature interactions. Although Nomogram models have achieved good results in some fields, their complexity and lack of real-time capabilities make them difficult for non-professionals to use, limiting their popularity in clinical settings.12
Compared to traditional methods such as logistic regression and subjective scoring tools, this study employs advanced machine learning algorithms to combine objective clinical indicators with psychosocial factors. This approach better handles complex nonlinear interactions and enhances overall predictive accuracy. Furthermore, the SHAP algorithm provides clear and quantifiable insights for individual predictions, making it more suitable for real-world clinical decision-making. Therefore, this study aims to utilize data from patients with OSA to develop and compare sleep quality prediction models based on seven machine learning algorithms, select the most effective model, and explain its key features. The findings will help identify OSA patients at high risk of poor sleep quality. By achieving early identification and implementing timely and targeted interventions, the prognosis for OSA patients can be improved, and the long-term medical burden alleviated.
Materials and Methods
Study Design and Participants
This study was conducted from January 2023 to December 2024. Using a convenient sampling method, patients diagnosed with OSA from the Sleep Monitoring Center of the Pulmonary Oncology Department of the Affiliated Hospital of Changchun University of Traditional Chinese Medicine and the Sleep Monitoring Center of Luohu Hospital Affiliated to Shenzhen University School of Medicine were selected as research subjects. Inclusion criteria: (a) age ≥ 18 years, informed consent and voluntary participation in the study; (b) clear consciousness, able to provide complete questionnaire data and relevant clinical information; (c) Patients diagnosed with OSA at the sleep monitoring center, with a diagnosis based on an apnea-hypopnea index (AHI) > 5, and meeting the diagnostic criteria set forth in the “Guidelines for the Diagnosis and Treatment of Obstructive Sleep Apnea-Hypopnea Syndrome” established by the Respiratory Disease Branch of the Chinese Medical Association in 2011. (d) Patients who have not received OSA treatment (such as Continuous Positive Airway Pressure (CPAP) or Automatic Positive Airway Pressure (APAP) treatment) or cannot tolerate CPAP and mandibular advancement device treatment, to ensure the natural progression of the disease is observed. Exclusion criteria: (a) patients with severe mental illness or cognitive impairment; (b) pregnant or lactating female patients were excluded because they may affect sleep quality and research results. All procedures were carried out in accordance with the 1964 helsinki declaration, and the research proposal was approved by the Ethics Committee of the Affiliated Hospital of Changchun University of Traditional Chinese Medicine (CCZYFYLL-SQ-2025-002). All study participants provided informed consent.
Sample Size
According to Kendall’s requirements for sample size in multiple-factor analysis, the sample size for a study of influential factors should be 5 to 10 times the number of variables. According to the research design, this study included 37 variables (age, gender, body mass index (BMI), cerebrovascular disease (CVD), AHI, oxygen desaturation index (ODI), mean oxygen saturation (MSaO2), lowest oxygen saturation (LSaO2), sleep quality (7 dimensions), perceived stress (2 dimensions), and social support (3 dimensions)). Therefore, the required sample size ranged from 185 to 370 cases. Considering a 20% sample attrition rate and a convenient sampling error, the final estimated sample size was 222 to 444 cases. In the actual study, a total of 295 questionnaires were distributed to the Sleep Monitoring Center of the Lung Cancer Department of the Affiliated Hospital of Changchun University of Traditional Chinese Medicine, and 280 valid questionnaires were recovered, with an effective recovery rate of 94.9%. This dataset was used as the training set. A total of 130 questionnaires were distributed to the Sleep Monitoring Center of Luohu Hospital Affiliated to Shenzhen University School of Medicine, and 120 valid questionnaires were recovered, with an effective recovery rate of 92.3%. This dataset was used as the validation set, and the collected samples all met the sample size requirements.
Outcome Variable
The Pittsburgh Sleep Quality Index (PSQI) was developed by psychiatrist Buysse et al at the University of Pittsburgh in 1989 to evaluate the sleep quality of subjects over the past month.13 The purpose of this study is solely for scientific and educational purposes, and the original author allows free use of this questionnaire. The scale contained 24 items, of which the 19th self-assessment item and five others were not scored, making up a total of 18 self-assessment items that are scored. The 18 self-assessment items were grouped into seven dimensions: sleep quality, time to fall asleep, time in bed, sleep efficiency, sleep disturbances, hypnotic drugs and daytime dysfunction. Each factor was scored on a scale of 0 to 3, and the scores for each factor were summed to give an overall score (0 to 21). The higher the score, the worse the sleep quality. Generally, a PSQI score of <7 indicated good sleep quality, while a score of ≥7 indicated poor sleep quality.
Predictor Variables
This study identified the predictors of sleep quality in OSA patients through a comprehensive search of relevant literature, consultation with experts at the Sleep Monitoring Center, and clinical experience. These included sociodemographic variables, clinical objective indicators, depressive symptoms, anxiety symptoms, daytime sleepiness, social support, and perceived stress.
Sociodemographic Variables
The sociodemographic variables were obtained using a general information questionnaire designed by the researcher. The questionnaire included age, gender, education level, marital status, per capita monthly income, OSA duration, smoking status, alcohol consumption status, coffee consumption status, weekly exercise, hypertension, diabetes, and heart disease.
Clinical Objective Indicators
Clinical objective indicators, included BMI, CVD, hyperlipidemia, AHI, OSA severity, ODI, total sleep time, MSaO2, and LSaO2, were mainly measured through medical equipment such as polysomnography (PSG), pulse oximetry, blood tests, etc.
Depressive Symptoms
The Patient Health Questionnaire-9 (PHQ-9) scale was originally developed in 1999 by American psychiatrist Robert L. Spitzer and others based on the Diagnostic and Statistical Manual of Mental Disorders, 4th Edition (DSM-IV), and was a commonly used self-assessment depression scale.14 The original author of the scale has designed it as a universal scale, which can be used publicly (Please refer to https://www.phqscreeners.com/ for details). It was localized and revised in 2007 by Xu Yong and others in a community-dwelling elderly population. The Chinese version had good reliability and validity in the Chinese population, with a Cronbach’s α coefficient of 0.857.15 The scale consisted of 9 questions, each with a score range of 0 to 3, for a total score range of 0 to 27. The higher the score, the more severe the depressive symptoms. According to the scoring criteria for the PHQ-9, 0 to 4 indicated no depression, 5 to 9 indicated mild depression, 10 to 14 indicated moderate depression, 15 to 19 indicated moderate to severe depression, and 20 to 27 indicated severe depression.
Anxiety Symptoms
The Generalized Anxiety Disorder 7-item scale (GAD-7) was developed in 2006 by American psychiatrist Robert L. Spitzer and others based on the fourth edition of the DSM-IV and was mainly used to screen for generalized anxiety disorder and assessed the severity of anxiety.16 The original author of the scale has designed it as a universal scale, which can be used publicly (Please refer to https://www.phqscreeners.com/ for details). The GAD-7 scale had been widely validated and has good reliability and validity.17 The GAD-7 scale used a four-level scoring system, with zero represented “not at all”, 1 represented “a few days”, 2 represented “more than half the days”, and three represented “almost every day”. The total score was obtained by adding the scores of the seven questions. The scale also included options to assess the degree of difficulty, but these were not included in the total score. The total score of the GAD-7 ranges from 0 to 21, and a higher score indicated more severe anxiety symptoms. According to the scoring standard, 0–4 points indicated no anxiety, 5–9 points indicated mild anxiety, 10–14 points indicated moderate anxiety, and 15–21 points indicated severe anxiety.
Daytime Sleepiness
The Epworth Sleepiness Scale (ESS) was designed by Australian sleep expert John S. E. Murray in 1991 and was primarily used for subjective assessment of daytime sleepiness. It was a widely used simple tool for sleepiness assessment internationally.18 The use of the Chinese translation of ESS in our study was authorized by Mapi Research Trust (No.113533). The ESS consisted of 8 questions with four response options (0–3 points, representing “never”, “mild”, “moderate”, and “severe”, respectively). The total score ranges from 0 to 24 points, with a higher score indicating a greater likelihood of daytime sleepiness. The specific scoring criteria are: 0–6 points was normal, 7–11 points was drowsy, 12–16 points was excessively drowsy, and 17–24 points was dangerously drowsy.
Social Support
The Social Support Rating Scale (SSRS) was designed by Chinese scholar Xiao Shuiyuan from 1986 to 1993 to assess an individual’s level of social support.19 The scale measured social relationships through 3 dimensions (objective support, subjective support, and utilization of social support) with 10 items. The scale has been authorized for use by the original author. The specific items reflected practical, emotional, and active support utilization, respectively. After long-term use, the scale was well-designed and easy to understand, reliable and valid, and suitable for use with the Chinese population.20 According to the total score, the level of social support was divided into three levels: low (≤22 points), medium (23–44 points), and high (≥45 points).
Stress Perception
American scholars Cohen S and others developed the Perceived Stress Scale (PSS),21 and Yang Tingzhong and others translated it into Chinese as the CPSS in 2003. The use of the Chinese translation of PSS in our study was authorized by Mapi Research Trust (No.113489). The scale had 14 items, covering the two dimensions of tension and a sense of loss of control, with an overall Cronbach’s α coefficient of 0.78.22 A Likert five-point scale (0 to 4) was used, with 4, 5, 6, 7, 9, 10, and 13 being reverse items. The higher the total score, the stronger the perceived stress. The score was divided into slight stress (0–28 points), noticeable stress (29–42 points), and excessive stress (43–56 points).
Feature Screening and Model Development
All Statistical analyses were performed using R version 4.2.3 and python version 3.11.4. For continuous variables that follow a normal distribution, Mean ± standard deviation (SD) was used for representation, and the independent sample t-test was used for comparisons between groups; for continuous variables that do not follow a normal distribution, the median (M) and interquartile range (Q₁, Q₃) were used for representation, and the Mann–Whitney U-test was used for comparisons between groups. Categorical variables were expressed as n(%), and group differences were analyzed using the chi-square test. To avoid multiple collinearities between variables, the mlr3 and glmnet packages in R software performed a 5-fold cross-validation lasso regression analysis on the training set data to determine the optimal regularization parameter (lambda.1se) and screen for predictors. Subsequently, the selected predictors were analyzed using univariate and multivariate logistic regression to determine the predictors of sleep quality in OSA patients (P value < 0.05). Based on the features after logistic regression analysis, the hyperparameters of each machine learning algorithm were optimized using a 5-fold cross-validation grid search method. The optimal hyperparameters for each model are shown in Table S1. Based on the optimal hyperparameters, this study constructed eight prediction models, including decision tree (DT), k-nearest neighbour (KNN), logistic regression (LR), random forest (RF), Support Vector Machine (SVM), Extreme Gradient Boosting (XGBoost), Multi-layer perceptron (MLP) and light Gradient Boosting Machine (LightGBM).
Model Evaluation and Interpretability
The model’s performance was verified and evaluated using the validation set data. The discriminatory performance of each model was measured using the area under the receiver operating characteristic (ROC) curve (AUC), accuracy, precision, recall, and F1 score. The calibration of the model was assessed by the calibration curve to evaluate the consistency between the predicted probability and the actual result. The decision curve analysis (DCA) was used to evaluate the utility and value of the model in actual clinical applications. The optimal machine learning algorithm model was selected based on a comprehensive comparison of these three performances. Finally, the SHapley Additive exPlanation (SHAP) algorithm was applied to the best model to explore its interpretability and identify the main risk factors. The SHAP algorithm provided global and local interpretability by fairly assigning feature contributions based on Shapley values, which can reveal complex interactions between features, thereby improving the transparency and credibility of the model and preventing overfitting. At the same time, the visualization tool helped users intuitively understand the model decisions, which helped further optimize the interpretability and performance of the model.
Results
Baseline Characteristics
Participants were randomly divided into a training set (280 cases) and a validation set (120 cases). There were no significant differences in baseline characteristics between the two groups (P > 0.05), and the data distribution was shown in Table 1. Among the 280 OSA patients in the training set, the average age was 44, and 90% were male. Among them, 196 patients had poor sleep quality, with a high incidence rate of 70%. Compared with OSA patients with good sleep quality, OSA patients with poor sleep quality often show obesity, increased frequency of alcohol consumption, increased frequency of coffee consumption, decreased exercise, hypertension, heart disease, hyperlipidemia, high OSA severity, symptoms of depression and anxiety, daytime sleepiness, increased stress, decreased social support, etc. The baseline data distribution of the training set was shown in Table 2.
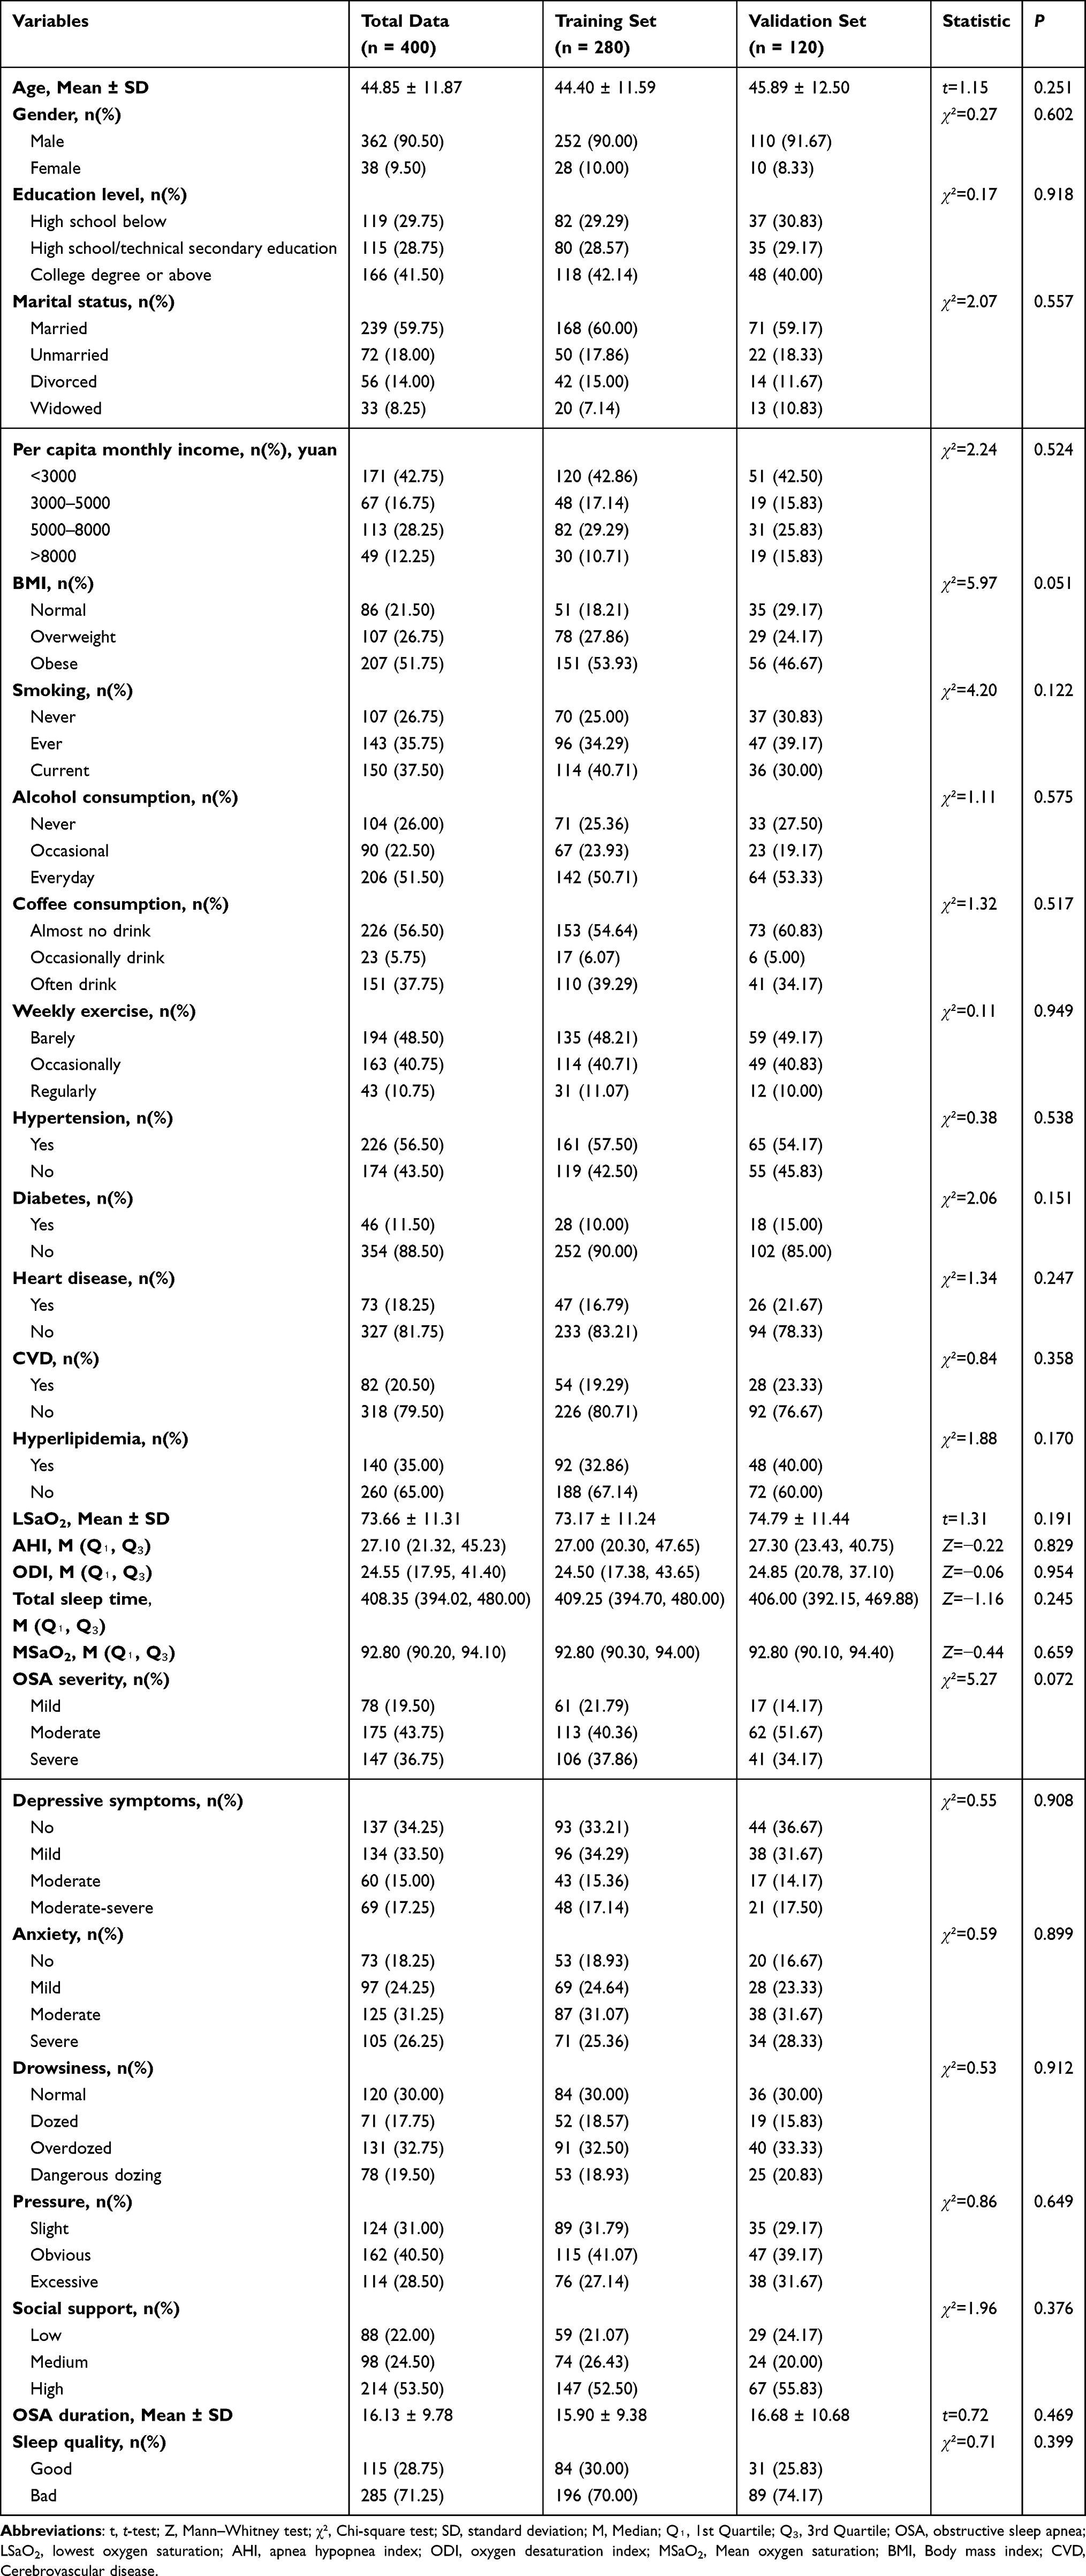 |
Table 1 Comparison of Baseline Data Between Training Set and Validation Set |
 |
Table 2 Distribution of Baseline Data in the Training Set |
Scale Reliability Analysis
The Cronbach’s α values for all scales in this study were as follows: PSQI was 0.967, PHQ-9 was 0.923, GAD-7 was 0.939, ESS was 0.949, SSRS was 0.789, and CPSS was 0.982. The reliability of all scales had reached an acceptable level, indicating high internal consistency in this study, which was suitable for evaluating the sleep quality and related psychosocial factors of OSA patients.
Predictive Variable Screening
According to the cross-validation method of Lasso regression, two sets of regularization parameters were finally determined, namely lambda.min (0.0132744) and lambda.1se (0.05358897). In order to improve the generalization ability of the model and reduce overfitting, lambda.1se (0.05358897) was selected as this study’s optimal regularisation parameter. Under this parameter, 11 potential predictors were screened, including coffee consumption, exercise, heart disease, OSA severity, anxiety, depressive symptoms, sleepiness, social support, OSA duration, ODI and LSaO2. The detailed process of Lasso screening for predictors is shown in Figure 1. To screen the predictors further, this study continued to include the 11 predictors Lasso screened in the univariate and multivariate logistic regression analyses. These analyses further screened the most significant and predictive variables, reducing redundant features, improving the model’s accuracy, and ensuring that the selected variables contributed the most to the prediction results. Ultimately, six key features that affect the sleep quality of OSA patients were identified: coffee consumption, weekly exercise, anxiety, depressive symptoms, OSA duration, and ODI. The specific process of the univariate and multivariate logistic regression analyses was shown in Table 3.
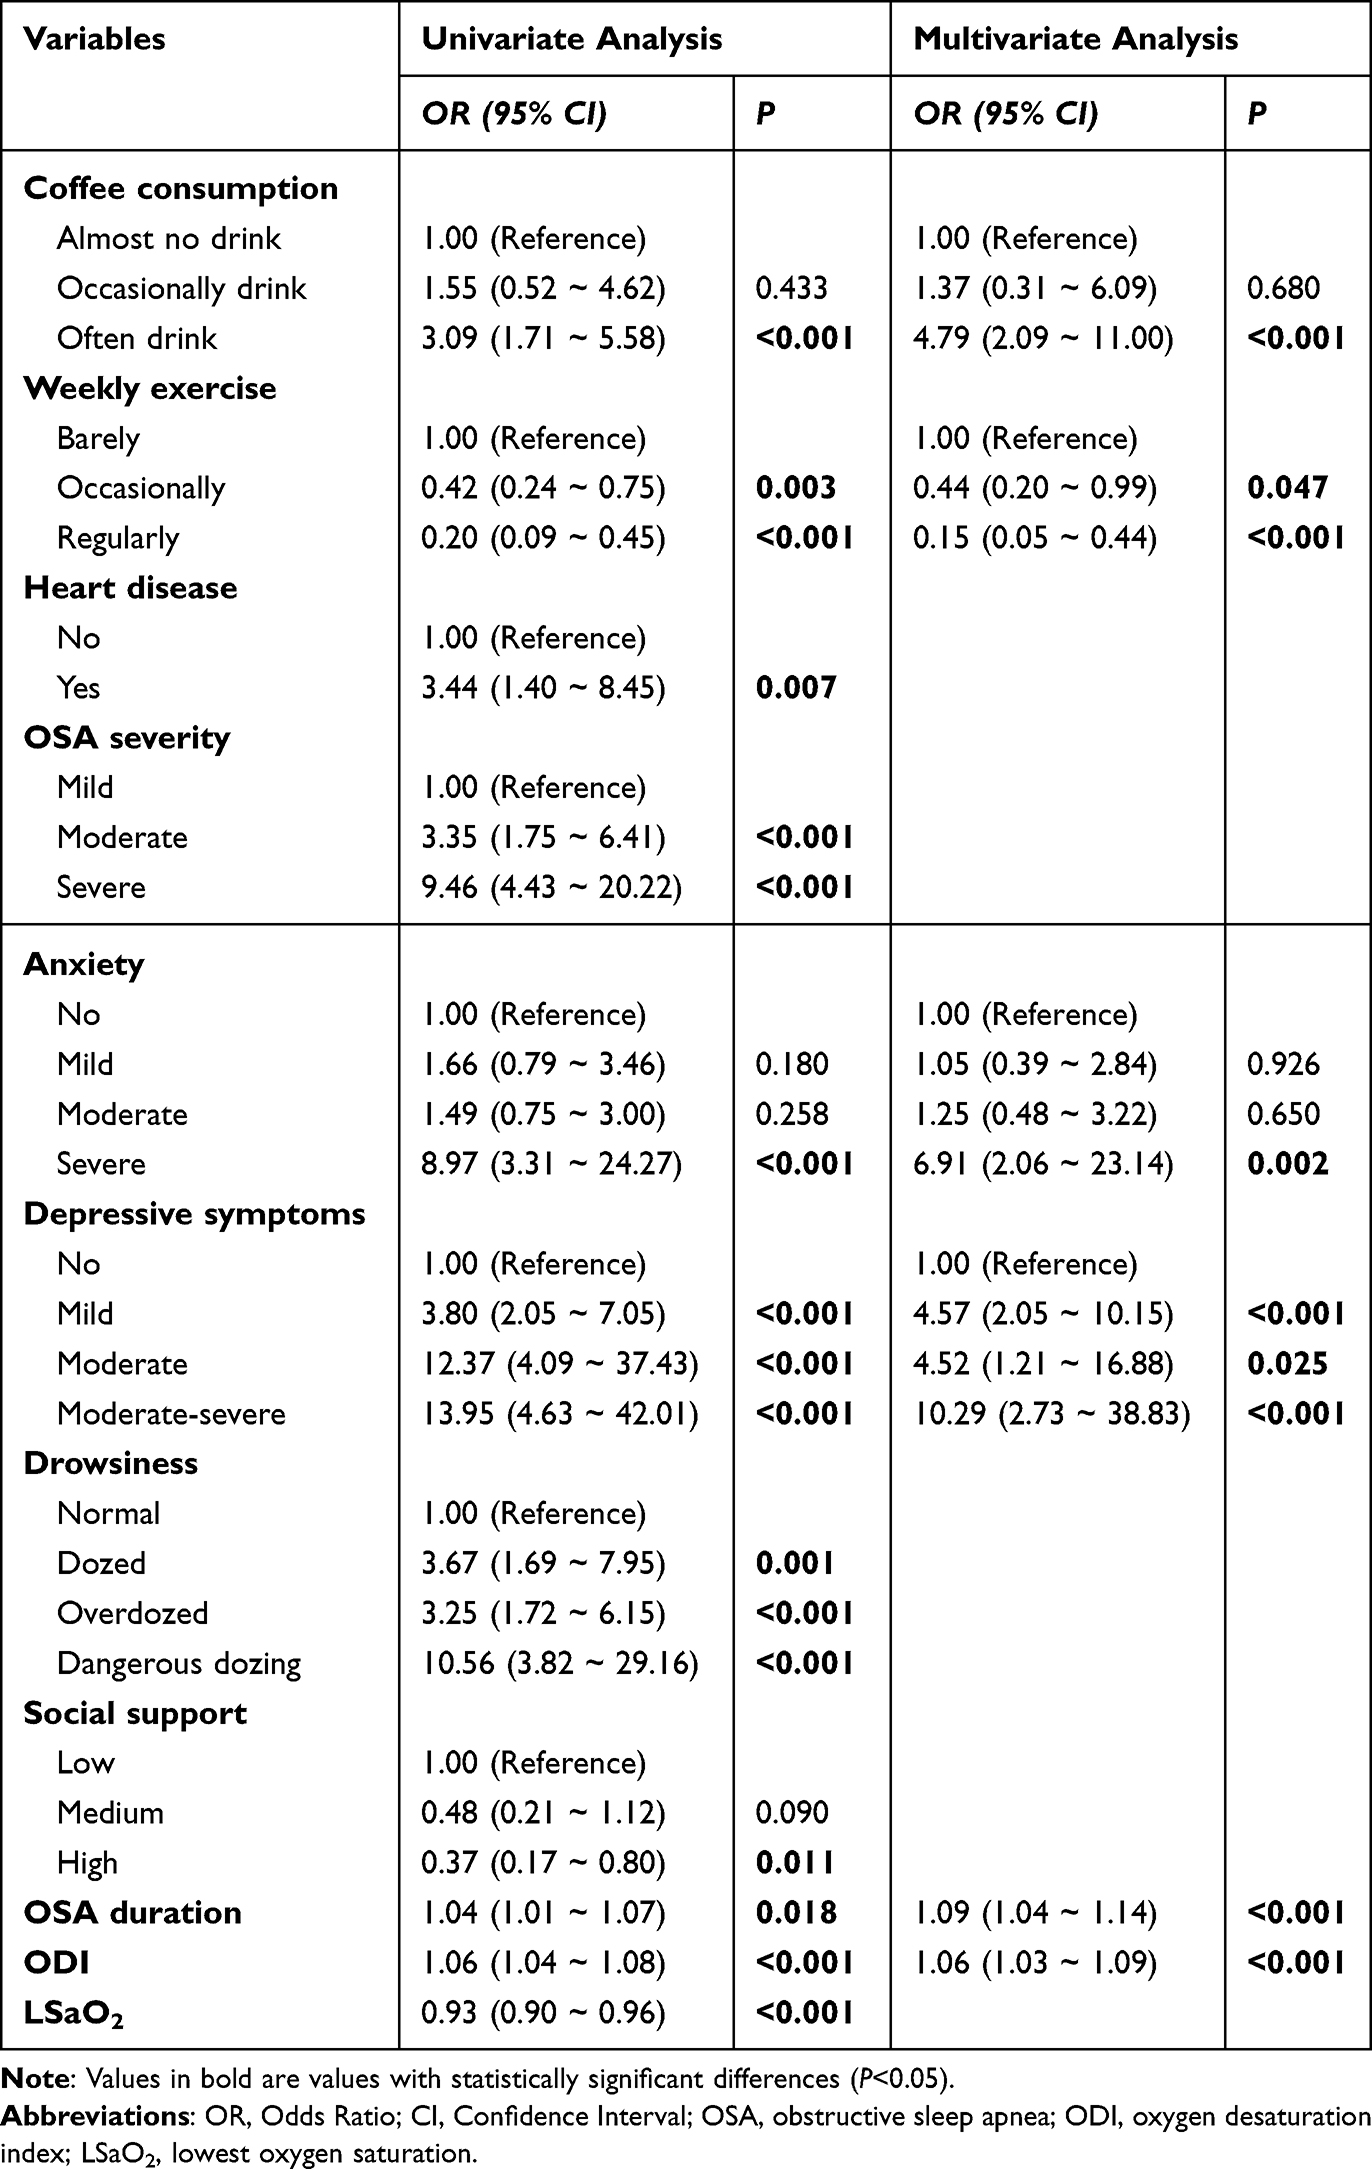 |
Table 3 Univariate and Multivariate Regression Analysis of the Variables After LASSO Screening |
 |
Figure 1 Selection of clinical features through the Lasso regression model. (A) Comparison of the partial likelihood deviance (binomial deviance) curve with log(lambda). The dashed vertical lines represent the optimal predictors using the minimum criteria (min. criteria) and one standard error of the minimum criteria (1se criteria). (B) Lasso coefficients for a total of 11 clinical features. The dynamic process chart of Lasso variable selection. |
Model Construction and Performance Evaluation
Through a 5-fold cross-validation grid search process, this study obtained the optimal hyperparameters for eight machine learning algorithms (except LR) and constructed a risk prediction model based on these optimal hyperparameters. In order to evaluate the comprehensive discrimination performance of the model on the training set and the validation set, the AUC value was used as the main indicator. The higher the AUC value, the stronger the classification ability of the model. In addition, this study also referred to indicators such as Accuracy, Precision, Recall and F1 score to comprehensively evaluate the performance of each model. Specifically, the AUC of the validation set was 0.910, Precision was 0.694, Recall was 0.714, and F1 score was 0.704, which was lower than the performance on the training set. However, the AUC value was still high, indicating the model’s strong classification ability on the validation set. This phenomenon may be due to overfitting on the training set, but overall, LightGBM’s performance was still outstanding. The AUC of the SVM model on the training set was 0.981, Accuracy was 0.968, Precision was 0.918, Recall was 0.975, and F1 score was 0.945, indicating that the model can well identify the categories in the training set and distinguish the differences between different categories. However, the metrics on the validation set have dropped significantly compared to the training set, with an AUC of 0.880, an accuracy of 0.810, Precision of 0.620, a recall of 0.886. The performance metrics of all models were shown in Table 4. The ROC curves were compared in Figure 2. LightGBM had the best overall discrimination performance among all models, especially in terms of AUC and other evaluation metrics. Although it achieved perfect fitting on the training set, it maintained a high AUC value (0.910) on the validation set, showing strong classification ability. However, the risk of overfitting still needs attention. The calibration curve evaluated the model’s fitting degree and prediction accuracy. The calibration curve showed the relationship between the actual probability of occurrence and the predicted probability and is usually presented as a scatter plot. When the calibration curve was closer to the ideal fitted straight line, the match between the expected probability and the actual probability was higher, which meant that the model’s prediction accuracy was stronger. The results showed that the calibration curves of the LightGBM, LR, MLP and XGBoost models were close to the ideal prediction curves, and their performance was better than that of other models (see Figure 3 for a comparison of the calibration curves of each model). In addition, DCA was used in this study to compare the clinical utility of each model. The results showed that the LightGBM, SVM, RF and XGBoost models all yielded higher clinical benefits across the entire threshold range, significantly outperforming the other models (see Figure 4 for a comparison of the DCA curves). After considering all performance indicators, the prediction model based on the LightGBM algorithm performed best.
 |
Table 4 Confusion Matrix Results of Eight Machine Learning Models |
 |
Figure 2 Comparison of the ROC curves for machine learning models. Abbreviations: DT, decision tree; KNN, K-Nearest Neighbor; LightGBM, Light Gradient Boosting Machine; LR, logistic regression; MLP, Multilayer Perceptron; RF, random forest; SVM, support vector machine; XGBoost, eXtreme Gradient Boosting. |
 |
Figure 3 Comparison of the calibration curves of the machine learning model. X-axis: Predicted Probability, Y-axis: Observed Probability. The black solid line represents the ideal calibration line, indicating perfect prediction. The red dots represent the actual frequency of occurrence within specific prediction intervals for the model. Abbreviations: DT, decision tree; KNN, K-Nearest Neighbor; LightGBM, Light Gradient Boosting Machine; LR, logistic regression; MLP, Multilayer Perceptron; RF, random forest; SVM, support vector machine; XGBoost, eXtreme Gradient Boosting. |
 |
Figure 4 Machine learning model decision curve analysis (DCA) comparison. X-axis: Represents the decision threshold, reflecting the minimum risk probability that the clinical decision-maker is willing to accept. Y-axis: Measures the net benefit of the model at different thresholds, indicating the effectiveness of decision-making results based on model predictions compared to strategies of no intervention or full intervention. Treat All: Assumes all patients receive intervention, representing an extreme strategy of full intervention, where the net benefit reflects the intervention outcome regardless of predictions. Treat None: Assumes no patients receive intervention, representing an extreme strategy of no intervention. Its net benefit reflects the decision-making outcome in the absence of predictive information. Abbreviations: DT, decision tree; KNN, K-Nearest Neighbor; LightGBM, Light Gradient Boosting Machine; LR, logistic regression; MLP, Multilayer Perceptron; RF, random forest; SVM, support vector machine; XGBoost, eXtreme Gradient Boosting. |
Model Interpretability
To further explain the results of the LightGBM model, this study used a visualization analysis of the SHAP value’s honeycomb diagram. As shown in Figure 5, each point in the figure represented a patient, and the X-axis reflected the specific impact of a given feature on the model output (predicted value). At the same time, the Y-axis indicated the importance or significance of that feature in the model decision. The higher a feature was on the Y-axis, the greater its contribution to the model’s prediction accuracy, significantly impacting its final output. By assigning a specific contribution value to each feature, SHAP values helped explain the model’s decision-making process more clearly, thereby gaining a deeper understanding of how various predictors affected the model’s prediction for each patient. The analysis results showed that depressive symptoms, OSA duration, ODI, anxiety, weekly exercise, and coffee consumption were important predictors of sleep quality in OSA patients, with depressive symptoms, OSA duration, and ODI being the three most critical features. Finally, the study used SHAP plots to show the features of a single sample and its probability of poor sleep quality. As shown in Figure 6, this patient had moderate anxiety symptoms, occasionally drinks coffee, had a 50-year OSA course, had depressive symptoms, and hardly exercises. According to the model prediction, the patient’s probability of poor sleep quality was 73%.
 |
Figure 5 Hive plot of the SHAP values of the model constructed by the LightGBM algorithm. OSA: obstructive sleep apnea, ODI: oxygen desaturation index. The vertical axis represents the importance of features, with features arranged from highest to lowest importance, indicating that features located higher up have a greater impact on the model’s predictions. The horizontal axis denotes the SHAP values for each feature, where positive values indicate that the feature increases the prediction result, and negative values decrease the prediction result. The color of the points signifies the actual observed values of the features, with blue indicating higher observed values for the feature and red indicating lower observed values. Through the color coding, we can visually see the impact of high or low values on the model’s predictions. |
 |
Figure 6 The SHAP plot of the model constructed by the LightGBM algorithm. The length of the arrow or bar indicates the extent to which the feature affects the predicted outcome. The longer arrows indicate that the feature has more influence on the model prediction. The direction of the arrow indicates whether the effect of the feature on the predicted outcome is positive or negative. Blue represents lower eigenvalues and red represents higher feature values. Blue represents lower feature values, while red represents higher feature values. These colors indicate the value of each feature for individual samples and their corresponding contributions to the model’s predictions. |
Discussion
This study constructed a risk prediction model for sleep quality in OSA patients by comparing seven machine learning algorithms with the LightGBM model performing best. The AUC value on the validation set reached 0.910, demonstrating strong classification ability and good generalization performance. Through SHAP analysis, this study screened out six key predictors, including depressive symptoms, OSA duration, ODI, anxiety, weekly exercise, and coffee consumption, among which depressive symptoms, OSA duration, and ODI had the most significant impact on the prediction model. In addition, the interpretability analysis of the LightGBM model further revealed the specific contributions of each predictor to the model decision, which provided an in-depth understanding of the main factors affecting the poor sleep quality of OSA patients. These results verified the model’s predictive ability and provided a clear direction for clinical intervention.
The negative impact of depressive symptoms on sleep quality has been widely studied and confirmed. Depressive symptoms may decrease overall sleep quality by affecting sleep structure and prolonging the time to fall asleep.23 For OSA patients, this impact may be more significant, as depression may further exacerbate the frequency of nighttime awakenings and sleep fragmentation.24 This study quantified the impact of depressive symptoms on sleep quality in OSA patients using SHAP analysis and found that it is one of the most important predictors. This not only verifies the negative correlation between depression and sleep quality but also highlights the importance of mental health in the management of OSA. Early identification and intervention of depressive symptoms may be an important means of improving the sleep quality of patients with OSA.
OSA duration is also a key factor affecting sleep quality. Chronic OSA may lead to chronic hypoxia, persistent activation of the sympathetic nervous system, and long-term disruption of sleep structure, which significantly reduces sleep quality.25 As the OSA disease progresses, the patient’s sleep quality significantly decreases. This result suggests that early diagnosis and intervention of OSA is crucial, and timely treatment may help avoid the cumulative damage to sleep quality caused by prolonged disease progression.26
As an important indicator of nocturnal hypoxia, ODI is significantly correlated with the number of sleep-wake cycles and the proportion of deep sleep.27,28 This study found that ODI significantly impacts the sleep quality of OSA patients. Repeated nocturnal desaturations lead to excessive sympathetic nervous system activation, increased cardiovascular stress, and increased arousal frequency, disrupting sleep continuity and depth. The strong impact of ODI further confirms that nocturnal hypoxia is one of the core mechanisms of poor sleep quality in OSA patients.
Anxiety symptoms may interfere with sleep stability and depth by increasing sympathetic nervous system activity, leading to a faster heart rate and muscle tension.29,30 The more severe the anxiety symptoms, the worse the sleep quality in OSA patients. In particular, the sleep quality of patients with severe anxiety is significantly reduced, which further supports the central role of anxiety in sleep disorders. Anxiety management for OSA patients not only helps improve their psychological state but may also have a positive impact on sleep quality.
Exercise as a non-pharmacological intervention has been widely demonstrated to improve sleep quality significantly.31 The results showed that OSA patients who exercised regularly had significantly better sleep quality than those who exercised rarely. This may be related to exercise improving metabolic function, regulating sympathetic nervous system activity, and promoting the optimization of sleep structure.32,33 The research results highlight the potential of lifestyle interventions in managing sleep quality in OSA patients. In the future, sleep health can be promoted by increasing health education on regular exercise.
In addition, the potential impact of coffee consumption on sleep quality was also verified in this study. Frequent caffeine intake may significantly reduce the sleep quality of OSA patients by delaying the time to fall asleep, reducing the time of deep sleep, and increasing the frequency of nighttime awakenings.34 The results of this study showed that patients who drink coffee frequently have poorer sleep quality than those who drink coffee rarely. Although there are individual differences in the effects of caffeine, reducing caffeine intake may be a practical adjustment strategy to improve the sleep quality of OSA patients.35
The LightGBM model showed the best predictive performance in this study, with an AUC of 0.910 on the validation set, demonstrating strong classification and generalization capabilities. Compared with other algorithms such as SVM and RF, LightGBM demonstrated superior calibration and higher clinical net benefit in DCA analysis. Its gradient-boosted tree structure enables effective handling of high-dimensional data and captures complex, nonlinear interactions between multiple clinical and psychosocial features.36 Additionally, its built-in regularization mechanisms help reduce overfitting, making it a robust and efficient choice for predicting sleep quality in OSA patients.37
In addition, LightGBM has an effective built-in regularization mechanism that can improve model fitting ability while effectively reducing the risk of overfitting. In this study, although LightGBM showed perfect fitting on the training set (AUC=1.0), the AUC on the validation set (0.910) remained high, indicating that the model still has strong generalization ability on real data. Some traditional machine learning models (such as random forest RF and support vector machine SVM) also performed well on the training set. However, their performance on the validation set declined, indicating that these models may be more susceptible to the problem of overfitting.
The strength of SHAP analysis is providing consistent, additive feature properties based on game theory, allowing a global and individual-level interpretation of the model’s predictions. In this study, SHAP analysis not only identified six key predictors of sleep quality in OSA patients but also visualized their specific effects on individual outcomes. This transparency enhances the trust in the model in the clinic and provides a solid scientific foundation for healthcare professionals to develop personalized intervention strategies.38
The LightGBM-based prediction model constructed in this study and its explanatory analysis is significant in the clinical management of OSA patients. First, the model can help healthcare professionals more accurately identify high-risk OSA patients and develop personalized intervention plans through the mechanism of action of key predictors (such as depression, anxiety, exercise, coffee consumption, etc), thereby achieving early screening and precision management.39 Second, the LightGBM model and its visualization results obtained by combining SHAP analysis provide an efficient and transparent decision-support tool for clinical practice, which can provide healthcare professionals with a scientific basis for optimizing the clinical decision-making process in complex cases. In addition, the research results further emphasize the importance of mental health management and lifestyle adjustments, especially interventions for depression and anxiety symptoms, as well as lifestyle guidance that encourages regular exercise and reduces caffeine intake, which provides a scientific basis for patient education. These research results provide a new perspective for improving the sleep quality of OSA patients and lay the foundation for optimizing clinical practice and improving patients’ quality of life.
Despite the important findings of this study, there are still some limitations that need further improvement in future research. First, the research was conducted in a single center and employed a cross-sectional design, which may limit the generalizability of the findings and restrict the ability to draw causal inferences. Future studies should involve multicenter cohorts and adopt longitudinal designs to explore causal relationships and dynamic changes over time. Second, although key predictors were selected through Lasso regression and logistic analysis, some potentially important variables—such as genetic, environmental, or behavioral factors—were not included. Expanding the feature set may enhance the model’s predictive accuracy and clinical relevance. Third, patients receiving CPAP or other treatments were excluded to observe the natural progression of OSA, which may limit the applicability of the model to treated populations. Including patients undergoing standard therapies and comparing outcomes across subgroups will help improve the model’s applicability in diverse clinical scenarios. Fourth, the LightGBM model exhibited perfect performance on the training set, indicating a risk of overfitting. Although 5-fold cross-validation and regularization techniques were applied, further efforts—such as nested cross-validation, early stopping, ensembling, or external validation with larger datasets—are necessary to ensure robustness and generalizability. Finally, while the model provides interpretable and clinically relevant predictions, its actual utility in improving patient outcomes has not yet been prospectively evaluated. Future work could explore integrating LightGBM with deep learning methods, such as neural networks or attention-based models, to capture more complex patterns and improve real-world performance.
Conclusion
The LightGBM-based risk prediction model for sleep quality in OSA patients constructed in this study showed excellent predictive ability. Six key predictors, including depressive symptoms, OSA duration, oxygen desaturation index (ODI), anxiety, exercise, and coffee consumption, were identified through SHAP analysis, and their contributions to model predictions were quantified. The study’s results provide a reliable tool for accurately predicting sleep quality in OSA patients and a scientific basis for developing related interventions.
Abbreviations
OSA, Obstructive Sleep Apnea; OSAHS, Obstructive Sleep Apnea Hypopnea Syndrome; CVD, body mass index (BMI) cerebrovascular disease; AHI, apnea-hypopnea index; ODI, oxygen desaturation index; MSaO2, mean oxygen saturation; LSaO2, lowest oxygen saturation; PSQI, The Pittsburgh Sleep Quality Index; PHQ-9, The Patient Health Questionnaire-9; GAD-7, The Generalized Anxiety Disorder 7-item scale; DSM-IV, the Diagnostic and Statistical Manual of Mental Disorders; 4th Edition; ESS, The Epworth Sleepiness Scale; SSRS, The Social Support Rating Scale; CPSS, The Chinese Perceived Stress Scales; PSS, the Perceived Stress Scale; SD, standard deviation; Q₁, Q₃, the median (M) and interquartile range; DT, decision tree; KNN, k-nearest neighbour; LR, logistic regression; RF, random forest; SVM, Support Vector Machine; XGBoost, Extreme Gradient Boosting; MLP, Multi-layer perceptron; LightGBM, light Gradient Boosting Machine; ROC, the receiver operating characteristic; AUC, the area under the receiver operating characteristic curve; DCA, decision curve analysis; SHAP, the SHapley Additive exPlanation.
Data Sharing Statement
Datasets cannot be publicly shared due to patient privacy data limitations. Based on the establishment of a secure data sharing protocol and a joint learning framework, it can be provided upon request with the consent of the corresponding author.
Ethics Approval and Informed Consent
All procedures were carried out in accordance with the 1964 helsinki Declaration. The research proposal was approved by the Ethics Committee of the Affiliated Hospital of Changchun University of Traditional Chinese Medicine (CCZYFYLL-SQ-2022-099). Prior to the commencement of the study, all participants were provided with detailed information regarding the study’s purpose, procedures, potential risks, and benefits. Written informed consent was obtained from each participant, ensuring that they voluntarily agreed to participate and understood their rights, including the right to withdraw at any time without consequence.
Acknowledgments
We want to thank all the patients who participated in this study for their cooperation and contributions. We would also like to thank the medical staff at the Sleep Monitoring Center of the Department of Pulmonary Oncology at the Affiliated Hospital of Changchun University of Traditional Chinese Medicine and the Sleep Monitoring Center of Shenzhen University Luohu Hospital for their support in patient selection and data collection. This work is supported by Extreme Smart Analysis platform (https://www.xsmartanalysis.com/).
Author Contributions
YT: Conceptualization, Methodology, Formal analysis, Data Curation, Writing - Original Draft and Writing - Review & Editing. KW: Conceptualization, Methodology, Formal analysis, Data Curation, Writing - Original Draft and Writing - Review & Editing. EL: Conceptualization, Methodology, Formal analysis, Data Curation, Writing - Original Draft and Writing - Review & Editing. FA: Conceptualization, Methodology, Formal analysis, Data Curation, Writing - Original Draft and Writing - Review & Editing. PT: Formal analysis, Data Curation, Conceptualization, Methodology, Formal analysis, Writing - Original Draft and Writing - Review & Editing. HW: Conceptualization, Formal analysis, Supervision, Writing - Original Draft and Writing -Review & Editing. BG: Conceptualization, Formal analysis, Supervision, Writing - Original Draft and Writing -Review & Editing. All authors agreed to submit the manuscript to Nature and Science of Sleep, reviewed and agreed on all versions of the article before submission, during revision, the final version accepted for publication, and any significant changes introduced at the proofing stage, agreed to take responsibility and be accountable for the contents of the article.
Funding
This study did not receive any external funding.
Disclosure
The authors declare that there is no conflict of interests.
References
1. Lv R, Liu X, Zhang Y, et al. Pathophysiological mechanisms and therapeutic approaches in obstructive sleep apnea syndrome. Signal Transduct Target Ther. 2023;8(1):218. doi:10.1038/s41392-023-01496-3
2. Franklin KA, Sahlin C, Stenlund H, Lindberg E. Sleep apnoea is a common occurrence in females. Eur Respir J. 2013;41(3):610–615. doi:10.1183/09031936.00212711
3. Benjafield AV, Ayas NT, Eastwood PR, et al. Estimation of the global prevalence and burden of obstructive sleep apnoea: a literature-based analysis. Lancet Respir Med. 2019;7(8):687–698. doi:10.1016/s2213-2600(19)30198-5
4. Lévy P, Kohler M, McNicholas WT, et al. Obstructive sleep apnoea syndrome. Nat Rev Dis Primers. 2015;1:15015. doi:10.1038/nrdp.2015.15
5. Irwin MR. Sleep and inflammation: partners in sickness and in health. Nat Rev Immunol. 2019;19(11):702–715. doi:10.1038/s41577-019-0190-z
6. Walker MP. The role of sleep in cognition and emotion. Ann N Y Acad Sci. 2009;1156:168–197. doi:10.1111/j.1749-6632.2009.04416.x
7. Walker MP. Cognitive consequences of sleep and sleep loss. Sleep Med. 2008;9 Suppl 1:S29–34. doi:10.1016/s1389-9457(08)70014-5
8. Besedovsky L, Lange T, Haack M. The sleep-immune crosstalk in health and disease. Physiol Rev. 2019;99(3):1325–1380. doi:10.1152/physrev.00010.2018
9. Sateia MJ. International classification of sleep disorders-third edition: highlights and modifications. Chest. 2014;146(5):1387–1394. doi:10.1378/chest.14-0970
10. Szentkirályi A, Madarász CZ, Novák M. Sleep disorders: impact on daytime functioning and quality of life. Expert Rev Pharmacoecon Outcomes Res. 2009;9(1):49–64. doi:10.1586/14737167.9.1.49
11. Tregear S, Reston J, Schoelles K, Phillips B. Continuous positive airway pressure reduces risk of motor vehicle crash among drivers with obstructive sleep apnea: systematic review and meta-analysis. Sleep. 2010;33(10):1373–1380. doi:10.1093/sleep/33.10.1373
12. Kattan MW. Nomograms are superior to staging and risk grouping systems for identifying high-risk patients: preoperative application in prostate cancer. Curr Opin Urol. 2003;13(2):111–116. doi:10.1097/00042307-200303000-00005
13. Buysse DJ, Reynolds CF 3rd, Monk TH, Berman SR, Kupfer DJ. The Pittsburgh sleep quality index: a new instrument for psychiatric practice and research. Psychiatry Res. 1989;28(2):193–213. doi:10.1016/0165-1781(89)90047-4
14. Spitzer RL, Kroenke K, Williams JB. Validation and utility of a self-report version of PRIME-MD: the PHQ primary care study. primary care evaluation of mental disorders. PATIENT Health Questionnaire. Jama. 1999;282(18):1737–1744. doi:10.1001/jama.282.18.1737
15. Kroenke K, Spitzer RL, Williams JB, Löwe B. The patient health questionnaire somatic, anxiety, and depressive symptom scales: a systematic review. Gen Hosp Psychiatry. 2010;32(4):345–359. doi:10.1016/j.genhosppsych.2010.03.006
16. Spitzer RL, Kroenke K, Williams JB, Löwe B. A brief measure for assessing generalized anxiety disorder: the GAD-7. Arch Intern Med. 2006;166(10):1092–1097. doi:10.1001/archinte.166.10.1092
17. Kertz S, Bigda-Peyton J, Bjorgvinsson T. Validity of the generalized anxiety disorder-7 scale in an acute psychiatric sample. Clin Psychol Psychother. Sep-Oct. 2013;20(5):456–464. doi:10.1002/cpp.1802
18. Johns MW. A new method for measuring daytime sleepiness: the Epworth sleepiness scale. Sleep. 1991;14(6):540–545. doi:10.1093/sleep/14.6.540
19. Wang YX, Cai C, Zhu YX, et al. Family burden and psychological distress among Chinese caregivers of elderly people with dementia: a moderated mediation model. BMC Nurs. 2024;23(1):723. doi:10.1186/s12912-024-02382-1
20. Wang X, Jiang N, Chen S, et al. Fear of progression in patients with acute myocardial infarction: a cross-sectional study. BMC Nurs. 2024;23(1):866. doi:10.1186/s12912-024-02552-1
21. Levenstein S, Prantera C, Varvo V, et al. Development of the perceived stress questionnaire: a new tool for psychosomatic research. J Psychosom Res. 1993;37(1):19–32. doi:10.1016/0022-3999(93)90120-5
22. Yang TZ, Huang HT. An epidemiological study on stress among urban residents in social transition period. Zhonghua Liu Xing Bing Xue Za Zhi. 2003;24(9):760–764.
23. Joo HJ, Kwon KA, Shin J, Park S, Jang SI. Association between sleep quality and depressive symptoms. J Affect Disord. 2022;310:258–265. doi:10.1016/j.jad.2022.05.004
24. Alomri RM, Kennedy GA, Wali SO, Ahejaili F, Robinson SR. Differential associations of hypoxia, sleep fragmentation, and depressive symptoms with cognitive dysfunction in obstructive sleep apnea. Sleep. 2021;44(4). doi:10.1093/sleep/zsaa213
25. Al Lawati NM, Patel SR, Ayas NT. Epidemiology, risk factors, and consequences of obstructive sleep apnea and short sleep duration. Prog Cardiovasc Dis. 2009;51(4):285–293. doi:10.1016/j.pcad.2008.08.001
26. Evans EC, Sulyman O, Froymovich O. The goals of treating obstructive sleep apnea. Otolaryngol Clin North Am. 2020;53(3):319–328. doi:10.1016/j.otc.2020.02.009
27. Chaudhary A, Abbott CJ, Wu Z, et al. Nocturnal hypoxia and age-related macular degeneration. Clin Exp Ophthalmol. 2024;52(9):973–980. doi:10.1111/ceo.14428
28. Kainulainen S, Duce B, Korkalainen H, et al. Severe desaturations increase psychomotor vigilance task-based median reaction time and number of lapses in obstructive sleep apnoea patients. Eur Respir J. 2020;55(4):1901849. doi:10.1183/13993003.01849-2019
29. Chellappa SL, Aeschbach D. Sleep and anxiety: from mechanisms to interventions. Sleep Med Rev. 2022;61:101583. doi:10.1016/j.smrv.2021.101583
30. Faccini J, Joshi V, Graziani P, Del-Monte J. Beliefs about sleep: links with ruminations, nightmare, and anxiety. BMC Psychiatry. 2023;23(1):198. doi:10.1186/s12888-023-04672-5
31. Hasan F, Tu YK, Lin CM, et al. Comparative efficacy of exercise regimens on sleep quality in older adults: a systematic review and network meta-analysis. Sleep Med Rev. 2022;65:101673. doi:10.1016/j.smrv.2022.101673
32. Cao Y, Yang Z, Yu Y, Huang X. Physical activity, sleep quality and life satisfaction in adolescents: a cross-sectional survey study. Front Public Health. 2022;10:1010194. doi:10.3389/fpubh.2022.1010194
33. Johnston SA, Roskowski C, He Z, Kong L, Chen W. Effects of team sports on anxiety, depression, perceived stress, and sleep quality in college students. J Am Coll Health. 2021;69(7):791–797. doi:10.1080/07448481.2019.1707836
34. Watson EJ, Coates AM, Kohler M, Banks S. Caffeine consumption and sleep quality in Australian adults. Nutrients. 2016;8(8):479. doi:10.3390/nu8080479
35. Riera-Sampol A, Rodas L, Martínez S, Moir HJ, Tauler P. Caffeine Intake among undergraduate students: sex differences, sources, motivations, and associations with smoking status and self-reported sleep quality. Nutrients. 2022;14(8):1661. doi:10.3390/nu14081661
36. Ren JX, Chen L, Guo W, Feng KY, Cai YD, Huang T. Patterns of gene expression profiles associated with colorectal cancer in colorectal mucosa by using machine learning methods. Comb Chem High Throughput Screen. 2024;27(19):2921–2934. doi:10.2174/0113862073266300231026103844
37. Zhang J, Mucs D, Norinder U, Svensson F. LightGBM: an effective and scalable algorithm for prediction of chemical toxicity-application to the Tox21 and mutagenicity data sets. J Chem Inf Model. 2019;59(10):4150–4158. doi:10.1021/acs.jcim.9b00633
38. Zuo D, Yang L, Jin Y, Qi H, Liu Y, Ren L. Machine learning-based models for the prediction of breast cancer recurrence risk. BMC Med Inform Decis Mak. 2023;23(1):276. doi:10.1186/s12911-023-02377-z
39. Li M, Han S, Liang F, et al. Machine learning for predicting risk and prognosis of acute kidney disease in critically ill elderly patients during hospitalization: internet-based and interpretable model study. J Med Internet Res. 2024;26:e51354. doi:10.2196/51354.
 © 2025 The Author(s). This work is published and licensed by Dove Medical Press Limited. The
full terms of this license are available at https://www.dovepress.com/terms.php
and incorporate the Creative Commons Attribution
- Non Commercial (unported, 4.0) License.
By accessing the work you hereby accept the Terms. Non-commercial uses of the work are permitted
without any further permission from Dove Medical Press Limited, provided the work is properly
attributed. For permission for commercial use of this work, please see paragraphs 4.2 and 5 of our Terms.
© 2025 The Author(s). This work is published and licensed by Dove Medical Press Limited. The
full terms of this license are available at https://www.dovepress.com/terms.php
and incorporate the Creative Commons Attribution
- Non Commercial (unported, 4.0) License.
By accessing the work you hereby accept the Terms. Non-commercial uses of the work are permitted
without any further permission from Dove Medical Press Limited, provided the work is properly
attributed. For permission for commercial use of this work, please see paragraphs 4.2 and 5 of our Terms.
Recommended articles
An Explainable Machine Learning Model to Predict Acute Kidney Injury After Cardiac Surgery: A Retrospective Cohort Study
Gao Y, Wang C, Dong W, Li B, Wang J, Li J, Tian Y, Liu J, Wang Y
Clinical Epidemiology 2023, 15:1145-1157
Published Date: 4 December 2023
Analysis of Health-Related Quality of Life in Elderly Patients with Stroke Complicated by Hypertension in China Using the EQ-5D-3L Scale
Wang S, Shen C, Yang S
Journal of Multidisciplinary Healthcare 2024, 17:1981-1997
Published Date: 30 April 2024
Integrating Machine Learning and the SHapley Additive exPlanations (SHAP) Framework to Predict Lymph Node Metastasis in Gastric Cancer Patients Based on Inflammation Indices and Peripheral Lymphocyte Subpopulations
Zhu Z, Wang C, Shi L, Li M, Li J, Liang S, Yin Z, Xue Y
Journal of Inflammation Research 2024, 17:9551-9566
Published Date: 23 November 2024
Risk Factors for Gout in Taiwan Biobank: A Machine Learning Approach
Liu YR, Nfor ON, Zhong JH, Lin CY, Liaw YP
Journal of Inflammation Research 2024, 17:9847-9856
Published Date: 26 November 2024
Explainable Prediction of Long-Term Glycated Hemoglobin Response Change in Finnish Patients with Type 2 Diabetes Following Drug Initiation Using Evidence-Based Machine Learning Approaches
Chandra G, Lavikainen P, Siirtola P, Tamminen S, Ihalapathirana A, Laatikainen T, Martikainen J, Röning J
Clinical Epidemiology 2025, 17:225-240
Published Date: 8 March 2025