")
Back to Journals » Nature and Science of Sleep » Volume 16
Craniofacial Development Characteristics in Children with Obstructive Sleep Apnea for Establishment and External Validation of the Prediction Model
Authors Su Y, Wang Z, Chang H, Zhu S , Zhou Y, Cao Z, Ma L, Yuan Y, Xie Y, Niu X, Lu C, Zhang Y , Liu H, Shao N, Yin L, Si C, Ren X, Shi Y
Received 13 September 2024
Accepted for publication 3 December 2024
Published 21 December 2024 Volume 2024:16 Pages 2151—2170
DOI https://doi.org/10.2147/NSS.S492714
Checked for plagiarism Yes
Review by Single anonymous peer review
Peer reviewer comments 2
Editor who approved publication: Prof. Dr. Ahmed BaHammam
Yonglong Su,1,* Zitong Wang,1,* Huanhuan Chang,2,* Simin Zhu,1 Yanuo Zhou,1 Zine Cao,1 Lina Ma,1 Yuqi Yuan,1 Yushan Xie,1 Xiaoxin Niu,1 Chendi Lu,1 Yitong Zhang,1 Haiqin Liu,1 Na Shao,1 Libo Yin,3 Chao Si,2 Xiaoyong Ren,1 Yewen Shi1
1Department of Otorhinolaryngology Head and Neck Surgery, the Second Affiliated Hospital of Xi’an Jiaotong University, Xi’an, People’s Republic of China; 2Department of Otorhinolaryngology Head and Neck Surgery, Xi’an Children’s Hospital, Xi’an, People’s Republic of China; 3Department of Otorhinolaryngology Head and Neck Surgery, Xi’an Central Hospital, Xi’an, People’s Republic of China
*These authors contributed equally to this work
Correspondence: Xiaoyong Ren; Yewen Shi, Department of Otorhinolaryngology Head and Neck Surgery, the Second Affiliated Hospital of Xi’an Jiaotong University, 157 Xi Wu Road, Xi’an, Shaan’xi Province, 710004, People’s Republic of China, Email [email protected]; [email protected]
Purpose: Aimed to analyze the developmental characteristics of craniofacial structures and soft tissues in children with obstructive sleep apnea (OSA) and to establish and evaluate prediction model.
Methods: It’s a retrospective study comprising 747 children aged 2– 12 years (337 patients and 410 controls) visited the Department of Otolaryngology-Head and Neck Surgery, the Second Affiliated Hospital of Xi’an Jiaotong University (July 2017 to March 2024). Lateral head radiographs were obtained to compare the cephalometric measurements. The clinical prediction model was constructed using LASSO regression analysis. We analyzed 300 children from the Xi’an Children’s Hospital for external validation.
Results: Children with OSA had a higher body mass, a higher tonsil grade, larger AN ratio (ratio of the adenoids to the skeletal upper airway width), larger radius of the tonsils, a smaller angle between the skull base and maxilla (SNA) and smaller angle between the skull base and mandible (SNB), a larger distance from the hyoid to the mandibular plane (H-MP) and smaller distance between the third cervical vertebra and hyoid (H-C), a larger thickness of the soft palate (SPT) and smaller inclination angle of the soft palate than those of the controls (all p < 0.05). A prediction model was constructed for 2– 12 years group (AUC of 0.812 [95% CI: 0.781– 0.842]). Age-specific prediction models were developed for preschool children (AUC of 0.769 [95% CI: 0.725– 0.814]), for school-aged children (AUC of 0.854 [95% CI: 0.812– 0.895]).
Conclusion: Our study findings support the important role of craniofacial structures such as the hyoid, maxilla, mandible, and soft palate in pediatric OSA. Age-stratified predictive models for pediatric OSA indicated varying parameters across different age groups which underscore the necessity for stratifying by age in future research. The prediction model designed will greatly assist health care practitioners with rapidly identifying.
Keywords: pediatric, OSA, cephalometric measurements, prediction model
Background
Obstructive sleep apnea (OSA) is a key form of sleep-disordered breathing (SDB) in children.1,2 OSA involves extended periods of heightened upper airway resistance and respiratory effort, leading to partial or complete blockage of the upper airway during sleep. Children with OSA is more commonly associated with daytime neurobehavioral issues, learning difficulties and growth delays.3
Snoring is observed in 3–15% of children, with a higher prevalence of 13–35% in those aged 3 to 6 years. OSA affects 1–5% of children, peaking between ages 2 and 6 years, with the highest incidence at around 2.5 years for boys and 4 years for girls, showing no significant difference between sexes.2,4–6
The primary risk factor reported for pediatric OSA is adenotonsillar hypertrophy.5 Research shows a significant correlation between tonsillar volume and the severity of pediatric OSA.6,7 While isolated adenoid hypertrophy alone is not enough to diagnose OSA, it can exacerbate the condition in children who are already at risk. Studies suggest that the role of adenotonsillar hypertrophy can be evaluated by examining the success rate of adenotonsillectomy as a treatment for OSA.8,9
Obesity is another significant risk factor for pediatric OSA.10 A prospective study found that 4% of adolescents aged 16 to 19 years have OSA, many of whom did not exhibit signs of sleep-disordered breathing or snoring in childhood.5,11 Among adolescents, obesity and male sex are considered the most critical risk factors for developing OSA.5
Different from adults, the growth and development of children are dynamic. Thus, craniofacial anomalies represent another important risk for pediatric OSA, such as dentofacial anomalies and major craniofacial malformations. Abnormal dentofacial lesions are frequently seen in 15–47% of children with OSA, and there have been reports of improved sleep disorders following orthodontic treatment.10,12 Nonetheless, some studies suggest that dental issues resulting from mouth breathing may be more a consequence of OSA rather than a cause. Craniofacial defects (mandibular deficiency, enlargement of the tongue and soft palate and Improper position of the hyoid bone) associated with OSA may occur together and can influence the severity and characteristics of OSA.13,14 However, there are currently no large-scale research data on pediatric OSA based on craniofacial lateral development.
The diagnosis of pediatric OSA is based on an overnight polysomnography (PSG) test.4 However, the long testing time and expensive equipment prevent children from receiving timely diagnosis and treatment. Therefore, developing a simple and accurate new method for pediatric OSA diagnosis is crucial. In recent years, machine learning has emerged, showing advantages such as efficiency and conciseness. There are currently studies applying machine learning to the diagnosis of adult OSA and its comorbidities. Our team previously conducted research predicting adult OSA, and the model demonstrated good results.15 However, there is currently limited research on predictive models for pediatric OSA. Moreover, there have been no studies incorporating pediatric craniofacial structures into research in a relatively large population. Upper airway imaging could be helpful for investigating OSA. Therefore, we obtained lateral cephalometric measurements and analyzed these in combination with birth indicators, clinical symptoms, and physical signs to construct a prediction model and evaluate its predictive value.
Methods
We retrospectively collected data of pediatric patients who visited the Department of Otolaryngology-Head and Neck Surgery at the Second Affiliated Hospital of Xi’an Jiaotong University from July 2017 to March 2024. These patients had undergone sleep breathing monitoring and lateral head radiograph examinations, which were used to evaluate the degree of adenoid hypertrophy. Before the examination, informed consent forms were signed by the guardians of each participant. We collected data on children, including their growth and development status (sex, age, height, weight and body mass index [BMI]), birth information (whether born full-term, birth weight, mode of delivery, and feeding method), clinical symptoms (snoring during sleep, mouth breathing, and sleep apnea), clinical signs (degree of tonsillar hypertrophy), lateral head X-ray images, and sleep monitoring results. BMI was calculated using the formula weight/height² (kg/m²) and then converted to a z-score based on age and sex, according a local reference.16
After applying the strict inclusion and exclusion criteria, the final dataset comprised 747 children aged 2–12 years for analysis and model construction; this dataset was used as the training set. Additionally, we collected data on 300 children for external validation who presented with snoring or mouth breathing at Xi’an Children’s Hospital between October 2023 and January 2024. The inclusion criteria were as follows: (1) children aged 2–12 years, (2) children who had undergone overnight PSG examination, and (3) children who had undergone lateral head radiography.
Participants were excluded if they had prior upper airway surgery, were currently being treated for OSA, had a known history of syndromic craniofacial conditions (eg, Down syndrome), or had previous craniofacial surgery. The study flowchart is shown in Figure 1.
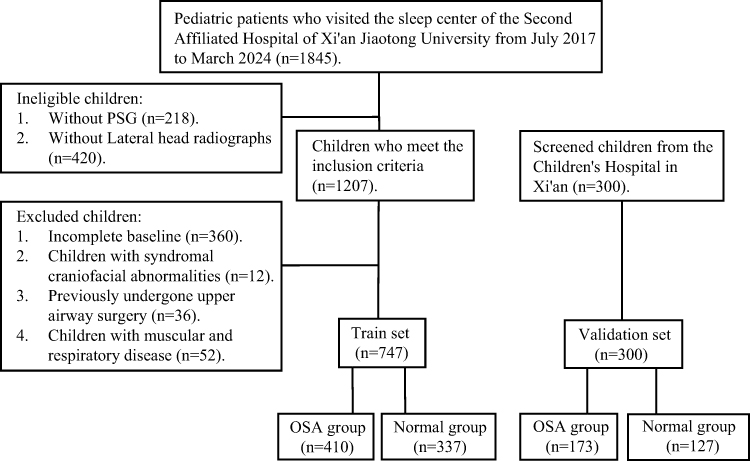 |
Figure 1 Study flowchart. |
PSG was performed in the overnight sleep laboratory of the Sleep Center of the Department of Otolaryngology-Head and Neck Surgery, the Second Affiliated Hospital of Xi’an Jiaotong University. Each record was evaluated by a certified clinical polysomnographer. The evaluation involved several parameters: electroencephalogram, electrooculogram, electromyogram, muscle activity, electrocardiogram, oxygen saturation, thoracic movements, and nasal and oral airflow recordings. The Obstructive Apnea Hypopnea Index (OAHI) was used to gauge sleep apnea severity, categorizing patients into two groups based on apnea and hypopnea frequency. An OAHI of ≥1 incident per hour was deemed abnormal in pediatric patients.8
The same Siemens Orthophos X-ray system was employed to capture lateral cephalometric images consistently, maintaining a fixed distance of 150 cm between the cathode and the head. The participant stood upright with their gaze parallel to the floor. All images were taken at the end of inhalation, with the participant instructed to avoid speaking or swallowing.
The cephalogram was administered and evaluated by two otolaryngologists, each with more than 10 years of experience. One investigator manually traced the cephalograms on 0.03-inch-thick acetate paper, while a second investigator reviewed the tracings. If discrepancies were found, the tracing process was repeated for a third time. The average of the two closest measurements was used. During the cephalometric measurement process, the investigators were blinded to the group assignment of the individual, meaning they do not know whether the participant is part of the case group or the control group. Similarly, the personnel responsible for data collection and subsequent analysis are also blinded to the group allocation of each participant, ensuring that both the measurement process and the data interpretation remain unbiased throughout the study.
The cephalometric analysis was based on 28 measurements: seven angular measurements (N.S-S.Ba: angle of skull base; Go.Me-Go.Ar: mandibular angle; Go.Me-N.Pog: relationship between facial height and mandibular; SNA: angle between the cranial base and the maxilla; SNB: angle between the cranial base and the mandible; ANB: difference between SNA and SNB; and ASP: angle of the soft palate); 18 linear measurements (A: adenoid; N: width of the skeletal upper airway; PAS: width of the airway at the most protrusive place of the adenoid body; T: radius of the tonsil; P: width of the airway at the most protrusive place of the tonsil; ASL: anterior skull base length; MSL: middle skull base length; TSL: total skull base length; Go-Me: length of the body of the mandible; Ar-Go: length of the mandibular ramus; ANS-PNS: size of the maxilla; N-Me: total anterior facial height; N-ANS: superior facial height; S-Go: posterior facial height; H-MP: distance from the hyoid to the mandibular plane; H-C: distance between the third cervical vertebra [C3] and hyoid; SPT: thickness of the soft palate; and SPL: length of the soft palate); and three ratio measurements (AN ratio: ratio of A and N; TP ratio: ratio of T and P; and Upper ratio: upper facial height proportion).
Figure 2 displays the cephalometric reference points utilized for all measurements. Figure 3 illustrates the measurements of the soft palate, including its length, thickness, and angulation, as well as the measurements of the hyoid and skull base structures. Figure 4 shows data on the facial measurement, including facial height, and measurements of the mandible and maxilla. Figure 5 illustrates measurements of the adenoid (A, N, and AN ratio) and tonsil (T, P, and TP ratio).
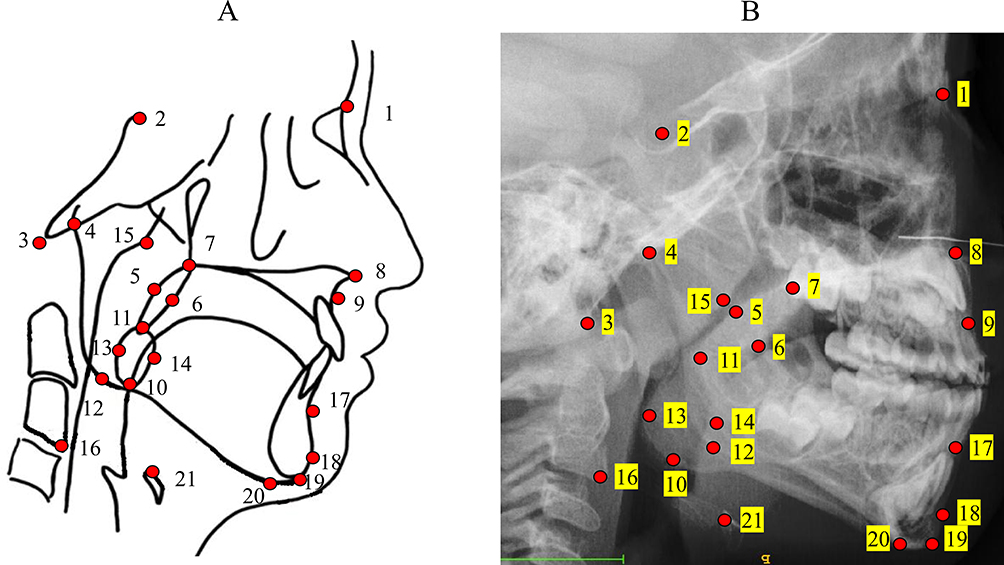 |
Figure 2 Cephalometric reference points used for all measurements. (A) Schematic and (B) schematic on a lateral skull radiograph of a patient. Reference points: 1) N. nasion, 2) S. sella, 3) Ba. basion, 4) Ar. articulare, 5 and 6) thickest point of the soft palate, 7) PNS. posterior nasal spine, 8) ANS. anterior nasal spine, 9) A point, 10) lower pole of tonsils, 11) P. tip of the soft palate, 12) Go. gonion, 13 and 14) widest part of the tonsils, 15) adenoid vertex, 16) lower anterior point of C3, 17) point B, 18) Po. pogonion, 19) Gn. gnathion, 20) Me. menton, and 21) hyoid point. |
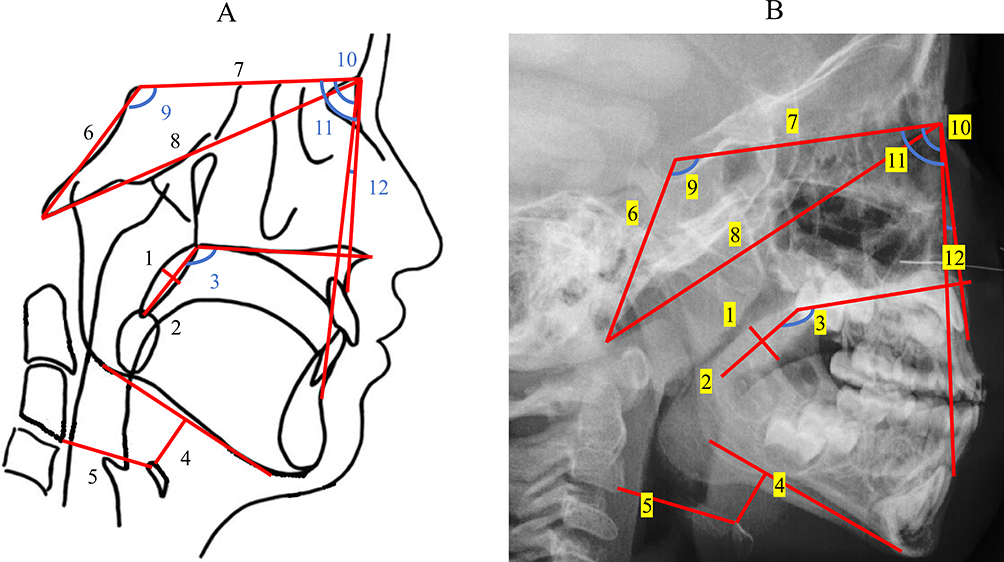 |
Figure 3 Measurements of the skull base structure, soft palate, and hyoid. (A) Schematic and (B) schematic on a lateral skull radiograph of a patient. Reference points: Soft palate measurements: 1) thickness of the soft palate (SPT), 2) length of the soft palate (SPL), and 3) angle of the soft palate (ASP). Hyoid measurements: 4) distance between C3 and hyoid (H-C), and 5) distance from the hyoid to the mandibular plane (H-MP). Measurement of skull base structure: 6) middle skull base length (MSL), 7) anterior skull base length (ASL), 8) total skull base length (TSL), 9) angle of the skull base (N.S-S.Ba), 10) SNB, 11) SNA, and 12) ANB, difference between SNA and SNB. |
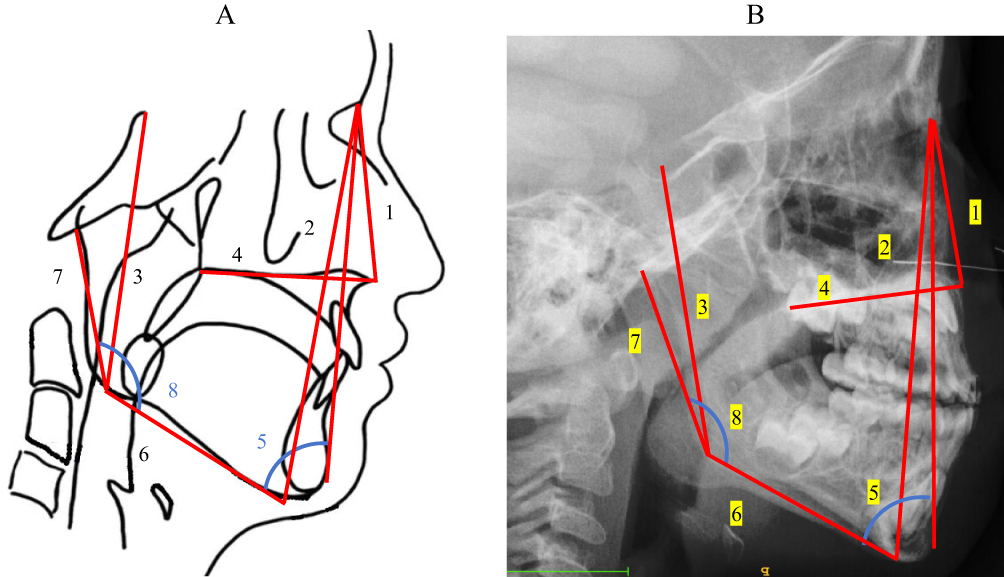 |
Figure 4 Facial measurements. (A) Schematic and (B) schematic on a patient’s lateral skull radiograph. Reference points: Facial measurement: 1) N-ANS: superior facial height, 2) N-Me: total anterior facial height, 3) S-Go: posterior facial height, 4) ANS-PNS: size of the maxilla, 5) Go.Me-N.Pog: relationship between facial height and mandibular, 6) Go-Me: length of the body of the mandible, 7) Ar- Go: length of the mandibular ramus, and 8) Go.ME-Go.Ar: mandibular angle. |
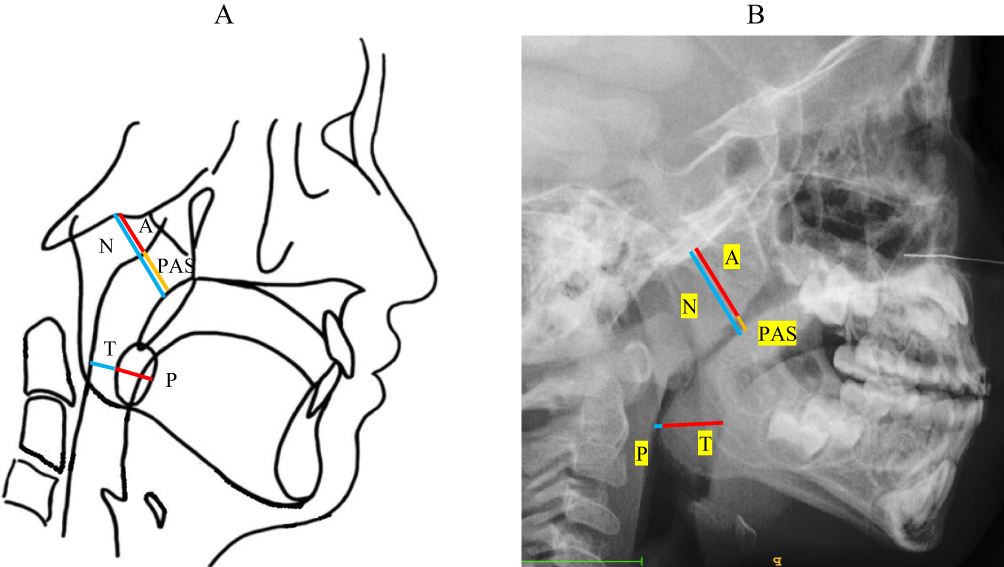 |
Figure 5 Measurements of the adenoids and tonsils. (A) Schematic and (B) schematic on a patient’s lateral skull radiograph. Reference points: Adenoid and tonsil measurements: A: width measured at the most protrusive place of adenoid, N: width of the skeletal upper airway; PAS: width of the airway at the most protrusive place of the adenoid body; T: radius of the tonsil, and P: width of the airway at the most protrusive place of the tonsil. |
Statistical Analysis
All statistical analyses were performed using R Studio (version 4.3.1). Descriptive statistics for categorical data are shown as counts and percentages, while continuous data are reported as mean±standard deviation. Differences between groups were evaluated using various tests: chi-square test for categorical variables, independent samples t-test for normally distributed continuous variables, and Mann–Whitney U-test for ordered categorical variables. Pearson correlation test was used for correlation analysis.
Least absolute shrinkage and selection operator (LASSO) regression was conducted using the R package “glmnet”, and binary logistic regression was performed using the “lrm” function in R Studio. The model was visualized using the “nomogram” function in the “rms” package.
The performance of prediction model was evaluated through receiver operating characteristic (ROC) curve analysis. The Youden index helped determine the optimal cut-off point for assessing accuracy, sensitivity and specificity. Additionally, the Akaike information criterion (AIC) was used to gauge model fit and complexity, with a smaller AIC indicating a better model due to its penalty for more independent variables. Statistical significance was defined as a p value of 0.05 or less.
Results
Demographic Characteristics, Clinical Symptoms, and Physical Signs in the Training and External Validation Sets
A total of 747 children aged 2–12 years were enrolled in our training set, comprising 372 boys (49.8%) and 375 girls (50.2%), with no significant difference between the two groups (Table 1). The results showed a significant difference in age (p < 0.05) between the OSA group and the control group, and we found that children with OSA were younger in our study population. Children with OSA had a higher BMI-z (p < 0.001) than the controls. Regarding clinical symptoms (including snoring, sleep suffocation, and mouth breathing), only mouth breathing showed a significant difference between the two groups (p = 0.008). Regarding clinical signs, the children with OSA had a higher tonsil grade than the controls (p < 0.001). In terms of birth information, there were no significant differences between the two groups in birth weight, delivery, term birth, and feeding pattern (all p > 0.05).
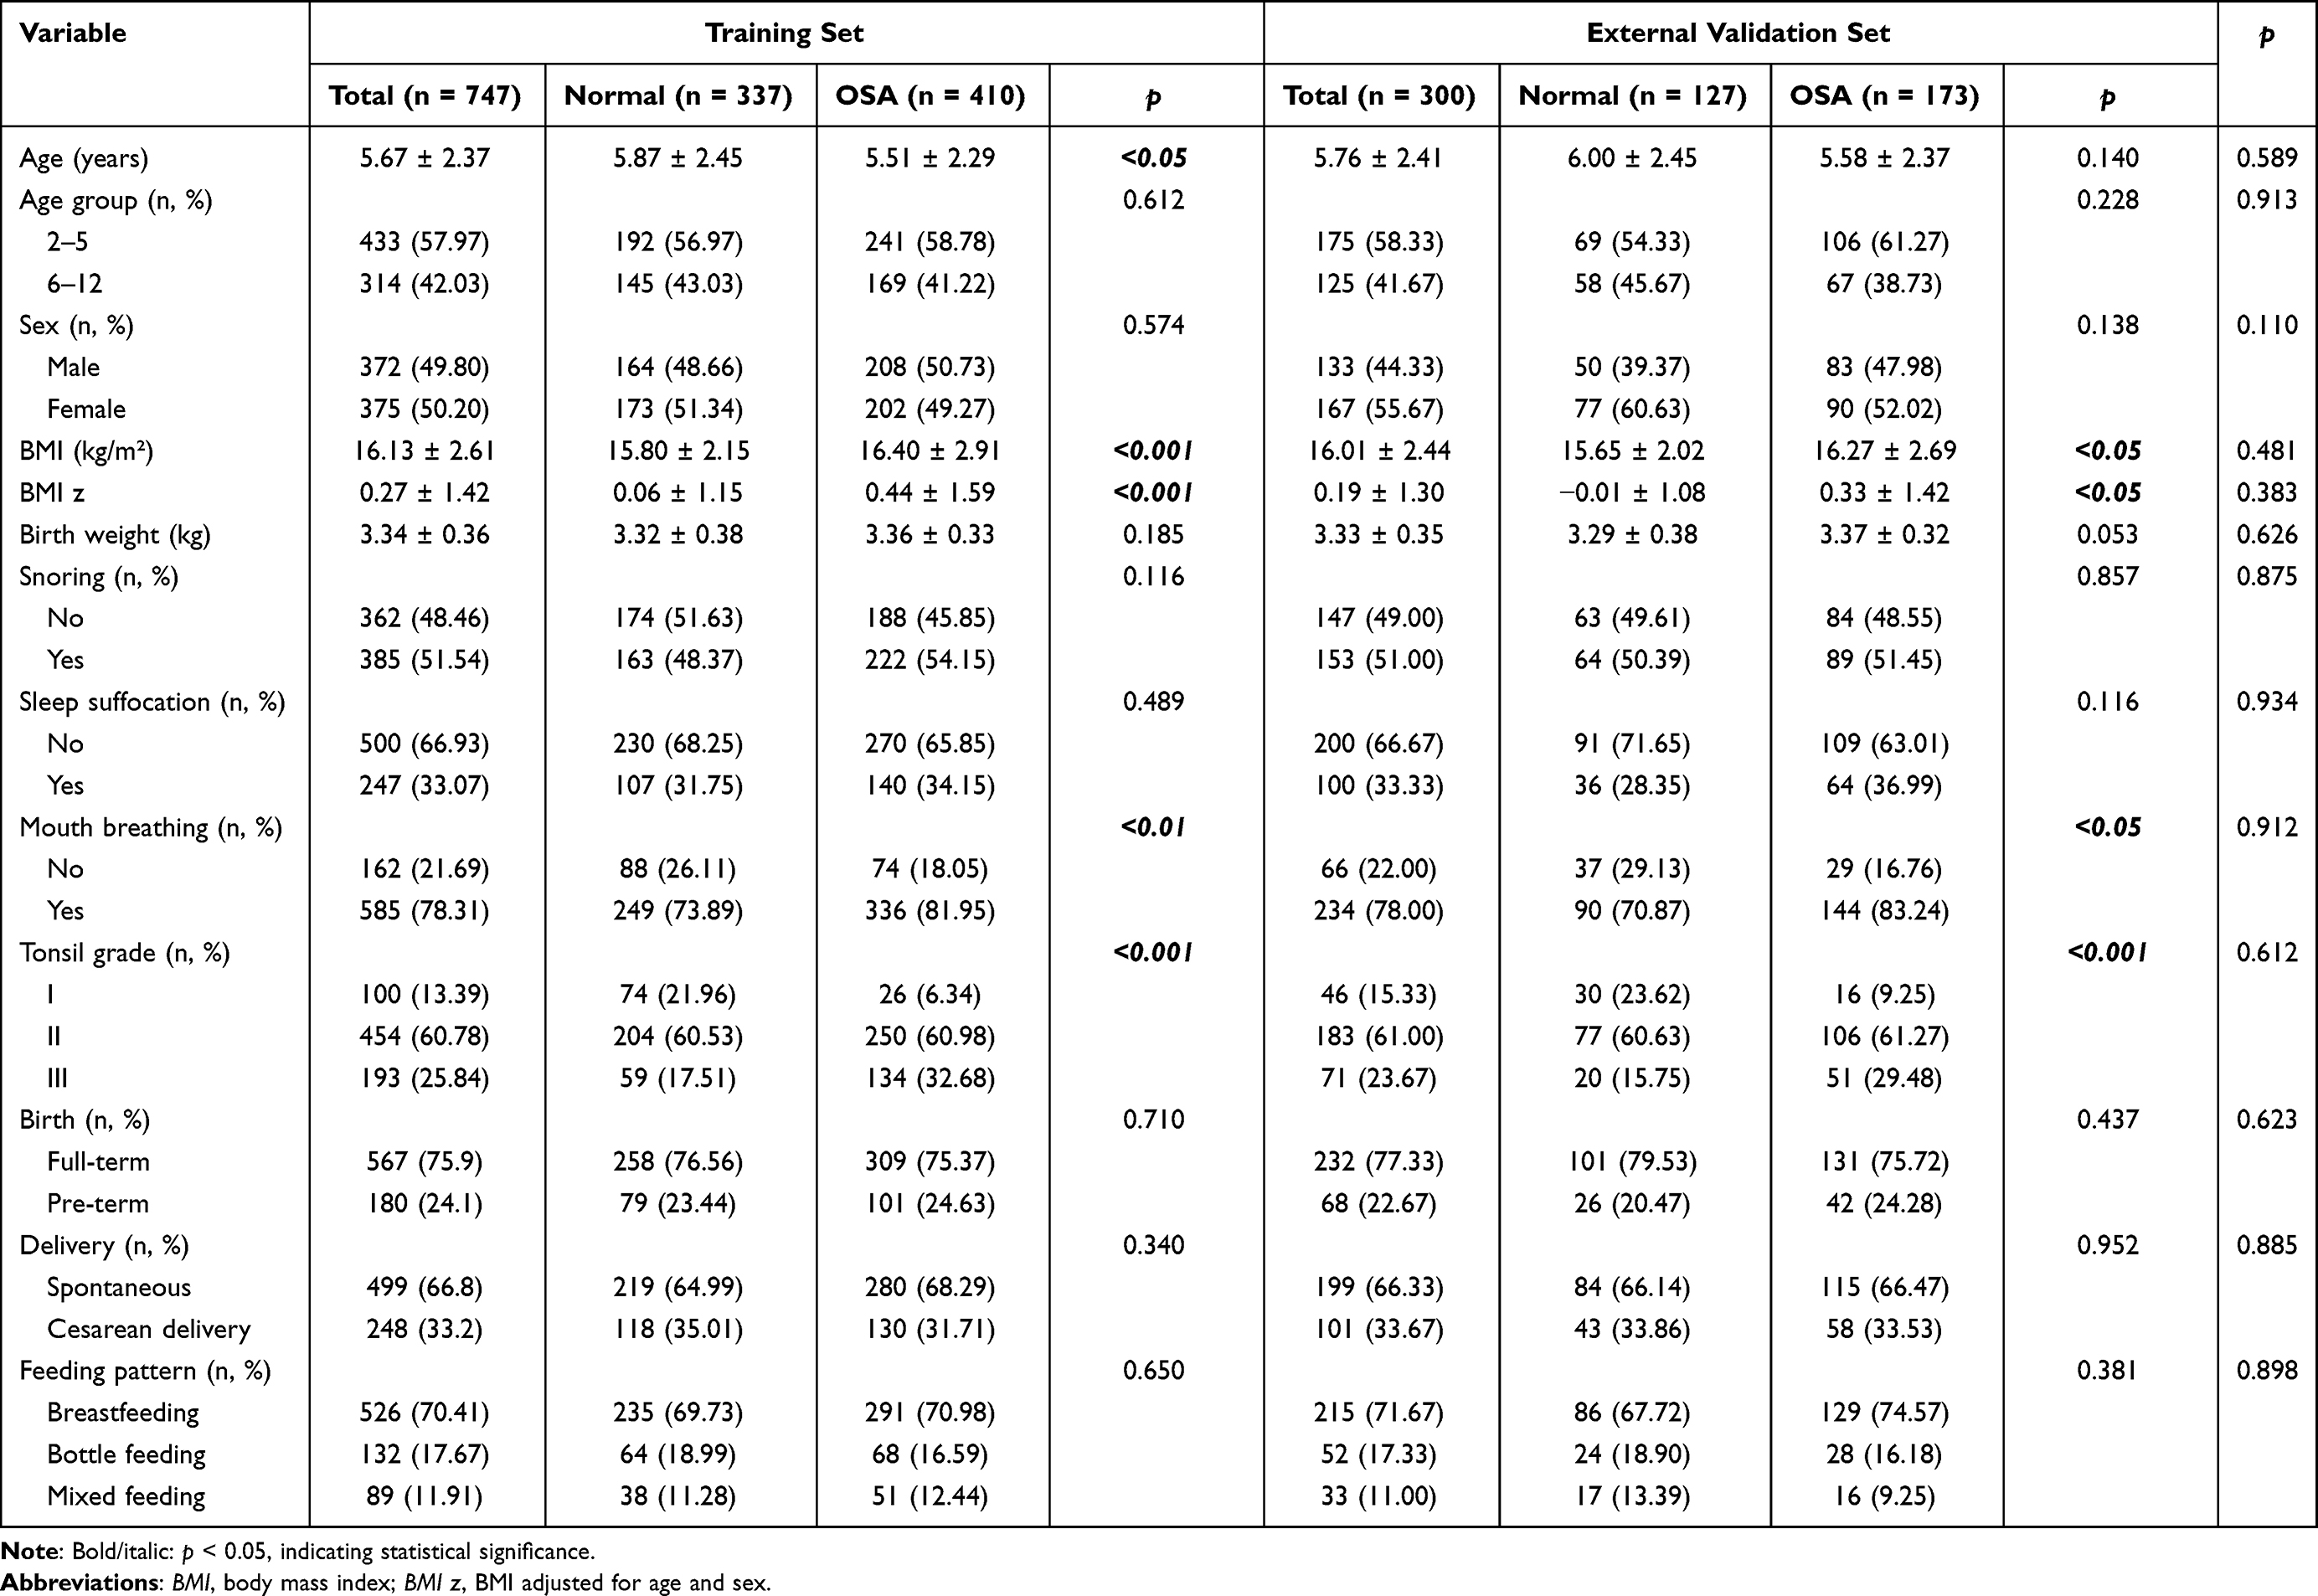 |
Table 1 Demographic Characteristics, Clinical Symptoms, and Physical Signs in the Training and External Validation Sets |
Results of Lateral Head Radiograph Measurements
Table 2 shows the measurements from lateral head radiographs in the training set. The results showed that A, AN ratio, and PAS were significantly different between the two groups (all p < 0.001), which reflected the size of the adenoids and width of the surrounding airway. Regarding tonsil size and the surrounding airway, T in the OSA group was higher than that in the control group (p < 0.05). There was no significance in measurements of the skull base structure between groups (all p > 0.05). The results for maxillofacial measurements are summarized in Table 2. Two parameters showed a significant difference in mean values between the two groups: SNA (87.01 ± 5.03 vs 88.51 ± 5.29, p < 0.001) and SNB (80.52 ± 4.27 vs 82.39 ± 4.01, p < 0.001), with no difference in ANB. Children with OSA had smaller SNA and SNB measurements than the controls.
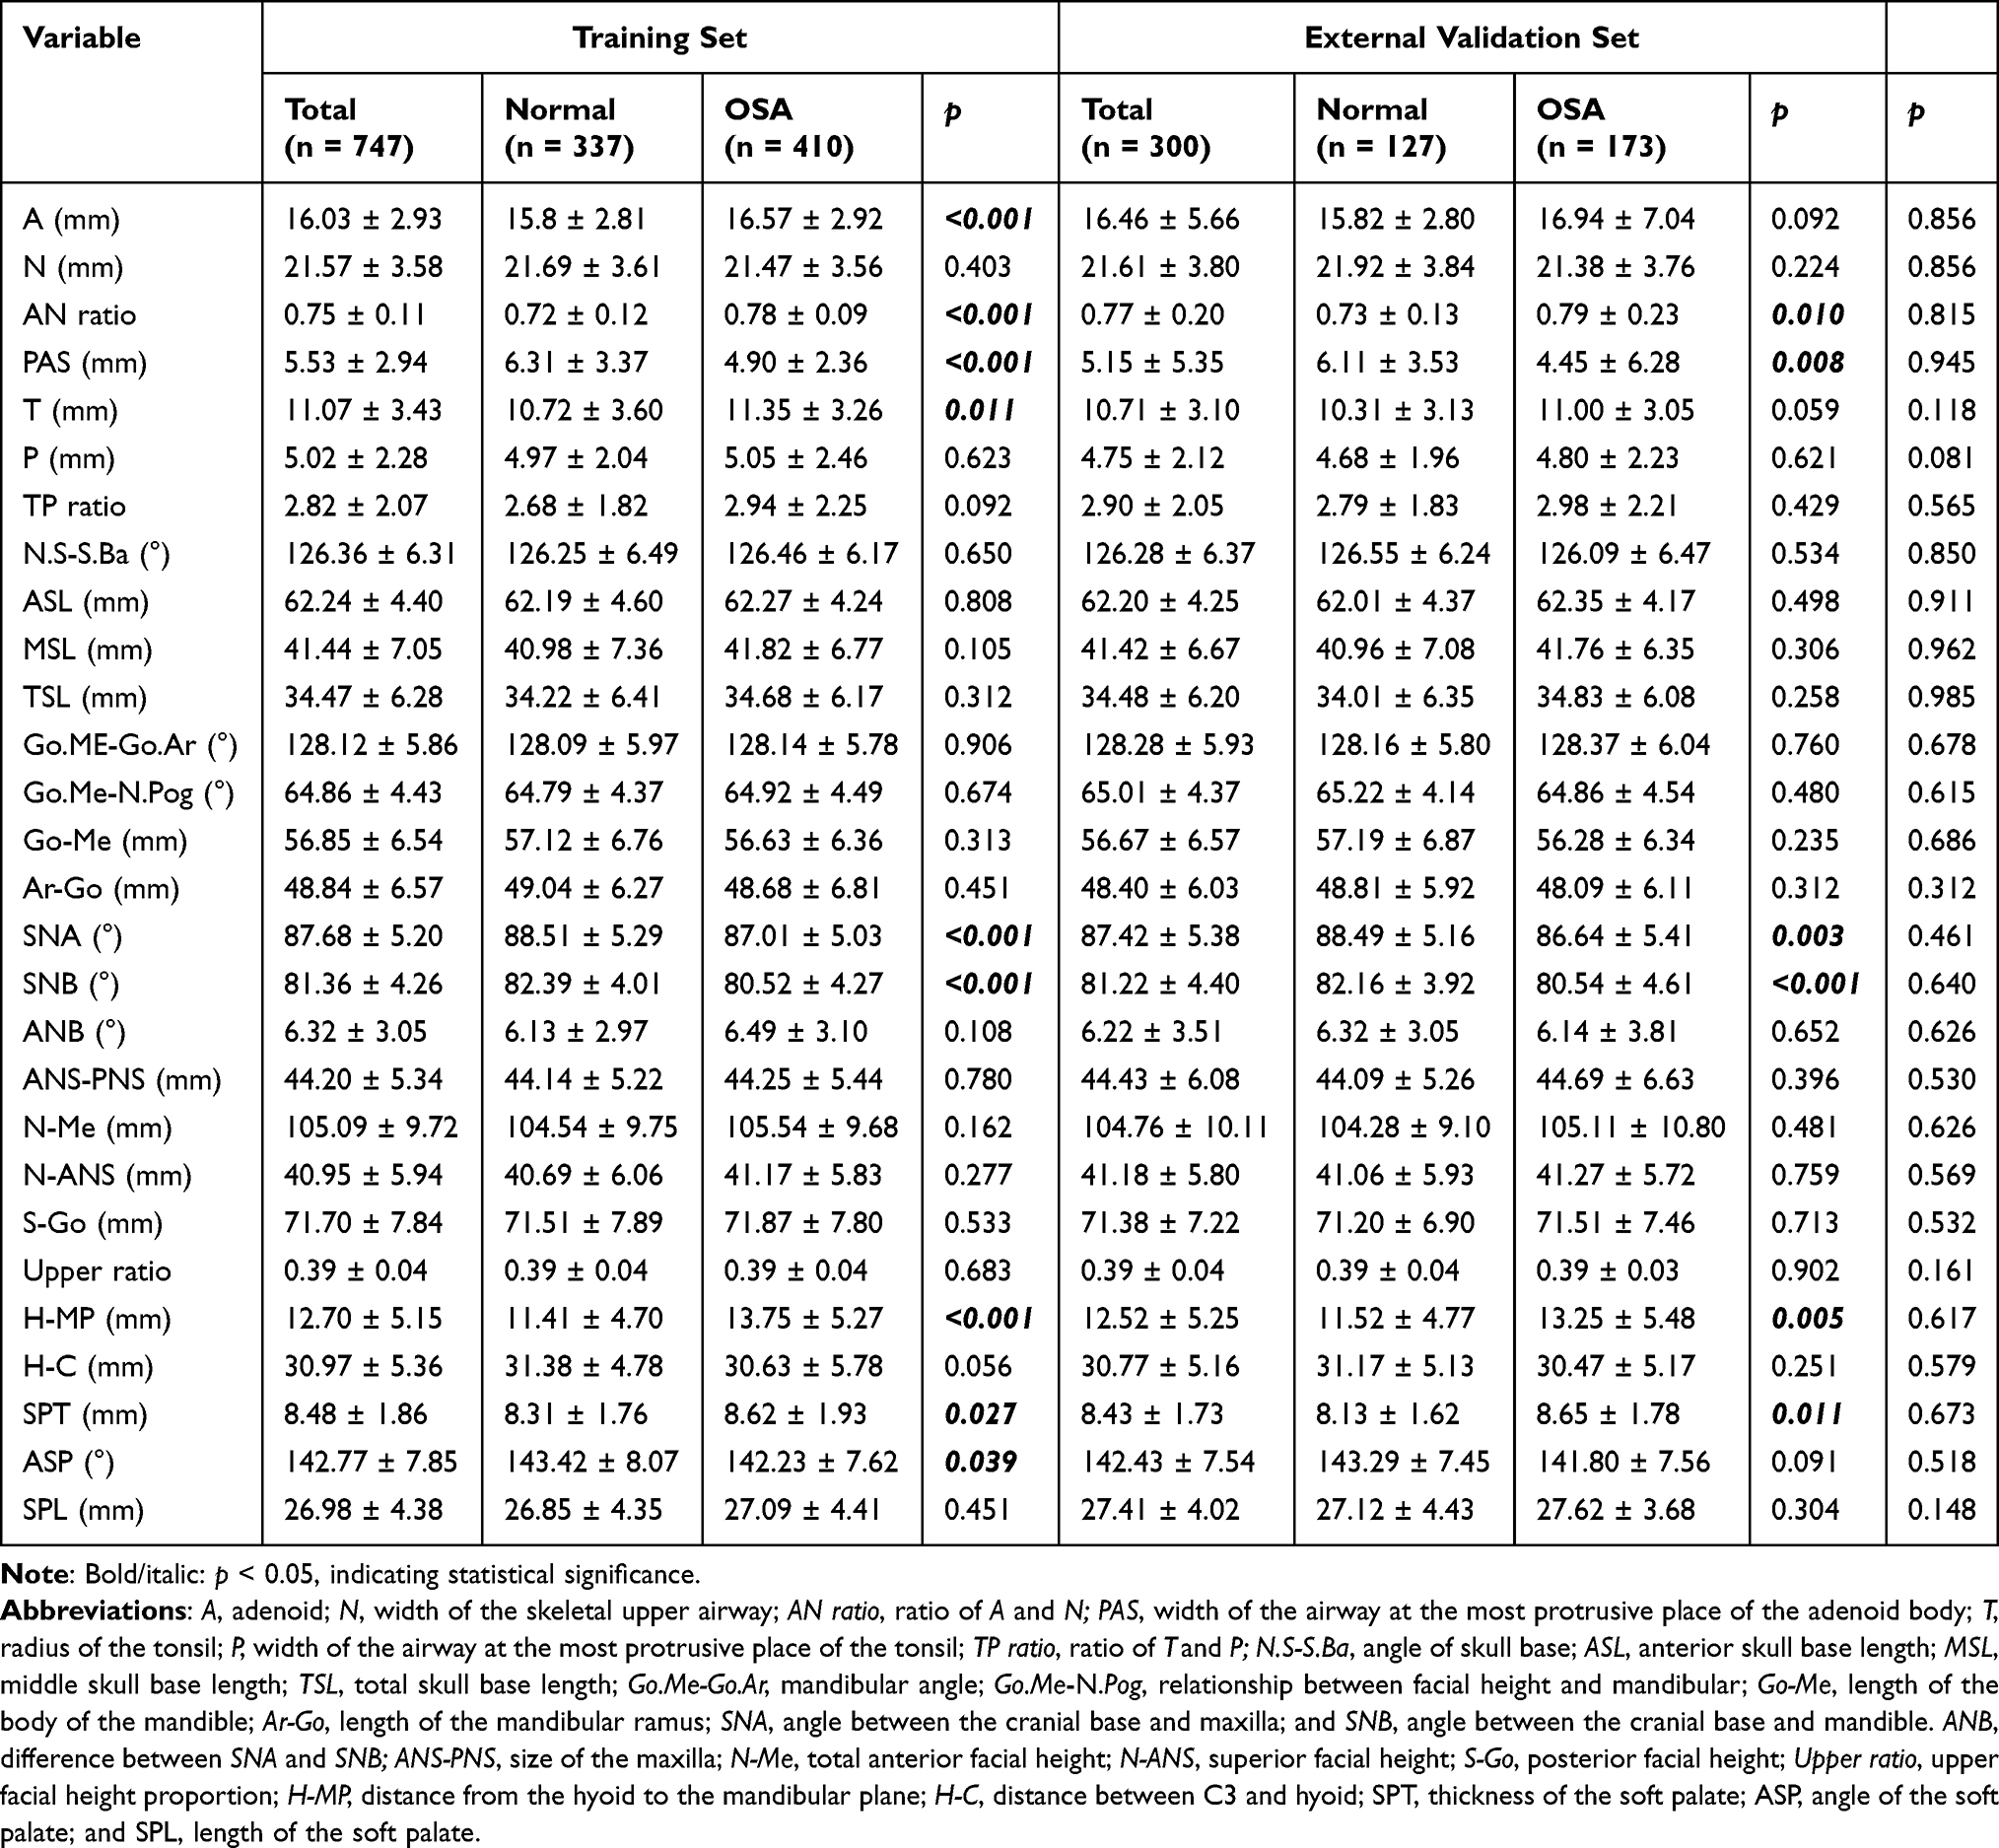 |
Table 2 Cephalometric Measurements from Lateral Head Radiographs in the Training and External Validation Sets |
The comparative results of the hyoid position in the two groups were significantly different. Children with OSA had higher H-MP values than the normal group (p < 0.001). The results also showed that children with OSA have thicker soft palates and smaller angles between the soft and hard palates than the normal group. Table 3 shows the PSG results of the two groups.
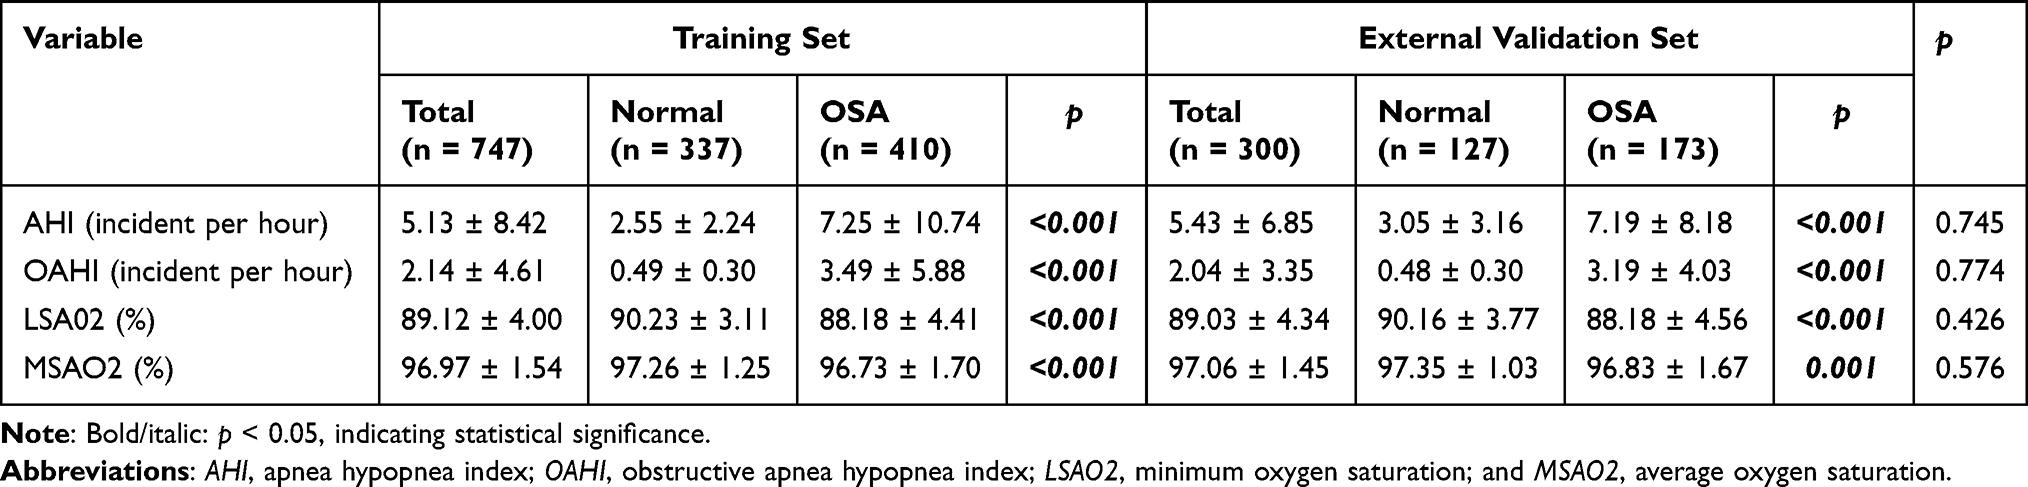 |
Table 3 PSG Data in the Training and External Validation Sets |
Relationship Between PSG Results and Measurements from Lateral Head Radiographs
The results of correlation analysis among the PSG index and measurements from lateral head radiographs are shown in Figure 6. The OAHI was positively correlated with BMI z, A, and H-MP (all p < 0.05). Furthermore, the OAHI was negatively correlated with SNA, SNB, and H-C (all p < 0.05).
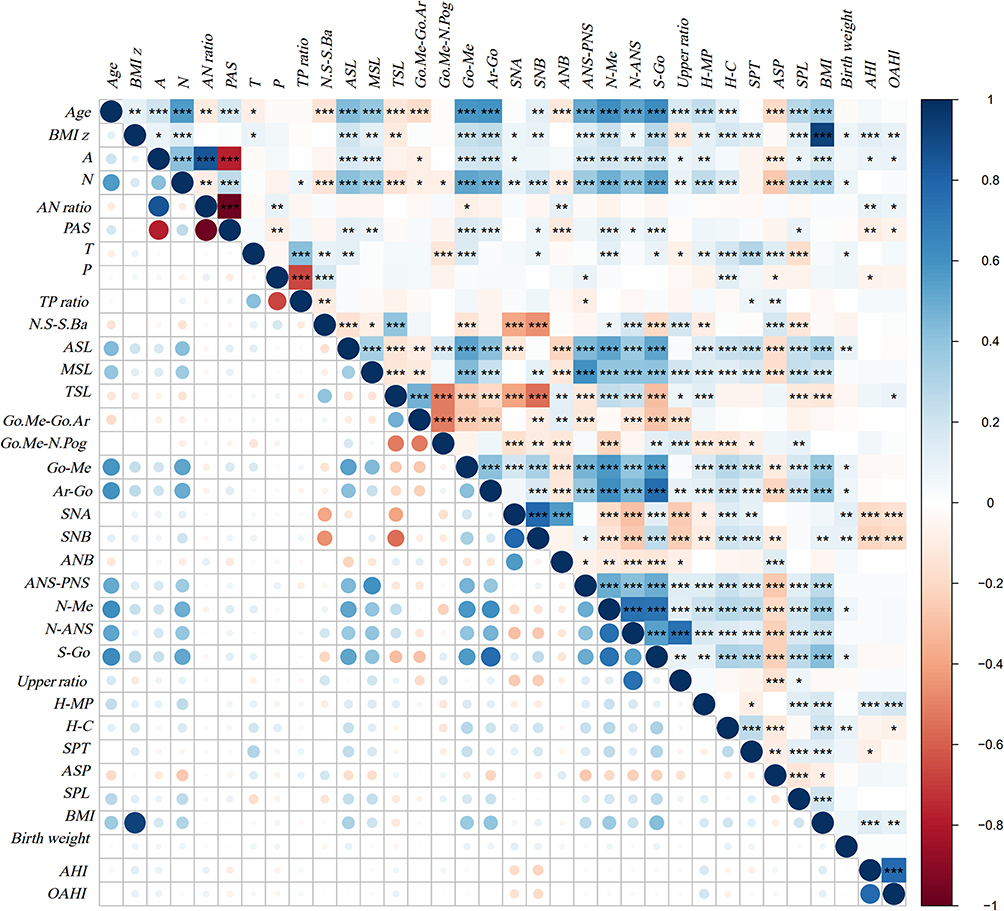 |
Figure 6 Correlation analysis among PSG index and cephalometric measurements from lateral head radiographs. *p < 0.05, **p < 0.01, and ***p < 0.001. Abbreviations: BMI, body mass index; BMI z, BMI adjusted for age and sex; A, adenoid; N, width of the skeletal upper airway; AN ratio, ratio of A and N; PAS, width of the airway at the most protrusive place of the adenoid body; T, radius of tonsil; P, width of airway at the most protrusive place of tonsil; TP ratio, ratio of T and P; N.S-S.Ba, angle of skull base; ASL, anterior skull base length; MSL, middle skull base length; TSL, total skull base length; Go.Me-Go.Ar, mandibular angle; Go.Me-N.Pog, relationship between facial height and mandibular; Go-Me, length of the body of the mandible; Ar-Go, length of the mandibular ramus; SNA, angle between the cranial base and maxilla; SNB, angle between the cranial base and mandible; ANB, difference between SNA and SNB; ANS-PNS, size of the maxilla; N-Me, total anterior facial height; N-ANS, superior facial height; S-Go, posterior facial height; Upper ratio, upper facial height proportion; H-MP, distance from the hyoid to the mandibular plane; H-C, distance between C3 and hyoid; SPT, thickness of the soft palate; ASP, angle of the soft palate; SPL, length of the soft palate; AHI, apnea hypopnea index; OAHI, obstructive apnea hypopnea index; LSAO2, minimum oxygen saturation; and MSAO2, average oxygen saturation. |
We then performed LASSO logistic regression analysis with OSA as the outcome in the training set. Figure 7 shows the process of variable screening in LASSO regression. The results showed that with λ = 0.020, a total of 16 variables were selected, namely Age group, Tonsil grade, Mouth breathing, BMI-z, A, AN ratio, PAS, MSL, TSL, SNB, S-Go, H-MP, H-C, SPT, ASP, and Birth weight. After eliminating non-significant variables, we constructed the final logistic regression model, shown in Table 4 and Figure 8.
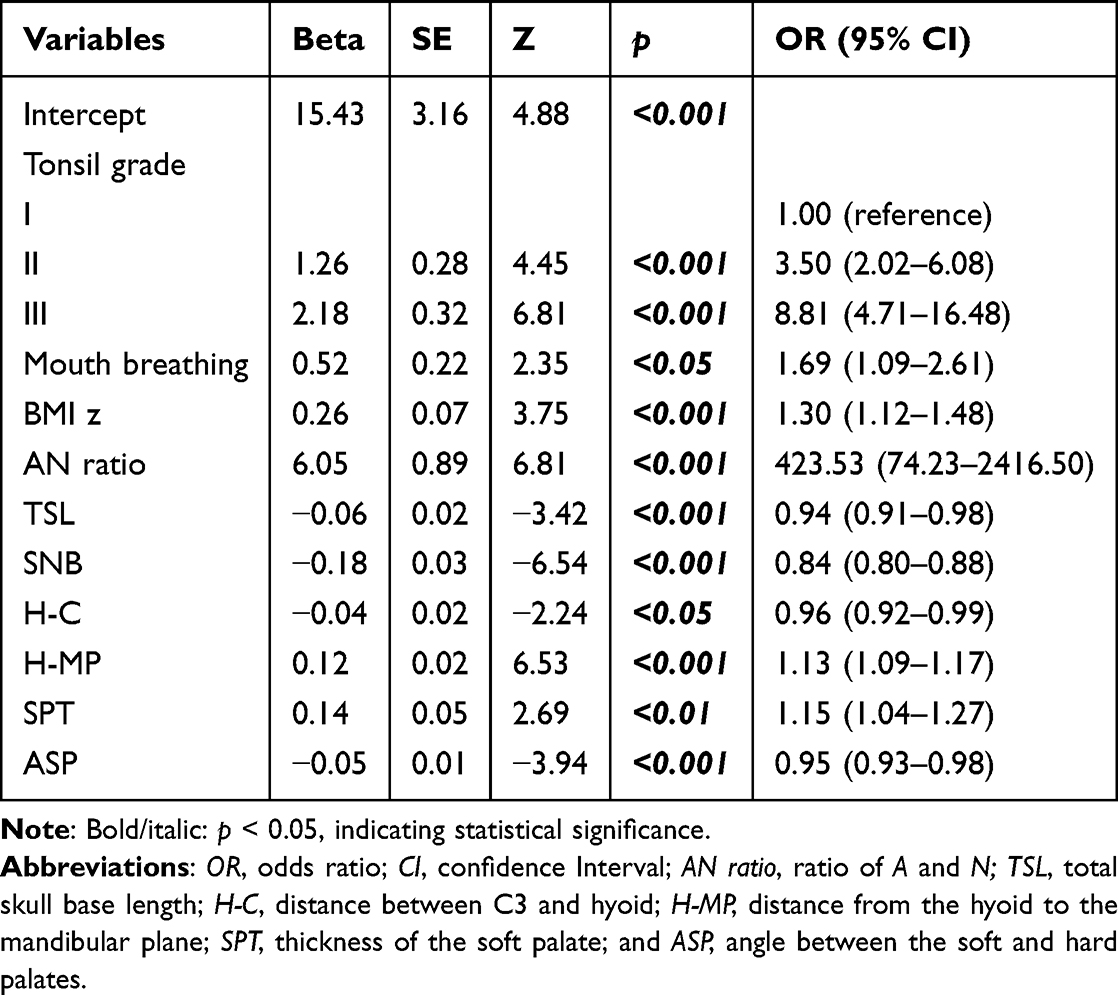 |
Table 4 Multivariate Logistic Regression in Children Aged 2–12 Years |
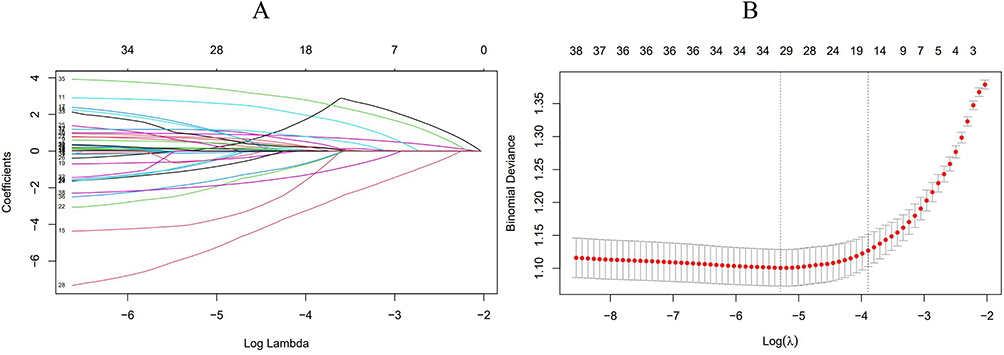 |
Figure 7 Process of variable screening in LASSO regression. (A) Coefficient path plot. (B) Bias–variance trade-off plot. |
 |
Figure 8 Nomogram plot for the model in the age group 2–12 years. Abbreviations: AN ratio, ratio of A and N; TSL, total skull base length; H-C, distance between C3 and hyoid; H-MP, distance from the hyoid to the mandibular plane; SPT, thickness of the soft palate; and ASP, angle between the soft and hard palates. |
Model Evaluation and Validation
The area under the ROC curve (AUC) value of the training set was 0.812 (95% confidence interval [CI]: 0.781–0.842, p < 0.001; AIC = 262.44), showing good efficiency. Figure 9 also shows the ROC curves of the validation set, with AUC = 0.763 (95% CI: 0.709–0.812). Calibration curve analysis indicated good agreement between the experimental and predicted values, and decision curve analysis showed high clinical utility (Figure 9).
 |
Figure 9 ROC curves, calibration plots, and DCA curve for the model for the training and external validation sets in the age group 2–12 years. (A) Area under the ROC curve was used to judge the advantages and disadvantages of the nomogram in the training set. (B) ROC curve in the external validation set. (C) Calibration plot for the diagnostic nomogram in the training set. The diagonal 45-degree line indicates perfect prediction. (D) Calibration plot for diagnostic nomogram in the external validation set. (E) Decision curve analysis for the diagnostic nomogram in the training and external validation sets. The net benefit calculated by adding the true positive and subtracting the false positive corresponds to measurement of the Y-axis; the X-axis represents the threshold probability. |
Age-Stratified Analysis
Based on the differential development of children in different periods, we conducted intergroup difference analysis based on age groups. Our population comprised 433 children aged 2–5 years and 334 children aged 6–12 years. In addition, we performed LASSO logistic regression to screen variables with OSA as the outcome variable in these groups and then conducted logistic regression modeling. The process of constructing the model is shown in the Figures S1 and S2. Table 5 displays our final model for preschool children (2–5 years old). Figure 10 shows the ROC curves, calibration plots, DCA curves, and nomogram of the model for this group. The AUC value of the training set was 0.769 (95% CI: 0.725–0.814, p < 0.001; AIC = 121.31), and the AUC value of the validation set was 0.714 (95% CI: 0.637–0.791).
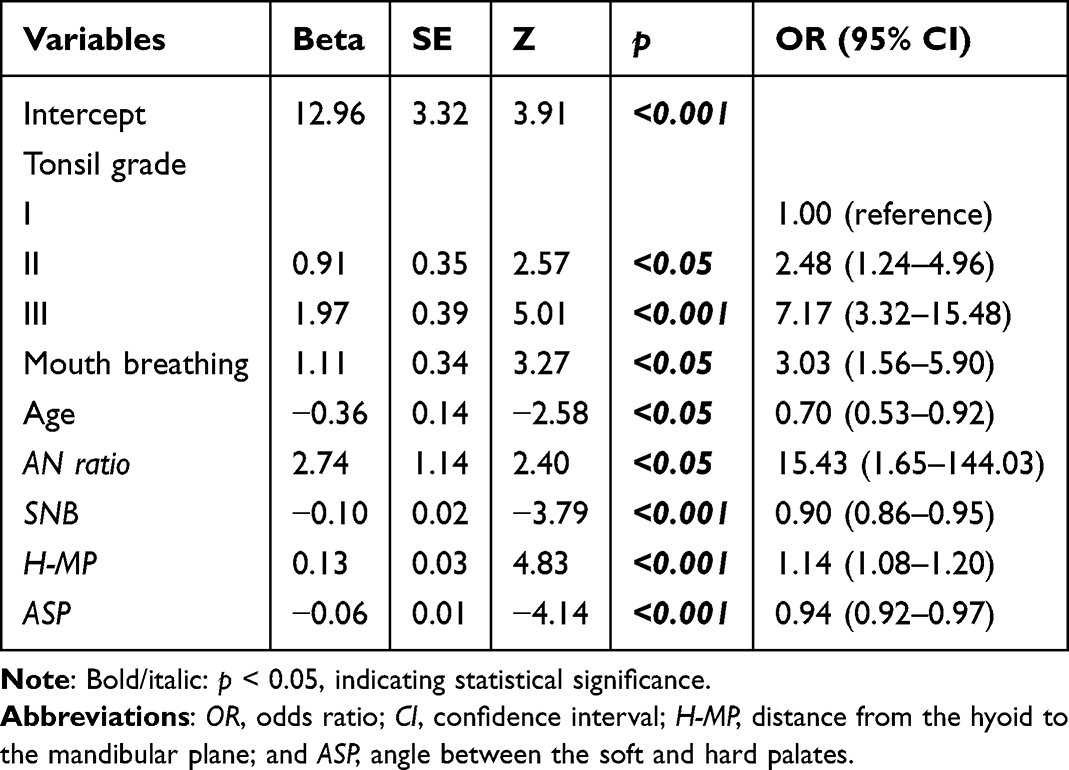 |
Table 5 Multivariate Logistic Regression in Preschool Children |
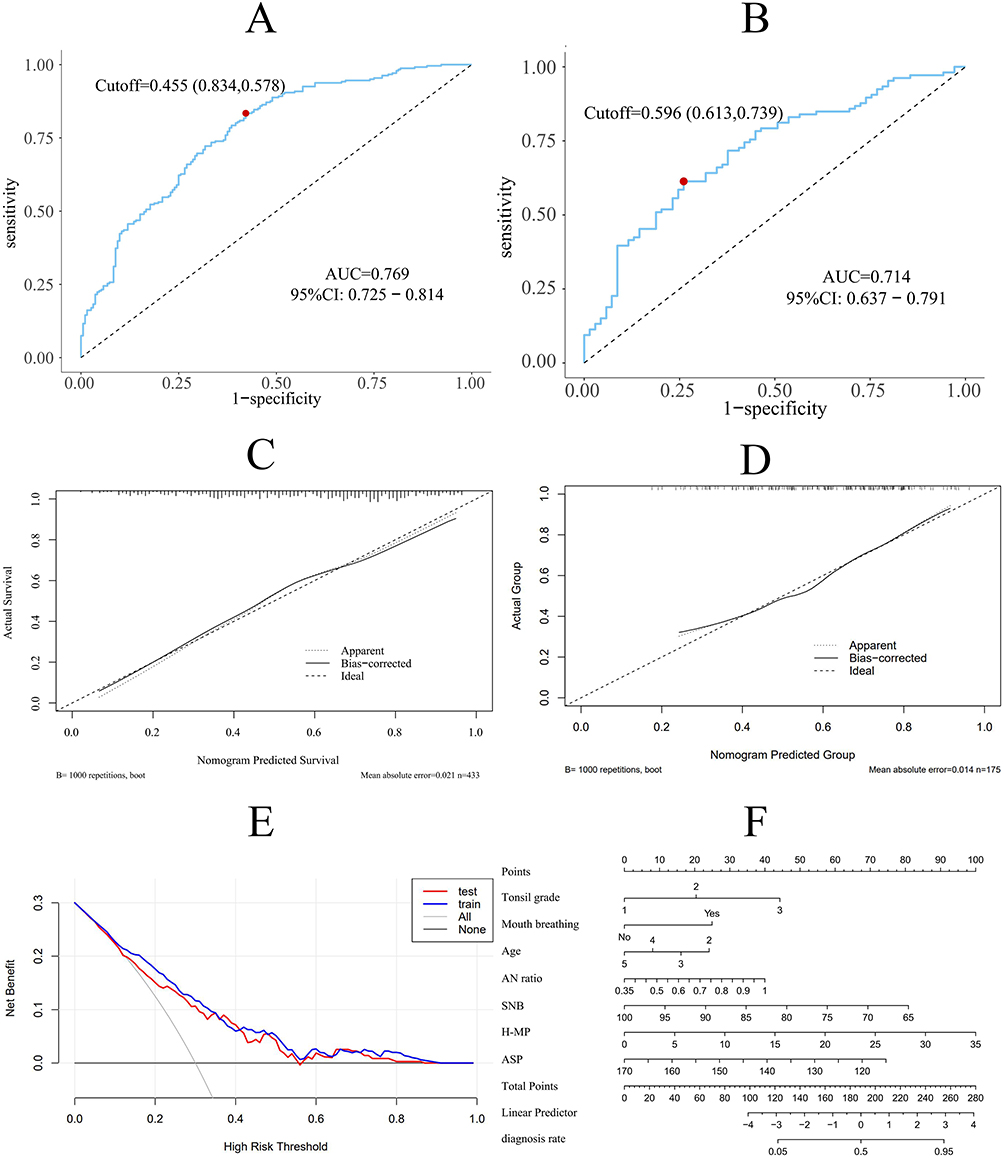 |
Figure 10 ROC curves, calibration plots, DCA curve, and nomogram for the model in the training and validation sets in preschool children. (A) ROC curve in the training set. (B) ROC curve in the external validation set. (C) Calibration plot for the diagnostic nomogram in the training set. (D) Calibration plot for diagnostic nomogram in the external validation set. (E) Decision curve analysis for the diagnostic nomogram in the training and external validation sets. (F) Nomogram of the model in preschool children. |
The logistic regression model in school-aged children (6–12 years old) is shown in Table 6. Figure 11 displays the ROC curves, calibration plots, DCA curves, and nomogram of the model in the training and validation sets. The AUC value of the training set was 0.854 (95% CI: 0.812–0.895, p < 0.001; AIC = 157.62), and the AUC value of the validation set was 0.846 (95% CI: 0.779–0.912).
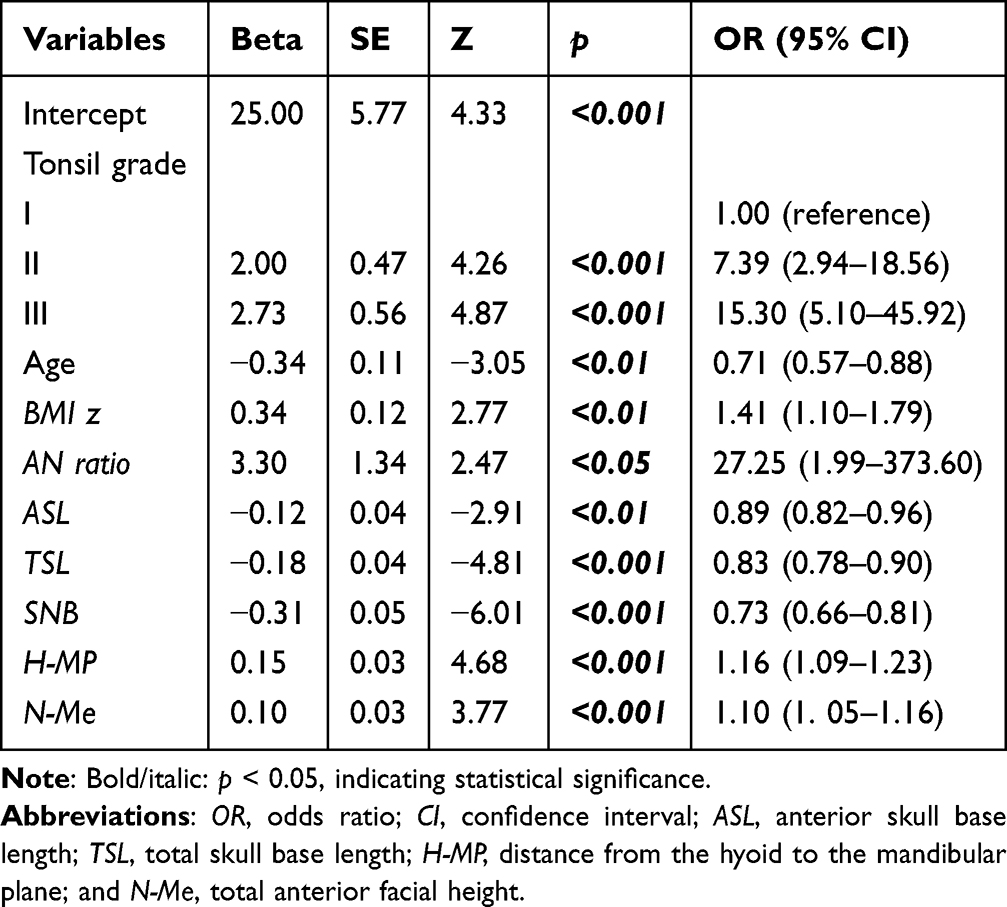 |
Table 6 Multivariate Logistic Regression in School-Aged Children |
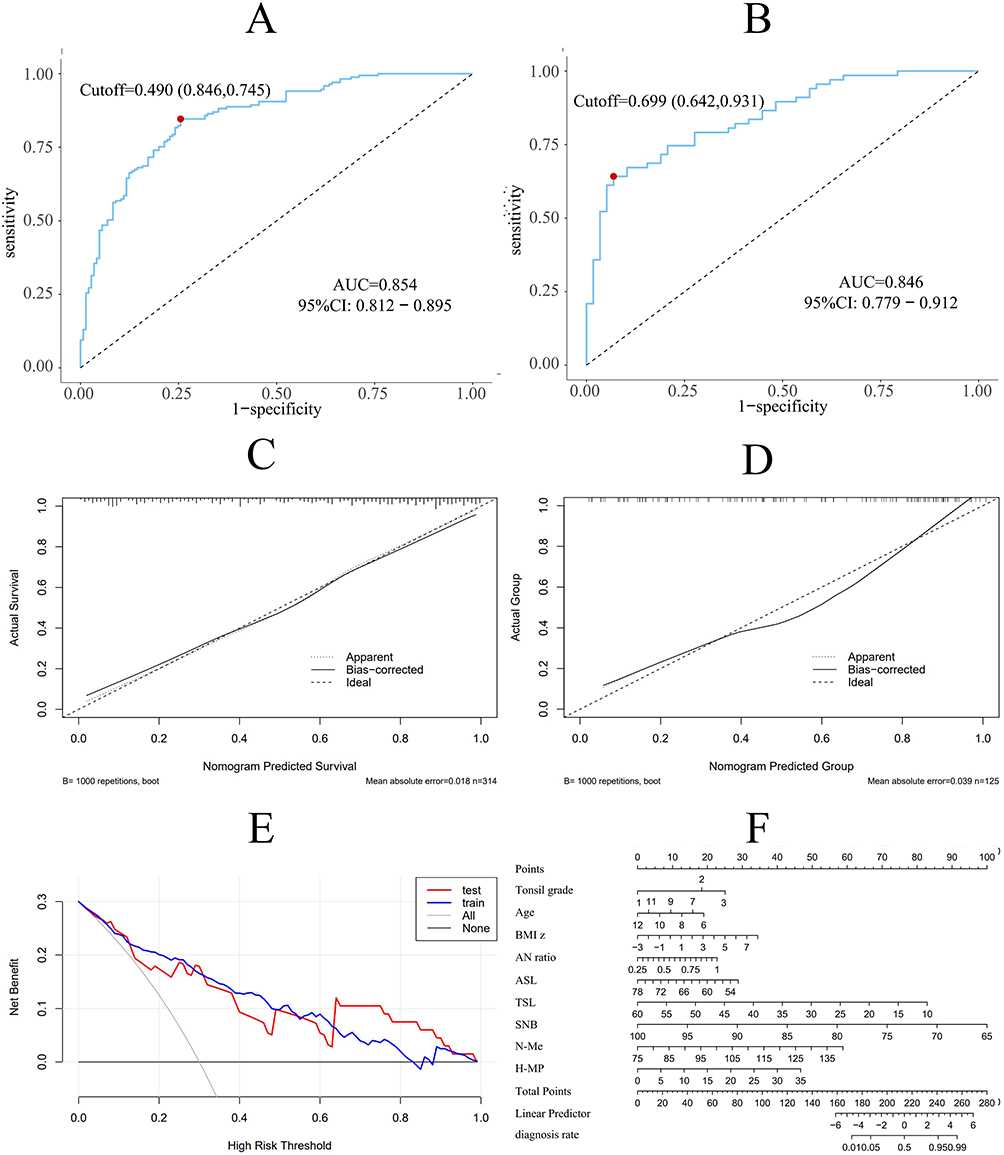 |
Figure 11 ROC curves, calibration plots, DCA curve, and nomogram of the model in the training and validation sets in school-aged children. (A) ROC curve in the training set. (B) ROC curve in the external validation set. (C) Calibration plot for the diagnostic nomogram in the training set. (D) Calibration plot for diagnostic nomogram in the external validation set. (E) Decision curve analysis for the diagnostic nomogram in the training and external validation sets. (F) Nomogram of the model in school-aged children. |
Discussion
Craniofacial features are crucial factors in pediatric obstructive sleep apnea.17–19 Studies have suggested a close relationship between craniofacial features and pediatric OSA. Craniofacial abnormalities may alter the anatomy of the oral and pharyngeal structures, increasing the risk of pharyngeal obstruction and leading to the onset and progression of OSA.18,20 Factors such as retrognathia, hypertrophy of the soft palate, and enlarged tonsils are closely linked to the pathophysiology of OSA.21,22 Cephalometric radiographs are often used to assess the craniofacial bone and soft tissue structures in children. However, most current studies comparing cephalometric data focus primarily on adults.20,23,24 The research on children is scarce owing to a lack of normal values and unavailable samples. Based on what we know, this is the first study to conduct a large-scale lateral cephalometric measurement in pediatric patients with OSA and to analyze their predictive value across different age groups.
In our research, we assessed the variations in clinical data, measurements using cephalometric radiographs, and PSG results in 410 patients and 310 controls in the training set over the recent 7 years. Our results indicated that nine out of the 28 cephalometric measurements (A, AN ratio, PAS, T, SNA, SNB, H-MP, SPT, and ASP) showed significant differences between the two groups. We discovered that children with OSA had a higher BMI compared to the control group, even after adjustment for sex and age. This is consistent with previous findings.25–28 Obesity and adenoid and tonsil hypertrophy are major risk factors for pediatric children. The increasing rates of childhood obesity seem to correlate with a higher prevalence of OSA. Potential pathophysiological mechanisms involve adenotonsillar hypertrophy, higher airway closing pressure, alterations in chest wall mechanics and disruptions in ventilatory control. Yet, the precise details and interactions of these mechanisms are still not well understood.
Our study demonstrated that children with OSA were younger than typically developing children, which is consistent with previous research.29 During infancy and toddlerhood, some children may have relatively narrow airways, with relatively large tonsils and adenoids, factors that may increase the risk of OSA. Additionally, sleep patterns during infancy and toddlerhood may influence the occurrence of OSA. For example, infants may be more prone to experiencing airway obstruction during sleep.
In our study, the proportion of children with OSA did not differ by sex. Earlier research conducted in children with OSA have shown that OSA predominantly affects boys, similar to adults.29 A cross-sectional study found that OSA is frequently observed in male adolescents, with a sex ratio of 2♂:1♀.30 This may be partly owing to specific physiological and anatomical features during boys’ growth and development, such as palatal development and throat structure, making them more vulnerable to the impacts of OSA. However, findings are not consistent across all studies. Some research indicates that OSA becomes more prevalent in boys compared to girls after puberty, while the incidence of OSA is similar between genders in prepubertal children.31 Some studies have also found that sex differences are not significant in certain age groups or specific populations or that female children may also be affected by OSA.
OSA in children peaks between ages 2 and 8, coinciding with the peak age for adenotonsillar hypertrophy.32 Given that adenotonsillar hypertrophy is a major cause of OSA in prepubertal children, it is anticipated that the prevalence rates of OSA will be similar in boys and girls within this age group. However, in children older than this range, OSA mechanisms may differ. A recent research of 267 preschool and school-aged children demonstrated that while adenotonsillar obstruction correlated with OSA severity in preschoolers,33 this correlation did not extend to school-aged children. This indicates that factors like anatomical or neurological differences might have a greater impact on OSA severity in older children. In our study, we observed a significant correlation between the extent of adenotonsillar hypertrophy and the severity of OSA in both preschool and school-aged children. However, we found that the predictive value of adenotonsillar hypertrophy for OSA varied across different age groups, which enriches previous research to some extent.
The study found a significant increase in the dimensions of A, AN ratio, PAS, and T in the case group, indicating larger tonsils and adenoids compared to the controls. This supports earlier observations that the case group exhibits more pronounced adenotonsillar enlargement.34 Adenotonsillar hypertrophy is the chief reason of OSA in children, leading to collapse of the pharynx. Research indicates that OSA frequently occurs in young children due to this condition.33 These findings highlight the critical need for prompt and effective treatment of adenotonsillar hypertrophy to manage OSA in children.35
In analyzing measurements of the skull base, including the skull base angle, anterior skull base length, middle skull base length, and total skull base length, no significant differences were observed. However, in our multiple regression model, we found that a lower total skull base length was related to a higher likelihood of OSA, especially among 6–12 years group, a finding that further advances previous research.36–41 A systematic review found that while some studies with lower bias risk suggest a shorter skull base length in children with sleep disorder breathing, no definitive association can be established. The evidence is inconclusive because the included studies are of low or inadequate quality.42 The cranial base, where the cranium meets the face, plays a crucial role in shaping craniofacial skeletal growth patterns.43 Its development is crucial for the forward growth of the maxilla, and any failure in the normal lengthening of the cranial base can lead to midface deficiencies, such as those seen in congenital syndromes like achondroplasia. The cranial base significantly affects head and facial growth, which can influence pediatric sleep-disordered breathing. Additionally, early joining of cranial sutures can result in facial and cranial deformities, which may cause upper airway obstruction and increase the risk of OSA.44 Our study had a large sample size and underwent external validation, further confirming the significant role of total skull base length in pediatric OSA.
Regarding facial measurements in our research, we observed differences only in the SNA and SNB indices. The OSA group exhibited smaller SNA and SNB values than the control group, suggesting that the maxilla and mandible are positioned further back in children with OSA. However, there was no significant difference in the ANB, suggesting that the relative anteroposterior position of the maxilla and mandible may not substantially affect the occurrence of OSA, even in the adjusted model. This finding contrasts with earlier research. For instance, a research of twenty-eight snoring and twenty-eight non-snoring children aged 7 to 14 found that snoring children had more retrusive maxilla and mandible than their non-snoring peers.45 Other research also shows that a posteriorly positioned mandible relative to the maxilla can narrow the oropharyngeal and hypopharyngeal spaces, increasing the risk of OSA.46,47 This supports the idea that craniofacial relationships significantly influence the risk of developing OSA. However, these studies are constrained by their small sample sizes. Interestingly, we found that SNB is more critical in predicting OSA in children aged 2–5 and 6–12 years. SNA was not included in the model, suggesting that mandibular retrognathia might be more critical in the OSA pathogenesis than maxillary retrognathia.
Patients with sleep apnea showed increased Go.Me-N.Pog and smaller Go-Me trends, indicating that children with OSA may have a underdeveloped chin. This aligns with the findings of earlier studies.34,47 According to Ozdemir,47 children with sleep apnea often have a smaller mandible and chin. This is partly because airway obstruction can disrupt normal craniofacial development. Additionally, a smaller mandible and chin can further impact airway function, potentially exacerbating sleep apnea symptoms.
Results from the multivariate predictive model for the age group 6–12 years showed that N-Me positively affected the diagnosis of OSA, although the magnitude of this influence appears to be relatively small. In terms of “vertical” craniofacial development, increased anterior facial height is a characteristic often seen in an adenoid face, which is often related to OSA.48,49 A cross-sectional study of Chinese children aged 5 to 12 years found no significant difference in facial height between those with OSA and their peers without the condition.50 Previous research on the relationship between anterior facial height and OSA has yielded inconsistent results.51,52 This inconsistency might be due to varying obstructive sites contributing to OSA and the disease’s complex, heterogeneous etiology.53
In children with OSA, the positioning of the hyoid bone is an important factor. The “H point”, which indicates the lower and anterior location of the hyoid, helps assess its placement in relation to other anatomical landmarks. The study involved assessing the vertical distance (H-MP) and the sagittal distance (H-C). And the results showed significant differences in both H-C and H-MP measurements for children aged 2 to 12 years. These findings demonstrate that children with OSA are likely to have a hyoid bone that is positioned lower and more posteriorly. This finding agreed with other studies. These findings are consistent with other research. Behlfelt and Linder-Aronson’s54 studies also demonstrated that children with OSA had a more inferiorly positioned hyoid bone. Similarly, Kawashima’s research in Japan,55 which involved cephalometric analysis, confirmed that a lower hyoid position was consistently observed in children with sleep disorder. Kawashima proposed that cranial measurement analysis is a useful tool for pre-surgical evaluation of OSA in school-aged children. In our prediction model, in the age group 2–12 years, both the H-MP (distance from mandibular plane to hyoid) and H-C (distance from the hyoid to C3) were important for predicting OSA. However, after stratification by age, the predictive value of H-C was not high in the two subgroups. Nevertheless, H-MP was included in the stratified subgroup models, proving its value. This finding has not been reported in previous studies.
The length and thickness of the soft palate, and the angle between the soft and hard palates are important anatomical features that can influence various aspects of breathing and airway stability. A longer soft palate may contribute to airway obstruction or collapse during sleep, especially if it encroaches upon the pharyngeal airspace. The thickness of the soft palate can affect its ability to maintain rigidity and prevent collapse during breathing. A thicker soft palate may be more resistant to collapse and could also contribute to narrowing of the airway. The angle formed between the soft and hard palates, known as the palatal angle, is also important. A narrow or acute angle may indicate a smaller oral cavity, potentially predisposing to airway obstruction. Conversely, a more expansive or obtuse angle may suggest a larger oral cavity and more open airway. Understanding these anatomical features, particularly in relation to each other, can provide valuable insights into airway stability and the risk of OSA. For example, a long and thick soft palate combined with a narrow palatal angle may increase the hazard of airway collapse during sleep, whereas a shorter soft palate and wider palatal angle may indicate a more stable airway. This information can guide diagnostic and treatment decisions for individuals with airway-related sleep disorders. We found that children with OSA have longer and thicker soft palates and smaller soft palate to hard palate angles than the controls, consistent with previous research.56,57 Additionally, SPT and ASP were incorporated in the predictive model in the overall 2–12 years group. With subgroup analysis by age, only ASP was incorporated in the model for 2–5 years group; neither SPT nor ASP was incorporated in the model for children 6–12 years group. This suggests that their effects vary across different age groups, with potentially less effect on OSA in the 6–12 years group. This finding has not been reported in previous studies.
Many researchers believe that patients with sleep apnea often have a narrow airway. In our study, we also measured airway indices such as PAS (the width of the airway at the most protrusive point of the adenoid) and P (the width of the airway at the most protrusive point of the tonsils), and found differences only in the PAS between the two groups. P represents the airway space at the maximum point of the tonsils. There are several potential explanations for our findings. The cephalometry used in this study may lack sensitivity and accuracy in evaluating the airway and surrounding soft tissues. Two-dimensional cephalometry can introduce errors due to its lower precision compared to three-dimensional (3D) imaging. This methodological limitation could account for the lack of significant differences in airway dimensions observed. Higher-quality 3D magnetic resonance imaging and Cone Beam Computed Tomography offer superior detail for assessing the airway and soft tissues compared to two-dimensional cephalometry.
PSG is the traditional standard method for diagnosing OSA, but it has some limitations in practical use. Our predictive model constructed for children with OSA, based on clinical features and cephalometry from lateral head radiographs, demonstrated excellent predictive performance and applicability, even after stratifying by different age groups. Our study directly indicated craniofacial developmental parameters related to predicting pediatric OSA obtained from lateral cephalometric measurements, as well as their contribution. Future prospective studies are needed to confirm and improve these findings to potentially replace PSG with this simpler tool.
In recent years, increasing attention has been paid to the phenotypic research of pediatric OSA.58 Phenotypic analysis of pediatric OSA plays a crucial role in personalized diagnosis and treatment, which can improve the prognosis of this population. By identifying clinical subtypes, personalized treatment plans can be developed to select therapies associated with predictable responses. Craniofacial abnormality is one of the phenotypes in pediatric OSA, and our study focuses on analyzing this phenotype in order to develop a method for early identification of children with this phenotype for prompt diagnosis and treatment. Future research can continue to explore the development of diagnostic tools for pediatric OSA based on these different phenotypes, and conduct studies on predicting therapeutic outcomes.
Our study has several strengths including a large sample size, a wide selection of measurement parameters, analysis of age subgroups, and external validation in children from another hospital. In addition, craniofacial developmental features obtained from lateral cephalometric X-rays have the advantages of being simpler, lower in radiation exposure, and more cost-effective compared to Computed Tomography scans. These aspects have deepened and advanced the research in this field, to some extent. The present study has several limitations. Firstly, the sample included only a small proportion of children with moderate-to-severe OSA, and no subgroup analysis was performed based on the severity of the disease. Secondly, the reliability of two-dimensional craniofacial measurements remains a concern, necessitating further research to clarify how surface facial features correlate with the soft tissue and skeletal structures of the upper airway. Additionally, since the external validation was conducted at the same hospital, it limits the generalizability of the results. Future research should involve multi-center and multi-regional studies to assess the generalizability of the model.
Conclusions
Our study findings support the significant role of craniofacial structures such as the hyoid, maxilla, and mandible in pediatric OSA. We discovered that the development of the soft palate, particularly its thickness and angulation, may has a crucial role in pediatric OSA, which has rarely been discussed in previous research. Age-stratified predictive models for pediatric OSA indicated varying parameters across different age groups: BMI and cranial base length were more significant in school-aged children, whereas mouth breathing was a critical feature among preschoolers. These findings underscore the need for stratification by age in future research on pediatric OSA. Our prediction model, based on a large sample size, subgroup analysis by age, and external validation in children from another hospital, demonstrates good practical utility. This will greatly assist health care practitioners with rapidly identifying pediatric OSA in complex clinical scenarios.
Data Sharing Statement
Data are available from the corresponding author on reasonable request.
Consent Statement and Ethics Approval
This retrospective study was approved by the Ethics Committee of the Second Affiliated Hospital of Xi’an Jiaotong University (approval no.2021031) and the Ethics Committee of the Xi’an Central Hospital (approval no.20230102). The procedures used in this study adhered to the tenets of the Declaration of Helsinki.
Acknowledgments
We wish to thank all who volunteered to participate in this study.
Author Contributions
Xiaoyong Ren and Yewen Shi are joint senior authors. All authors made a significant contribution to the work reported, whether that is in the conception, study design, execution, acquisition of data, analysis and interpretation, or in all these areas; took part in drafting, revising or critically reviewing the article; gave final approval of the version to be published; have agreed on the journal to which the article has been submitted; and agree to be accountable for all aspects of the work.
Funding
This work was supported by Development Program in the Social Development Field of Shaanxi, China (2020GXLH-Y005), the Free Exploration and Innovation Project of the Basic Scientific Research Fund of Xi’an Jiaotong University (xzy012023119), and the National Natural Science Foundation of China (grant No. 82371129, 82303887).
Disclosure
The author(s) report no conflicts of interest in this work.
References
1. Guilleminault C, Pelayo R, Leger D, et al. Recognition of sleep-disordered breathing in children. Pediatrics. 1996;98(5):871–882. doi:10.1542/peds.98.5.871
2. Sateia MJ. International classification of sleep disorders-third edition: highlights and modifications. Chest. 2014;146(5):1387–1394. doi:10.1378/chest.14-0970
3. Lo Bue A, Salvaggio A, Insalaco G. Obstructive sleep apnea in developmental age. A narrative review. Eur J Pediatr. 2020;179(3):357–365. doi:10.1007/s00431-019-03557-8
4. Marcus CL, Brooks LJ, Ward SD, et al. Diagnosis and management of childhood obstructive sleep apnea syndrome. Pediatrics. 2012;130(3):e714–e755. doi:10.1542/peds.2012-1672
5. Savini S, Ciorba A, Bianchini C, et al. Assessment of obstructive sleep apnoea (OSA) in children: an update. Acta otorhinolaryngologica Italica: organo ufficiale della Societa italiana di otorinolaringologia e chirurgia cervico-facciale. 2019;39(5):289–297. doi:10.14639/0392-100X-N0262
6. Bixler EO, Vgontzas AN, Lin HM, et al. Sleep disordered breathing in children in a general population sample: prevalence and risk factors. Sleep. 2009;32(6):731–736. doi:10.1093/sleep/32.6.731
7. Fregosi RF, Quan SF, Kaemingk KL, et al. Sleep-disordered breathing, pharyngeal size and soft tissue anatomy in children. J Appl Physiol. 2003;95(5):2030–2038. doi:10.1152/japplphysiol.00293.2003
8. Marcus CL, Moore RH, Rosen CL, et al. A randomized trial of adenotonsillectomy for childhood sleep apnea. New Engl J Med. 2013;368(25):2366–2376. doi:10.1056/NEJMoa1215881
9. Decuzzi J, Redline S, Isaiah A. Secondary analyses of the childhood adenotonsillectomy trial: a narrative review. JAMA Otolaryngology-- Head & Neck Surgery. 2022;148(8):779–784. doi:10.1001/jamaoto.2022.1330
10. Barbosa DF, Bana LF, Michel MCB, et al. Rapid maxillary expansion in pediatric patients with obstructive sleep apnea: an umbrella review. Brazilian J Otorhinolaryngol. 2023;89(3):494–502. doi:10.1016/j.bjorl.2023.02.004
11. Spilsbury JC, Storfer-Isser A, Rosen CL, et al. Remission and incidence of obstructive sleep apnea from middle childhood to late adolescence. Sleep. 2015;38(1):23–29.
12. Xie B, Zhang L, Lu Y. The role of rapid maxillary expansion in pediatric obstructive sleep apnea: efficacy, mechanism and multidisciplinary collaboration. Sleep Med Rev. 2023;67:101733. doi:10.1016/j.smrv.2022.101733
13. Lipton AJ, Gozal D. Treatment of obstructive sleep apnea in children: do we really know how? Sleep Med Rev. 2003;7(1):61–80. doi:10.1053/smrv.2001.0256
14. Li AM, Wong E, Kew J, et al. Use of tonsil size in the evaluation of obstructive sleep apnoea. Arch Dischildhood. 2002;87(2):156–159. doi:10.1136/adc.87.2.156
15. Shi Y, Ma L, Chen X, et al. Prediction model of obstructive sleep apnea-related hypertension: machine learning-based development and interpretation study. Front Cardiovasc Med. 2022;9:1042996. doi:10.3389/fcvm.2022.1042996
16. Leung SS, Cole TJ, Tse LY, et al. Body mass index reference curves for Chinese children. Ann. Hum. Biol. 1998;25(2):169–174. doi:10.1080/03014469800005542
17. Ekici M, Ekici A, Keles H, et al. Risk factors and corr elates of snoring and observed apnea. Sleep Med. 2008;9(3):290–296. doi:10.1016/j.sleep.2007.04.018
18. Tsuda H, Fastlicht S, Almeida FR, et al. The correlation between craniofacial morphology and sleep-disordered breathing in children in an undergraduate orthodontic clinic. Sleep & Breathing = Schlaf & Atmung. 2011;15(2):163–171. doi:10.1007/s11325-010-0345-4
19. S S, Shetty V, Priya K, et al. Cephalometry as an aid in the diagnosis of pediatric obstructive sleep apnoea: a systematic review and meta-analysis. J Oral Biol Craniofacial Res. 2024;14(5):512–521. doi:10.1016/j.jobcr.2024.06.007
20. Garofalo E, Neri G, Perri LM, et al. Assessment of cephalometric parameters and correlation with the severity of the obstructive sleep apnea syndrome. J Transl Med. 2024;22(1):377. doi:10.1186/s12967-024-05194-8
21. Armalaite J, Lopatiene K. Lateral teleradiography of the head as a diagnostic tool used to predict obstructive sleep apnea. Dentomaxillofacial Radiol. 2016;45(1):20150085. doi:10.1259/dmfr.20150085
22. Chang ET, Shiao GM. Craniofacial abnormalities in Chinese patients with obstructive and positional sleep apnea. Sleep Med. 2008;9(4):403–410. doi:10.1016/j.sleep.2007.04.024
23. Johns FR, Strollo PJ, Buckley M, et al. The influence of craniofacial structure on obstructive sleep apnea in young adults. J Oral Maxillofacial Surg. 1998;56(5):596–602. doi:10.1016/S0278-2391(98)90459-1
24. Lowe AA, Ono T, Ferguson KA, et al. Cephalometric comparisons of craniofacial and upper airway structure by skeletal subtype and gender in patients with obstructive sleep apnea. Am J Orthodontics Dentofacial Orthopedics. 1996;110(6):653–664. doi:10.1016/S0889-5406(96)80043-6
25. Amaddeo A, de Sanctis L, Olmo Arroyo J, Giordanella, JP, Monteyrol, PJ, Fauroux, B . Obésité et SAOS de l’enfant [Obesity and obstructive sleep apnea in children]. Arch Pediatr. 2017;24:S34–S38. French. doi:10.1016/j.arcped.2016.09.003
26. Arens R, Muzumdar H. Childhood obesity and obstructive sleep apnea syndrome. J Appl Physiol. 2010;108(2):436–444. doi:10.1152/japplphysiol.00689.2009
27. Andersen IG, Holm JC, Homøe P. Obstructive sleep apnea in children and adolescents with and without obesity. European archives of oto-rhino-laryngology: official journal of the European Federation of Oto-Rhino-Laryngological Societies (EUFOS): affiliated with the German Society for Oto-Rhino-Laryngology. Head and Neck Surg. 2019;276(3):871–878.
28. Mathew JL, Narang I. Sleeping too close together: obesity and obstructive sleep apnea in childhood and adolescence. Paediatr Respiratory Rev. 2014;15(3):211–218. doi:10.1016/j.prrv.2013.09.001
29. Inoshita A, Kasai T, Matsuoka R, et al. Age-stratified se x differences in polysomnographic findings and pharyngeal morphology among children with obstructive sleep apnea. J Thoracic Dis. 2018;10(12):6702–6710. doi:10.21037/jtd.2018.11.09
30. Selvadurai S, Voutsas G, Katz SL, et al. Evaluating symptoms and polysomnographic findings among male and female children with obesity with and without obstructive sleep apnea. Sleep Med. 2022;100:56–63. doi:10.1016/j.sleep.2022.07.013
31. Redline S, Storfer-Isser A, Rosen CL, et al. Association between metabolic syndrome and sleep-disordered breathing in adolescents. Am J Respir Crit Care Med. 2007;176(4):401–408. doi:10.1164/rccm.200703-375OC
32. DelRosso LM. Epidemiology and diagnosis of pediatric obstructive sleep apnea. Curr Problems Pediatr Adolesc Health Care. 2016;46(1):2–6. doi:10.1016/j.cppeds.2015.10.009
33. Valera FC, Avelino MA, Pettermann MB, et al. OSAS in children: correlation between endoscopic and polysomnographic findings. Otolaryngology. 2005;132(2):268–272. doi:10.1016/j.otohns.2004.09.033
34. Deng J, Gao X. A case–control study of craniofacial features of children with obstructed sleep apnea. Sleep Breathing. 2012;16(4):1219–1227. doi:10.1007/s11325-011-0636-4
35. Miles PG, Vig PS, Weyant RJ, et al. Craniofacial structure and obstructive sleep apnea syndrome — a qualitative analysis and meta-analysis of the literature. Am J Orthodontics Dentofacial Orthopedics. 1996;109(2):163–172. doi:10.1016/S0889-5406(96)70177-4
36. Korayem MM, Witmans M, MacLean J, et al. Craniofacial morphology in pediatric patients with persistent obstructive sleep apnea with or without positive airway pressure therapy: a cross-sectional cephalometric comparison with controls. Am J Orthodontics Dentofacial Orthopedics. 2013;144(1):78–85. doi:10.1016/j.ajodo.2013.02.027
37. Zettergren-Wijk L, Forsberg C-M, Linder-Aronson S. Changes in dentofacial morphology after adeno-/tonsillectomy in young children with obstructive sleep apnoea—a 5-year follow-up study. Eur J Orthodont. 2006;28(4):319–326. doi:10.1093/ejo/cji119
38. Tanon-Anoh M-J, Kouassi YM, Yoda M, et al. Craniofacial modifications in Ivorian melanoderm children with chronic retronasal obstruction. Int J Pediatr Otorhinolaryngol. 2014;78(4):588–592. doi:10.1016/j.ijporl.2014.01.004
39. Ping-Ying Chiang R, Lin CM, Powell N, et al. Systematic analysis of cephalometry in obstructive sleep apnea in Asian children. Laryngoscope. 2012;122(8):1867–1872. doi:10.1002/lary.23297
40. Perillo L, Cappabianca S, Montemarano M, et al. Morfologia craniofacciale e sindrome delle apnee-ipopnee ostruttive nel sonno: un’analisi craniometrica comparativa [Craniofacial morphology and obstructive sleep apnoea-hypopnoea syndrome: a craniometric comparative analysis]. La radiologia medica. 2013;118(4):648–659. Italian. doi:10.1007/s11547-012-0904-9
41. Kawashima S, Niikuni N, Chia-hung L, et al. Cephalometric comparisons of craniofacial and upper airway structures in young children with obstructive sleep apnea syndrome. Ear, Nose and Throat J. 2000;79(7):499–502. doi:10.1177/014556130007900708
42. Abtahi S, Phuong A, Major PW, et al. Cranial base length in pediatric populations with sleep disordered breathing: a systematic review. Sleep Med Rev. 2018;39:164–173. doi:10.1016/j.smrv.2017.09.002
43. Ford EHR. Growth of the human cranial base. Am J Orthodontics. 1958;44(7):498–506. doi:10.1016/0002-9416(58)90082-4
44. Nash R, Possamai V, Manjaly J, et al. The management of obstructive sleep apnea in syndromic craniosynostosis. J Craniofacial Surgery. 2015;26(6):1914–1916. doi:10.1097/SCS.0000000000002097
45. Hans MG, Nelson S, Pracharktam N, et al. Subgrouping persons with snoring and/or apnea by using anthropometric and cephalometric measures. Sleep & Breathing = Schlaf & Atmung. 2001;5(2):79–91. doi:10.1055/s-2001-15800
46. Baik UB, Suzuki M, Ikeda K, et al. Relationship between cephalometric characteristics and obstructive sites in obstructive sleep apnea syndrome. Angle Orthodont. 2002;72(2):124–134. doi:10.1043/0003-3219(2002)072<0124:RBCCAO>2.0.CO;2
47. Ozdemir H, Altin R, Söğüt A, et al. Craniofacial differences according to AHI scores of children with obstructive sleep apnoea syndrome: cephalometric study in 39 patients. Pediatr Radiol. 2004;34(5):393–399. doi:10.1007/s00247-004-1168-x
48. Garg RK, Afifi AM, Garland CB, et al. Pediatric obstructive sleep apnea: consensus, controversy, and craniofacial considerations. Plastic and Reconstructive Surg. 2017;140(5):987–997. doi:10.1097/PRS.0000000000003752
49. Peltomäki T. The effect of mode of breathing on craniofacial growth—revisited. Eur J Orthodont. 2007;29(5):426–429. doi:10.1093/ejo/cjm055
50. Yuen HM, Chan KC-C, Chu WCW, et al. Craniofacial phenotyping by photogrammetry in Chinese prepubertal children with obstruct ive sleep apnea. Sleep. 2022;46(3):zsac289. doi:10.1093/sleep/zsac289
51. Shintani T, Asakura K, Kataura A. Evaluation of the role of adenotonsillar hypertrophy and facial morphology in children with obstructive sleep apnea. ORL. 2010;59(5):286–291. doi:10.1159/000276955
52. Pawłowska-Seredyńska K, Umławska W, Resler K, et al. Craniofacial proportions in children with adenoid or adenotonsillar hypertrophy are related to disease duration and nasopharyngeal obstruction. Int J Pediatr Otorhinolaryngol. 2020;132:109911. doi:10.1016/j.ijporl.2020.109911
53. Franco LP, Souki BQ, Cheib PL, et al. Are distinct etiologies of upper airway obstruction in mouth-breathing children associated with different cephalometric patterns? Int J Pediatr Otorhinolaryngol. 2015;79(2):223–228. doi:10.1016/j.ijporl.2014.12.013
54. Behlfelt K, Linder-Aronson S, McWilliam J, et al. Dentition in children with enlarged tonsils compared to control children. Eur J Orthod. 1989;11(4):416–429. doi:10.1093/oxfordjournals.ejo.a036014
55. Kawashima S, Peltomäki T, Laine J, et al. Cephalometric evaluation of facial types in preschool children without sleep-related breathing disorder. Int J Pediatr Otorhinolaryngol. 2002;63(2):119–127. doi:10.1016/S0165-5876(02)00003-4
56. Pirilä-Parkkinen K, Löppönen H, Nieminen P, et al. Cephalometric evaluation of children with nocturnal sleep-disordered breathing. Eur J Orthodont. 2010;32(6):662–671. doi:10.1093/ejo/cjp162
57. Kawashima S, Peltomäki T, Sakata H, et al. Craniofacial morphology in preschool children with sleep-related breathing disorder and hypertrophy of tonsils. Acta paediatrica. 2002;91(1):71–77. doi:10.1111/j.1651-2227.2002.tb01644.x
58. Duong-Quy S, Nguyen-Ngoc-Quynh L, Nguyen-Huu H. ‘Personalized medicine’: phenotyping pediatric obstructive sleep apnea. Curr Opin Pulm Med. 2024;30(6):9900. doi:10.1097/MCP.0000000000001119
 © 2024 The Author(s). This work is published and licensed by Dove Medical Press Limited. The
full terms of this license are available at https://www.dovepress.com/terms.php
and incorporate the Creative Commons Attribution
- Non Commercial (unported, 3.0) License.
By accessing the work you hereby accept the Terms. Non-commercial uses of the work are permitted
without any further permission from Dove Medical Press Limited, provided the work is properly
attributed. For permission for commercial use of this work, please see paragraphs 4.2 and 5 of our Terms.
© 2024 The Author(s). This work is published and licensed by Dove Medical Press Limited. The
full terms of this license are available at https://www.dovepress.com/terms.php
and incorporate the Creative Commons Attribution
- Non Commercial (unported, 3.0) License.
By accessing the work you hereby accept the Terms. Non-commercial uses of the work are permitted
without any further permission from Dove Medical Press Limited, provided the work is properly
attributed. For permission for commercial use of this work, please see paragraphs 4.2 and 5 of our Terms.
Recommended articles
A Prediction Nomogram for Severe Obstructive Sleep Apnea in Snoring Patients: A Retrospective Study
Teng G, Zhang R, Zhou J, Wang Y, Zhang N
Nature and Science of Sleep 2023, 15:231-243
Published Date: 17 April 2023
Early Recognition of Secondary Asthma Caused by Lower Respiratory Tract Infection in Children Based on Multi-Omics Signature: A Retrospective Cohort Study
Rao Z, Zhang S, Xu W, Huang P, Xiao X, Hu X
International Journal of General Medicine 2024, 17:6229-6241
Published Date: 14 December 2024
A Comparative Investigation on Clinical Characteristics in Pediatric Obstructive Sleep Apnea Based on Two Distinct Guidelines
Ji T, Long T, Li X, Xu Z, Zhao J, Wang G, Wang H, Li H, Zhang F, Zheng L, Wang S, Ni X
Nature and Science of Sleep 2025, 17:329-341
Published Date: 17 February 2025
Impact of Upper Airway Comorbidities and Tonsil/Adenoid Synergistic Effects on Pediatric OSA Severity
Feng Y, Cai W, Xie Q, Ming X, Yang X, Chen X
Nature and Science of Sleep 2025, 17:917-927
Published Date: 13 May 2025
Drug-Induced Sleep Endoscopy and Its Recent Clinical Applications in Combination with Other Procedures in Children: A Narrative Review
Xiao Z, Li X, Zhou L, Long X, Tian L, Li W
Nature and Science of Sleep 2025, 17:1067-1077
Published Date: 24 May 2025