")
Back to Journals » Nature and Science of Sleep » Volume 17
Development and Evaluation of a Hypertension Prediction Model for Community-Based Screening of Sleep-Disordered Breathing
Authors Feng T, Shan G, Hu Y, He H, Pei G, Zhou R, Ou Q
Received 13 September 2024
Accepted for publication 13 January 2025
Published 25 January 2025 Volume 2025:17 Pages 167—182
DOI https://doi.org/10.2147/NSS.S492796
Checked for plagiarism Yes
Review by Single anonymous peer review
Peer reviewer comments 2
Editor who approved publication: Dr Sarah L Appleton
Tong Feng,1 Guangliang Shan,2 Yaoda Hu,2 Huijing He,2 Guo Pei,1 Ruohan Zhou,1 Qiong Ou1
1Sleep Center, Department of Geriatric Respiratory, Guangdong Provincial People’s Hospital (Guangdong Academy of Medical Sciences), Southern Medical University, Guangzhou, People’s Republic of China; 2Department of Epidemiology and Statistics, Institute of Basic Medical Sciences, School of Basic Medicine, Chinese Academy of Medical Sciences, Peking Union Medical College, Beijing, People’s Republic of China
Correspondence: Qiong Ou, Sleep Center, Department of Geriatric Respiratory, Guangdong Provincial People’s Hospital (Guangdong Academy of Medical Sciences), Southern Medical University, No. 106 Zhongshan Road, Yuexiu District, Guangzhou City, Guangdong Province, People’s Republic of China, Tel +86 13609717251, Email [email protected]
Purpose: Approximately 30% of patients with sleep-disordered breathing (SDB) present with masked hypertension, primarily characterized by elevated nighttime blood pressure. This study aimed to develop a hypertension prediction model tailored for primary care physicians, utilizing simple, readily available predictors derived from type IV sleep monitoring devices.
Patients and Methods: Participants were recruited from communities in Guangdong Province, China, between April and May 2021. Data collection included demographic information, clinical indicators, and results from type IV sleep monitors, which recorded oxygen desaturation index (ODI), average nocturnal oxygen saturation (MeanSpO2), and lowest recorded oxygen saturation (MinSpO2). Hypertension was diagnosed using blood pressure monitoring or self-reported antihypertensive medication use. A nomogram was constructed using multivariate logistic regression after Least Absolute Shrinkage and Selection Operator (LASSO) regression identified six predictors: waist circumference, age, ODI, diabetes status, family history of hypertension, and apnea. Model performance was evaluated using area under the curve (AUC), calibration plots, and decision curve analysis (DCA).
Results: The model, developed in a cohort of 680 participants and validated in 401 participants, achieved an AUC of 0.775 (95% CI: 0.730– 0.820) in validation set. Calibration plots demonstrated excellent agreement between predictions and outcomes, while DCA confirmed significant clinical utility.
Conclusion: This hypertension prediction model leverages easily accessible indicators, including oximetry data from type IV sleep monitors, enabling effective screening during community-based SDB assessments. It provides a cost-effective and practical tool for prioritizing early intervention and management strategies in both primary care and clinical settings.
Keywords: sleep-disordered breathing, prediction model, hypertension, risk predictors
Introduction
Partial or complete blockage of the upper airway during sleep, known as sleep-disordered breathing (SDB), results in breathing difficulties such as apnea or hypopnea. SDB is a pressing public health issue that significantly impacts a large portion of the adult population. In fact, it affects up to 50% of adult males and 23% of adult females.1 If left untreated for an extended period of time, SDB significantly raises the likelihood of developing cardiovascular diseases (CVD) such as hypertension, heart failure, coronary heart disease, arrhythmias, and stroke, ultimately leading to a higher risk of mortality.2,3 50% of patients with SDB had hypertension,4 and 70% of patients with refractory hypertension had SDB combined.5 Despite the clear connection between SDB and hypertension, it is estimated that a staggering 80% of middle-aged men and women with SDB remain undiagnosed,6 which can be attributed in part to inadequate screening methods and the inconvenience associated with polysomnography (PSG).
Individuals with SDB often experience a noticeable decrease in their oxygen saturation levels overnight. This decline in oxygen saturation while sleeping is a distinguishing feature of this condition. The recurring episodes of nocturnal hypoxemia associated with SDB lead to an increase in sympathetic nervous activity. This heightened activity of the sympathetic nervous system greatly contributes to the development and progression of hypertension, which can further lead to various health issues and associated morbidity.7 The measurement and evaluation of nocturnal hypoxemia can be effortlessly obtained from a type IV sleep monitor or consumer-grade sleep monitoring devices. These devices are particularly useful for screening SDB in the general population residing in the community.8 Moreover, they have the potential to serve as predictors for assessing the prevalent hypertension.9
In patients with SDB, 30% have been found to have masked hypertension, primarily characterized by elevated nighttime blood pressure.10 This subset of patients presents with hypertension that is challenging to detect. Timely screening for SDB and accurately identifying hypertension at an early stage are of utmost importance in reducing the negative health consequences associated with it. Recently, studies have explored risk prediction and management strategies for hypertension and related diseases, providing powerful tools and data support for early intervention and personalized management of high-risk populations.11–13 Current predictive tools for SDB-associated hypertension have limitations, primarily due to their development based on patients referred to sleep clinics.14,15 Previous research has predominantly focused on individuals with moderate to severe SDB or those exhibiting specific SDB-related symptoms. In contrast, our study draws from a broader population, including mostly asymptomatic individuals or those with undiagnosed SDB symptoms, without stratification by SDB severity. Consequently, our findings are more applicable to the general community. Models like Zeng’s, which rely on costly and complex PSG data,15 and Shi’s, which involve 18 variables, present challenges in terms of practicality and feasibility for routine use.14 Moreover, previous studies have lacked external validation, which is essential for accurately assessing the precision of predictive models.
In this study, our main objective was to develop a predictive model utilizing multivariate logistic regression. This model would rely on a combination of oximetry-derived features and demographic information, enabling the distinction of hypertension risk. To ensure its practicality, efficiency, and cost-effectiveness in clinical settings, this model will exclude biological and sleep stage features. Primary care physicians can utilize simple and readily available predictors when employing type IV sleep monitoring devices to screen for SDB, thus assessing patients’ prevalent hypertension.
Materials and Methods
Patients and Study Design
Participants for this study were recruited from the “Guangdong Cohort”, a subpopulation of the national “Chinese Academy of Medical Sciences Lifespan Cohort Study and Informatization Initiative”, conducted from April 9 to May 18, 2021. This cohort was established using a multi-stage, stratified cluster sampling design to select a representative population. In the first stage, Guangdong Province was selected, with Shantou City (Chenghai District, Jinping District, and Nan’ao County) and Meizhou City (Meijiang District and Jiaoling County) chosen as sampling regions. In the second stage, districts within cities and villages within counties were selected. Lastly, with the support of local governments, residents of the selected villages and communities were invited to participate in the study.
Physical assessments were conducted at local community service centers or hospitals in the selected regions, specifically at the following locations:
Chenghai District, Shantou City: Chenghai Party School
Jinping District, Shantou City: Jinhua Street Community Service Center
Nan’ao County, Shantou City: Houzhai Chengxi Village Health Station
Meijiang District, Meizhou City: Jiangnan Community Health Service Center
Jiaoling County, Meizhou City: Jiaoling County Traditional Chinese Medicine Hospital
The research was based on the framework of the China National Health Survey.16
To be eligible for inclusion in the study, participants needed to meet specific criteria. Firstly, they had to be at least 18 years old. Secondly, participants were required to have an oxygen desaturation index (ODI) of seven or more times per hour, indicating potential SDB. Lastly, individuals who had not received any treatment related to SDB in the past were also included. Exclusion criteria consisted of incomplete baseline data, patients with common causes of secondary hypertension other than SDB such as nephritis, renal failure, and hyperthyroidism, and individuals who regularly used sedative hypnotic drugs. The process of participant recruitment and enrollment in the study is depicted in Figure 1 of the research report.
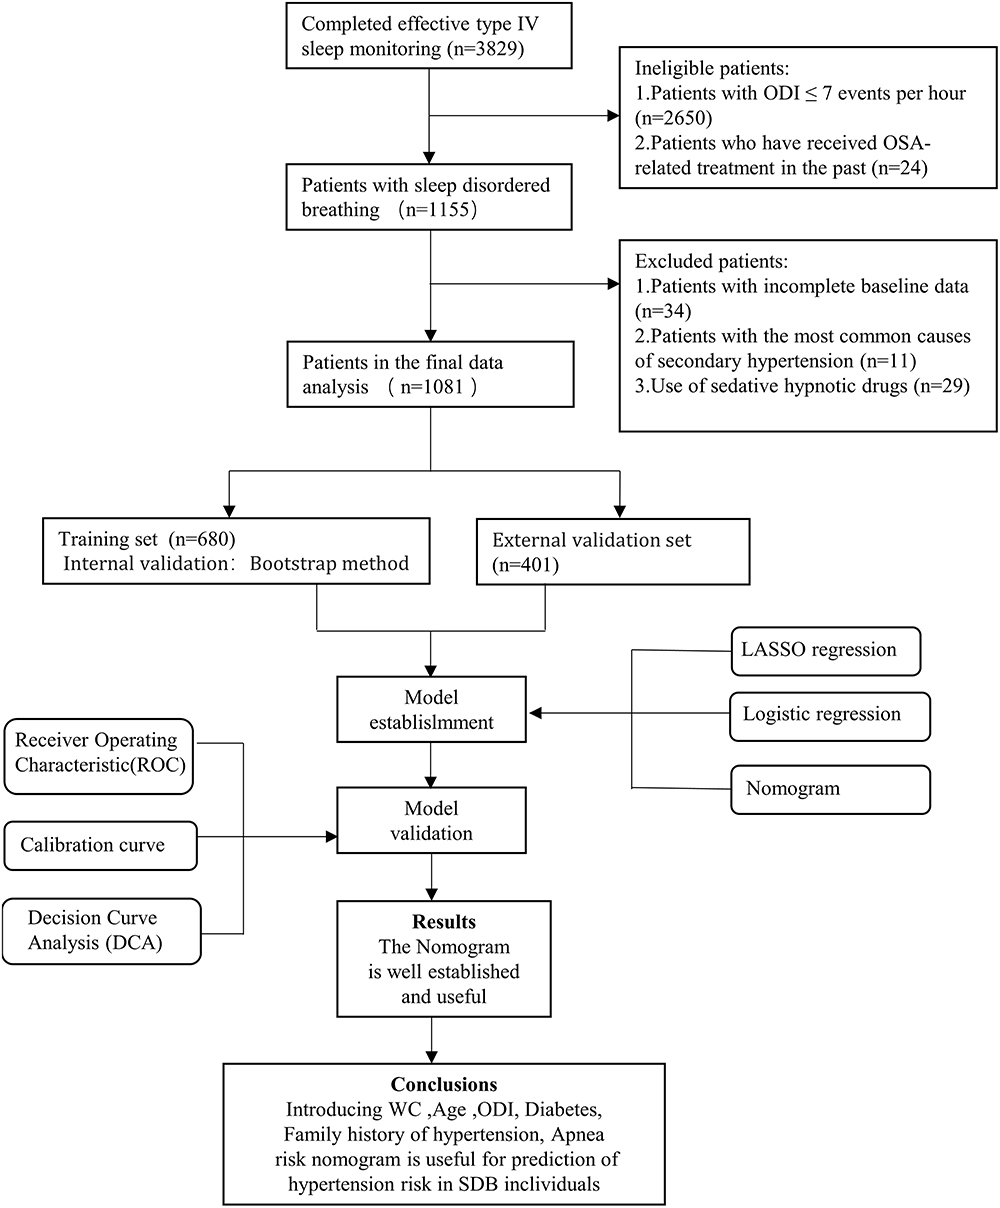 |
Figure 1 Flowchart of participant selection. |
Hypertension was diagnosed based on systolic blood pressure ≥ 140 mmHg, diastolic blood pressure ≥ 90 mmHg or self-reported use of antihypertensive medication.
In this study, a reliable type IV wearable sleep-monitoring device (Figure S1 and S2), developed by Chengdu Cloud Care Healthcare Co. Ltd. in Chengdu, China, was employed to monitor the sleep patterns of participants. Various parameters were recorded during the monitoring process, including 3% ODI, MeanSpO2, MinSpO2, and T90.
The device was evaluated and validated against PSG at the Sleep Center of Guangdong Provincial People’s Hospital.17 A total of 196 participants underwent overnight PSG and WISM monitoring to assess the sensitivity and specificity of WISM in detecting OSA. Using an apnea-hypopnea index (AHI) threshold of ≥5 for diagnosing SDB, the type IV WISM demonstrated a sensitivity of 93%, a specificity of 77%, and an area under the curve (AUC) of 0.95. When the AHI threshold was increased to ≥15, the sensitivity was 92%, the specificity was 89%, and the AUC remained 0.95.
Additionally, 305 participants from Chenghai and Jinping Districts of Shantou City, who were screened with the type IV device, were selected for further monitoring with a type III home sleep apnea test (HSAT) device.18 The comparison of SDB prevalence and diagnostic consistency between the type IV device and the HSAT confirmed the effectiveness of the type IV device for SDB screening in a healthy community population. In this cohort of 305 participants, the ODI measured by the type IV device strongly correlated with the AHI measured by HSAT (R²=0.504, P<0.001). A Bland-Altman analysis revealed that approximately 93% (284/305) of the data points fell within the 95% limits of agreement between the ODI measured by the type IV device and the AHI measured by HSAT.
When the ODI reached 7.0 times/hour, the sensitivity, specificity, and accuracy of OSA with an AHI ≥ 5 times/hour were 86%, 91%, and 95%, respectively. Therefore, the ODI value of ≥ 7.0 events/h was considered significant (Figure S1). The specific information of this device can be found in the supplementary materials.
The sample size estimation was based on the prevalence of hypertension in the Chinese SDB population and the principle of 10 outcome events per variable.19 With a hypertension prevalence of 40% in the study population and 20 predictors, the required sample size was calculated to be 500 participants.
The training set comprised 680 participants surveyed in Shantou, and its main objective was to develop a nomogram that could effectively distinguish hypertension in patients with SDB. On the other hand, the external validation set consisted of 401 participants surveyed in Meizhou, and its purpose was to assess and validate the diagnostic performance of the developed nomogram.
The study received ethical approval from the Ethics Committee of Guangdong Provincial People’s Hospital (GDREC2020221H), ensuring compliance with ethical standards. Additionally, informed consent was sought and obtained from all individuals participating in the study, guaranteeing their voluntary agreement to take part in the research.
Data Collection
Based on literature support, research objectives, and data availability, 20 variables were selected for the study, including (1) demographic characteristics such as age, gender, body mass index(BMI), neck circumference, and waist circumference (WC); (2) lifestyle behaviors, namely drinking, smoking, and adherence to a high-salt diet; and (3) history and indicators associated with SDB, including family history of hypertension, heart disease, diabetes, Epworth Sleepiness Scale results, snoring occurrence, apnea episodes, dryness in the mouth upon waking, morning headaches, ODI, average nocturnal oxygen saturation (MeanSpO2), lowest recorded oxygen saturation during sleep (MinSpO2), and the duration of time spent with oxygen saturation below 90% (T90). The detailed information of the questionnaire and physical examination can be found in the supplementary materials.
Statistical Analysis
For the purpose of constructing and validating the nomogram, the subjects were split into a training set and a validation set by region. To address missing data in the study, we used the k-nearest neighbor (kNN) imputation method. This approach estimates missing values based on the observed values of the k nearest neighbors in the dataset, as determined by a distance metric (eg, Euclidean distance) calculated across all relevant variables. The kNN method was chosen because it preserves the underlying relationships between variables and avoids bias that could arise from simpler imputation methods, such as mean substitution. The number of neighbors (k) was set to 5, as determined through cross-validation to balance imputation accuracy and computational efficiency. This method was applied only to variables with missing data, ensuring that the imputed values were consistent with the observed distribution of the data. The comparability of these two sets was evaluated subsequently. The Wilcoxon rank-sum test was used to analyze continuous variables, which were described as median (25th percentile, 75th percentile). Categorical data, on the other hand, were presented as numbers (percentage) and analyzed using the chi-square test for comparisons.
To prevent collinearity issues with the inclusion covariates, the LASSO method was employed in the training set to select the most optimal predictive features. LASSO regression was employed to identify the most significant predictors of hypertension among patients with SDB. This technique applies a penalty to the regression coefficients, shrinking less relevant variables to zero and thus selecting only those with the strongest predictive power. Following this, multivariate logistic regression analysis was conducted to develop the nomograms. The receiver operating characteristic (ROC) curve was plotted, and the AUC and calibration curve were used to assess the model’s discrimination and calibration. Internal validation was performed using the 1000 bootstrap resamples method.20 External validation was performed using data from an independent cohort (the validation group) recruited from Meizhou City. Decision curve analysis (DCA) was employed to evaluate the clinical utility of the model.21 A comparison of AUC values was carried out using the DeLong test.22 All statistical analyses were performed using R software version 4.2. A p-value less than 0.05, considering it as statistically significant, was used as the threshold in all analyses.
Results
Characteristics of Subjects
Among the individuals involved in the study, the overall prevalence of hypertension was recorded at 40.4%, with a total of 437 out of 1081 participants affected. Further analysis of the data indicated that in the training set, 272 out of 680 participants (40%) had hypertension, while in the validation set, 165 out of 401 participants (41%) exhibited the condition. A comprehensive overview of the participants’ demographic and clinical characteristics can be found in Table 1. Notably, no significant disparities were observed among the participants in terms of heart disease, smoking, drinking habits, high-salt diet, apnea, headache/dizziness, dry mouth, hypertension, MeanSpO2, age, WC, neck circumference, BMI, MinSpO2, T90, or the prevalence of hypertension. Most of the research factors related to the training set and validation set are comparable.
 |
Table 1 Baseline Characteristics of the Training Set and Validation Set |
Construction of Nomogram
Based on literature support, research objectives, and data availability, 20 variables were selected and included in the LASSO regression model for feature selection (Figure 2). The λ, determined through 10-fold cross-validation, was used as the final model selection criterion, resulting in the identification of six optimal variables (waist circumference, age, ODI, diabetes status, family history of hypertension, and the presence of sleep apnea). A regression equation was then constructed based on the results of the multivariate logistic regression model analysis, and a nomogram was established to predict hypertension risk in the SDB population (Table 2, Figure 3).
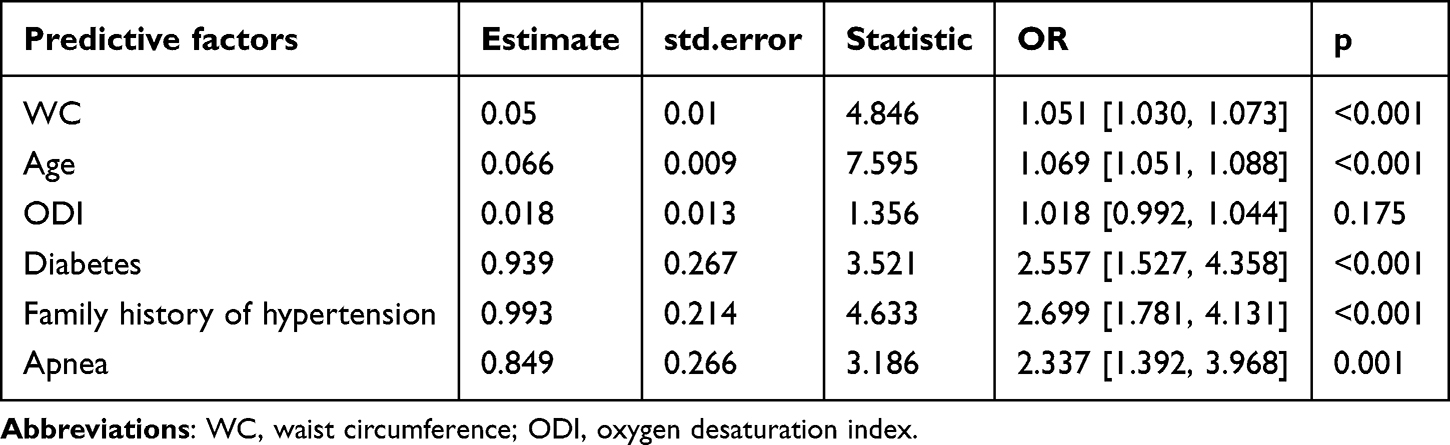 |
Table 2 Multivariable Logistic Regression Analysis Based on the 6 Variables Selected by the LASSO Regression Technique |
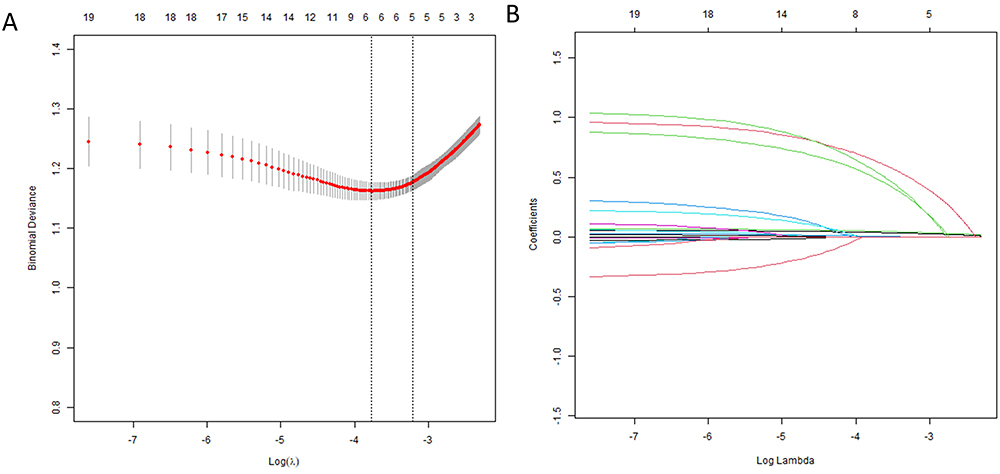 |
Figure 2 Screening of feature variables using the LASSO regression model. (A) shows the cross-validation curve for the LASSO regression, illustrating the selection process for the optimal penalty coefficient λ. The left dashed line represents the λ with the minimum deviation (λmin), while the right dashed line indicates the λmin plus one standard error, which corresponds to the optimal value for the model. (B) depicts the LASSO coefficient path for the 20 risk factors. Abbreviations: LASSO, least absolute shrinkage and selection operator; SE, standard error. |
 |
Figure 3 Nomogram prediction model for prediction of hypertension. |
Assessment of Nomogram in the Training Set and Validation Set
Internal validation of the training set was performed using the Bootstrap method with 1000 resampling iterations applied to the modeling group. The resulting AUC was 0.763 (95% confidence interval [CI]: 0.728–0.798), demonstrating good model discrimination. Similarly, for the validation set, internal validation with 1000 Bootstrap resampling iterations produced an AUC of 0.775 (95% CI: 0.730–0.820), also indicating good model discrimination, as illustrated in Figure 4.
 |
Figure 4 ROC curves of the nomogram to predict hypertension (A) training set. (B) the external validation set. The 95% confidence intervals for the AUC values are represented by the dotted vertical lines. Abbreviations: ROC, Receiver Operating Characteristic; AUC, area under the curve. |
In the training set, the alignment between the predicted model curve and the reference line suggests a high level of calibration accuracy. In the validation set, the close alignment between the predicted model curve and the reference line indicates good calibration, as shown in Figure 5.
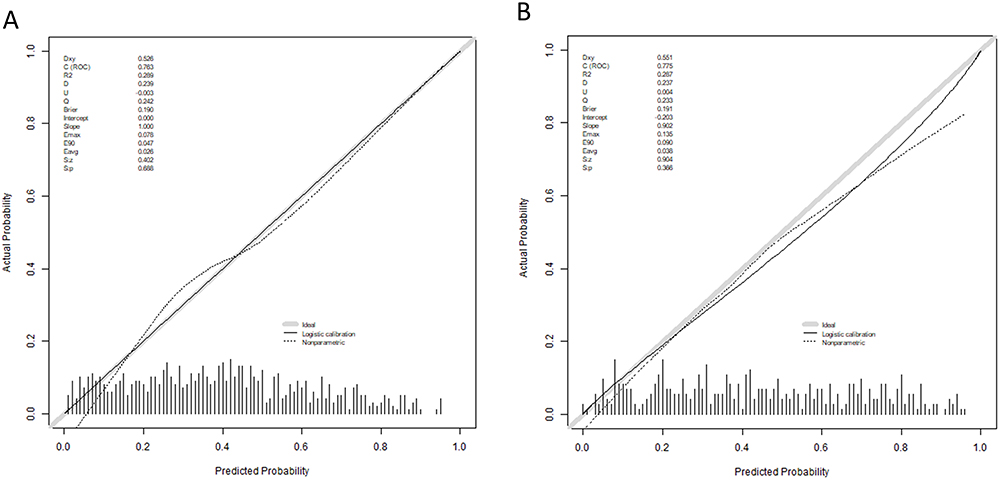 |
Figure 5 Calibration plots of the nomogram to predict the hypertension. (A) Training set. (B) External validation set. |
Clinical Utility of Nomogram
In the DCA curve, the “All” line assumes that all subjects undergo the intervention for hypertension risk, resulting in a net benefit represented by a negatively sloped diagonal line. The “None” line assumes that no subjects receive the intervention, yielding a net benefit of 0. The use of the screening model demonstrates clinical benefit for subjects within a threshold probability range of 9% to 90%. (Figure 6A). These findings were confirmed in the validation set, where the threshold probability range was 9% to 74% (Figure 6B). Additionally, we employed clinical impact curves based on the results of the DCA to assess the practicality of the nomograms. When the threshold probability exceeds 60%, the prediction model identifies individuals at high risk of hypertension with a strong match to those who are actually hypertensive in both the training sets (Figure 7A) and the validation sets (Figure 7B).
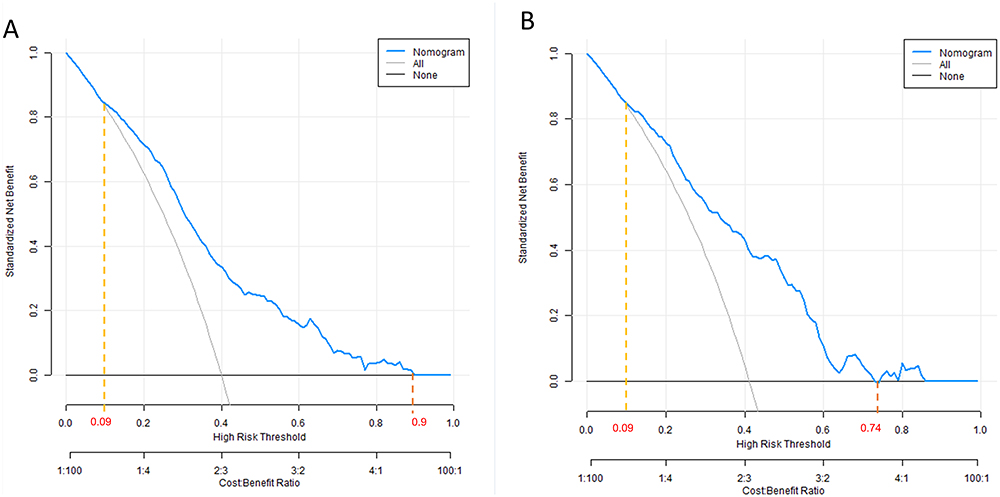 |
Figure 6 DCA of the nomogram. (A) Training set. (B) External validation set. Abbreviation: DCA, Decision curve analysis. |
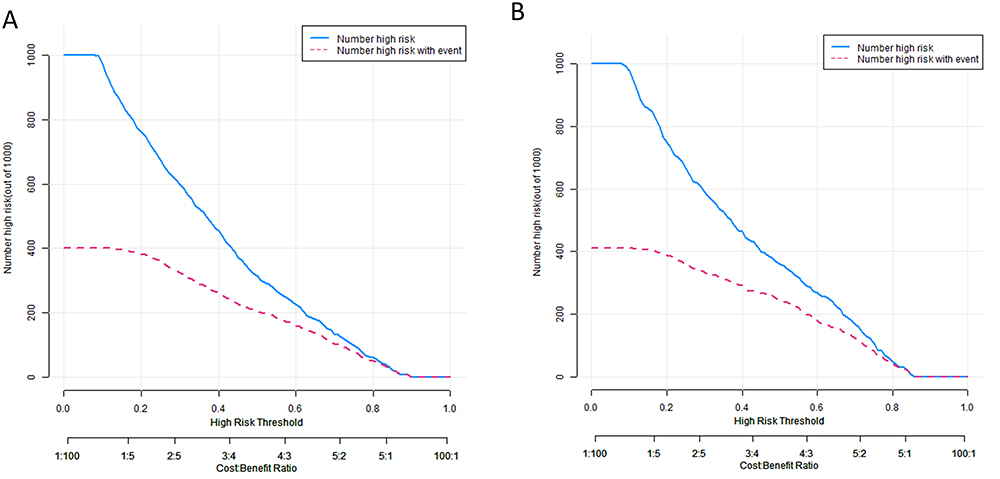 |
Figure 7 The clinical impact curves of the nomogram. (A) Training set. (B) External validation set. |
Website of Nomogram
Based on the developed model, an interactive dynamic web-based nomogram was created to facilitate user engagement and allow for real-time predictions and assessments. This online tool enables healthcare professionals and researchers to input individual patient data, instantly generating personalized risk assessments and visualizations, thereby enhancing the practical application of the model in clinical settings. The nomogram’s accessibility and user-friendly interface make it a valuable resource for both community screenings and clinical decision-making, as depicted in Figure 8.
 |
Figure 8 An online dynamic nomogram created using R language. (https://fengtong.shinyapps.io/dynnomapp/). |
Model Comparison
The nomogram was observed to display a significantly greater level of precision when it came to predicting hypertension in patients with SDB, as compared to the individual factors that were incorporated in the nomogram (P < 0.01). This can be clearly seen in Figure 9A, Tables 3, and 4. Furthermore, the results of DCA indicated that the nomogram offered greater overall benefits in terms of accurately identifying hypertension, in comparison to relying solely on individual factors (Figure 9B).
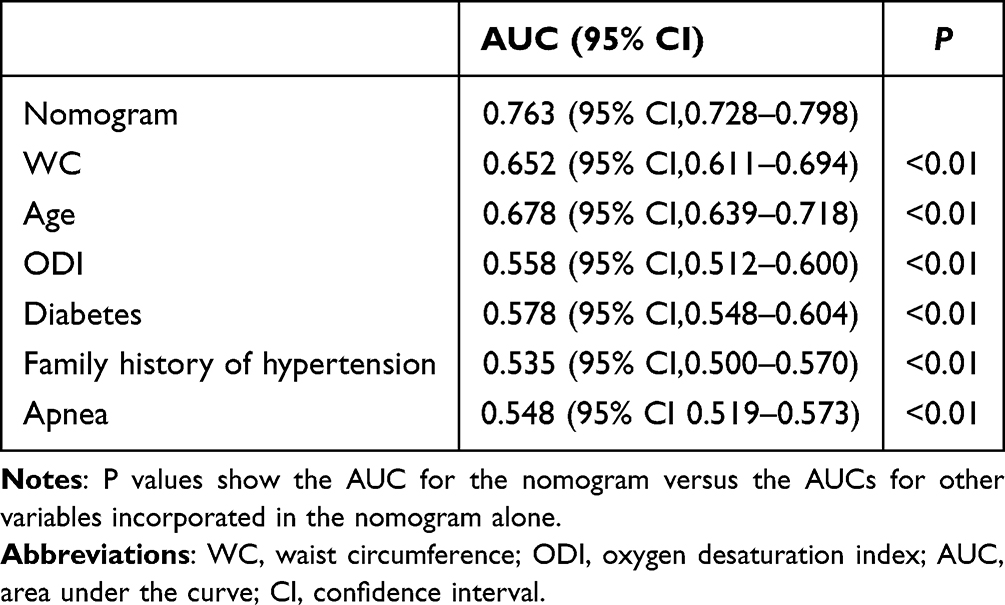 |
Table 3 Models Comparison in the Whole Study, Receiver Operator Characteristic Curves of the Models are Presented to Compare Their Discriminatory Accuracy for Predicting Hypertension |
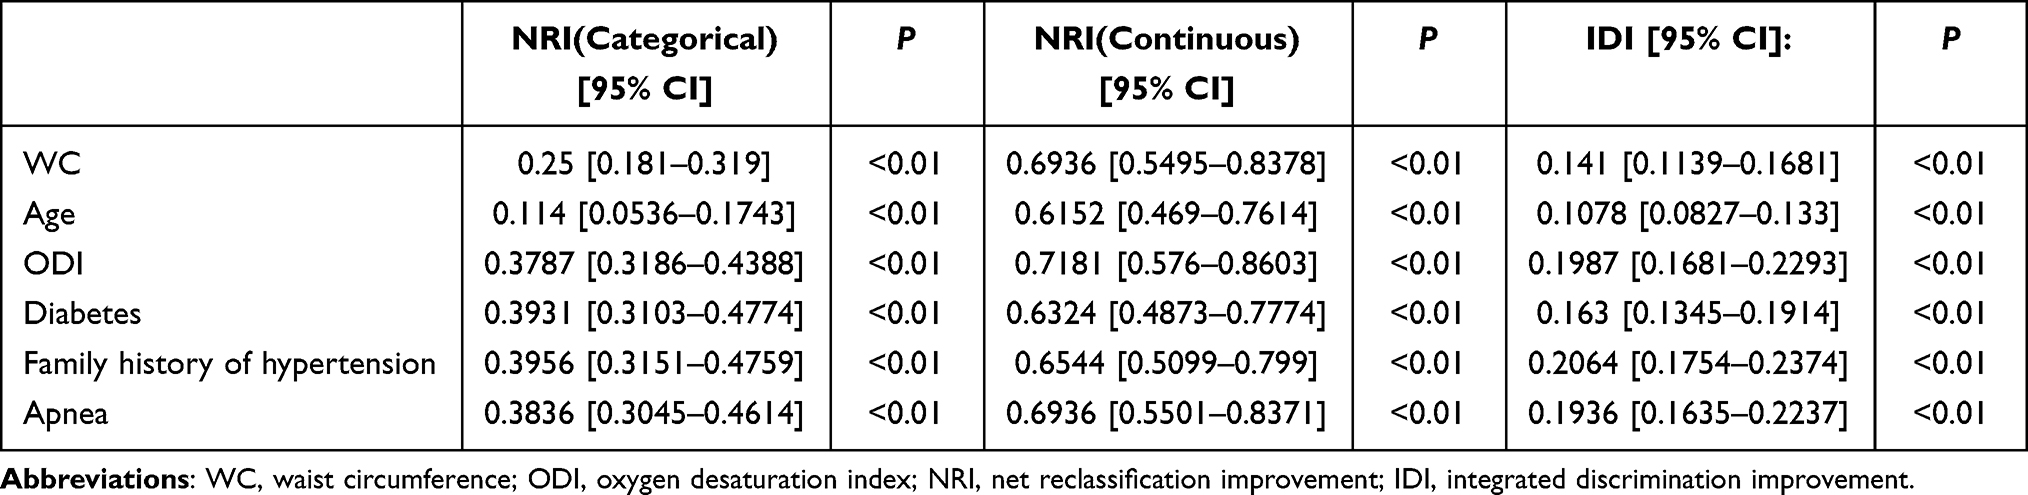 |
Table 4 Models Comparison in the Whole Study, Net Reclassification Improvement and Integrated Discrimination Improvement of the Models are Presented to Compare Their Discriminatory Accuracy for Predicting Hypertension |
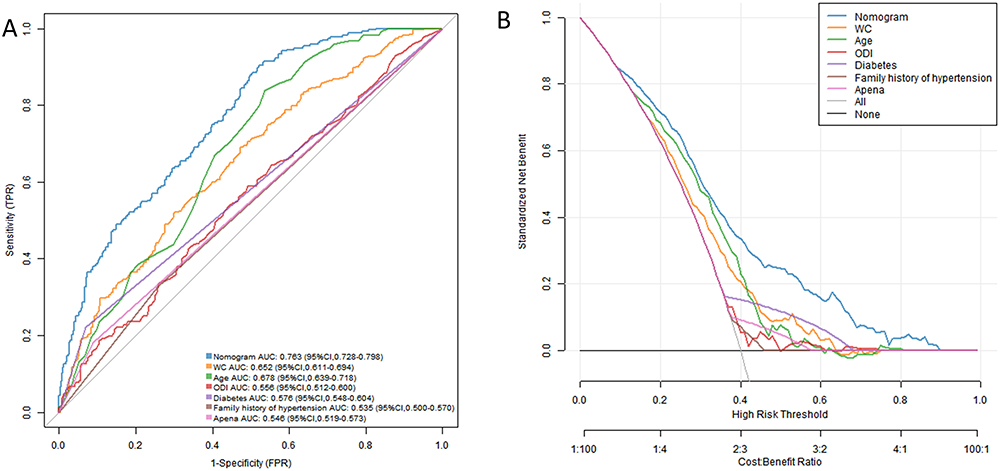 |
Figure 9 Models comparison in the whole study. (A) ROC curve analyses were performed to compare the discriminatory accuracy of the nomogram with that of the individual variables included in the nomogram. (B) DCA analyses were conducted to compare the net benefit of the nomogram with that of the individual variables included in the nomogram. Abbreviations: ROC, Receiver operator characteristic curves; DCA, Decision curve; AUC, area under the curve. |
Discussion
This study developed and validated a convenient and practical nomogram to detect the risk of hypertension in patients with SDB. Compared to traditional nomograms, the online nomogram transforms data into easily understandable and analyzable charts, helping users to better interpret the data. The nomogram in this study includes several simple and easily accessible indicators, which can be used to predict hypertension through an online interactive platform during community SDB screenings. This tool aids in identifying high-risk hypertensive patients and provides strong evidence for clinicians to implement early interventions, thereby improving patient outcomes.
Prior research has indicated that the occurrence of hypertension in individuals with SDB ranges from 36% to 68%, as demonstrated in Table 5.23–27 In contrast, our own investigation reveals a prevalence rate of 40% for hypertension in the SDB population. It is worth noting that the aforementioned survey was conducted by various organizations, at different points in time, and across diverse age groups, potentially contributing to incongruities and variations in the findings. Numerous cross-sectional epidemiological studies have unequivocally revealed a distinct and undeniable link between SDB and hypertension. The Wisconsin Sleep Cohort study conducted a thorough investigation and revealed an intriguing finding. It discovered that even a minuscule elevation in the AHI at the beginning of the study was significantly linked to a tripling in the likelihood of developing hypertension throughout the subsequent four-year monitoring period.28 Involving a substantial sample size of more than 6000 participants, the study found a strong correlation between high AHI and T90 with an elevated risk of developing hypertension. This association followed a dose-response pattern, indicating that the odds of developing hypertension increased proportionally with the severity of AHI and T90.29 Several studies have considered significant confounding factors, including obesity, age, and gender. The association between SDB and hypertension is stronger in younger and less obese participants, as observed in population-based studies.24 A research conducted by Metso uncovered that individuals with refractory hypertension face a significantly higher risk of suffering from SDB compared to those with non-refractory hypertension, even after factoring in age, gender, and comorbidities. The study indicates that the risk of SDB in patients with refractory hypertension is 2.46 times greater (with a 95% confidence interval of 1.03–5.88) than in those with non-refractory hypertension.30 It is plausible to consider that a significant portion of what is commonly classified as essential hypertension could potentially be attributed to hypertension that is secondary to undiagnosed and untreated SDB. The European Hypertension Guidelines have placed even greater emphasis on the significant impact of SDB as a key factor influencing elevated blood pressure levels.31 There is also support from reports that demonstrate improved hypertension management following the correction of SDB.32 Early and timely screening for SDB and accurate identification of hypertension related to SDB are vital in reducing the detrimental health effects associated with it.
 |
Table 5 Prevalence of Hypertension in Sleep Disordered Breathing Population |
In China, several risk prediction models for SDB related hypertension have been established. Zeng, for instance, developed and validated a clinical nomogram using a hospital population to predict hypertension occurrence in SDB patients. This study identified body mass index, REM-AHI, REM-MinSpO2, and T90 as predictors of SDB associated hypertension.15 The model demonstrated satisfactory discrimination with an AUC of 0.817. However, PSG is both costly and time-consuming. The scarcity of PSG devices can pose limitations, and data collection (eg, REM-AHI, REM-MinSpO2) may not be routinely conducted in community hospitals. Consequently, utilizing this tool for hypertension screening, particularly for primary care physicians, might be inefficient. In hospital settings, it is common to observe patients who experience moderate-to-severe SDB or display at least one symptom associated with SDB. This select population may introduce selection bias, as they seek medical attention from sleep medicine centers for various reasons, such as suspected sleep-disordered breathing by clinicians or diagnostic check-ups. On the other hand, our sample was obtained from the overall population, encompassing individuals who displayed no symptoms or experienced symptoms that went unnoticed. Additionally, the severity of SDB was not specifically categorized in our study. As a result, our findings are more relevant and can be more readily applied to community-based general populations. In another study, Shi developed a prediction model for SDB-related hypertension using machine learning techniques.14 However, the model contains 18 variables, which reduces its practicability. Our model was straightforward and uncomplicated to compute. In addition, the common limitation of these two studies is that no external validation was performed. Therefore, this study may be the first nomogram of hypertension prediction in community SDB population in China through a comprehensive assessment and validation process.
The results from the LASSO indicated that WC, age, ODI, history of diabetes, family history of hypertension, and apnea were ere identified as significant independent risk factors for hypertension associated with SDB. These findings are consistent with prior studies. In our previous research within the police force in southern China, we observed that there exists a direct correlation between the age of patients and the prevalence of this condition.33 Furthermore, Ruzena et al reported that ODI was a superior predictor of hypertension when compared to the AHI.33 ODI provides a reliable measure of intermittent hypoxemia during sleep. Repeated episodes of intermittent hypoxia in SDB patients during sleep can result in a prolonged activation of the sympathetic nervous system. This activation subsequently triggers the renin-angiotensin-aldosterone system, which ultimately leads to the retention of water and sodium. As a result, hypertension is exacerbated.34 Furthermore, it has been demonstrated that intermittent hypoxia-reoxygenation that is linked to obstructive respiration can cause systemic inflammation and oxidative stress. Consequently, this can result in endothelial dysfunction, inflammation within the vascular wall, and the subsequent development of atherosclerosis.35 Chronic intermittent hypoxemia may further impair the diurnal blood pressure control by affecting the vascular endothelium (Figure 10). Evidence from a rat model has established a clear and causal connection between intermittent hypoxemia during sleep and the development of systemic hypertension.36
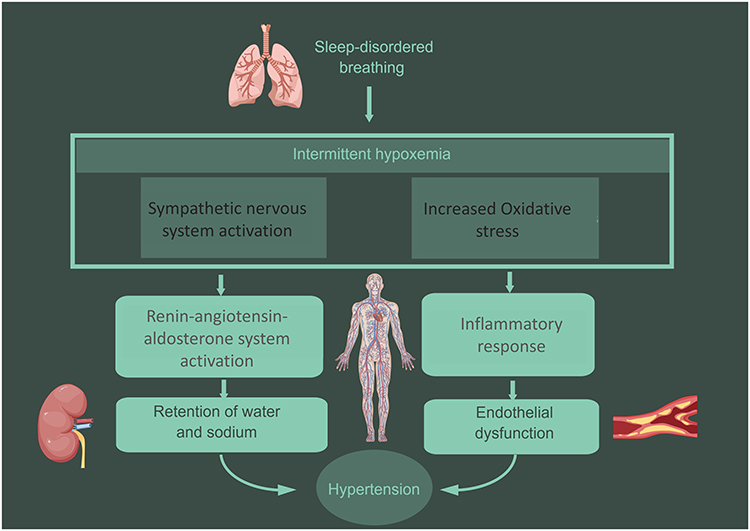 |
Figure 10 Pathophysiological consequence of sleep-disordered breathing and hypertension. |
To the best of our understanding, this research introduces the inaugural clinical nomogram model designed to forecast the likelihood of hypertension in a community-based population. The model incorporates demographic data and blood oxygen parameters, providing a more accurate and applicable alternative to traditional subjective questionnaires. Importantly, DCA demonstrated that the model had superior predictive accuracy within a threshold probability range of 9–90% for hypertension in SDB patients. This particular model has the potential to assist in the prompt clinical detection of patients with SDB who are at a heightened risk of hypertension. The proposed hypertension prediction model has significant potential for application in both community-based screenings and clinical settings. By utilizing readily available demographic and oximetry-derived data from type IV sleep monitoring devices, the model provides an accessible tool for primary healthcare providers to identify individuals at high risk of hypertension during sleep-disordered breathing (SDB) screenings. This enables early detection and prioritization of interventions, such as advanced diagnostics or treatment strategies like continuous positive airway pressure (CPAP) therapy. Additionally, the model’s integration into an online dynamic nomogram (accessible at https://fengtong.shinyapps.io/dynnomapp/) allows for real-time, individualized risk assessment, enhancing its practicality in diverse healthcare environments. This application is particularly valuable in optimizing resource allocation and improving health outcomes in resource-limited settings.
While the predictive model demonstrated robust performance in both the internal and external validation cohorts, certain limitations must be acknowledged. First, the study population was derived exclusively from communities in Guangdong Province, China, and primarily consisted of individuals of Chinese descent. As a result, the generalizability of the model to populations with different ethnic, geographic, or socioeconomic backgrounds may be limited. Future studies should conduct multicenter external validation in diverse populations to assess the model’s broader applicability.
Second, although the model incorporates readily available demographic and oximetry-derived predictors, the potential impact of unmeasured confounders cannot be ruled out. Factors such as physical activity levels, dietary habits, or psychosocial stress, which were not included in this study, may also influence hypertension risk in patients with SDB. The absence of these variables may introduce residual confounding, which could affect the precision of the model’s predictions. Addressing these gaps in future research could further enhance the model’s robustness and predictive accuracy. Despite these limitations, the model offers a practical and cost-effective approach to hypertension risk stratification in community settings, aligning well with the study’s objectives and contributing meaningfully to early detection and intervention efforts.
To further enhance the model’s applicability and robustness, future research should focus on conducting multicenter validation studies in diverse populations with varying ethnic, geographic, and socioeconomic backgrounds. Additionally, the incorporation of other potential predictors, such as physical activity levels, dietary patterns, or psychosocial stress, could refine the model and improve its predictive accuracy. These efforts will help to ensure the model’s practical value and reliability in real-world settings, ultimately contributing to improved public health outcomes.
Conclusion
This research, utilizing six basic indicators, incorporates the readily available ODI data from a type IV sleep monitor or consumer-grade sleep monitoring devices. It offers a practical approach to identifying hypertensive patients at high risk during community SDB screenings. The nomogram created can be utilized as a valuable resource for both community screenings and clinical settings, assisting in determining treatment priorities.
Data Sharing Statement
Data are available from the authors upon reasonable request. The authors may be contacted at [email protected].
Ethics Approval and Consent to Participate
This study was approved by the Ethics Committee of Guangdong Provincial People’s Hospital (GDREC2020221H). All participants provided informed consent before enrollment. The study was conducted in accordance with the principles outlined in the Declaration of Helsinki.
Funding
This research was supported by the National Natural Science Foundation of China (Grant No. 82170098) to Qiong Ou and CAMS Innovation Fund for Medical Sciences (CIFMS, Grant No. 2020-I2M-2-009) to Guangliang Shan.
Disclosure
The authors declare no conflict of interest.
References
1. Heinzer R, Vat S, Marques-Vidal P, et al. Prevalence of sleep-disordered breathing in the general population: the HypnoLaus study. Lancet Respir Med. 2015;3(4):310–318. doi:10.1016/S2213-2600(15)00043-0
2. Marin JM, Carrizo SJ, Vicente E, Agusti AG. Long-term cardiovascular outcomes in men with obstructive sleep apnoea-hypopnoea with or without treatment with continuous positive airway pressure: an observational study. Lancet. 2005;365(9464):1046–1053. doi:10.1016/S0140-6736(05)71141-7
3. Cowie MR, Linz D, Redline S, Somers VK, Simonds AK. Sleep disordered breathing and cardiovascular disease: JACC state-of-the-art review. J Am Coll Cardiol. 2021;78(6):608–624. doi:10.1016/j.jacc.2021.05.048
4. Hoshide S, Kario K, Chia YC, et al. Characteristics of hypertension in obstructive sleep apnea: an Asian experience. J Clin Hypertens. 2021;23(3):489–495. doi:10.1111/jch.14184
5. Yeghiazarians Y, Jneid H, Tietjens JR, et al. Obstructive sleep apnea and cardiovascular disease: a scientific statement from the American heart association. Circulation. 2021;144(3):e56–e67. doi:10.1161/CIR.0000000000000988
6. Young T, Evans L, Finn L, Palta M. Estimation of the clinically diagnosed proportion of sleep apnea syndrome in middle-aged men and women. Sleep. 1997;20(9):705–706. doi:10.1093/sleep/20.9.705
7. Brown J, Yazdi F, Jodari-Karimi M, Owen JG, Reisin E. Obstructive sleep apnea and hypertension: updates to a critical relationship. Curr Hypertens Rep. 2022;24(6):173–184. doi:10.1007/s11906-022-01181-w
8. Mashaqi S, Staebler D, Mehra R. Combined nocturnal pulse oximetry and questionnaire-based obstructive sleep apnea screening - A cohort study. Sleep Med. 2020;72:157–163. doi:10.1016/j.sleep.2020.03.027
9. Tabara Y, Matsumoto T, Murase K, et al. Sleep-related factors associated with masked hypertension: the Nagahama study. J Hypertens. 2023;41(8):1298–1305. doi:10.1097/HJH.0000000000003466
10. Baguet JP, Lévy P, Barone-Rochette G, et al. Masked hypertension in obstructive sleep apnea syndrome. J Hypertens. 2008;26(5):885–892. doi:10.1097/HJH.0b013e3282f55049
11. Zhao J, Wang M, Li N, et al. Development and validation of a novel model for predicting coronary heart disease in snoring hypertensive patients with hyperhomocysteinemia. Int Heart J. 2023;64(6):970–978. doi:10.1536/ihj.23-384
12. Wang M, Wang M, Zhu Q, et al. Development and validation of a coronary heart disease risk prediction model in snorers with hypertension: a retrospective observed study. Risk Manag Healthc Policy. 2022;15:1999–2009. doi:10.2147/RMHP.S374339
13. Wang L, Heizhati M, Cai X, et al. Barriers to access to treatment for hypertensive patients in primary health care of less developed northwest china: a predictive nomogram. Int J Hypertens. 2021;2021:6613231. doi:10.1155/2021/6613231
14. Shi Y, Ma L, Chen X, et al. Prediction model of obstructive sleep apnea-related hypertension: machine learning-based development and interpretation study. Front Cardiovasc Med. 2022;9:1042996. doi:10.3389/fcvm.2022.1042996
15. Zeng X, Ma D, Wu K, et al. Development and validation of a clinical model to predict hypertension in consecutive patients with obstructive sleep apnea hypopnea syndrome: a hospital-based study and nomogram analysis. Am J Transl Res. 2022;14(2):819–830.
16. He H, Pan L, Pa L, et al. Data resource profile: the China National Health Survey (CNHS). Int J Epidemiol. 2018;47(6):1734–5f. doi:10.1093/ije/dyy151
17. Xu Y, Ou Q, Cheng Y, Lao M, Pei G. Comparative study of a wearable intelligent sleep monitor and polysomnography monitor for the diagnosis of obstructive sleep apnea. Sleep Breath. 2023;27(1):205–212. doi:10.1007/s11325-022-02599-x
18. Pei G, Ou Q, Shan G, et al. Screening practices for obstructive sleep apnea in healthy community people: a Chinese community-based study. J Thorac Dis. 2023;15(9):5134–5149. doi:10.21037/jtd-22-1538
19. Peduzzi P, Concato J, Kemper E, Holford TR, Feinstein AR. A simulation study of the number of events per variable in logistic regression analysis. J Clin Epidemiol. 1996;49(12):1373–1379. doi:10.1016/S0895-4356(96)00236-3
20. Steyerberg EW, Vergouwe Y. Towards better clinical prediction models: seven steps for development and an ABCD for validation. Eur Heart J. 2014;35(29):1925–1931. doi:10.1093/eurheartj/ehu207
21. Vickers AJ, Elkin EB. Decision curve analysis: a novel method for evaluating prediction models. Med Decis Making. 2006;26(6):565–574. doi:10.1177/0272989X06295361
22. Demler OV, Pencina MJ, D’Agostino RB. Misuse of DeLong test to compare AUCs for nested models. Stat Med. 2012;31(23):2577–2587. doi:10.1002/sim.5328
23. Hla KM, Young TB, Bidwell T, Palta M, Skatrud JB, Dempsey J. Sleep apnea and hypertension. A population-based study. Ann Intern Med. 1994;120(5):382–8.
24. Bixler EO, Vgontzas AN, Lin HM, et al. Association of hypertension and sleep-disordered breathing. Arch Intern Med. 2000;160(15):2289–2295. doi:10.1001/archinte.160.15.2289
25. Lavie P, Herer P, Hoffstein V. Obstructive sleep apnoea syndrome as a risk factor for hypertension: population study. BMJ. 2000;320(7233):479–482. doi:10.1136/bmj.320.7233.479
26. Kiely JL, McNicholas WT. Cardiovascular risk factors in patients with obstructive sleep apnoea syndrome. Eur Respir J. 2000;16(1):128–133. doi:10.1034/j.1399-3003.2000.16a23.x
27. Natsios G, Pastaka C, Vavougios G, et al. Age, body mass index, and daytime and nocturnal hypoxia as predictors of hypertension in patients with obstructive sleep apnea. J Clin Hypertens. 2016;18(2):146–152. doi:10.1111/jch.12645
28. Peppard PE, Young T, Palta M, Skatrud J. Prospective study of the association between sleep-disordered breathing and hypertension. N Engl J Med. 2000;342(19):1378–1384. doi:10.1056/NEJM200005113421901
29. Nieto FJ, Young TB, Lind BK, et al. Association of sleep-disordered breathing, sleep apnea, and hypertension in a large community-based study, sleep heart health study. Jama. 2000;283(14):1829–1836.
30. Demede M, Pandey A, Zizi F, et al. Resistant hypertension and obstructive sleep apnea in the primary-care setting. Int J Hypertens. 2011;2011:340929. doi:10.4061/2011/340929
31. Williams B, Mancia G, Spiering W, et al. 2018 practice guidelines for the management of arterial hypertension of the European Society of Cardiology and the European Society of Hypertension. Blood Press. 2018;27(6):314–340. doi:10.1080/08037051.2018.1527177
32. Bratton DJ, Stradling JR, Barbé F, Kohler M. Effect of CPAP on blood pressure in patients with minimally symptomatic obstructive sleep apnoea: a meta-analysis using individual patient data from four randomised controlled trials. Thorax. 2014;69(12):1128–1135. doi:10.1136/thoraxjnl-2013-204993
33. Pan M, Ou Q, Chen B, Hong Z, Liu H. Risk factors for obstructive sleep apnea-related hypertension in police officers in Southern China. J Thorac Dis. 2019;11(10):4169–4178. doi:10.21037/jtd.2019.09.83
34. Baran R, Grimm D, Infanger M, Wehland M. The effect of continuous positive airway pressure therapy on obstructive sleep apnea-related hypertension. Int J mol Sci. 2021;22(5):2300. doi:10.3390/ijms22052300
35. Lavie L. Obstructive sleep apnoea syndrome--an oxidative stress disorder. Sleep Med Rev. 2003;7(1):35–51. doi:10.1053/smrv.2002.0261
36. Fletcher EC. Invited review: physiological consequences of intermittent hypoxia: systemic blood pressure. J Appl Physiol. 2001;90(4):1600–1605. doi:10.1152/jappl.2001.90.4.1600
 © 2025 The Author(s). This work is published and licensed by Dove Medical Press Limited. The
full terms of this license are available at https://www.dovepress.com/terms.php
and incorporate the Creative Commons Attribution
- Non Commercial (unported, 3.0) License.
By accessing the work you hereby accept the Terms. Non-commercial uses of the work are permitted
without any further permission from Dove Medical Press Limited, provided the work is properly
attributed. For permission for commercial use of this work, please see paragraphs 4.2 and 5 of our Terms.
© 2025 The Author(s). This work is published and licensed by Dove Medical Press Limited. The
full terms of this license are available at https://www.dovepress.com/terms.php
and incorporate the Creative Commons Attribution
- Non Commercial (unported, 3.0) License.
By accessing the work you hereby accept the Terms. Non-commercial uses of the work are permitted
without any further permission from Dove Medical Press Limited, provided the work is properly
attributed. For permission for commercial use of this work, please see paragraphs 4.2 and 5 of our Terms.