")
Back to Journals » International Journal of Nanomedicine » Volume 19
Development of SERS Active Nanoprobe for Selective Adsorption and Detection of Alzheimer’s Disease Biomarkers Based on Molecular Docking
Authors Garnaik UC, Chandra A, Goel VK, Gulyás B, Padmanabhan P , Agarwal S
Received 4 December 2023
Accepted for publication 8 April 2024
Published 14 August 2024 Volume 2024:19 Pages 8271—8284
DOI https://doi.org/10.2147/IJN.S446212
Checked for plagiarism Yes
Review by Single anonymous peer review
Peer reviewer comments 2
Editor who approved publication: Dr Kamakhya Misra
Umesh Chandra Garnaik,1 Anshuman Chandra,1 Vijay Kumar Goel,1 Balázs Gulyás,2 Parasuraman Padmanabhan,2 Shilpi Agarwal1
1School of Physical Sciences, Jawaharlal Nehru University, New Delhi, India; 2Cognitive Neuroimaging Centre, Nanyang Technological University (NTU), Singapore, Singapore
Correspondence: Shilpi Agarwal, Optics and Photonics Laboratory, School of Physical Sciences, Jawaharlal Nehru University, New Delhi, 110067, India, Email [email protected] Parasuraman Padmanabhan, Cognitive Neuroimaging Centre, Nanyang Technological University (NTU), Singapore, 636921, Singapore, Email [email protected]
Purpose: Development of SERS-based Raman nanoprobes can detect the misfolding of Amyloid beta (Aβ) 42 peptides, making them a viable diagnostic technique for Alzheimer’s disease (AD). The detection and imaging of amyloid peptides and fibrils are expected to help in the early identification of AD.
Methods: Here, we propose a fast, easy-to-use, and simple scheme based on the selective adsorption of Aβ 42 molecules on SERS active gold nanoprobe (RB-AuNPs) of diameter 29 ± 3 nm for Detection of Alzheimer’s Disease Biomarkers. Binding with the peptides results in a spectrum shift, which correlates with the target peptide. We also demonstrated the possibility of using silver nanoparticles (AgNPs) as precursors for the preparation of a SERS active nanoprobe with carbocyanine (CC) dye and AgNPs known as silver nanoprobe (CC-AgNPs) of diameter 25 ± 4 nm.
Results: RB-AuNPs probe binding with the peptides results in a spectrum shift, which correlates with the target peptide. Arginine peak appears after the conjugation confirms the binding of Aβ 42 with the nanoprobe. Tyrosine peaks appear after conjugated Aβ 42 with CC-AgNPs providing binding of the peptide with the probe. The nanoprobe produced a strong, stable SERS signal. Further molecular docking was utilized to analyse the interaction and propose a structural hypothesis for the process of binding the nanoprobe to Aβ 42 and Tau protein.
Conclusion: This peptide–probe interaction provides a general enhancement factor and the molecular structure of the misfolded peptides. Secondary structural information may be obtained at the molecular level for specific residues owing to isotope shifts in the Raman spectra. Conjugation of the nanoprobe with Aβ 42 selectively detected AD in bodily fluids. The proposed nanoprobes can be easily applied to the detection of Aβ plaques in blood, saliva, and sweat samples.
Keywords: Alzheimer’s disease, nanoparticles, amyloid beta, surface enhanced Raman spectroscopy
Graphical Abstract:

Introduction
Neurodegenerative illnesses are severe diseases that are caused by neural circuit failure and cell loss. These degenerative disorders gradually deteriorate the patient’s memory, reasoning skills, cognitive learning, emotional sentiments, and mental faculties. One of the most notable features of neurodegenerative diseases is that their risk increases with age.1 As life expectancy continues to rise, the proportion of people suffering from various forms of neurodegenerative illnesses increases. Alzheimer’s disease (AD), described by the World Health Organization (WHO), is a progressive neurological disease that is the most common cause of dementia among individuals older than 65.2 AD is a form of brain disorder that causes functional loss in a person’s daily activity. It has several clinical symptoms, such as a continuous decline in thinking, disturbances in behavior and personality, depression, anxiety, and difficulty in organizing thoughts.3,4 According to the Alzheimer’s and Related Disorders Society of India (ARDSI) Dementia India Report 2010, approximately 3.7 million Indians were suffering from dementia in 2010, with the figure anticipated to rise to 7.6 million5 by 2030. More than 5.2 million Americans and 35.6 million individuals worldwide suffer from Alzheimer’s, and these numbers are expected to skyrocket by 2050.6–8 AD is characterized based on the age at which the first symptoms appear. Early disease affects people under the age of 65 years, accounting for roughly 4–6% of all instances of the disease, whereas late-onset Alzheimer’s disease affects those older than 65 years. However, the age at the onset of symptoms, as well as the early and late stages of Alzheimer’s disease, differ in neuropathological, clinical, neuroimaging, and cognitive factors.9 Previous research has demonstrated that the major cause of Alzheimer’s disease (AD) is the aggregation and uneven deposition of Aβ peptides in the brain. The major components of AD are associated with amyloid plaques are Aβ40 peptides but also the more toxic Aβ42 species,10 which is characterized by two amino acids that are generated by the breakdown of amyloid precursor protein (APP) by β and ν secretase.11 The most crucial point to emphasize is that the molecular phase of aggregation of amyloid begins long before obvious clinical alterations arise. Therefore, the identification of amyloid peptides and fibrils may aid in the diagnosis of AD.12
Symptoms include a mix of psychological questionnaires, and bio-imaging technologies, namely computerized Positron Emission Tomography (PET), Magnetic Resonance Imaging (MRI), and computed tomography (CT), are used to diagnose neurodegenerative diseases.13,14 The degenerative pathophysiological mechanism of AD is assumed to begin several years before clinical manifestation, resulting in non-specific symptoms before clinical diagnosis of AD can be obtained.15 Because dementia differential diagnosis is mainly based on medical criteria, it is frequently a complex and challenging process.16 The above methods are considered to have low accuracy, subjective, and not predictive of disease onset. Biomarkers are one of the most promising diagnostic methods because they can accurately and reliably measure the presence of a disease. Several possible biomarkers have been investigated for their ability to detect AD in its initial stages. Rapid and emerging advances in vibrational spectroscopy and advanced therapeutic nanoparticles for biomedical applications provide an opportunity to explore numerous biochemical indicators of illness through their comprehensive spectroscopic signature. It has been discovered to be ideal for diagnosing Alzheimer’s disease at an early stage because it is noninvasive and nondestructive to the human brain and physiological organs. Recent studies have shown that Raman spectroscopy can diagnose many ailments.17 Alzheimer’s, and Parkinson’s disease have all been diagnosed using Raman spectroscopy.18–21 These nanoparticles may be utilized for molecules and target cells with great compatibility and specificity when conjugated by bio-molecular targeting ligands, peptides, antibodies, or compounds.22–27 The association of organic dye with SERS-based nanoparticles is critical in the identification of Aβ peptides in vivo.
Aβ peptides exist in the brain in various forms, including soluble, membrane-associated, and intracellular species, which may play a greater role in dementia than those found in extracellular plaques. Aβ fibrillization includes converting soluble monomers into insoluble oligomers and highly organized fibrils. These fibrils are made up of stacked β-sheets with hydrogen bonds.28,29 Alzheimer’s disease diagnosis is complicated. Amyloid PET imaging30,31 has the potential to be a significant advancement in the evaluation of people with cognitive impairment. The scan reveals plaques in the brain, which are suspected of causing nerve cell damage and death in Alzheimer’s. Before amyloid PET, these plaques could only be diagnosed by studying the brain after an autopsy. Several approaches are being used to evaluate amyloid-β disease in vivo. Aβ42 levels in cerebrospinal fluid (CSF) correspond to soluble amyloid-β levels in the brain.32–34 The procedures described above are time-consuming and harmful for patients due to radiation emitted by the equipment and the difficulties in collecting CSF fluid for testing. As a result, our SERS-based amyloid detection outperforms existing traditional approaches due to its ease of use, convenience, and timeliness.
Circulating Aβ peptides have a vital role in Alzheimer’s disease pathogenesis. Aβ peptides are produced in significant amounts outside of the CNS by skeletal muscle, platelets, and vascular walls.35–37 Non-neural tissues that express AβPP include the pancreas, kidney, spleen, heart, liver, testis, aorta, lung, intestines, skin, adrenal, salivary, and thyroid glands. To overcome the previously sensitive sample collection and time-consuming analysis, we developed a non-destructive SERS-based nanoprobe for in-vivo examination of affected samples. A previous study on Terahertz (THz) spectroscopy38 of Aβ42 monomers, oligomers, and fibrils reveals intraband splitting around the highest occupied (HOMO) and lowest unoccupied (LUMO) molecular orbital levels. Through SERS-based probe, chemical enhancement is due to charge transfer between the metal substrate and adsorbed molecules. Charge transfer occurs by Raman resonance, which alters the adsorbate’s electronic states. The resonance allows for charge transfer between the adsorbate’s highest occupied molecular orbital (HOMO) and lowest unoccupied molecular orbital (LUMO) at half the energy of intramolecular excitations. These investigations indicate that the electronic energy structure of Aβ varies dramatically during aggregation. Direct assessment of electronic energy levels, including electron affinity and ionization potential, is necessary to fully comprehend the development of band structures in Aβ aggregates. In our study, we can understand the mechanism and structural changes that occurred in Aβ42 at the molecular level by SERS active nanoprobe. This peptide probe interaction can reveal that binding with Aβ42 peptides restricts molecule rotations and vibrations, requiring more energy to be released by photon emission. This results in improved structural information and also in the future perspective it will help in early detection of Aβ 42 from bodily fluids by using Raman spectroscopy.
In this study, we demonstrated the highly sensitive and rapid detection of AD. Raman imaging was made possible by conjugating RB and CC’s distinctive SERS spectrum with gold nanoparticles and silver nanoparticles. RB and CC have a high affinity for Aβ peptides, making them an effective inhibitor of Aβ aggregation. The adsorption of a variety of charge-negative pigments on the outermost layer of gold and silver colloidal particles was investigated.39 Inspired by this phenomenon, we proposed spherical shape Raman nanoprobes RB-AuNPs and CC-AgNPs. The average diameter of both the nanoprobes was found to be approximately 29 nm. The AuNPs were functionalized by covalent conjugation with Rose Bengal (C20H2Cl4I4O5Na2). Highly efficient surface enhanced Raman spectra were observed using RB dye with AuNPs39,40 and CC dye with AgNPs. From these spectra, we can conclude that the conjugation of the RB dye and amine-functionalized AuNPs shows significant features in detecting Aβ42 peptides as a Raman probe. Similarly, the conjugation of 1.1-diethyl-2,2-carbocyanine iodide (pinacyanol iodide) with AgNPs has shown important features for binding with Aβ peptides, which can be an efficient nanoprobe for Raman spectrometry. In this study, we proposed a Raman system with a conjugated nanoprobe for the detection of Aβ42 isoform peptides. The key characteristics of the proposed method are as follows: (1) Raman spectroscopy can distinguish between chemical structures that include the same atoms in various configurations. (2) It is nondestructive and noninvasive; therefore, the sample can be analyzed multiple times without damage. (3) Raman microscopes allow for the management of collection volumes ranging from minute quantities of material less than 1 µm in size to centimeters in size. (4) Although the sample is enclosed within a transparent vessel (eg, vial or capillary tube) or a cell with an opening for viewing (eg, temperature or pressure cell), collecting content-rich information is straightforward. And last but not least (5) The nanoprobe fabrication is a simple, fast, and cost-effective process.
Materials and Methods
Aβ peptides are formed by proteolytic cleavage of a transmembrane protein known as amyloid precursor protein.41 Improvement our understanding of the structures and biochemical properties of Aβ will improve our understanding of AD to the molecular extent. Aβ monomers aggregate into various types of assemblies such as oligomers and amyloid fibrils. These amyloid fibrils are insoluble, large, and can further aggregate into amyloid plaques, which may spread throughout the brain. In our study, we used the longest chain of this peptide, Aβ42. The main pathogenic component is considered to be the Aβ42 peptide because of its high toxicity and rapid fibrillation rate.
Amine-functionalized AuNPs with a diameter of 20 nm and Aβ42 were obtained from Sigma Aldrich Co. Spherical AgNPs with a diameter of 20 nm were purchased from SRLchem Pvt Ltd. RB dye (C20H2Cl4I4O5Na2), C25H25IN2- Pinacyanol Iodide (CC dye), 1-ethyl-3[3-dimethyl amino propyl] carbodiimide hydrochloride (EDC), 2-(N-morpholino) ethane sulfonic acid (MES), N-hydroxy succinimide (NHS), and NaOH solution were purchased from SRLchem Pvt., Ltd.
Instrumentation and Raman Measurement
Raman spectra were obtained using a WITec alpha300 RA Raman spectrometer (Oxford Instruments, Germany) to record the measurements of the RB-AuNPs nanoprobe with an electrically cooled CCD camera with a laser wavelength of 532 nm, 600 lines/mm grating lines, 100X microscopic objective, and an accumulation time of 3s. To avoid any harm to the sample, the laser power was set to 5mW, the lateral resolution was 200 nm, and the spectral resolution was reduced to 0.1 relative to the wavenumbers. The scan range was 100×100×200 µm3 piezo stage. Because of the dissimilarity in the dried specimens, each drop was imaged in many spatial locations to capture the entire diversity of the sample. For Raman spectra measurement of CC-AgNPs nanoprobe, the above instrumentation parameters remain the same except the laser power, it reduced to 0.5 mW to prevent any kind of damage to our sample.
For the measurement of Raman spectra, a suspension of the Aβ42 peptide solution was required. Therefore, an oligomeric solution of Aβ42 was prepared by treatment with NaOH, as described in a previous study42 with a modification. We dissolved 0.2 mg of lyophilized Aβ42 peptides (0.2 mL of NaOH solution (0.01M)). The reaction vessel was sonicated for approximately 1 min until amyloid peptides were completely dissolved. The peptide concentration was determined by UV absorbance at approximately 175 nm and 280 nm.43 The solution was stored at 2–8 °C. Then, after observing different concentrations of the Aβ42 peptide solution, we chose a concentration of 2 µg/mL mixed with the nanoprobes. The solution was then removed using a micropipette drop cast on a glass slide, washed thoroughly, and allowed to stand for 4 h. to dry for spectral measurements of the dried samples. All analyses and processing were performed using MATLAB software.
Simulation Study by Molecular Docking Method
Molecular docking was performed to gain insight into the interaction mechanism of Aβ with RB and CC dye. Amyloid beta was used as a receptor for the ligands RB and CC dye. The crystal structure of Aβ42 was downloaded from the PDB RCSB database (PDB ID: 6szf) and PubChem, respectively. The receptor was prepared for docking by removing heteroatoms and assigning Kollman and Gasteiger charges to the crystal structure of Aβ. The 3D structures of the compounds were downloaded from the SDF file format. The structures of the receptor and ligand were then converted to the pdbqt format using AutoDock tools. Finally, the prepared ligands were docked against the prepared Aβ42 receptor using Autodock Vina44 with a grid size (x = 27 Å, y = 27 Å, and z = 27 Å). Docking analysis was performed using Maestro.45
Preparation of Nanoprobe
To make gold nanoprobe (RB-AuNPs), we conjugated RB dye with amine-functionalized AuNPs with a diameter of 20 nm diameter40 as shown in Figure 1a. First, we have prepared 10µL of RB stock solution (10Mm) diluted with 500µL of 0.1M MES buffer with a PH value of 5. The reaction vessel was then supplemented with 6 mg NHS and 4 mg EDC HCL. The resulting mixture was slowly swirled at room temperature for 30 min while shielded from light. After RB was activated, we added 200µL of AuNPs standard solution (2.46 mg/mL) was added to the activated RB and stirred for the next 3–4 hrs at room temperature and shielded from light. The solution was then centrifuged at 13 K rpm for 10 min to extract the buoyant fluid. To separate the unconjugated dye, it was centrifuged twice in deionized water.
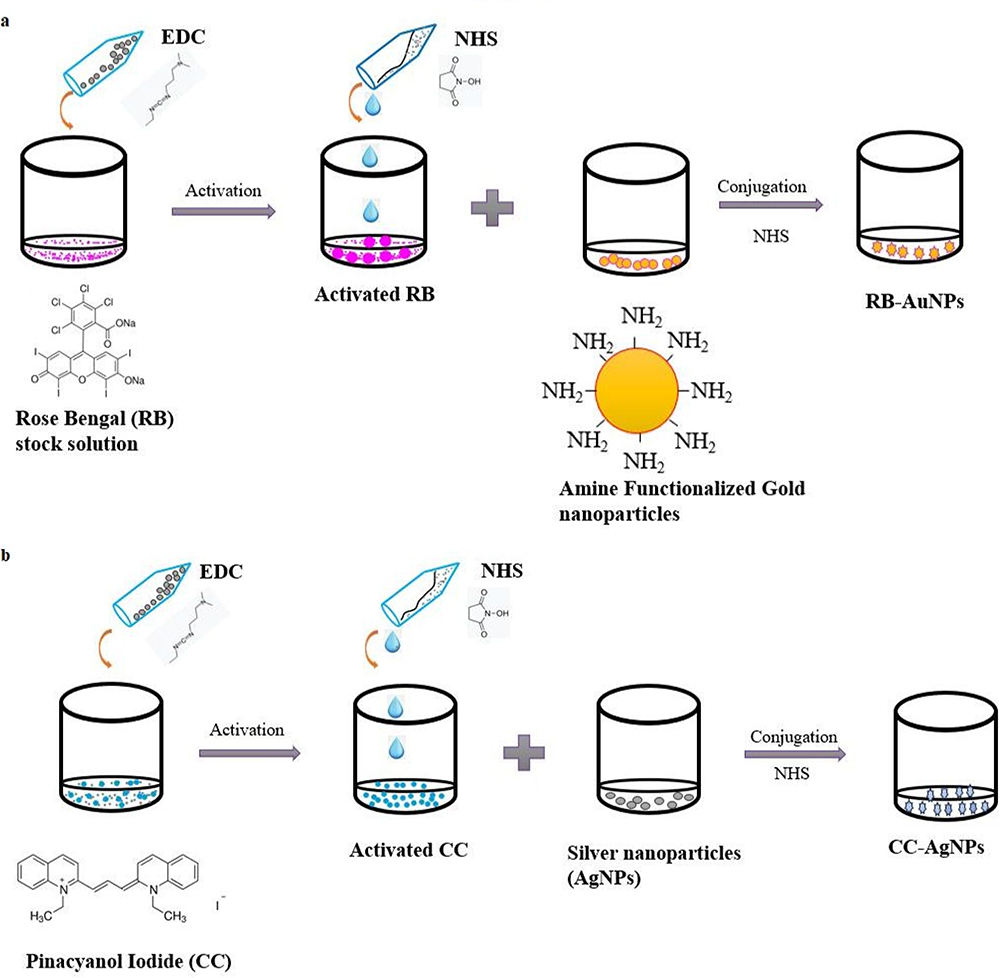 |
Figure 1 Schematic diagram EDC/NHS facilitated conjugation of (a) RB-AuNPs nanoprobe, (b) CC-AgNPs nanoprobe. |
As illustrated by Figure 1b, for the preparation of–the CC AgNPs nanoprobe, we followed the above synthesis method same as the gold nanoprobe but made a small change after preparing the CC dye stock solution and added 200µL of AgNPs stock solution (2 mg/mL) with CC stock solution and stirred for 1–2 hrs at room temperature and protected from light. The solution was centrifuged for 10 min at 13 K rpm, and the supernatant was collected and centrifuged twice more with DI water to eliminate unconjugated CC molecules.
Characterization of Raman Nanoprobes
We compared the transmission electron microscopy (TEM) images of functionalized RB-AuNPs.40 RB-AuNPs average diameter of 29 ± 3 nm is demonstrated in Figure 2a. From the TEM images, we did not observe any noticeable alterations owing to the small size of the connected RB moieties in the center of the nanoparticles preceding and following conjugation. The TEM image of CC-AgNPs is demonstrated in Figure 2b. The average diameter of CC-AgNPs was found to be 25 ± 4 nm. We observed adsorption on the metal and bulk aggregation after the synthesis of CC-AgNPs. This bulk aggregation results in the production of tiny spheroidal aggregates with diameters ranging from 2 to 5 nm.
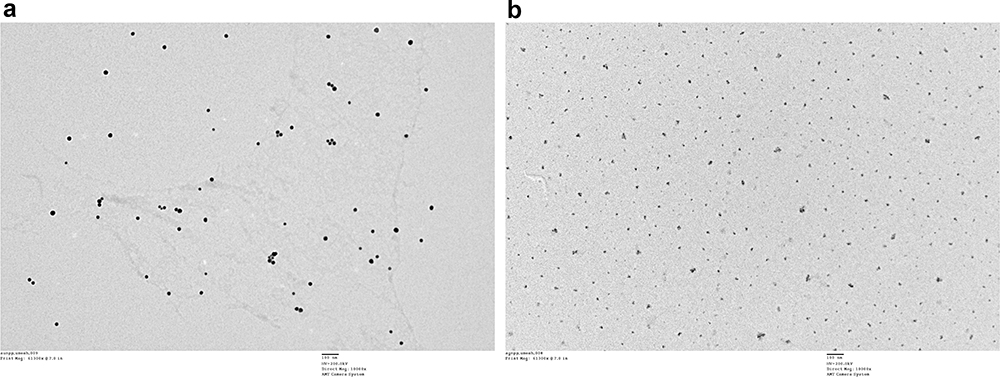 |
Figure 2 (a) TEM images corresponding to RB-AuNPs. (b) TEM images of the CC-AgNPs. |
Figure 3a shows the absorption spectra of RB and RB-AuNPs. The absorbance peak of the RB-AuNPs was redshifted to 550 nm, and an additional small peak was observed at 585 nm when compared with the original RB dye and AuNPs. These modifications might be related to alterations in the surface environment,41 which is thought to be proof of the effective conjugation of RB and nanoparticles.46 The absorption spectra of CC and CC-AgNPs are shown in Figure 3b. Cyanine dyes are organic compounds that have substantial applications in imaging technology as spectrum sensitizers due to their great absorption in the visible range and fluorescence capabilities.47 The absorbance peak of CC-AgNPs showed a redshift at 553 nm but decreased intensity due to increased adsorption of CC molecules on AgNPs. The CC concentration influenced a minor redshift (2–7 nm) and widening of the SPR band. These changes were caused by the plasmon coupling of neighbouring NPs and the local refractive index of the CC medium on the AgNPs.48 The α band at 600 nm is greater intensity than precursor CC molecules.
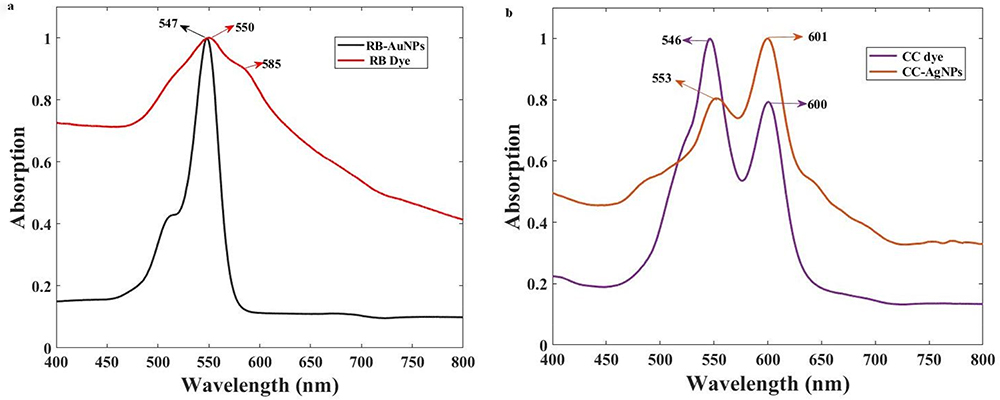 |
Figure 3 UV-VIS spectra of the nanoprobes RB-AuNPs and CC-AgNPs. (a) Absorption spectra of RB and RB-AuNPs, (b) Absorption spectra of CC and CC-AgNPs. |
Figure 4a demonstrates the FTIR spectra of the RB-AuNPs nanoprobe and nanoprobe with Aβ42. FTIR spectroscopy identifies N-H, O-H, C-H, and other vibrational bands as examples of functional groups. The peak at 1634 cm−1 assigned to C=O bonds, which are typical amide I bands. The broad peak at 3479 cm−1 shows N-H stretching of the amine modes. 2065 cm−1 shows the C triple bond C symmetric stretch.49,50 After conjugation of the Aβ peptide with RB-AuNPs, we observe there is a change in derivatives of the peak between 950 and 1100 cm−1. 1054 cm−1 shows the O-C stretching of carboxylic acids and derivatives, and the peak at 1642 cm−1 is red-shifted and enhanced owing to clustering at 1642 cm−1 by amide I peaks known as β-sheet proteins.51 Figure 4b shows the FTIR spectra of the synthesized CC-AgNPs peaks at 3525, 2923, 1636, 2072, and 1056 cm−1. Bands attributable to O-H stretching (approximately 3525 cm−1), aldehydic C-H stretching (2923 cm−1), C=O groups (1632 cm−1), and O-H stretching (1056 cm−1) were observed in the pure nanoparticles. When metal nanoparticles develop in solution, they must be stabilized against van der Waals forces of attraction, which might lead to coagulation. The existence of O-H stretching (approximately 3525 cm−1) was confirmed by FTIR analysis.49,50,52 The peak at 3525 cm−1 shifted to a shorter wavelength of 3474 cm−1 owing to the participation of the O-H or N-H bending of phenolic compounds found in Aβ42. The redshift occurred from 1636 cm−1 to 1639 cm−1, indicating peptide clustering on the surface of the probe, as the peak enhancement was found to be greater.
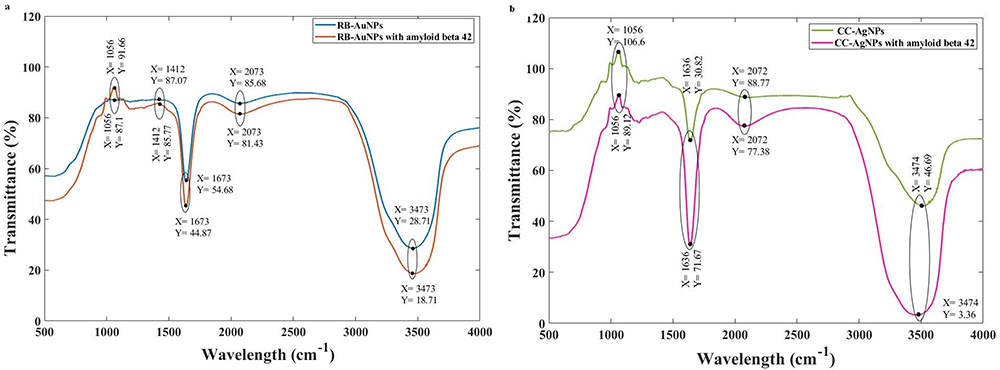 |
Figure 4 (a) FTIR spectra of RB-AuNPs nanoprobe and nanoprobe with Aβ42. (b) FTIR spectra of CC-AgNPs and CC-AgNPs with Aβ42. |
Results
Raman Analysis Process
The detection of molecules by Raman spectroscopy primarily depends on molecular adsorption on metal surfaces. However, in the nanosphere, the electric field that exists on the surface of the nanoparticle varies with distance from its metallic surface as {a/(a+d)}12 “d” is defined as the distance between molecules and nanoparticles, “a” is the radius of the nanoparticle, and this augmentation is of a short-range nature.53 Therefore, to achieve a high level of sensitivity in Raman spectra, analyte adsorption on the surface is essential. Amyloids and peptides are generally susceptible to adsorption on metallic nanoparticles via ionic forces, in addition to direct complexation with N- or S-containing amino acids such as cysteine, tryptophan, histidine, phenylalanine, and methionine.54,55 By carboxylic group linkage to the amine-functional group of AuNPs, RB molecules have been connected to amine-functionalized spherical AuNPs. We investigated amine-functionalized groups derived from a layer of pre-coated amine-functionalized polyethylene glycol. Non-spherical AuNPs (nano-triangles and nanostars) have been shown to generate greater surface-enhanced Raman spectra than spherical AuNPs. By conjugating RB with gold nanorods, RB can operate as an effective photosensitizer for PDT,56 resulting in increased photo-induced cytotoxicity.57 However, this strategy enhances the approach of the peptide to the metal surface, even though adsorption occurs in a relatively disorderly manner, resulting in plasmonic-mediated enhancement of Raman scattering.
Raman Analysis of Aβ42 Human
The Raman spectrum of the Aβ42 powder sample was obtained by confocal Raman spectroscopy, as shown in Figure 5. The Raman bands of proteins can be classified into two groups: (i) polypeptide backbones and (ii) amino acids in the side chain. The polypeptide backbone consisted of amide (I and III) bands and aromatic amino acids. Amino acids in the side chain describe H-bonding, intermolecular interactions, and aromatic amino acids are sensitive to the microenvironment, mainly phenylalanine (Phe) and aliphatic residues. Therefore, at 1001.3 cm−1, we detected the aromatic amino acid Phe.58 Because these band peptide structural alterations have little effect, they may be used to normalize the peptide Raman spectra. At 1234.8 cm−1, Amide III band corresponds to the β-sheet structure.59 This can also be linked with the Amide I band located at 1664.8 cm−1 with a β-turn structure.60 We have taken the spectra under dry conditions and minimum power without destroying the biomolecules of Aβ through a confocal Raman spectrometer.
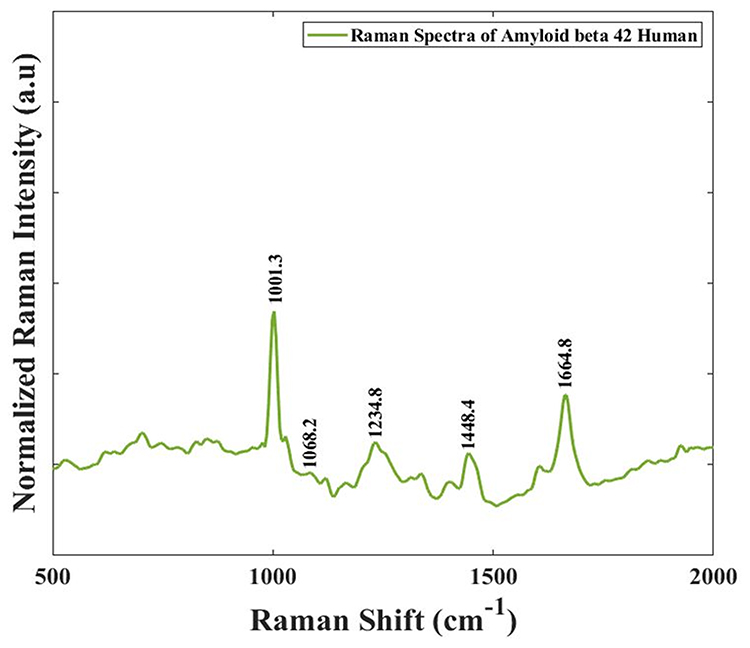 |
Figure 5 Raman spectra of Aβ42 peptide human. |
From our Raman spectroscopy observations, the positions and widths of the amide I and amide III bands between 1650–1700 cm−1 and 1200–1300 cm−1, respectively, were determined to be dependent on the peptide backbone conformations. The conformational transition from soluble, unstable protein to insoluble, β-sheet-rich amyloid may be seen as a shift of the amide-III band towards lower energies and constriction of the amide-I band during amyloid formation. These bands have special structural forms, as shown in the figure, which describes the amide I band formed by the bending of the C=O group (70–85%) and the C-N stretch group (10–20%). The amide II band is formed by NH2 deformation in primary amides and the combined vibration of N-H bending (40–60%) and C-N stretching (18–40%) in secondary amides.61–64 The structure of the amide III band contains complicated mixed vibrations that can be associated with the amide I band. This is the corresponding structural information for the protein structure; therefore, additional details of amide I may be obtained. The amide II band structure could not be identified because it is a weak band that cannot be recognized in the absence of resonance stimulation. The side-chain vibrations have little effect, although the relationship between the secondary structure and frequency is less simple than that for the amide I vibration. Therefore, the major amide I and amide III bands justify the complete composition of Aβ42.
Raman Study of Nanoprobes with Aβ42 Peptides
The Raman spectrum of the RB-AuNPs (1µg/mL) prior to and following the insertion of 2µM Aβ42 is demonstrated in Figure 6. Spectral alterations occurred in the two primary peaks at 1491 cm−1 and 1615 cm−1. Aβ42 alters the spectra of RB-AuNPs. All the spectra were normalized. Raman spectral measurements of RB-AuNPs containing Aβ42 peptides showed bands corresponding to CH2 and amide I at 1491.4 cm−1 and 1615.5 cm−1, respectively. The antiparallel β-sheet structure is represented by Amide I.63 The 1068 cm−1 peak reflects phenylalanine, which may link the Aβ peptide to RB molecules. The two major peaks show spectral changes at 1491.4 cm−1 and 1615.5 cm−1. Aβ42 induced spectra changes in the RB-AuNP. These changes are associated with the mechanical deformation of RB aromatic rings sandwiched between AuNPs and Aβ42 peptides.65,66 The relative signal intensity at 1615.5 cm−1 underwent a much larger decrease than the signal at 1491 cm−1. The ratio between the two peaks (intensity at 1491 cm − 1 to the intensity at 1615 cm–1) changed from 0.21 to 0.36. In the free state, most of the energy from the excitation photons can be released by the rotations and vibrations of the RB molecules. Binding with Aβ42 peptides restricts molecular rotations and vibrations; therefore, more energy must be released by photon emission, causing an enhanced spectrum.67,68 We observed that the relative enhancement of RB-AuNPs was higher than that of individual RB. This is explained by the absorption of Aβ42 peptides on the surface of RB-AuNPs, which leads to higher possibilities of interaction between Aβ42 and RB molecules. The rotations and vibrations of RB molecules can release the majority of the energy from the excitation photons in the free state, which results in comparatively low fluorescence emissions (RB Quantum Yield = 0.5% in PBS).69 When Aβ42 peptides connect to the molecules, the molecular rotations and vibrations are constrained, which requires more energy to be released by photon emission, increasing fluorescence.70,71 To determine the optimal concentration for Raman detection, we studied several quantities of RB-AuNPs with 2 μM Aβ42. The spectra reveal clear characteristics when the concentration of RB-AuNPs exceeds 1 μg/mL. Due to the potential risk of RB and CC molecules, the concentration used for SERS detection of Aβ 42 was established at 1µg/mL as mentioned by the author in the previous study.40
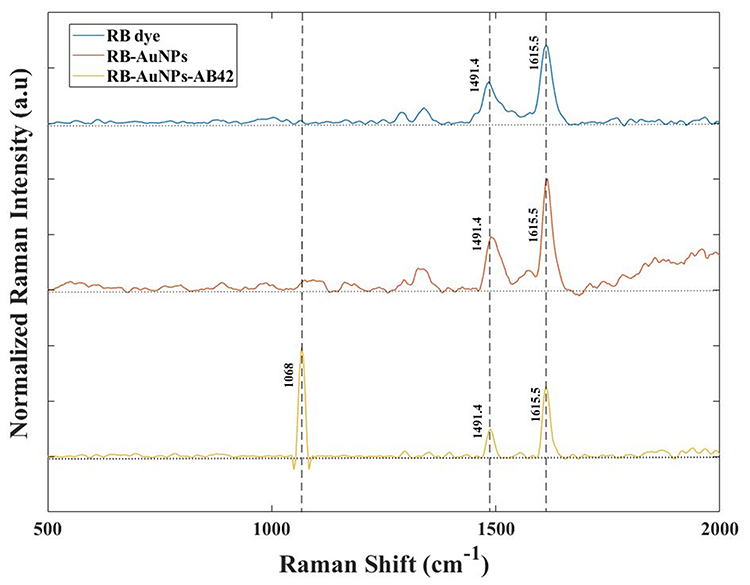 |
Figure 6 Spectral contribution of RB, RB-AuNPs, and RB-AuNPs-Aβ42 by using the confocal Raman system. Major peaks at 1491.4 cm−1 and 1615.5 cm−1 are observed to be greatly amplified following conjugation. The two major peaks showed intensity changes after interaction with the Aβ42 peptides. |
The CC dye molecules were conjugated to spherical AgNPs on their surface. The Raman spectra of the conjugated nanoprobe CC-AgNPs, CC dye, and CC-AgNPs-Aβ42 are shown in Figure 7. From the figure, it was confirmed that CC molecules adsorbed on the surface of the AgNPs, as the 1003 cm−1 peak was enhanced after conjugation. There is a modest shift in the strength of two main peaks 1351.4 cm−1 and 1619.2 cm−1 modified after the addition of 2µM Aβ42 peptide with CC-AgNPs (1µg/mL). The peaks at 840 cm−1, 1129 cm−1, and 1310.27 cm−1 show tyrosine peaks,72 which confirm the attachment of Aβ peptides to the nanoprobe, which will be discussed in a later section by molecular docking explanation. The secondary structure of polypeptides is intimately related to the backbone chain amide bands.60 According to the examination of amide bands, Aβ42 transitions from the solid state β-sheet structure to a surface to alpha-helix (amide III band at 1234.9 cm−1 to 1310.17 cm−1)73 and having β-turn structure to antiparallel β-sheet structure (1668 cm−1, amide I to 1619.2 cm−1). For dry samples, the SERS spectra of Aβ42 were analyzed for amyloid, and Buividas et al also reported the final structure.60,74 Here, the intensity of the two major peaks underwent a much larger decrease after 2µM Aβ42 aggregation. This behavior demonstrates that as amyloid self-aggregates into spheroids that remain away from the metal surface, the number of peptide molecules providing the SERS signal diminishes. Compared with the Aβ42 spectra (Figure 5) after binding with the silver nanoprobe, there was a significant structural change: the Amide III band with a β-sheet structure changed to an α-helix structure, and the Amide I band β-turn structure changed to an antiparallel β-sheet structure. Here, the peak strength and signal enhancement are slightly lower than those of the AuNP probe, but we have a better structural analysis.
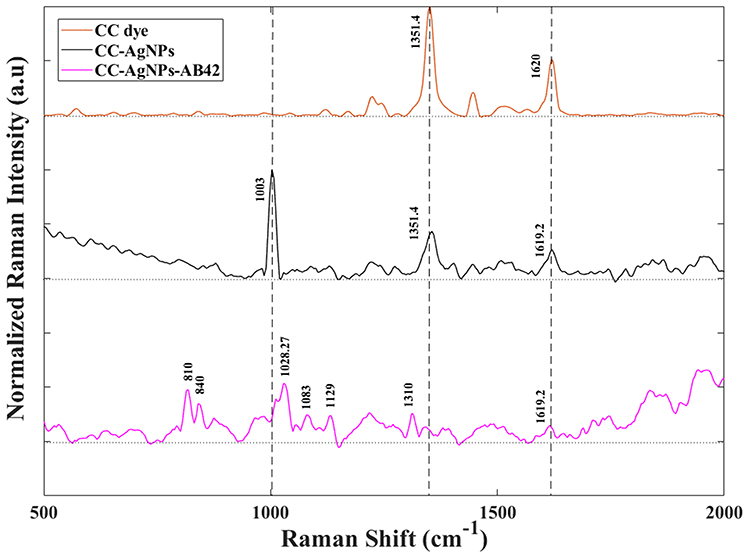 |
Figure 7 Raman spectra of CC dye, CC-AgNPs nanoprobe, CC-AgNPs nanoprobe with addition of 2μM Aβ42 peptides. Here the CC-AgNPs has an enhanced peak at 1003cm−1 suggesting attachment of CC dye molecules with AgNPs surface. After the addition of Aβ42 the signal intensity changes at two major peaks at 1351.4cm−1 and 1619.2cm−1. |
Table ST-1 shows the recent methods used to detect Aβ 42 for diagnosis of AD and their limitation irrespective of proposed method (Supplementary Table 1).
Molecular Docking Analysis
The goal of molecular docking in this study was to predict the binding pose and estimate the binding energy of the complex formed between amyloid beta (Aβ) and dyes (RB and CC). The arginine and phenylalanine residues of Aβ show good interactions with the ligand RB and CC dye. RB showed a docking energy of −6 kcal/mol, Arg5 formed a hydrogen bond with an iodine atom, and Phe19 showed Pi-stacking, as shown in Figure 8.
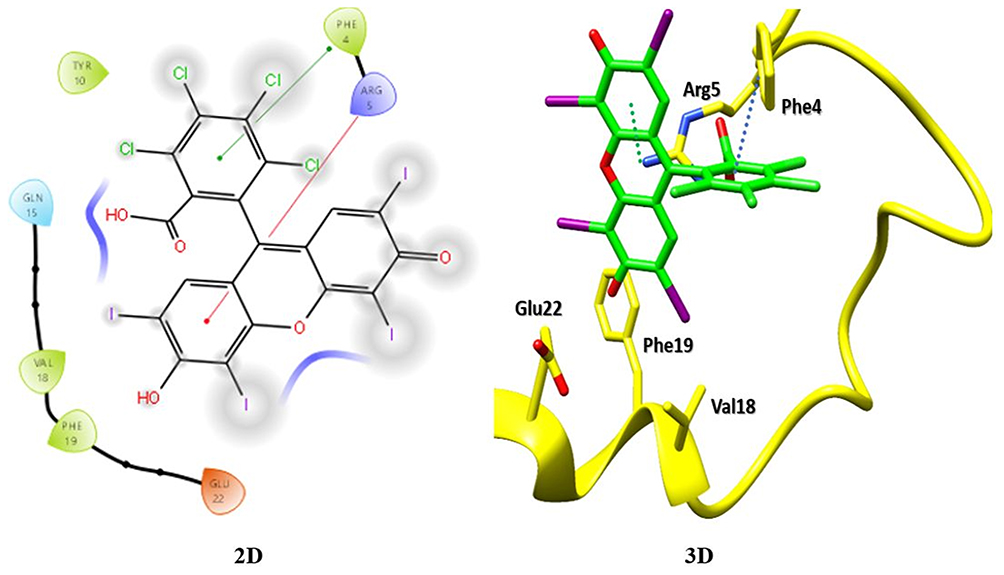 |
Figure 8 Molecular docking structures of Aβ42 conjugation with RB molecules in 2D and3D. |
In the case of CC dye, an additional residue Tyr10 is also involved in π-stacking (Figure 9). The docking energy of CC dye was −6.5 kcal/mol. The overall docking results revealed that RB and CC dye showed good interactions with Aβ and could be used as biomarkers for the detection of Aβ in patient blood samples.
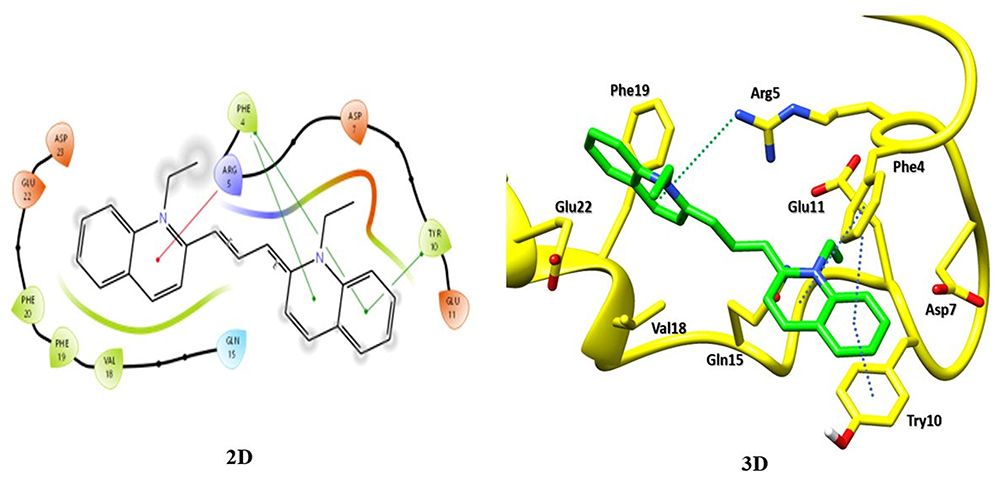 |
Figure 9 Molecular docking structures of Aβ42 conjugation with CC molecules in 2D and 3D. |
To understanding the utilization of developed nanoprobe for tau immunoassays, we performed the molecular docking study for the process of binding the nanoprobe to tau protein. The molecular docking analysis of Rose Bengal (RB) and Pinacyanol Iodide binding to Tau protein has provided insights into their binding affinity as shown in Figure SF-1 (Supplementary Figure 1) and Figure SF-2 (Supplementary Figure 2). The calculated binding scores of −6 kcal/mol for RB and −5.7 kcal/mol for Pinacyanol Iodide underscore the interaction of both dyes for Tau protein. For RB, we observed two intermolecular halogen bonds with Cys291 and Gly292. Additionally, hydrophobic interactions with pivotal residues, such as Lys290, Asn296, Ile297, His299, and Pro301, also contribute to the stability of the RB-Tau complex. The presence of halogen bonding and multiple hydrophobic contacts emphasizes the specificity and strong binding of RB to Tau protein. In contrast, Pinacyanol Iodide formed hydrophobic interactions with His268, Gln269, Asn279, Gln288, and Ser289. Notably, the Pinacyanol Iodide-Tau complex reveals a salt bridge interaction, enhancing the overall stability. The collective results strongly affirm the notable affinity of both RB and Pinacyanol Iodide for Tau protein. The identified molecular interactions provide a deeper understanding of the binding mechanisms, laying the groundwork for the potential utilization of developed nanoprobes for Tau protein detection.
Conclusion
In this study, the authors suggested the conceptualization and creation of a SERS-active nanoprobes for identifying the presence of Aβ42. The existence of nanoparticles has been found to influence the fibrilization mechanism of amyloid peptides, and this phenomenon is seen as evidence for a possible biomarker in Alzheimer’s disease diagnosis. Before the peptides bind, the energy created by excited photons can be released by the rotation and vibration of RB molecules, as demonstrated by the peptide–probe interaction. The peptide probe contact reduced molecular rotations and vibrations, necessitating higher energy release via photon emission. The spectral shift in prominent peaks demonstrates that Aβ42 fibrillizes, transforming from monomers to oligomers and fibrils before reaching the charge neutrality point. As a result, the oligomeric Aβ42’s shift in energy from photon extracting to photon donating may be a potential signal for the formation of neurotoxic Aβ42 aggregates. The experimental results confirmed the adsorption of Aβ42 with arginine in the RB-AuNPs and tyrosine in–the CC AgNP nanoprobe can be compared with our molecular docking picture. The general drawback of this work is that the combination of Aβ42 peptides with RB-AuNPs produces fluorescence. To circumvent this constraint, we tested another nanoprobe, CC-AgNPs. Given the possible hazardous impact of RB molecules, the actual concentration employed for SERS detection of Aβ42 was set at 1µg/mL. The proposed SERS active nanoprobes provide new possibilities for their use as chemical biomarkers. This study also serves as proof of concept that Aβ could serve as a potential biomarker for the early diagnosis of AD. Furthermore, the shown SERS probes provide a potential step towards creating a quick, label-free, and early diagnostic platform.
Acknowledgments
The authors acknowledge financial support from the DST (File No. DST/TDT/DDP-47/2021), Government of India, for funding. The authors also acknowledge the Advanced Instrumentation Research Facility, Jawaharlal Nehru University, New Delhi, for characterization of the Confocal Raman facility. B.G. and P.P. thank the Imaging Probe Development Platform (IPDP), and the support from the Cognitive NeuroImaging Centre (CONIC) at NTU.
Disclosure
The authors report no conflicts of interest in this work.
References
1. Farooqui T, Farooqui AA. Aging: an important factor for the pathogenesis of neurodegenerative diseases. Mech Ageing Dev. 2009;130(4):203–215. doi:10.1016/j.mad.2008.11.006
2. Gauthier S, Rosa NP, Morais JA, Webster C. World Alzheimer Report 2021: Journey through the diagnosis of dementia. Alzheimer’s Disease International: London, England; 2021.
3. Monien BH, Apostolova LG, Bitan G. Early diagnostics and therapeutics for Alzheimer’s disease: how early can we get there? Expert Rev Neurother. 2006;6(9):1293–1306. doi:10.1586/14737175.6.9.1293
4. Farlow MR. Etiology and pathogenesis of Alzheimer’s disease. Am J Health Sys Pharm. 1998;55(2):S5–10. doi:10.1093/ajhp/55.suppl_2.S5
5. Dweepobotee B The persistence of memory: the burden of Alzheimer’s disease in India, 2019.
6. Prince M, Bryce R, Albanese E, Wimo A, Ribeiro W, Ferri CP. The global prevalence of dementia: a systematic review and meta-analysis. Alzheimers Dem. 2013;9(1):63–75. doi:10.1016/j.jalz.2012.11.007
7. Brookmeyer R, Evans DA, Hebert L, et al. National estimates of the prevalence of Alzheimer’s disease in the United States. Alzheimers Dem. 2011;7(1):61–73. doi:10.1016/j.jalz.2010.11.007
8. Alzheimer’s Association. Alzheimer’s disease facts and figures. Alzheimers Dem. 2014;10(2):e47–e92.
9. Mendez MF. Early-onset Alzheimer’s disease. Neurol Clin. 2017;35(2):263–281. doi:10.1016/j.ncl.2017.01.005
10. Querfurth HW, LaFerla FM. Alzheimer’s disease. N Engl J Med. 2010;362(4):329–344. doi:10.1056/NEJMra0909142
11. Jarrett JT, Lansbury PT. Seeding “one-dimensional crystallization” of amyloid: a pathogenic mechanism in Alzheimer’s disease and scrapie? Cell. 1993;73(6):1055–1058. doi:10.1016/0092-8674(93)90635-4
12. Kung HF. The β-amyloid hypothesis in Alzheimer’s disease: seeing is believing. ACS Med Chem Lett. 2012;3(4):265–267. doi:10.1021/ml300058m
13. Gao XW, Hui R, Tian Z. Classification of CT brain images based on deep learning networks. Compute Meth Prog Biomed. 2017;138:49–56. doi:10.1016/j.cmpb.2016.10.007
14. Woo CW, Chang LJ, Lindquist LJ, Wager TD. Building better biomarkers: brain models in translational neuroimaging. Nat Neuro. 2017;20(3):365–377. doi:10.1038/nn.4478
15. Sperling RA, Aisen PS, Beckett LA, et al. Toward defining the preclinical stages of Alzheimer’s disease: recommendations from the national institute on aging-Alzheimer’s association workgroups on diagnostic guidelines for Alzheimer’s disease. Alzheimers Dem. 2011;7(3):280–292. doi:10.1016/j.jalz.2011.03.003
16. Helmuth L. Detangling Alzheimer’s disease: new insights into the biological bases of the most common cause of dementia are pointing to better diagnostics and possible therapeutics. Sci Aging Knowl Environ. 2003;2003(43):oa2. doi:10.1126/sageke.2003.43.oa2
17. Basar G, Parlatan U, Seninak S, Gunel T, Benian A, Kalelioglu I. Investigation of preeclampsia using Raman spectroscopy. Int J Spectrosc. 2012;27(4):239–252. doi:10.1155/2012/376793
18. Pichardo-Molina JL, Frausto-Reyes C, Barbosa Garcia O, et al. Raman spectroscopy and multivariate analysis of serum samples from breast cancer patients. Lasers Med Sci. 2007;22(4):229–236. doi:10.1007/s10103-006-0432-8
19. Koo TW, Berger AJ, Itzkan I, Horowitz G, Feld MS. Reagent less blood analysis by near-infrared Raman spectroscopy. Diabetes Technol Ther. 1999;1(2):153–157. doi:10.1089/152091599317369
20. Schipper HM, Kwok CS, Rosendahl SM, et al. Spectroscopy of human plasma for diagnosis of idiopathic Parkinson’s disease. Biomarker Med. 2008;2(3):229–238. doi:10.2217/17520363.2.3.229
21. Carmona P, Molina M, Calero M, Bermejo-Pareja F, Martínez-Martín P, Toledano A. Discrimination analysis of blood plasma associated with Alzheimer’s disease using vibrational spectroscopy. J Alzheimers Dis. 2013;34(4):911–920. doi:10.3233/JAD-122041
22. Peer D, Karp JM, Hong S, Farokhzad OC, Margalit R, Langer R. Nanocarriers as an emerging platform for cancer therapy. Nat Nanotechnol. 2007;2(12):751–760. doi:10.1038/nnano.2007.387
23. Qian X, Peng XH, Ansari DO, et al. In vivo tumor targeting and spectroscopic detection with surface-enhanced Raman nanoparticle tags. Nat Biotechnol. 2007;26(1):83–90.
24. Wu XL, Kim JH, Koo H, et al. Tumor-targeting peptide conjugated ph-responsive micelles as a potential drug carrier for cancer therapy. Bioconjugate Chem. 2010;21(2):208–213. doi:10.1021/bc9005283
25. Hong H, Zhang Y, Engle JW, et al. In vivo targeting and positron emission tomography imaging of tumor vasculature with 66 Ga-labeled nano-graphene. Biomaterials. 2012;33(16):4147–4156. doi:10.1016/j.biomaterials.2012.02.031
26. Sanna V, Pala N, Sechi M. Targeted therapy using nanotechnology: focus on cancer. Int J Nanomed. 2014;15(9):467–483.
27. Hennig R, Pollinger K, Veser A, Breunig M, Goepferich A. Nanoparticle multivalency counterbalances the ligand affinity loss upon pegylation. J Contr Rel. 2014;194:20–27. doi:10.1016/j.jconrel.2014.07.062
28. Nelson R, Sawaya MR, Balbirnie M, et al. Structure of the cross-β spine of amyloid-like fibrils. Nature. 2005;435(7043):773–778. doi:10.1038/nature03680
29. Wujoon C, Chaejeong H, Sanghyub L, et al. Probing interfacial charge transfer between amyloid-β and graphene during amyloid fibrillization using raman spectroscopy. ACS Nano. 2023;17(5):4834–4842. doi:10.1021/acsnano.2c11428
30. Chapleau M, Iaccarino L, Soleimani-Meigooni D, Rabinovici GD. The role of amyloid PET in imaging neurodegenerative disorders: a review. J Nucl Med. 2022;63(Suppl 1):13S–19S. doi:10.2967/jnumed.121.263195
31. Reimand J, Boon BDC, Collij LE, et al. Amyloid-β PET and CSF in an autopsy-confirmed cohort. Ann Clin Transl Neurol. 2020;7(11):2150–2160. doi:10.1002/acn3.51195
32. Kuo YM, Kokjohn TA, Watson MD, et al. Elevated abeta42 in skeletal muscle of Alzheimer disease patients suggests peripheral alterations of AbetaPP metabolism. Am J Pathol. 2000;156(3):797–805. doi:10.1016/S0002-9440(10)64947-4
33. Li QX, Whyte S, Tanner JE, Evin G, Beyreuther K, Masters CL. Secretion of Alzheimer’s disease abeta amyloid peptide by activated human platelets. Lab Invest. 1998;78(4):461–469.
34. Van Nostrand WE, Melchor JP. Disruption of pathologic amyloid beta-protein fibril assembly on the surface of cultured human cerebrovascular smooth muscle cells. Amyloid. 2001;8(Suppl 1):20–27.
35. Selkoe DJ, Podlisny MB, Joachim CL, et al. Beta-amyloid precursor protein of Alzheimer disease occurs as 110- to 135-kilodalton membrane-associated proteins in neural and nonneural tissues. Proc Natl Acad Sci USA. 1988;85(19):7341–7345. doi:10.1073/pnas.85.19.7341
36. Catteruccia N, Willingale-Theune J, Bunke D, et al. Ultrastructural localization of the putative precursors of the A4 amyloid protein associated with Alzheimer’s disease. Am J Pathol. 1990;137(1):19–26.
37. Sandbrink R, Masters CL, Beyreuther K. Beta A4-amyloid protein precursor mRNA isoforms without exon 15 are ubiquitously expressed in rat tissues including brain, but not in neurons. J Biol Chem. 1994;269(2):1510–1517. doi:10.1016/S0021-9258(17)42286-1
38. Heo C, Ha T, You C, et al. Identifying fibrillization state of Aβ protein via near-field thz conductance measurement. ACS Nano. 2020;14(6548):6558. doi:10.1021/acsnano.9b08572
39. Lee PC, Meisel D. Adsorption and surface-enhanced Raman of dyes on silver and gold sols. J Phys Chem. 1986;86(17):3391–3395. doi:10.1021/j100214a025
40. Xia Y, Padmanabhan P, Sarangapani S, Gulyás B, Matham MV. Bifunctional fluorescent/raman nanoprobe for the early detection of amyloid. Sci Rep. 2019;9(1):8497. doi:10.1038/s41598-019-43288-2
41. Ghosh SK, Nath S, Kundu S, Esumi K, Pal T. Solvent and Ligand Effects on the Localized Surface Plasmon Resonance (LSPR) of gold colloids. J Phys Chem B. 2004;108(37):13963–13971. doi:10.1021/jp047021q
42. Fezoui Y, Hartley DM, Harper JD, et al. An improved method of preparing the amyloid β-protein for fibrillogenesis and neurotoxicity experiments. Amyloid. 2000;7(3):166–178. doi:10.3109/13506120009146831
43. Paranjape GS, Terrill SE, Gouwens LK, Ruck BM, Nichols MR. Amyloid-β (1–42) protofibrils formed in modified artificial cerebrospinal fluid bind and activate microglia. J Neu Imm Pharma. 2013;8(1):312–322.
44. Trott O, Olson AJ. AutoDock vina: improving the speed and accuracy of docking with a new scoring function, efficient optimization, and multithreading. J Comput Chem. 2010;31(2):455–461. doi:10.1002/jcc.21334
45. Schrödinger Release 2023-1. Maestro. In: Schrödinger. New York, NY: LLC;2021.
46. Wang JH, Wang B, Liu Q, et al. Bimodal optical diagnostics of oral cancer based on rose Bengal conjugated gold nanorod platform. Biomaterials. 2013;34(17):4274–4283. doi:10.1016/j.biomaterials.2013.02.012
47. Laban B, Vodnik V, Dramićanin M, et al. Mechanism and Kinetics of J-Aggregation of Thiacyanine Dye in the Presence of Silver Nanoparticles. J Phys Chem C. 2014;118(40):23393–23401. doi:10.1021/jp507086g
48. Shapovalov SA. The first century of successful applications of pinacyanol: some noteworthy results. Colorants. 2022;1(2):165–192. doi:10.3390/colorants1020011
49. Mecozzi M, Sturchio E. Computer assisted examination of infrared and near infrared spectra to assess structural and molecular changes in biological samples exposed to pollutants: a case of study. J Imaging. 2017;3(1):11. doi:10.3390/jimaging3010011
50. Ji Y, Yang X, Ji Z, et al. DFT-calculated IR spectrum amide I, II, and III band contributions of N-methylacetamide fine components. ACS Omega. 2020;5(15):8572–8578. doi:10.1021/acsomega.9b04421
51. Zandomeneghi G, Krebs MR, McCammon MG, Fändrich M. FTIR reveals structural differences between native beta-sheet proteins and amyloid fibrils. Protein Sci. 2004;13(12):3314–3321. doi:10.1110/ps.041024904
52. Karthik L, Kumar G, Kirthi AV, Rahuman AA, Bhaskara Rao KV. Streptomyces sp LK3 mediated synthesis of silver nanoparticles and its biomedical application. Bioprocess Biosyst Eng. 2014;37(2):261–267. doi:10.1007/s00449-013-0994-3
53. Aroca RF. Plasmon enhanced spectroscopy. Phys Chem Chem Phys. 2013;15(15):5355–5363. doi:10.1039/c3cp44103b
54. López-Tobar E, Hernández B, Gómez J, et al. Anchoring sites of fibrillogenic peptide hormone somatostatin-14 on plasmonic nanoparticles. J Phys Chem C. 2015;119(15):8273–8279. doi:10.1021/acs.jpcc.5b00485
55. Hernández B, Coïc YM, López-Tobar E, et al. Dynamical behavior of somatostatin-14 and its cyclic analogues as analyzed in bulk and on plasmonic silver nanoparticles. Adv Protein Chem Struct Biol. 2018;112:81–121.
56. Panzarini E, Inguscio V, Dini L. Timing the multiple cell death pathways initiated by rose Bengal acetate photodynamic therapy. Cell Death Dis. 2011;2(6):e169. doi:10.1038/cddis.2011.51
57. Wang B, Wang JH, Liu Q, et al. Rose-Bengal-conjugated gold nanorods for in vivo photodynamic and photothermal oral cancer therapies. Biomaterials. 2014;35(6):1954–1966. doi:10.1016/j.biomaterials.2013.11.066
58. Di Foggia M, Ottani S, Torreggiani A, et al. Surface enhanced raman scattering and quantum-mechanical calculations on self-assembling oligopeptides. J Raman Spectrosc. 2018;18(6):982–996. doi:10.1002/jrs.5359
59. Aliaga AE, Aguayo T, Garrido C, et al. Surface-enhanced Raman scattering and theoretical studies of the C-terminal peptide of the β-subunit human chorionic gonadotropin without linked carbohydrates. Biopolymers. 2011;95(2):135–143. doi:10.1002/bip.21542
60. Bandekar J. Amide modes and protein conformation. Biochim. Biophys. Acta. 1992;1120(2):123–143. doi:10.1016/0167-4838(92)90261-B
61. Ryzhikova E, Ralbovsky NM, Sikirzhytski V, et al. Raman spectroscopy and machine learning for biomedical applications: alzheimer’s disease diagnosis based on the analysis of cerebrospinal fluid. Spectrochim, Acta A Mol, Biomol, Spectrosc. 2021;248:119188. doi:10.1016/j.saa.2020.119188
62. Sevinc A, Yonar D, Severcan F. Investigation of neurodegenerative diseases from body fluid samples using Fourier transform infrared spectroscopy. Biomed Spectrosco Imag. 2015;4(4):341–357. doi:10.3233/BSI-150123
63. Carmona P, Molina M, López-Tobar E, Toledano A. Vibrational spectroscopic analysis of peripheral blood plasma of patients with Alzheimer’s disease. Anal Bioanal Chem. 2015;407(25):7747–7756. doi:10.1007/s00216-015-8940-7
64. Lopes J, Correia M, Martins I, et al. FTIR and Raman spectroscopy applied to dementia diagnosis through analysis of biological fluids. J Alzh Dis. 2016;52(3):801–812. doi:10.3233/JAD-151163
65. Gabudean AM, Focsan M, Astilean S. Gold nanorods performing as dual-modal nanoprobes via metal-enhanced fluorescence (MEF) and surface-enhanced Raman scattering (SERS). J Phys Chem C. 2012;116(22):12240–12249. doi:10.1021/jp211954m
66. Guerrini L, Arenal R, Mannini B, et al. SERS detection of amyloid oligomers on metallorganic-decorated plasmonic beads. ACS App Mat Interf. 2015;7(18):9420–9428. doi:10.1021/acsami.5b01056
67. Perumal J, Kong KV, Dinish U, Bakker RM, Olivo M. Design and fabrication of random silver films as substrate for SERS based nano-stress sensing of proteins. RSC Adv. 2014;4(25):12995–13000. doi:10.1039/c3ra44867c
68. Garnaik UC, Agarwal S. Raman spectroscopy as a potential tool to analyze alzheimer’s disease progression. proceedings of ICNOC 2022, New Delhi, India, 28-30 nov 2022; Khan ZH, Jackson M, Salah NA. Springer Nature, Singapore, Singapore, in: (eds). Recent Adv Nanotechnol. 2023;28:221–225.
69. Murasecco Suardi P, Gassmann E, Braun AM, Oliveros E. Determination of the quantum yield of intersystem crossing of rose bengal. Helvetica chimica Act. 1987;70(7):1760–1773. doi:10.1002/hlca.19870700712
70. Biancalana M, Koide S. Molecular mechanism of Thioflavin-T binding to amyloid fibrils. Biochim Biophys Acta (BBA)-Proteins and Proteomics. 2010;1804(7):1405–1412. doi:10.1016/j.bbapap.2010.04.001
71. Khajehpour M, Troxler T, Vanderkooi JM. Probing the active site of trypsin with rose Bengal: insights into the photodynamic inactivation of the enzyme. Photochem and Photobiol. 2004;80(2):359–365. doi:10.1111/j.1751-1097.2004.tb00096.x
72. Wen C, Hiramatsu H. The 532 nm excited hyper Raman spectroscopy of globular protein and aromatic amino acids. J Raman spectrosco. 2019;51(2):274–278. doi:10.1002/jrs.5777
73. Garnaik UC, Agarwal S “surface enhanced Raman spectroscopy for alzheimer’s disease diagnosis”, in Optica Sensing Congress 2023 (AIS, FTS, HISE, Sensors, ES), Technical Digest Series, Optica Publishing Group. 2023; paper STu5D.7.
74. Accardo A, Shalabaeva V, Cotte M, et al. Amyloid β peptide conformational changes in the presence of a lipid membrane system. Langmuir. 2014;30(11):3191–3198. doi:10.1021/la500145r
 © 2024 The Author(s). This work is published and licensed by Dove Medical Press Limited. The
full terms of this license are available at https://www.dovepress.com/terms.php
and incorporate the Creative Commons Attribution
- Non Commercial (unported, 3.0) License.
By accessing the work you hereby accept the Terms. Non-commercial uses of the work are permitted
without any further permission from Dove Medical Press Limited, provided the work is properly
attributed. For permission for commercial use of this work, please see paragraphs 4.2 and 5 of our Terms.
© 2024 The Author(s). This work is published and licensed by Dove Medical Press Limited. The
full terms of this license are available at https://www.dovepress.com/terms.php
and incorporate the Creative Commons Attribution
- Non Commercial (unported, 3.0) License.
By accessing the work you hereby accept the Terms. Non-commercial uses of the work are permitted
without any further permission from Dove Medical Press Limited, provided the work is properly
attributed. For permission for commercial use of this work, please see paragraphs 4.2 and 5 of our Terms.