")
Back to Journals » Drug Design, Development and Therapy » Volume 19
Drug Interaction Potential of Berberine Hydrochloride When Co-Administered with Tofacitinib and Filgotinib in Rats
Authors Wang J , Lu S, Zhang C, Wang J, Wu H, Li G
Received 14 August 2024
Accepted for publication 23 April 2025
Published 10 June 2025 Volume 2025:19 Pages 5043—5057
DOI https://doi.org/10.2147/DDDT.S491446
Checked for plagiarism Yes
Review by Single anonymous peer review
Peer reviewer comments 2
Editor who approved publication: Prof. Dr. Georgios Panos
Jinglong Wang, Shijia Lu, Chenxiao Zhang, Junjie Wang, Huiru Wu, Guofei Li
Department of Pharmacy, Shengjing Hospital of China Medical University, Shenyang, Liaoning Province, People’s Republic of China
Correspondence: Guofei Li, Department of Pharmacy, Shengjing Hospital of China Medical University, No. 36, Sanhao Street, Shenyang, 110004, People’s Republic of China, Tel/Fax +86-24-23925108, Email [email protected]
Propose: The co-treatment of ulcerative colitis with berberine hydrochloride (BBR), the Janus kinase(JAK) inhibitor Tofacitinib (TOFA), and Fligotinib (FIGA) is feasible and sophisticated in terms of mechanism. However, no studies have yet explored their interactions. This study aimed to establish a highly sensitive, specific, and reproducible HPLC-MS/MS method for investigating the pharmacokinetic interactions between BBR-TOFA and BBR-FIGA in rats.
Methods: The analytes and internal standards were extracted from rat plasma using a mixed solvent of dichloromethane and ether (3:2 ratio). The mobile phase comprised a mixture of methanol (containing 0.1% formic acid) and water (containing 0.1% formic acid and 2 mm ammonium acetate), with a flow rate of 0.6 mL/min. Elution was performed in a gradient mode on a Phenomenex Kinetex column (50× 3.0 mm, 2.6 μm). A systematic methodological validation was conducted according to the standards of the Chinese Pharmacopoeia, covering aspects such as specificity, calibration curve and linearity, residual effects, precision and accuracy, recovery, matrix effect, dilution integrity, and stability.
Results: All methodological validation parameters met the standards of the Chinese Pharmacopoeia, confirming the method’s suitability for simultaneously determining the concentrations of BBR, TOFA, and FIGA in rat plasma. Pharmacokinetic experimental results indicate that TOFA and FIGA have no significant effect on the plasma concentration of BBR across various pharmacokinetic parameters. However, due to BBR’s inhibition or induction of various drug-metabolizing enzymes, it significantly affects some of the pharmacokinetic parameters of TOFA and FIGA.
Keywords: HPLC-MS/MS, Validation, Drug-drug interaction, Berberine hydrochloride, Tofacitinib, Filgotinib
Graphical Abstract:

Introduction
Ulcerative Colitis (UC) is a chronic and recurrent autoimmune intestinal disease characterized clinically by chronic abdominal pain and diarrhea with mucous bloody stool, and pathologically by persistent inflammation of the colonic mucosa and submucosa.1 The etiology of UC is complex, mainly including dysbiosis of the intestinal microbiota, dysfunction of the immune system, genetic factors, and the role of cytokines,2,3 with intestinal flora disorder and immune imbalance becoming hot topics in the research of the pathogenesis of UC.4,5 Studies have shown that the gut microbiome is a microbial organ formed in conjunction with the host genotype, sensitive to growth processes and environmental exposures.6 It supports the development of the metabolic system and the maturation of the intestinal immune system by providing beneficial nutrients, such as synthesizing vitamins and short-chain fatty acids.7 The maturation of the immune system is also conducive to the stability of the intestinal flora.8 During bacterial or viral infections, or in disease states, dysbiosis of the gut microbiota leads to a decrease in the levels of beneficial metabolic products (such as butyrate and acetate) from intestinal bacteria, resulting in increased intestinal barrier permeability.9 Bacteria or lipopolysaccharide into the bloodstream and activate the immune system, causing a significant increase in pro-inflammatory factors such as IL-6, IFN-γ, CXCL-10, TNF-α, further exacerbating dysbiosis and disease progression.10 Therefore, more and more studies are focusing on the combined use of drugs that regulate the gut microbiota and immunomodulatory drugs to achieve efficient and synergistic treatment of UC.
In the inflamed mucosa of UC patients, significant activation of the signal transducer and activator of transcription (STAT3) molecule and related mucosal damage are driven by activators of the JAK/STAT signaling pathway, suggesting that JAK enzyme inhibitors could play an important role in the treatment of active UC.11 Tofacitinib(TOFA), a non-selective JAK enzyme inhibitor, inhibits the JAK-STAT signaling cascade and is commonly used in the clinical treatment of moderate to severe UC.12 However, because TOFA targets upstream signaling points, it can cause a variety of non-specific reactions and adverse effects such as hyperlipidemia, which limits its use.13 Filgotinib (FIGA), a novel JAK1 selective inhibitor, effectively reduces the adverse reactions caused by JAK2 inhibition due to its high selectivity for JAK1 and is commonly used in the clinical treatment of related inflammatory diseases, such as moderate to severe active rheumatoid arthritis, UC, and Crohn’s disease, with efficacy superior to first-line clinical treatments (aminosalicylates, glucocorticoids, and immunosuppressants).14 Dysbiosis of the intestinal flora is another characteristic of UC patients,6 thus restoring the gut microbiota to a normal state is equally crucial for the treatment of UC. Berberine hydrochloride (Berberine) is a quaternary ammonium salt alkaloid mainly extracted from traditional Chinese medicinal herbs such as coptis and other plants, commonly used in the treatment of infectious diseases of the digestive system.15 Studies have shown that berberine hydrochloride has shown great potential in treating UC, mainly due to its ability to reverse the decline in levels of lactobacilli, clostridia, and pseudomonads, increase microbial tryptophan metabolism, selectively enrich short-chain fatty acid-producing bacteria, and promote fermentation, thus repairing and protecting the intestinal mucosal barrier.16,17 Additionally, BBR can regulate intestinal immune imbalance to some extent by blocking the IL-6/STAT3/NF-κB signaling pathway and regulating the function of enteric glial cells, dendritic cells, and T cells.18,19 Importantly, the oral bioavailability of BBR is only 5%, which allows most of the drug to remain in the intestine and exert its effects, offering a significant advantage in regulating the gut microbiota.20 In summary, the combination of TOFA/FIGA with BBR for the treatment of UC is feasible and advanced mechanistically, and holds promise as a breakthrough drug combination for overcoming the therapeutic challenges of UC.
Combined medication is a commonly used strategy for disease treatment in clinical practice, which can synergistically enhance efficacy and significantly reduce adverse drug reactions.21 However, interactions between drugs, especially those based on pharmacokinetics, require careful attention. TOFA is primarily absorbed in the intestine via organic cation transporters (OCTs)22 and is metabolized in the liver by cytochrome P450 enzymes CYP3A4 and CYP2C19.23 Studies have shown that co-administration with potent CYP3A4 inhibitors (such as ketoconazole or fluconazole) significantly increases the concentration of TOFA in the body;24 conversely, co-administration with CYP3A4 inducers such as rifampin reduces the concentration and bioavailability of TOFA.25 FIGA is mainly metabolized by intestinal carboxylesterases (CES), with a minor portion metabolized by CYP3A4 in the liver.26 Additionally, FIGA is a substrate for P-glycoprotein(P-gp).27 Studies have shown that when co-administered with itraconazole, the Cmax of FIGA increased by 64% and bioavailability by 45%; however, co-administration with rifampin reduced the Cmax and bioavailability of FIGA by 26% and 27%, respectively.27 Although BBR has a low oral bioavailability, it is prone to drug interactions, which may be related to its extensive absorption and metabolic pathways.28 Firstly, the metabolism of BBR mainly occurs in the liver, predominantly metabolized by CYP2D6 and to a lesser extent by CYP3A4 and CYP1A2;29 secondly, BBR is a substrate for P-gp, OCTs, OATP1B1, and OATP1B3;30 thirdly, BBR can significantly inhibit transporters such as P-gp, OCTs, OATP1B1, and OATP1B3;31 finally, BBR can inhibit the activity of CYP2D6 and CYP2C9 and has potential bidirectional effects of induction and inhibition on CYP3A4.30,32 Therefore, studying the drug-drug interaction (DDI) between BBR, TOFA, and FIGA is of significant importance.
Several methods are available for in vivo drug analysis, including chemiluminescence, immunoassay, and chromatography, with the latter encompassing high-performance liquid chromatography (HPLC), gas chromatography (GC), and high-performance liquid chromatography-mass spectrometry (LC-MS/MS). Among these techniques, Ultra performance liquid chromatography-tandem mass spectrometry (HPLC-MS/MS) is the most commonly used method and the gold standard.33 This is primarily due to its advantages: 1) high selectivity and sensitivity of mass spectrometry, with detection limits reaching the picogram level; 2) low operational costs without the need for specialized reagent kits; 3) strong specificity, unaffected by metabolites or other drugs, making it particularly suitable for multiplex drug testing; and 4) the capacity for simultaneous detection of diverse medications and their metabolites.34
The objective of this study is to develop and validate a high-performance liquid chromatography-tandem mass spectrometry (HPLC-MS/MS) method for investigating drug-drug interactions (DDIs) between BBR and TOFA, as well as BBR and FIGA in rats. The method employs liquid-liquid extraction techniques to extract all analytes and internal standards (diazepam and tetrahydropalmatine). The results confirm that the established method satisfies all requirements for methodological validation and is capable of simultaneously determining the concentrations of BBR, TOFA, and FIGA in rat plasma. Pharmacokinetic results indicated the presence of DDIs between TOFA, FIGA, and BBR, which should be carefully considered during the development of combination formulations or in clinical co-administration.
Materials and Methods
Experimental Reagents
Tofacitinib (purity > 98%) and Filgotinib (purity > 98%) were sourced from MedChemExpress (Beijing, China). Berberine (purity > 98%) was obtained from Shanghai Hushi Chemical Co., Ltd. (Shanghai, China). HPLC-grade acetonitrile (ACN) and methanol (MeOH) were purchased from Fisher Scientific (Fair Lawn, NJ, USA). Tetrahydropalmatine and Diazepam were acquired from the National Institute for the Control of Pharmaceutical and Biological Products (Beijing, China). Ultrapure water (UPW) was produced using a Milli-Q water purification system (Millipore Corp., USA).
Animals
Thirty male Sprague-Dawley rats, weighing 200±20 g, were obtained from Beijing HFK Bio-Technology Co., Ltd. The rats were randomly divided into five groups, with six animals in each group. They were housed in a breeding room maintained at 25°C with 60 ± 5% humidity and a 12-hour dark-light cycle. The rats had ad libitum access to tap water and standard chow. They were acclimatized under these conditions for one week before the start of the experiments. The rats fasted for 12.0 hours but had free access to water prior to drug administration. This experiment was approved by the Ethics Committee of Shengjing Hospital, China Medical University, which adheres to the GB/T 35892-2018 national standard for experimental animal welfare ethical review guidelines, issued by the General Administration of Quality Supervision, Inspection and Quarantine of the People’s Republic of China and the Standardization Administration of China and the International Association for the Study of Pain Guidelines for the Care and Use of Laboratory Animals.
Equipment and Operating Conditions
Chromatographic Conditions
The chromatographic analysis was performed using a Phenomenex Kinetex column (50×3.0 mm, 2.6 μm) coupled with an Agilent Zorbax ODS pre-column (12.5 mm× 2.1 mm, 1.7 μm). The mobile phase consisted of methanol with 0.1% formic acid and water with 2.0 mm ammonium acetate and 0.1% formic acid, employed in a gradient elution. The flow rate was maintained at 0.6 mL/min, with a column temperature set at 40 °C. The injection volume was 2.0 μL. The gradient elution conditions are shown in Table 1. Diazepam(DZP) was used as the internal standard for TOFA and FIGA, while tetrahydropalmatine(TYP) served as the internal standard for BBR.
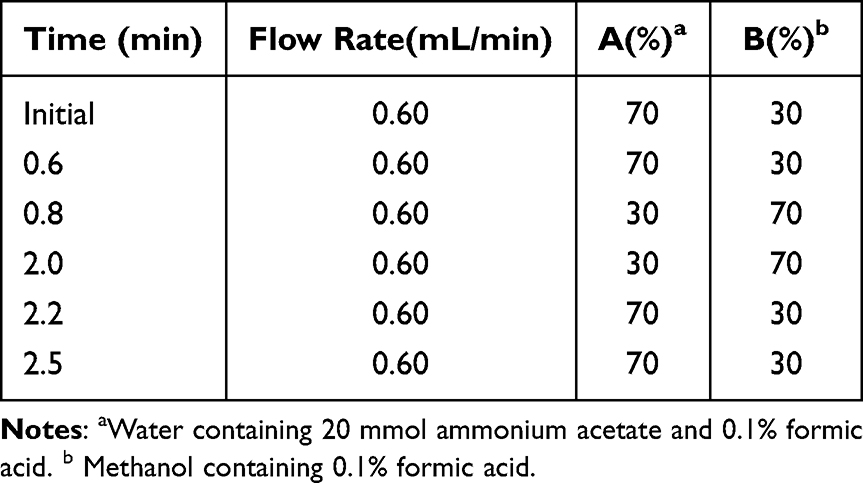 |
Table 1 Gradient Condition of HPLC for Analytes and ISs |
Mass Spectrometry Conditions
Ionization was achieved through electrospray ionization (ESI) in a triple quadrupole mass spectrometer. The operational parameters included an ion source temperature of 400 °C, curtain gas at 20 units, and an ion spray voltage of 4500 V. Detection was conducted in the multiple reaction monitoring (MRM) mode with positive ion scanning.
Stock Solutions, Quality Control Samples and Calibration Standards
Stock solutions of analytes and ISs were prepared by dissolving in methanol to obtain a final concentration of 200.0 μg/mL. A series of concentration standard solutions was prepared by diluting the above stock solution in 20% aqueous MeOH.
Calibration curves were prepared by adding 10 μL of the respective working solutions to 90.0 μL of drug-free rat plasma to produce the following calibration concentrations:0.1, 0.4, 2.0, 10.0, 40.0, 200.0 ng/mLfor BBR and 1.0, 4.0, 20.0,100.0, 400.0, 2000 ng/mL for TOFA and FIGA.
Quality control (QC) samples were prepared at the lower limit of quantification (LLOQ), low concentration quality control (LQC), medium concentration quality control (MQC) and high concentration quality control (HQC) separately according to the preparation method of the calibration curve, and the specific concentrations were as follows: 0.1, 0.2, 5.0 and 160.0 ng/mL for BBR; 1.0, 2.0, 50.0 and 1600.0 ng/mL for TOFA and FIGA. Both tetrahydropalmatine (TYP) and diazepam (DZP) solutions with 50ng/mL were obtained by diluting the stock solution with 20% aqueous MeOH.
Plasma Samples
A volume of 90.0 μL of plasma was transferred into a 5.0 mL plastic centrifuge tube with a cap. To this tube, 20.0 μL of IS solution (50.0 ng/mL) and 10.0 μL of methanol were added. The mixture was vortexed for 1.0 minute to ensure homogeneity. Subsequently, 2.0 mL of a mixed extraction solvent (dichloromethane:ether = 3:2) was added, followed by vortexing for 5.0 minutes. The mixture was then centrifuged at 4000.0 rpm for 5.0 minutes. The supernatant was carefully transferred to a 10.0 mL plastic centrifuge tube with a pointed bottom. The organic solvent was evaporated under a stream of nitrogen at 40°C. The residue was reconstituted in 500.0 μL of the mobile phase, centrifuged at 15000.0 rpm for 10.0 minutes, and 2.0 μL of the clear supernatant was injected into the chromatography system for analysis.
Method Validation
The validation procedures for selectivity, linearity, accuracy, precision, recovery and stability referred to the Chinese Pharmacopeia guidelines for bioanalytical method validation.
Specificity
The specificity of the established HPLC-MS/MS method was validated using blank plasma from six different batches of SD rats as the matrix. A volume of 90.0 μL of mixed blank plasma from six rats was processed according to the “Plasma Samples” section, with the exception of not adding the IS. An injection of 2.0 μL was made to obtain a blank chromatogram. A solution containing known concentrations of BBR, TOFA, FIGA, and the IS was added to the blank plasma and processed as per the “Plasma Samples” section. An injection of 2.0 μL was made to obtain a chromatogram of simulated plasma samples. Plasma samples collected after dosing the rats were also processed according to the “Plasma Sample Processing Method” section and injected (2.0 μL) to obtain plasma sample chromatograms. This procedure was employed to investigate whether endogenous substances in the blank plasma interfere with the determination of the analytes of interest.
Linearity, LLOQ and Carryover
A volume of 90.0 μL of blank plasma was spiked with 10.0 μL of standard solution and 20.0 μL of internal standard solution to prepare samples with plasma concentrations equivalent to 1.0, 4.0, 20.0, 100.0, 400.0, and 2000.0 ng/mL for TOFA and FIGA, and 0.1, 0.4, 2.0, 10.0, 40.0, and 200.0 ng/mL for BBR. The samples were processed according to the “Plasma Samples” section, and 2.0 μL of each was injected for analysis to record the chromatograms. The concentration of the analyte served as the x-axis, and the peak area ratio of the analyte to the internal standard was plotted on the y-axis. A weighted (W=1/x2) least squares regression was used to construct the calibration curve, with the equation of the linear regression representing the standard curve. The lowest point on the standard curve was considered as the LLOQ.
After injecting the highest point on the standard curve (ULOQ), a 2.0 μL sample of blank plasma was analyzed to assess the residual effects of the analytes and the internal standard. The residual peak area of the analytes should not exceed 20% of the LLOQ peak area, and the internal standard residual peak area should be less than 5% of the internal standard peak area.
Accuracy and Precision
A volume of 90.0 μL of blank plasma was prepared according to the “calibration standards” section, selecting the LLOQ and three QC concentration levels to evaluate the precision and accuracy of the developed HPLC-MS/MS method. The concentration levels for BBR were set at 0.1 ng/mL, 0.2 ng/mL, 5.0 ng/mL, and 160.0 ng/mL. For TOFA and FIGA, concentration levels were set at 1.0 ng/mL, 2.0 ng/mL, 50.0 ng/mL, and 1600.0 ng/mL, with six samples per concentration level. The procedure was conducted according to the “Plasma Sample”section, with the measurements taken consecutively over three days. Concentrations for the LLOQ and QC samples were calculated based on the daily standard curve, and the results were used to determine the method’s accuracy and precision.
Recovery and Matrix Effect
A volume of 90.0 μL of blank plasma was prepared according to the “Calibration standards”section to create quality control (QC) samples of low, medium, and high concentrations of BBR, TOFA, and FIGA, with six samples per concentration level. The process was conducted in accordance with the “Plasma sample” section to obtain peak area A. Additionally, 90.0 μL of blank plasma was taken and 2.0 mL of mixed extraction solvent was added, followed by vortexing for 5.0 min and centrifuging at 4000.0 rpm for 5.0 min. The supernatant was then transferred into a 10.0 mL pointed-bottom plastic tube, to which 10.0 mL of standard solution and 20.0 mL of internal standard solution were added. The remaining steps were performed as described in the “Plasma sample” section to obtain peak area B. Similarly, 90.0 μL of water was processed with 2.0 mL of mixed extraction solvent, followed by vortexing for 5.0 min and centrifuging at 4000.0 rpm for 5.0 min. The supernatant was transferred into a 10.0 mL pointed-bottom plastic tube, and 10.0 mL of standard solution and 20.0 mL of internal standard solution were added. The remaining steps were conducted as outlined in the “Plasma sample” section to obtain peak area C. The extraction recovery was calculated based on the ratio of peak areas A/B for each concentration, and the matrix effect was determined by the ratio of peak areas B/C.
Stability
QC samples of low, medium, and high concentrations of BBR, TOFA, and FIGA were prepared, with four samples per concentration, to assess the stability of the samples under various conditions. The stability tests included freeze-thaw cycle stability (three cycles at −20.0 °C), room temperature stability (placed at room temperature for 4.0 hours), and autosampler stability (placed in an autosampler at 4.0 °C for 6.0 hours).
Dilution Integrity
Simulated plasma samples of TOFA and FIGA with concentrations of 16.0 and 32.0 μg/mL, as well as BBR with concentrations of 1.6 and 3.2 μg/mL, were prepared. These samples were then diluted with blank plasma to the HQC level, with four samples per concentration, and processed according to the “Plasma sample” section. The relative deviation between the measured values and the theoretical values in the dilution test should be less than ±15%.
Procedure
After a 14-day acclimation period, rats were subjected to a drug interaction study, with food withheld the night before dosing but not water. The experiment was divided into five groups, each consisting of six rats, as detailed below: The first group received BBR alone, administered orally as a suspension at a dose of 60 mg/kg. The second group received TOFA alone, administered orally as a suspension at a dose of 20 mg/kg. The third group received FIGA alone, administered orally as a suspension at a dose of 10 mg/kg. The fourth group received a combination of BBR and TOFA, administered orally as separate suspensions at doses of 60 mg/kg and 20 mg/kg, respectively. The fifth group received a combination of BBR and FIGA, administered orally as separate suspensions at doses of 60 mg/kg and 10 mg/kg, respectively. All drug suspensions were prepared using a 0.5% solution of sodium carboxymethyl cellulose. The suspensions were stirred thoroughly before administration to ensure accurate dosing.
Blood samples (0.3 mL) were collected from the orbital plexus at pre-dose and at 0.25 h, 0.5 h, 1.0 h, 2.0 h, 3.0 h, 5.0 h, 7.0 h, 12.0 h, 24.0 h, 36.0 h, 48.0 h, and 72.0 h post-dose. Samples were centrifuged at 4000.0 rpm for 5 minutes, and the plasma was then frozen and stored for analysis.
Pharmacokinetic parameters were analyzed using DAS3.0 software, including peak plasma concentration (Cmax), time to reach peak concentration (Tmax), area under the plasma concentration-time curve (AUC), apparent plasma clearance (CL), and elimination half-life (t1/2). All pharmacokinetic parameters were presented as mean ± SD. The statistical analyses were performed using GraphPad Prism. For the pharmacokinetic parameters of BBR, which included data from multiple groups (Mono-BBR, BBR+TOF, BBR+FILG), a one-way analysis of variance (ANOVA) was employed to assess the overall differences among the groups. Prior to conducting the ANOVA, the normality of the data distribution in each group was comprehensively evaluated through a dual approach: statistical testing using the Shapiro–Wilk test combined with graphical assessment via Q-Q plots. Given the relatively small sample size per group, this combined methodology was adopted to enhance the robustness of normality evaluation, as the Shapiro–Wilk test alone may have limited power in small sample scenarios. The homogeneity of variance was examined using Levene’s test. When both quantitative (Shapiro–Wilk test) and qualitative (Q-Q plot visualization) assessments indicated normality and homogeneity of variance, a one-way ANOVA was performed. When the ANOVA result indicated a significant difference among the groups, post-hoc multiple comparison tests (Tukey’s test) were carried out to identify which specific groups differed from each other. A P-value < 0.05 was considered statistically significant. For the comparison of the pharmacokinetic parameters of FILG between the Mono-FILG and FILG+BBR, as well as the comparison of the pharmacokinetic parameters of TOF between relevant groups, an unpaired t-test was used. Consistent with the ANOVA approach, the normality assumption was verified through both the Shapiro–Wilk test and visual inspection of Q-Q plots, while the homogeneity of variance was evaluated using Levene’s test. The combination of statistical testing and graphical analysis was particularly emphasized in these pairwise comparisons to ensure appropriate test selection. After confirming that the data met the assumptions of normality and homogeneity of variance through these evaluations, the unpaired t-test was performed. A P-value < 0.05 was considered statistically significant.
Results
Mass Spectrometry
To optimize the most sensitive ionization mode for TOFA, FIGA, BBR and the IS, ESI full scans were carried out in both positive and negative ion detection modes. It was found that both the analytes and the IS had better response in the positive ion mode. Under these chromatographic conditions, the retention times of each analyte was as follows: 0.82min for TOFA, 1.71min for FIGA, 1.58min for BBR, 2.13min for DZP and 1.49min for TYP. Meanwhile, the MS conditions for collision energy, declustering voltage, source temperature, ionization mode, curtain gas, etc. were systematically optimized. The MS parameters, final ion pairs and ion spectra are shown in Table 2 and Figure 1.
 |
Table 2 Transition Reactions of BBR, TOFA, FIGA and ISs (DZP, TYP) |
 |
Figure 1 The diagrams of daughter scan of BBR, TOFA, FIGA, DZP and TYP. |
Method Validation
The developed HPLC-MS/MS method were validated using blank plasma from rats according to the requirements and standards of the Chinese Pharmacopeia guidelines. The results of method validation showed that all items met the standards.
Specificity
The specificity assay results demonstrated that endogenous substances in blank plasma did not interfere with the determination of the analytes. The retention times for BBR, TOFA, FIGA, DZP, and TYP were 1.58 min, 0.82 min, 1.71 min, 2.13 min, and 1.49 min, respectively. Chromatograms are shown in Figure 2.
 |
Figure 2 Representative HPLC-MS/MS chromatograms for BBR, TOFA, FIGA, DZP and TYP in rats plasma samples: (A) a blank plasma sample; (B) a blank plasma sample spiked with analytes and IS, and (C) plasma sample of a rat post-dosing. |
Linearity, LLOQ and Carryover
The results for standard curves and linear ranges showed that the regression equation for BBR was y=0.0181x+0.04(r = 0.9991), with a linear range of 0.1 to 200.0 ng/mL. The linear relationship was good, and the lower limit of quantification (LLOQ) was 0.1 ng/mL. The regression equations for FIGA and TOFA were y =0.0311x+0.05(r = 0.9958) and y=0.0397x+0.05(r = 0.9968), respectively, both with a linear range of 1.0 to 2000.0 ng/mL. The linear relationships were satisfactory, with an LLOQ of 1.0 ng/mL for both compounds. The results for residual effects indicated that the residual effects of the analytes and the internal standard were within acceptable limits. Notably, the residual effect for BBR was relatively pronounced. However, this effect could be essentially disregarded after changing the needle wash solution to a stronger solvent system (isopropanol: methanol: water = 1:1:1).
Precision and Accuracy
The results for precision and accuracy are shown in Table 3. The intra-day and inter-day precision (RSD) and accuracy (RE) for TOFA, FIGA, and BBR were all less than 15.0%, meeting the requirements for methodological validation. This indicates that the established HPLC-MS/MS method possesses good precision and accuracy, ensuring the reliability of the in vivo drug measurement results.
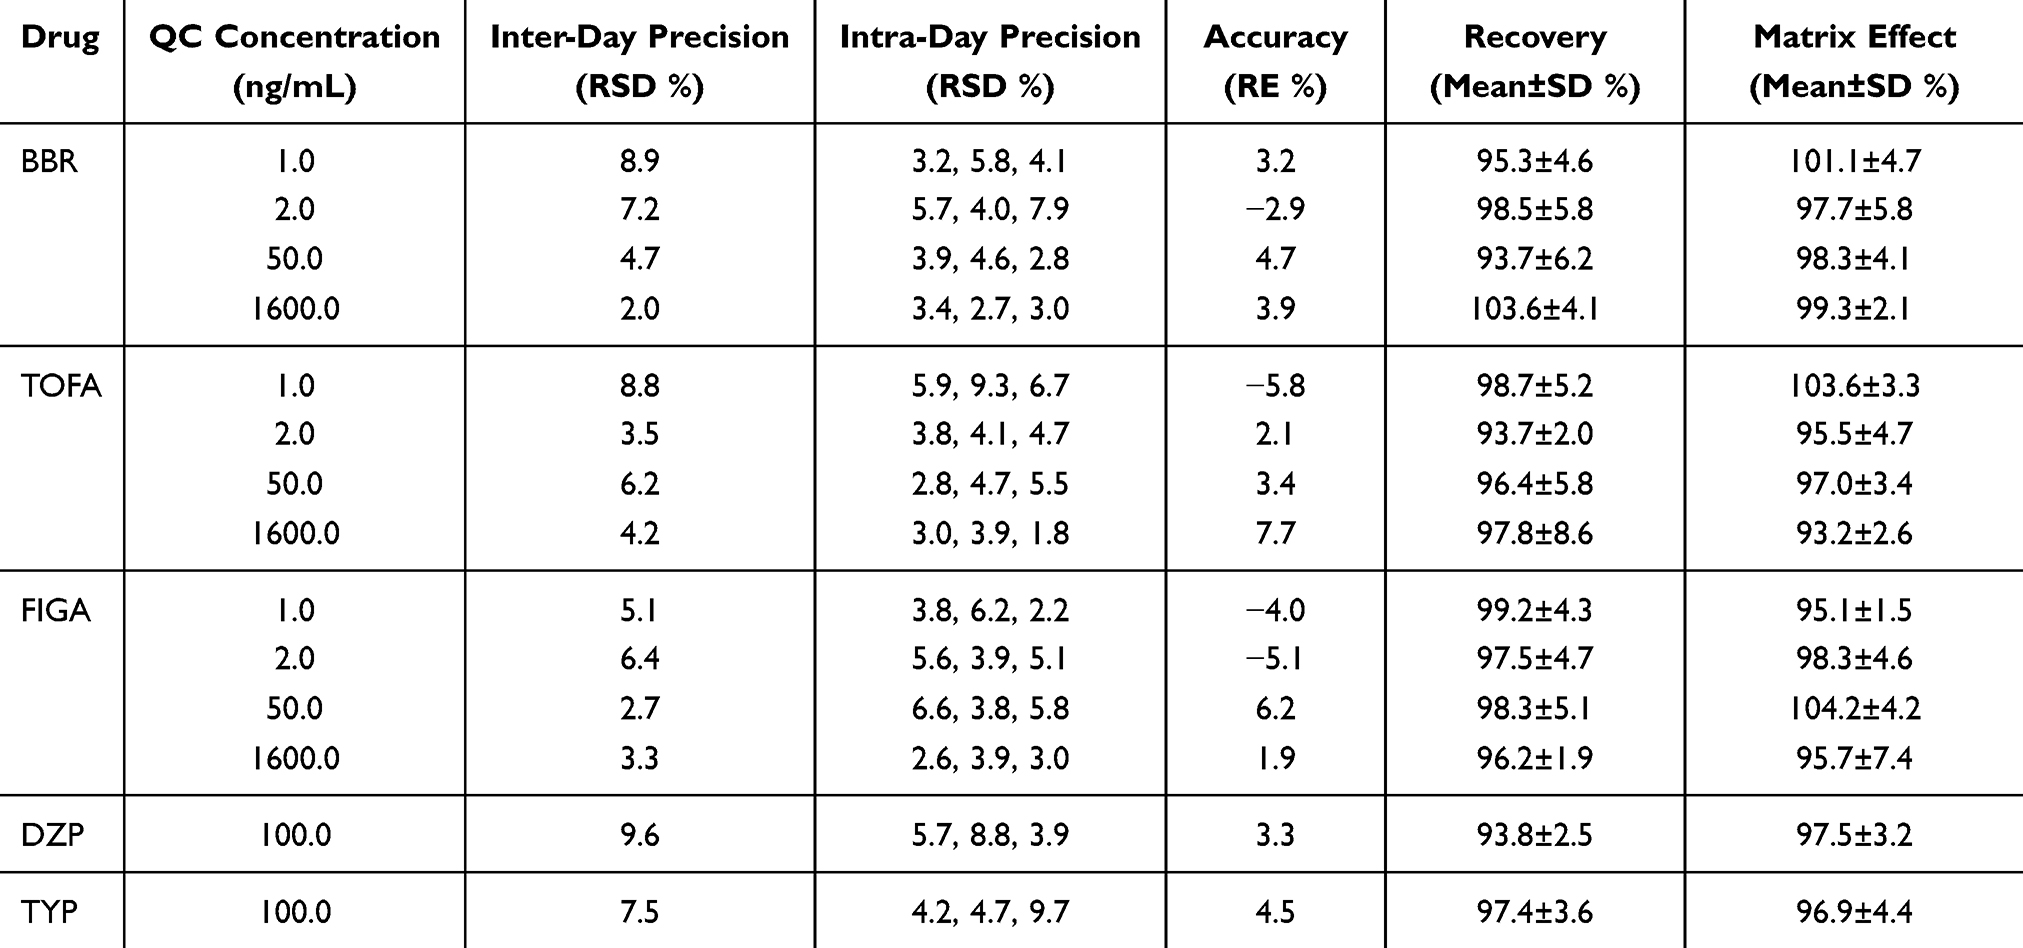 |
Table 3 Methodology Verification Results of Precision, Accuracy, Recovery and Matrix Effect |
Recovery and Matrix Effect
The results for recovery and matrix effect are shown in Table 3. The extraction recovery rates for TOFA, FIGA, and BBR were between 93.7–98.7%, 93.7–103.6%, and 96.2–99.2%, respectively. The recovery rates for the ISs DZP and TYP were 93.8% and 97.4%, respectively. These results indicate that liquid-liquid extraction effectively separates the drugs from plasma, with high and stable recovery rates that meet the standards required for methodological validation. The matrix effect results showed that the matrix effects for TOFA, FIGA, and BBR were 93.2–103.6%, 95.1–104.2%, and 97.7–101.1%, respectively, while the matrix effects for the ISs DZP and TYP were 97.5% and 96.9%, respectively. These findings are in accordance with the standards for methodological validation, further indicating that the established HPLC-MS/MS method and drug extraction technique are appropriate. The endogenous substances in plasma did not produce significant matrix effects, thus not affecting the accuracy of the analyte and internal standard measurements.
Stability
The results of the stability assessment are presented in Table 4. The simulated plasma samples of TOFA, FIGA, and BBR were found to be stable under conditions of freeze-thaw cycles, room temperature storage, and autosampler storage, with all relative errors (RE %) being less than 15.0%. These results meet the necessary requirements for stability.
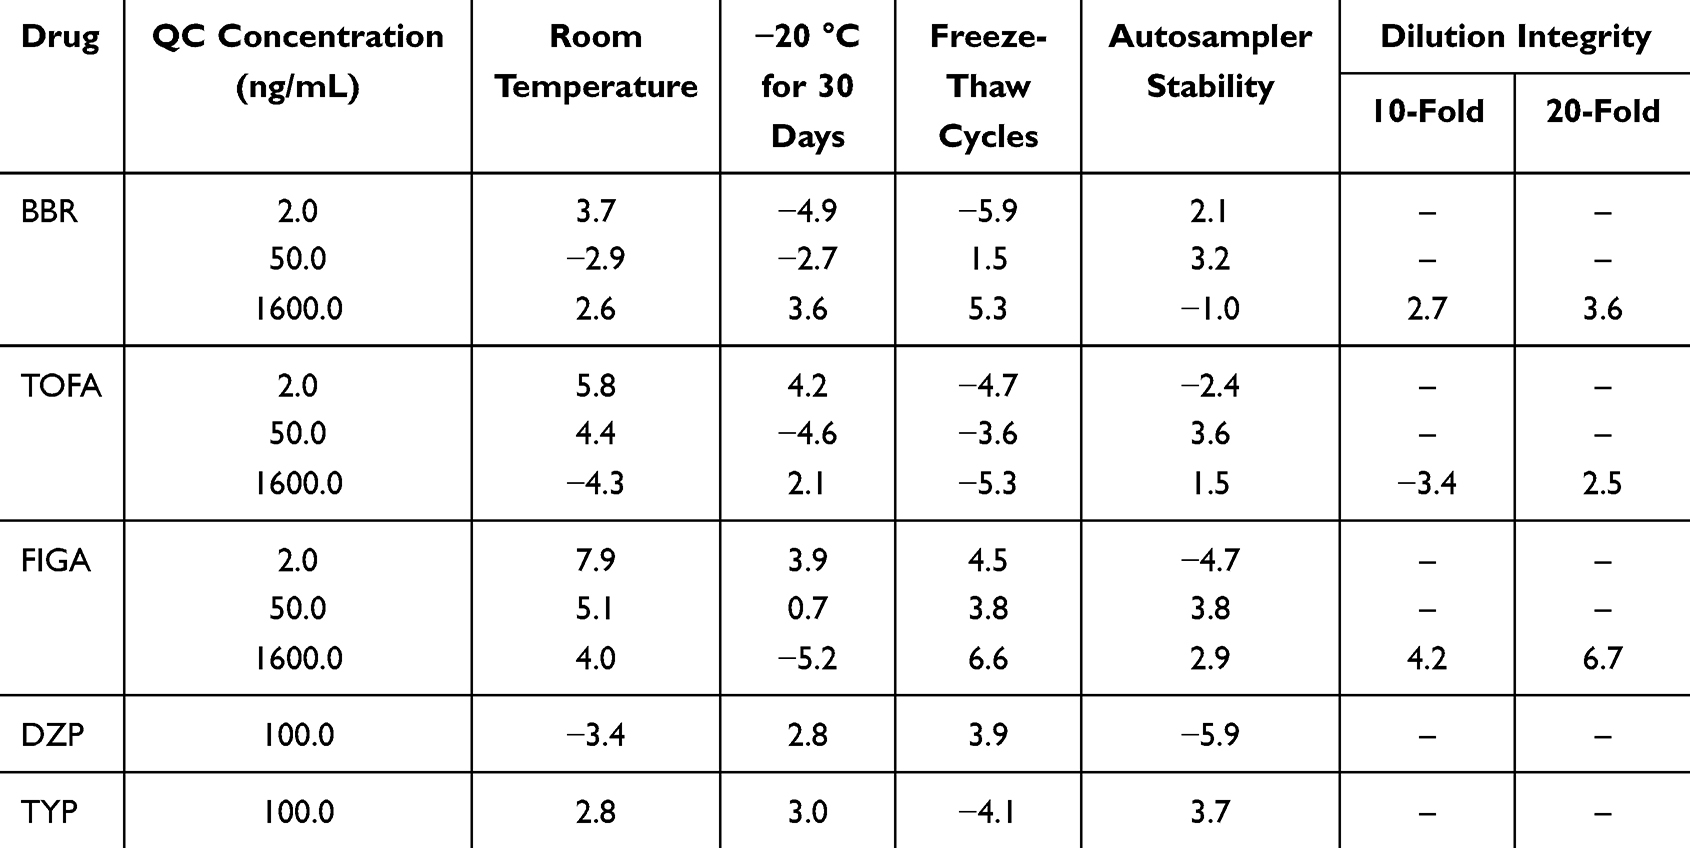 |
Table 4 Stability of Analytes and ISs Under Various Storage Conditions (RE %, n=4) |
Dilution Integrity
The relative errors (RE%) between the measured values and theoretical values of the diluted simulated plasma samples of TOFA, FIGA, and BBR all met the required criteria, indicating that dilution does not affect the accuracy of this method. Specific results are provided in Table 4.
Pharmacokinetic Analysis
A systematic study on the pharmacokinetics and interactions of TOFA, FIGA, and BBR in rats was conducted using the established HPLC-MS/MS method. The pharmacokinetic profiles are illustrated in Figures 3–5, while the results of the pharmacokinetic parameters are presented in Table 5.
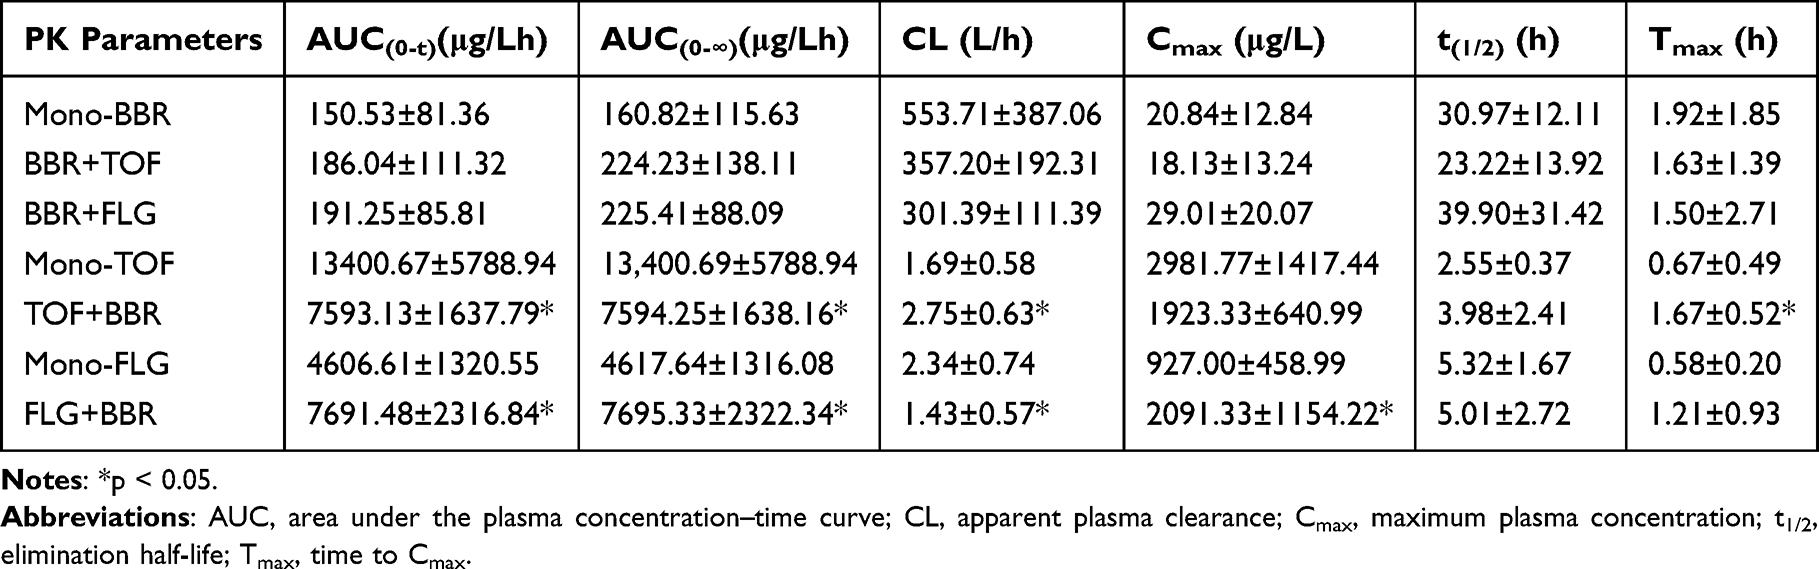 |
Table 5 Pharmacokinetic Parameters of BBR, TOFA and FIGA in Rats (Data are Means ± SD, n =6) |
 |
Figure 3 Mean plasma concentration profiles of BBR in rats plasma after oral administration of BBR with and without coadministration of TOFA and FIGA (n = 6). |
 |
Figure 4 Mean plasma concentration profiles of TOFA in rats plasma after oral administration of BBR with co-administration of TOFA (n = 6). |
 |
Figure 5 Mean plasma concentration profiles of FIGA in rats plasma after oral administration of BBR with co-administration of FIGA (n = 6). |
As shown in Figure 3, the concomitant use of TOFA and FIGA does not significantly affect the pharmacokinetic behavior of BBR in rats, with no significant differences observed in the pharmacokinetic parameters. The reasons are analyzed as follows: On one hand, BBR belongs to Class IV in the Biopharmaceutics Classification System, characterized by poor solubility and permeability, and it is also a good substrate for P-gp, leading to its oral bioavailability being lower than 5%.35 Conventional methods to enhance absorption, such as the co-use of absorption enhancers, preparation of phospholipid complexes, or the use of P-gp inhibitors, also cannot significantly increase its bioavailability.36 On the other hand, after BBR enters the bloodstream, it is rapidly distributed to various tissues, often resulting in tissue drug concentrations that are higher than plasma drug concentrations.37 Furthermore, TOFA and FIGA do not have significant inducing or inhibiting effects on the metabolic enzymes CYP450 and various transporters for BBR. Therefore, the co-use of TOFA and FIGA has a minimal impact on the bioavailability of BBR, and the drug interaction between them is not significant.
As illustrated in Figure 4, the concurrent use of BBR significantly alters the pharmacokinetic behavior of TOFA in vivo. Compared to the administration of TOFA alone, the combination with BBR resulted in a 1.76-fold decrease in AUC(0-t) and a 1.55-fold decrease in Cmax, while the CL increased by 1.63-fold and the time to peak concentration increased by 2.49-fold, all of which were statistically significant. This effect is likely related to the absorption pathway of TOFA. Studies have shown that TOFA is primarily absorbed through the gastrointestinal OCT,22 and BBR has a significant inhibitory effect on OCT.38,39 This inhibition leads to impaired absorption of TOFA and changes in its pharmacokinetic parameters.
As shown in Figure 5, the concurrent use of berberine hydrochloride also significantly alters the pharmacokinetic behavior of FIGA in vivo. Compared to the administration of FIGA alone, the combination with berberine hydrochloride resulted in a 1.67-fold increase in AUC(0-t) and a 2.26-fold increase in Cmax, while the CL decreased by 1.64-fold and the Tmax decreased by 2.09-fold, all of which were statistically significant. The analysis for these effects is as follows: 1) FIGA is primarily metabolized in the intestines by CES, especially CES2,26,27 and partly metabolized in the liver by the CYP3A4 enzyme. However, studies have shown that BBR and its metabolites are strong inhibitors of the CES2 enzyme.40 Given the low oral bioavailability and high intestinal concentration of BBR, and the fact that CES2 is mainly distributed in the intestines, berberine hydrochloride can enhance the absorption of FIGA by inhibiting the CES2; 2) Research indicates that although BBR is a substrate for CYP3A4, it exhibits a significant inhibitory effect on CYP3A4, affecting the liver metabolism rate of other CYP3A4 substrates.29 Since a small portion of FIGA is metabolized by CYP3A4,41 the inhibition of CYP3A4 by berberine hydrochloride leads to reduced metabolism of TOFA, thereby causing an increase in plasma drug concentration.
Discussion
This study successfully established and validated an HPLC-MS/MS method to simultaneously determine the concentrations of BBR, TOFA, and FIGA in rat plasma and investigate their drug interactions. The results provide valuable insights into the pharmacokinetic behavior of these drugs when used in combination, which is crucial for the treatment of UC.
The established HPLC-MS/MS method demonstrated excellent performance in all validation parameters, meeting the requirements of the Chinese Pharmacopeia. This method’s high sensitivity, specificity, and reproducibility enable accurate quantification of BBR, TOFA, and FIGA in rat plasma, ensuring the reliability of the subsequent pharmacokinetic and drug interaction studies. The validation results, such as the linearity, precision, accuracy, recovery, matrix effect, dilution integrity, and stability, are consistent with previous studies on similar analytical methods.33,42,43 This indicates that the developed method can be effectively applied to in-vivo drug analysis, providing a reliable tool for studying the pharmacokinetics of these drugs in complex biological matrices.
In terms of pharmacokinetic interactions, our findings show that TOFA and FIGA have no significant effect on the plasma concentration of BBR. BBR’s low oral bioavailability, poor solubility, and permeability, along with its role as a P-gp substrate, contribute to its stable pharmacokinetic profile when co-administered with TOFA and FIGA.35 TOFA and FIGA do not strongly influence the metabolic enzymes and transporters related to BBR, which further explains the lack of significant interaction. This is in line with previous research on drugs with similar biopharmaceutics classification characteristics, where drugs with poor absorption are less likely to be affected by co-administered drugs that do not directly target their limited absorption pathways.
Conversely, BBR significantly affects the pharmacokinetic parameters of TOFA and FIGA. For TOFA, co-administration with BBR led to a decrease in AUC(0-t) and Cmax and an increase in CL and Tmax. This is likely due to BBR’s inhibitory effect on OCT, which is the main absorption pathway for TOFA.22 The inhibition of OCT reduces TOFA’s absorption, resulting in lower plasma concentrations and altered pharmacokinetic behavior. Similar drug-transporter interactions have been reported in other studies, where inhibitors of transporters can significantly impact the absorption and pharmacokinetics of substrate drugs.44
Regarding FIGA, co-administration with BBR increased AUC(0-t) and Cmax and decreased CL and Tmax. This is mainly attributed to BBR’s inhibition of CES2, the primary metabolic enzyme for FIGA in the intestines, and its inhibitory effect on CYP3A4, which also metabolizes FIGA to a certain extent.40 By inhibiting CES2, BBR reduces FIGA’s intestinal metabolism, enhancing its absorption. The inhibition of CYP3A4 further decreases FIGA’s liver metabolism, leading to increased plasma concentrations. These findings are consistent with the known inhibitory effects of BBR on drug-metabolizing enzymes and highlight the importance of considering enzyme-substrate interactions when combining drugs.45
From a clinical perspective, these results have significant implications for the treatment of UC. TOFA and FIGA are JAK inhibitors commonly used to treat UC, and BBR shows potential in regulating the gut microbiota and immune responses, which could potentially enhance the efficacy of TOFA and FIGA.14,17 However, the significant pharmacokinetic interactions between BBR and these JAK inhibitors must be carefully considered. Altered pharmacokinetic parameters may lead to changes in drug efficacy and an increased risk of adverse reactions. For instance, in dosing, when co-administering BBR with TOFA, clinicians may need to consider increasing the dose of TOFA to maintain its therapeutic levels, given the decrease in its plasma concentration. On the other hand, when using BBR with FIGA, the increased plasma concentration of FIGA due to BBR interaction may require dose reduction to mitigate the risk of side effects. These dosing adjustments should be further explored in clinical trials. As an illustration, the decreased plasma concentration of TOFA when co-administered with BBR may reduce its therapeutic effect, while the increased concentration of FIGA may increase the risk of side effects.13
When comparing our results with existing literature, the drug-drug interactions discovered in this study are consistent with the general understanding of BBR’s interaction potential. BBR has been reported to interact with various drugs through its effects on drug-metabolizing enzymes and transporters.29 However, this is one of the few studies specifically investigating the interactions between BBR, TOFA, and FIGA. Future research could further explore the long-term effects of these drug combinations on UC treatment, including the impact on clinical outcomes, safety profiles, and the potential for dose optimization. Future research should focus on conducting clinical studies in UC patients to confirm these pharmacokinetic interactions. Such studies can explore the long - term effects of these drug combinations on UC treatment, including the impact on clinical outcomes, safety profiles, and the potential for dose optimization. This will provide more accurate guidance for clinical practice, ensuring the safe and effective use of these drugs in combination for UC patients. Additionally, studies in human subjects are needed to confirm these findings and provide more accurate guidance for clinical practice.
In conclusion, this study not only established a reliable analytical method but also revealed important pharmacokinetic interactions between BBR, TOFA, and FIGA. These results contribute to a better understanding of the complex relationships between these drugs and provide a basis for more rational drug use in the treatment of UC. Clinicians should be aware of these interactions when prescribing BBR in combination with TOFA or FIGA to ensure the safety and efficacy of treatment. It is essential that further clinical studies in UC patients are carried out to translate these pre-clinical findings into practical clinical guidelines, thereby optimizing the therapeutic approach for UC patients using these drug combinations.
Acknowledgments
This study had no financial support. All authors made a significant contribution to the work reported, whether that is in the conception, study design, execution, acquisition of data, analysis and interpretation, or in all these areas; took part in drafting, revising or critically reviewing the article; gave final approval of the version to be published; have agreed on the journal to which the article has been submitted; and agree to be accountable for all aspects of the work.
Disclosure
The authors declare that they have no known competing financial interests or personal relationships that could have appeared to influence the work reported in this paper.
References
1. Conrad K, Roggenbuck D, Laass MW. Diagnosis and classification of ulcerative colitis. Autoimmunity Reviews. 2014;13(4–5):463–466. doi:10.1016/j.autrev.2014.01.028
2. Kobayashi T, Siegmund B, Le Berre C, et al. Ulcerative colitis. Nat Rev Dis Primers. 2020;6(1):74. doi:10.1038/s41572-020-0205-x
3. Nakase H, Sato N, Mizuno N, Ikawa Y. The influence of cytokines on the complex pathology of ulcerative colitis. Autoimmunity Reviews. 2022;21(3):103017. doi:10.1016/j.autrev.2021.103017
4. Postler TS, Ghosh S. Understanding the Holobiont: how Microbial Metabolites Affect Human Health and Shape the Immune System. Cell Metabolism. 2017;26(1):110–130. doi:10.1016/j.cmet.2017.05.008
5. Longman RS, Littman DR. The functional impact of the intestinal microbiome on mucosal immunity and systemic autoimmunity. Current Opinion in Rheumatology. 2015;27(4):381–387. doi:10.1097/BOR.0000000000000190
6. She -J-J, Liu W-X, Ding X-M, et al. Defining the biogeographical map and potential bacterial translocation of microbiome in human ‘surface organs’. Nature Communications. 2024;15(1). doi:10.1038/s41467-024-44720-6.
7. Campos-Perez W, Martinez-Lopez E. Effects of short chain fatty acids on metabolic and inflammatory processes in human health. Biochimica Et Biophysica Acta (BBA) - Molecular and Cell Biology of Lipids. 2021;1866(5):158900. doi:10.1016/j.bbalip.2021.158900
8. Zhang M, Sun K, Wu Y, Yang Y, Tso P, Wu Z. Interactions between Intestinal Microbiota and Host Immune Response in Inflammatory Bowel Disease. Frontiers in Immunology. 2017;8. doi:10.3389/fimmu.2017.00942
9. Hughes ER, Winter MG, Duerkop BA, et al. Microbial Respiration and Formate Oxidation as Metabolic Signatures of Inflammation-Associated Dysbiosis. Cell Host & Microbe. 2017;21(2):208–219. doi:10.1016/j.chom.2017.01.005
10. Le Berre C, Honap S, Peyrin-Biroulet L. Ulcerative colitis. The Lancet. 2023;402(10401):571–584. doi:10.1016/S0140-6736(23)00966-2
11. Salas A, Hernandez-Rocha C, Duijvestein M, et al. JAK–STAT pathway targeting for the treatment of inflammatory bowel disease. Nature Reviews Gastroenterology & Hepatology. 2020;17(6):323–337. doi:10.1038/s41575-020-0273-0
12. Sandborn WJ, Su C, Sands BE, et al. Tofacitinib as Induction and Maintenance Therapy for Ulcerative Colitis. New England Journal of Medicine. 2017;376(18):1723–1736. doi:10.1056/NEJMoa1606910
13. Sands BE, Colombel J-F, Ha C, et al. Lipid Profiles in Patients With Ulcerative Colitis Receiving Tofacitinib—Implications for Cardiovascular Risk and Patient Management. Inflammatory Bowel Diseases. 2021;27(6):797–808. doi:10.1093/ibd/izaa227
14. Traves PG, Murray B, Campigotto F, Galien R, Meng A, Di Paolo JA. JAK selectivity and the implications for clinical inhibition of pharmacodynamic cytokine signalling by filgotinib, upadacitinib, tofacitinib and baricitinib. Annals of the Rheumatic Diseases. 2021;80(7):865–875. doi:10.1136/annrheumdis-2020-219012
15. Jamshaid F, Dai J, Yang LX. New Development of Novel Berberine Derivatives against Bacteria. Mini-Reviews in Medicinal Chemistry. 2020;20(8):716–724. doi:10.2174/1389557520666200103115124
16. Roager HM, Licht TR. Microbial tryptophan catabolites in health and disease. Nature Communications. 2018;9(1). doi:10.1038/s41467-018-05470-4
17. Yang T, Qin N, Liu F, Zhao Y, Liu W, Fan D. Berberine regulates intestinal microbiome and metabolism homeostasis to treat ulcerative colitis. Life Sciences. 2024;338:1.
18. Li H, Fan C, Lu H, et al. Protective role of berberine on ulcerative colitis through modulating enteric glial cells–intestinal epithelial cells–immune cells interactions. Acta Pharmaceutica Sinica B. 2020;10(3):447–461. doi:10.1016/j.apsb.2019.08.006
19. Jiang Y, Zhao L, Chen Q, Zhou L, Chen G. Exploring the Mechanism of Berberine Intervention in Ulcerative Colitis from the Perspective of Inflammation and Immunity Based on Systemic Pharmacology. Evidence-Based Complementary and Alternative Medicine. 2021;2021:1–11.
20. Chen W, Miao Y-Q, Fan D-J, et al. Bioavailability Study of Berberine and the Enhancing Effects of TPGS on Intestinal Absorption in Rats. AAPS PharmSciTech. 2011;12(2):705–711. doi:10.1208/s12249-011-9632-z
21. Cheng F, Kovacs IA, Barabasi AL. Network-based prediction of drug combinations. Nat Commun. 2019;10(1):1197. doi:10.1038/s41467-019-09186-x
22. Klamerus KJ, Alvey C, Li L, et al. Evaluation of the potential interaction between tofacitinib and drugs that undergo renal tubular secretion using metformin, an in vivo marker of renal organic cation transporter 2. Clinical Pharmacology in Drug Development. 2014;3(6):499–507. doi:10.1002/cpdd.120
23. Guo X, Li W, Li Q, et al. Tofacitinib Is a Mechanism-Based Inactivator of Cytochrome P450 3A4. Chem Res Toxicol. 2019;32(9):1791–1800. doi:10.1021/acs.chemrestox.9b00141
24. Lee JS, Kim HS, Jung YS, Choi HG, Kim SH. Pharmacokinetic Drug Interaction between Tofacitinib and Voriconazole in Rats. Pharmaceutics. 2021;13(5):740. doi:10.3390/pharmaceutics13050740
25. Lundquist LM, Cole SW, Sikes ML. Efficacy and safety of tofacitinib for treatment of rheumatoid arthritis. World J Orthop. 2014;5(4):504–511. doi:10.5312/wjo.v5.i4.504
26. Namour F, Desrivot J, Van der Aa A, Harrison P, Tasset C, Van`t Klooster G. Clinical Confirmation that the Selective JAK1 Inhibitor Filgotinib (GLPG0634) has a Low Liability for Drug-drug Interactions. Drug Metabolism Letters. 2016;10(1):38–48. doi:10.2174/1872312810666151223103353
27. Namour F, Anderson K, Nelson C, Tasset C. Filgotinib: a Clinical Pharmacology Review. Clin Pharmacokinet. 2022;61(6):819–832. doi:10.1007/s40262-022-01129-y
28. Zhao J, Zhou T, Lu JZ, et al. Intra-Herb Interactions: primary Metabolites in Coptidis Rhizoma Extract Improved the Pharmacokinetics of Oral Berberine Hydrochloride in Mice. Front Pharmacol. 2021;12:675368. doi:10.3389/fphar.2021.675368
29. Guo Y, Chen Y, Tan Z-R, Klaassen CD, Zhou H-H. Repeated administration of berberine inhibits cytochromes P450 in humans. European Journal of Clinical Pharmacology. 2011;68(2):213–217. doi:10.1007/s00228-011-1108-2
30. Kim HG, Lee HS, Jeon JS, et al. Quasi-Irreversible Inhibition of CYP2D6 by Berberine. Pharmaceutics. 2020;12(10):916. doi:10.3390/pharmaceutics12100916
31. Haberkorn B, Fromm MF, Konig J. Transport of Drugs and Endogenous Compounds Mediated by Human OCT1: studies in Single- and Double-Transfected Cell Models. Front Pharmacol. 2021;12:662535. doi:10.3389/fphar.2021.662535
32. Li G, Zhao M, Zhao L. The drug interaction potential of berberine hydrochloride when co-administered with simvastatin, fenofibrate, gemfibrozil, metformin, glimepiride, nateglinide, pioglitazone and sitagliptin in beagles. Arabian Journal of Chemistry. 2022;15(2):1.
33. Yu M, Yang J, Xiong L, et al. Comparison of ultra-performance liquid chromatography-tandem mass spectrometry (UPLC-MS/MS) and enzyme-multiplied immunoassay technique (EMIT) for quantification of voriconazole plasma concentration from Chinese patients. Heliyon. 2023;9(11):e22015. doi:10.1016/j.heliyon.2023.e22015
34. López-Ruiz R, Romero-González R, Garrido Frenich A. Ultrahigh-pressure liquid chromatography-mass spectrometry: an overview of the last decade. TrAC Trends in Analytical Chemistry. 2019;118:170–181. doi:10.1016/j.trac.2019.05.044
35. Kwon M, Lim DY, Lee CH, Jeon JH, Choi MK, Song IS. Enhanced Intestinal Absorption and Pharmacokinetic Modulation of Berberine and Its Metabolites through the Inhibition of P-Glycoprotein and Intestinal Metabolism in Rats Using a Berberine Mixed Micelle Formulation. Pharmaceutics. 2020;12(9):882. doi:10.3390/pharmaceutics12090882
36. Mujtaba MA, Akhter MH, Alam MS, Ali MD, Hussain A. An Updated Review on Therapeutic Potential and Recent Advances in Drug Delivery of Berberine: current Status and Future Prospect. Curr Pharm Biotechnol. 2022;23(1):60–71. doi:10.2174/1389201022666210208152113
37. Ai X, Yu P, Peng L, et al. Berberine: a Review of its Pharmacokinetics Properties and Therapeutic Potentials in Diverse Vascular Diseases. Front Pharmacol. 2021;12:762654. doi:10.3389/fphar.2021.762654
38. Kwon M, Choi YA, Choi MK, Song IS. Organic cation transporter-mediated drug-drug interaction potential between berberine and metformin. Arch Pharm Res. 2015;38(5):849–856. doi:10.1007/s12272-014-0510-6
39. Hwang Y-H, Cho W-K, Jang D, et al. Effects of Berberine and Hwangryunhaedok-Tang on Oral Bioavailability and Pharmacokinetics of Ciprofloxacin in Rats. Evidence-Based Complementary and Alternative Medicine. 2012;2012:1–7. doi:10.1155/2012/673132
40. Yang Y, Xiong Y, Zhu G, et al. Discovery of seven-membered ring berberine analogues as highly potent and specific hCES2A inhibitors. Chemico-Biological Interactions. 2023;378:110501. doi:10.1016/j.cbi.2023.110501
41. Shawky AM, Almalki FA, Abdalla AN, Abdelazeem AH, Gouda AM. A Comprehensive Overview of Globally Approved JAK Inhibitors. Pharmaceutics. 2022;14(5):1001. doi:10.3390/pharmaceutics14051001
42. Guan S, Chen X, Wang F, et al. Development and validation of a sensitive LC–MS/MS method for determination of gefitinib and its major metabolites in human plasma and its application in non-small cell lung cancer patients. Journal of Pharmaceutical and Biomedical Analysis. 2019;172:364–371. doi:10.1016/j.jpba.2019.03.060
43. Kohler I, Giera M. Recent advances in liquid-phase separations for clinical metabolomics. Journal of Separation Science. 2017;40(1):93–108. doi:10.1002/jssc.201600981
44. Giacomini KM, Huang S-M, Tweedie DJ, et al. Membrane transporters in drug development. Nature Reviews Drug Discovery. 2010;9(3):215–236. doi:10.1038/nrd3028
45. Zhou S-F, Liu J-P, Chowbay B. Polymorphism of human cytochrome P450 enzymes and its clinical impact. Drug Metabolism Reviews. 2009;41(2):89–295. doi:10.1080/03602530902843483
 © 2025 The Author(s). This work is published and licensed by Dove Medical Press Limited. The
full terms of this license are available at https://www.dovepress.com/terms.php
and incorporate the Creative Commons Attribution
- Non Commercial (unported, 4.0) License.
By accessing the work you hereby accept the Terms. Non-commercial uses of the work are permitted
without any further permission from Dove Medical Press Limited, provided the work is properly
attributed. For permission for commercial use of this work, please see paragraphs 4.2 and 5 of our Terms.
© 2025 The Author(s). This work is published and licensed by Dove Medical Press Limited. The
full terms of this license are available at https://www.dovepress.com/terms.php
and incorporate the Creative Commons Attribution
- Non Commercial (unported, 4.0) License.
By accessing the work you hereby accept the Terms. Non-commercial uses of the work are permitted
without any further permission from Dove Medical Press Limited, provided the work is properly
attributed. For permission for commercial use of this work, please see paragraphs 4.2 and 5 of our Terms.