")
Back to Journals » International Journal of Nanomedicine » Volume 20
Enhanced Antitumor Efficacy and Reduced Toxicity in Colorectal Cancer Using a Novel Multifunctional Rg3- Targeting Nanosystem Encapsulated with Oxaliplatin and Calcium Peroxide
Authors Xie Y, Zhu M, Bao H, Chen K, Wang S, Dai J, Chen H, Li H, Song Q , Wang X, Yu L , Pei J
Received 21 October 2024
Accepted for publication 10 January 2025
Published 24 January 2025 Volume 2025:20 Pages 1021—1046
DOI https://doi.org/10.2147/IJN.S502076
Checked for plagiarism Yes
Review by Single anonymous peer review
Peer reviewer comments 2
Editor who approved publication: Dr Kamakhya Misra
Yizhuo Xie,1 Ming Zhu,1 Han Bao,1 Kejia Chen,1 Shanshan Wang,1 Jingwen Dai,1 Hongzhu Chen,1 He Li,1 Qi Song,2 Xinlu Wang,2 Liangping Yu,2 Jin Pei1
1Department of Biopharmacy, School of Pharmaceutical Sciences, Jilin University, Changchun, People’s Republic of China; 2Department of Clinical Pharmacy, the First Hospital of Jilin University, Changchun, People’s Republic of China
Correspondence: Jin Pei, Department of Biopharmacy, School of Pharmaceutical Sciences, Jilin University, No. 1163 Xinmin Street, Changchun, 130021, People’s Republic of China, Tel +86-431-85619725, Email [email protected] Liangping Yu, Department of Clinical Pharmacy, the First Hospital of Jilin University, No. 1 Xinmin Street, Changchun, 130061, People’s Republic of China, Tel +86 431 81879802, Email [email protected]
Purpose: Colorectal cancer (CRC) is the second leading cause of cancer-related deaths worldwide. Oxaliplatin (OXA) is currently the primary chemotherapeutic agent for CRC, but its efficacy is limited by the tumor microenvironment (TME). Here, we present a combined approach of chemotherapy and TME modulation for CRC treatment. A multifunctional nanosystem (Rg3-Lip-OXA/CaO2) was established using Ginsenoside Rg3 liposomes targeting glucose transporter 1 overexpressed on the surface of CRC cells to co-deliver OXA and calcium peroxide (CaO2).
Methods: The CaO2 nanoparticles were synthesized via the CaCl2-H2O2 reaction under alkaline conditions and characterized using X-ray diffraction (XRD) and X-ray photoelectron spectroscopy (XPS). Rg3-Lip-OXA/CaO2 was prepared through a thin-film hydration approach and characterized; additionally, its stability and release behavior were studied. The O2, H2O2, and Ca2+ generation ability of Rg3-Lip-OXA/CaO2 in solution and HCT116 cells were measured. The in vitro cellular uptake was observed via fluorescence microscope and flow cytometry. In vitro cytotoxicity was evaluated using the CCK-8 assay, flow cytometry, and live/dead cell staining. The in vivo targeting effect as well as antitumor efficacy were determined in HCT116 tumor-bearing mice. Finally, the acute toxicity of Rg3-Lip-OXA/CaO2 was investigated in ICR mice to explore its safety.
Results: The XRD and XPS analyses confirmed the successful synthesis of CaO2 nanoparticles. The Rg3-Lip-OXA/CaO2 exhibited an average particle size of approximately 92.98 nm with good stability and sustained release behavior. In vitro and in vivo studies confirmed optimal targeting by Rg3-Lip and demonstrated that the nanosystem effectively produced O2, H2O2 and Ca2+, resulting in significant cytotoxicity. Additionally, in vivo studies revealed substantial tumor growth suppression and reduced tumor-associated fibroblasts (TAFs) and collagen. Acute toxicity studies indicated that Rg3-Lip-OXA/CaO2 markedly reduced the toxicity of chemotherapeutic drugs.
Conclusion: This multifunctional nanosystem enhances chemotherapy efficacy and reduces toxicity, offering a promising approach for optimizing CRC treatment and potential clinical application.
Keywords: tumor microenvironment, multifunctional nanosystem, oxaliplatin, calcium peroxide, targeted drug delivery, anticancer therapy
Graphical Abstract:

Introduction
Colorectal cancer (CRC) ranks as the second most common cause of cancer-related fatalities worldwide.1,2 In 2022 alone, approximately 1,926,118 new cases were identified, with 903,859 deaths recorded.3,4 This accounts for 9.6% of global cancer incidences and 9.3% of cancer-related deaths.4,5 Patients diagnosed with advanced-stage CRC face a grim prognosis, with a 5-year survival rate of less than 15%.6 Oxaliplatin (OXA), a third-generation platinum compound, remains a cornerstone in the chemotherapy of CRC.7,8 OXA exerts its anticancer effects by causing DNA damage, thereby inhibiting DNA replication and transcription.9
However, the clinical efficacy of OXA is often compromised by the tumor microenvironment (TME), which is characterized by hypoxia, acidosis, and elevated glutathione levels.10,11 These conditions are intricately linked to tumor progression, invasion, metastasis, and resistance to therapy.12 Cells in a hypoxic environment develop resistance to conventional chemotherapeutic agents through various survival mechanisms, such as the upregulation of P-glycoprotein (P-gp).13–15 Consequently, strategies to mitigate hypoxia in the TME could potentially enhance the effectiveness of chemotherapy. Recent advances have highlighted the potential of various metal peroxides, including calcium peroxide (CaO2),16 manganese dioxide (MnO2), magnesium peroxide (MgO2), and zinc peroxide (ZnO2),17 in alleviating tumor hypoxia. These peroxides react with water in tumor tissues,18 generating oxygen and other reactive species, thereby enhancing the chemotherapeutic effect. Among these, CaO2 is particularly promising due to its high biocompatibility and efficient oxygen generation.19,20 The release of hydrogen peroxide (H2O2) and Ca2+ from CaO2 induces intracellular oxidative stress and Ca2+ overload, leading to mitochondrial dysfunction and tumor cell apoptosis.21–23 The reaction of CaO2 with water is depicted as follows:24


Given the instability of CaO2 in water and the systemic toxicity of OXA, there is a pressing need to develop a safer and more effective nanosystem to prevent the premature decomposition of CaO2 and reduce the side effects of OXA. Among the various nanocarriers used in tumor therapy, liposomes are particularly promising due to their ease of modification, high biocompatibility, and low toxicity.25–27 Cholesterol, a key component of liposomes, stabilizes the phospholipid bilayers.28 However, concerns have been raised about its potential to cause hyperlipidemia and allergic reactions due to excessive absorption and the regulation of serum lipoprotein content.29 Therefore, identifying cholesterol substitutes with similar structures to stabilize liposomal membranes is crucial.
Ginsenoside Rg3, a sterol compound isolated from ginseng and the primary component of the “Shenyi capsule”, has been approved as an anticancer drug by the State Food and Drug Administration of China since 2000.30 Rg3 has demonstrated tumor-suppressive effects across multiple cancers and can modulate the TME by inhibiting tumor angiogenesis,31,32 reversing activated TAFs,33 and inducing immunogenic cell death (ICD).34 When combined with doxorubicin,35,36 paclitaxel,37 cisplatin,38,39 and other chemotherapeutic drugs, Rg3 significantly enhances antitumor effects while reducing drug-induced toxicity. Moreover, the glycosyls present in the hydrophilic part of Rg3 actively target glucose transporter 1 (Glut1), which is overexpressed on the surface of CRC cells.33,40 These findings suggest that Ginsenoside Rg3 could potentially replace cholesterol as a liposomal membrane stabilizer, while also actively targeting tumors and acting as a chemotherapy adjuvant, thereby increasing drug accumulation in tumor tissues and enhancing the antitumor effect.
This study aims to develop a multifunctional nanosystem (Rg3-Lip-OXA/CaO2) to enhance the treatment of CRC. In this nanosystem, Rg3 serves as both a membrane stabilizer and a chemotherapy adjuvant, offering multiple functions such as active targeting, TME regulation, and enhanced chemotherapy. It is expected that Rg3-Lip-OXA/CaO2 will effectively accumulate at tumor sites via the Glut1-targeting capability of Rg3. Subsequently, OXA and CaO2 will be released from the liposomes to kill tumor cells through DNA damage and mitochondrial dysfunction, respectively. Additionally, CaO2 and Rg3 will regulate the TME by producing oxygen and reversing activated TAFs. The primary advantage of this nanosystem is its ability to augment chemotherapy and regulate the TME through various mechanisms, such as hypoxia relief, mitochondrial damage, and TAFs reversal. Therefore, this multifunctional nanosystem holds significant promise for clinical application in the treatment of CRC.
Materials and Methods
Materials
OXA was purchased from Shandong Boyuan Pharmaceutical Co., Ltd. (Jinan, China), while Ginsenoside 20(S)-Rg3 was purchased from DESITE Biotech (Chengdu, China). Ammonia (NH3·H2O, 30%) and calcium chloride (CaCl2) were purchased from Xilong Scientific (Shantou, China). Egg yolk lecithin (EPC) and 1.1′-dioctadecyl-3,3,3′,3′-tetramethylindotricarbocyanine iodide (DiR) were procured from Meilun Biotechnology (Dalian, China). Cholesterol (Chol) was purchased from Shanghai Macklin Biochemical Co. Ltd. (Shanghai, China). McCoy’s 5A medium was purchased from ProCell Life Sciences (Wuhan, China). Hoechst 33342 and Fluo 3-AM were purchased from Beijing Solarbio Science and Technology Co., Ltd. (Beijing, China). Rhodamine B (Rh B) was procured from Yuanye Biotechnology Co., Ltd. (Shanghai, China). 2′,7′-Dichloro-fluorescein diacetate (DCFH-DA) and Tris (4,7-biphenyl-1,10-phenanthroline) ruthenium dichloride ([Ru(dpp)3]Cl2) were sourced from Shanghai Maokang Biotechnology Co., Ltd (Shanghai, Beijing). The Calcein/PI cell viability/cytotoxicity assay kit and DNA damage assay kit by γ-H2AX immunofluorescence were procured from Beyotime Biotechnology (Shanghai, China). The Annexin V-FITC/PI apoptosis detection kit and JC-1 Mitochondrial membrane potential assay kit were obtained from Yeasen Biotechnology Co., Ltd. (Shanghai, China). Smooth muscle actin (α-SMA) polyclonal antibody, HIF-1α polyclonal antibody and CoraLite488-conjugated goat anti-rabbit IgG (H&L) were purchased from Proteintech, Inc. (Wuhan, China).
Cell Culture and Animals
The HCT116 cells, a human colorectal cancer cell line, were procured from ProCell Life Science (Wuhan, China). These cells were cultured in McCoy’s 5A with 10% fetal bovine serum (FBS) and 1% penicillin/streptomycin at 37°C in a humidified environment with 5% CO2.
Female ICR mice, each weighing between 18 and 20 g, were procured from Liaoning Changsheng Biotechnology Co., Ltd. (Changchun, China). Female BALB/c nude mice, aged 4 to 5 weeks, were obtained from Beijing HFK Bioscience Co., Ltd (Beijing, China). Animals were kept in an SPF-grade animal center with access to food and water ad libitum at 25°C under a 12-h dark/light cycle. All animal procedures were approved by the Animal Experimental Ethics Committee of Jilin University (Approval No. 20220077) and performed in accordance with the National Institutes of Health Guide for the Care and Use of Laboratory Animals. Before commencing the experiment, all animals were fed adaptively for one week.
Preparation and Characterization of CaO2
Preparation of CaO2
The synthesis of CaO2 nanoparticles followed a previously reported method involving the CaCl2–H2O2 reaction under alkaline conditions.41 Briefly, a solution of CaCl2 (2 mL, 0.1 g/mL) and ammonia solution (1 mL, 1 mol/L) were added into 200 mL PEG-200. Subsequently, 1 mL of 30% H2O2 was added dropwise, and the mixture was agitated at 25°C for 6 h to obtain a colorless transparent solution. NaOH solution (1 mol/L) was subsequently introduced while applying ultrasound until the pH level climbed to 11.5, resulting in the gradual formation of a white suspension. Finally, the products underwent centrifugation at 9500 g for a duration of 5 min and were rinsed twice with 0.1 mol/L sodium hydroxide solution and ethanol. The resulting CaO2 nanoparticles were suspended in anhydrous ethanol and preserved at 4°C. The reaction equation is presented below:15

Characterization of CaO2
The freshly prepared CaO2 nanoparticles were diluted 100 times to analyze the particle size and polydispersity index (PDI) using dynamic light scattering (Malvern Instruments, UK). The morphology of the CaO2 nanoparticles was characterized using a transmission electron microscope (TEM; Tecnai Spirit Biotwin, Netherlands). Furthermore, the synthesis of the CaO2 nanoparticles was confirmed via X-ray diffraction (XRD) and X-ray photoelectron spectroscopy (XPS) using a D8 ADVANCE X-ray diffractometer (Bruker, Germany) and an ESCALAB 250XiX-ray photoelectron spectrometer (Thermo Scientific, USA), respectively.
Preparation and Characterization of Liposomes
Preparation of Liposomes
The preparation of OXA and CaO2 co-loaded Rg3 liposomes (Rg3-Lip-OXA/CaO2) was conducted through a thin-film hydration approach. Initially, EPC and Rg3 were dispersed in anhydrous ethanol and chloroform (v/v = 1:1) at a molar proportion of 4:1. This blend was then combined with 1 mL of 2 mg/mL CaO2 nanoparticles dispersed in ethanol. The resulting mixtures underwent rotary evaporation to form thin and uniform lipid film in a water bath at 37°C, and then the films were hydrated with 5.0% dextrose solution containing OXA at 37°C for 2 h, with the molar ratio of OXA to EPC set at 1:16. After vortexing the suspension for 3 min, ultrasonication was executed for 10 min. Ultimately, the liposomes were extruded through 450 and 220 nm microporous membranes to obtain Rg3-Lip-OXA/CaO2.
OXA-loaded conventional liposomes (Lip-OXA) were prepared in the absence of CaO2, and Rg3 was replaced by cholesterol. Similarly, the OXA and CaO2 co-loaded conventional liposomes (Lip-OXA/CaO2) were prepared by using cholesterol instead of Rg3. Additionally, Rh B- and DiR-loaded liposomes (Lip-RhB, Lip-DiR) were prepared by adding DiR into the lipid solutions or Rh B to the hydration process as a fluorescence marker under the same conditions in darkness.
Characterization of Liposomes
The encapsulation efficiency (EE) and drug loading (DL) of OXA were assessed using LC-20AT high-performance liquid chromatography (HPLC, Shimadzu, Japan) as described previously.42 Unencapsulated Rg3 was eliminated through low-speed centrifugation based on the lipid solubility of Rg3. Freshly prepared liposomes underwent centrifugation at 3000 rpm for 10 min to eliminate any free Rg3. The resulting supernatant was then treated with methanol for 5 min to break the liposomes. The concentration of Rg3 was quantified using HPLC with a Shimadzu ODS C18 reverse phase column (250.0 mm × 4.6 mm, 5.0 μm), utilizing a mobile phase composed of 55% acetonitrile and 45% ultra-pure water. The EE (%) and DL (%) were calculated using the formulas below:


The liposomes were diluted 100 times to measure particle size, PDI, and zeta potential using dynamic light scattering technique (DLS). The morphology of Rg3-Lip-OXA/CaO2 was examined via TEM. The energy dispersive spectroscopy (EDS) elemental mapping of Rg3-Lip-OXA/CaO2 was conducted using a JEM–2100F field emission TEM (FETEM) (JEOL Ltd., Japan). The ultraviolet spectra and infrared spectra of Rg3, OXA, CaO2, Lip, and Rg3-Lip-OXA/CaO2 were measured with UV–vis spectrophotometer (UV2700, Shimadzu, Japan) and Fourier transform infrared spectroscopy (FTIR; IRSpirit, Shimadzu, Japan).
O2, H2O2, and Ca2+ Generation Ability of Liposomes in Solution
One milliliter of Lip-OXA, Lip-OXA/CaO2, or Rg3-Lip-OXA/CaO2 was added to 10 mL of phosphate-buffered saline (PBS; pH 7.4), with the mixture being stirred at 37°C. The concentration of dissolved O2 was determined using a DOG 3082 dissolved oxygen meter.
To evaluate the production of H2O2 from CaO2, a colorimetric assay was conducted, employing KMnO4 as the detection indicator. Diverse liposomes, including Lip-OXA, Lip-OXA/CaO2, and Rg3-Lip-OXA/CaO2, were added into 40 μg/mL of KMnO4 solution, and the UV–vis absorption spectra of sample were determined. PBS and H2O2 functioned as negative and positive controls, respectively.
The production of Ca2+ by Lip-OXA, Lip-OXA/CaO2, and Rg3-Lip-OXA/CaO2 was quantified using the Ca2+ fluorescent indicator Fluo 3-AM.43 Briefly, 1 mL of liposomes was mixed with 1 mL PBS (pH 7.4) containing Fluo 3-AM (5 μM), and then the resulting mixture was incubated at 37°C with continuous shaking. At the designated intervals, the fluorescence spectra of sample were measured using a fluorospectro photometer (λex: 506 nm, λem: 526 nm). An increase in fluorescence intensity indicated the production of Ca2+ from liposomes. In addition, the above-mentioned procedure was performed at pH 5.5 to detect the ability of Rg3-Lip-OXA/CaO2 to generate O2, H2O2, and Ca2+ under acidic addition.
Stability of Liposomes
The liposomes of Lip-OXA/CaO2 and Rg3-Lip-OXA/CaO2 were stored at 4°C or 25°C for 48 h to measure changes in EE. The EE of OXA and Rg3 was determined using HPLC, as described above, at predesigned intervals of 0, 1, 2, 4, 8, 24, and 48 h.
To evaluate storage stability, the Rg3-Lip-OXA/CaO2 was stored at 4°C for two weeks, and DLS was employed to measure particle size, PDI, and zeta potential. In addition, the Rg3-Lip-OXA/CaO2 was mixed with PBS, PBS containing 10% FBS, and McCoy’s 5A medium containing 10% FBS at 37°C for 48 h to examine the dispersion stability. The particle size and PDI were measured at predesigned intervals using DLS.
Drug Release Behavior
The drug release behaviors of OXA and Rg3 from free Rg3/OXA, Lip-OXA, Lip-OXA/CaO2, and Rg3-Lip-OXA/CaO2 were assessed using a dynamic dialysis method. Samples were enclosed in dialysis bags with a molecular weight cutoff of 8.0–14.0 kDa and subjected to dialysis in PBS (pH 7.4) in a 37°C shaker. At predefined time points of 0, 1, 2, 4, 8, 12, 24, and 48 h, 1 mL of the dissolution medium was removed for the determination of the released drug concentration using HPLC, and an equal volume of fresh release medium was replaced. Rg3-Lip-OXA/CaO2 was also dialyzed against PBS (pH 5.5) in a 37°C shaker with the same procedures above to determine the release profiles of OXA and Rg3 from Rg3-Lip-OXA/CaO2 under acidic conditions.
Intracellular Uptake and Mechanism
The cellular uptake of Rg3-Lip-Rh B was evaluated using a Ts2-FL fluorescence microscope (Nikon, Japan) and a FACS Calibur flow cytometer (Becton Dickinson, USA). A total of 2×10⁵ HCT116 cells/well were seeded in 6-well plates and cultured for 24 h. After this, cells were treated with 10 μg/mL Rh B, Lip-Rh B, or Rg3-Lip-Rh B for an additional 6 h. For fluorescence imaging, the cells were then stained with Hoechst 33342 for 30 min at 25°C. For flow cytometry, the cells were trypsinized and centrifuged at 1000 rpm for 5 min. After being resuspended in PBS, the samples of 1.0×10⁴ cells were analyzed using a flow cytometer.
For elucidating the intracellular uptake mechanisms, the cells were exposed to several glucose transporter inhibitors, including glucose (10 mM) and quercetin (0.2 mM), for 1 h, followed by treatment with Rg3-Lip-Rh B for another 6 h. Finally, the cells were analyzed for fluorescence imaging after being stained with Hoechst 33342 as described above. For flow cytometry, the cells were trypsinized and centrifuged at 1000 rpm for 5 min. After resuspension in PBS, the samples of 1.0×10⁴ cells were analyzed using a flow cytometer.
Intracellular O2, ROS, and Ca2+ Levels Determination
Intracellular O2, ROS, and Ca2+ levels were assessed using [Ru(dpp)3]Cl2, DCFH-DA, and Fluo 3-AM probes, respectively. To determine intracellular O2 levels, HCT116 cells were inoculated into 24-well plates at a density of 1×10⁵ cells/well in a hypoxic environment for 24 h. The cells were then treated with [Ru(dpp)3]Cl2 (10 μM) for 4 h. Subsequently, the cells were treated with Lip-OXA, Lip-OXA/CaO2, or Rg3-Lip-OXA/CaO2 at concentrations of 10 μM OXA for 12 h. Finally, the cells were dyed with Hoechst 33342 for 30 min at 25°C. Fluorescent microscopy was used to capture images of the stained cells. Untreated cells under hypoxic or normoxic conditions served as controls.
To assess intracellular ROS and Ca2+ levels, HCT116 cells were seeded into 24-well plates in hypoxic environment for 24 h. Then, cells were treated for 12 h with Lip-OXA, Lip-OXA/CaO2, or Rg3-Lip-OXA/CaO2 at concentrations of 10 μM OXA. After incubation, the cells were incubated with DCFH-DA (10 μM) or Fluo 3-AM (5 μM) for 30 min to detect ROS or Ca2+ levels, respectively. Ultimately, the cells were observed using fluorescence microscopy after being stained with Hoechst 33342. Untreated cells under hypoxic or normoxic conditions served as controls.
Mitochondrial Damage
Intracellular mitochondrial damage was detected using a JC-1 mitochondrial membrane potential assay kit. Briefly, 2×10⁵ HCT116 cells/well were seeded in 6-well plates in a hypoxic environment for 24 h. The cells were then treated with Lip-OXA, Lip-OXA/CaO2, and Rg3-Lip-OXA/CaO2 at OXA concentrations of 10 μM for 12 h. After incubation, the cells were stained with the JC-1 probe, and the images were captured using a fluorescence microscope. Untreated cells under hypoxic or normoxic conditions served as controls.
In vitro Cytotoxicity and Apoptosis
First, the combination index (CI) of Rg3 and OXA was detected using the CCK-8 assay. Briefly, HCT116 cells were seeded in 96-well plates at a density of 2×10³ cells/well overnight. The cells were then treated with different molar ratios of Rg3 and OXA. Subsequently, the fresh medium containing 10.0 μL of CCK-8 was added to cells for an incubation of 2 h at 37°C. Finally, optical density (OD) values were measured at 450 nm using a microplate reader and the cell viability was calculated. The CI values were calculated based on the cell survival rate.
The cytotoxicity of the diverse formulations was assessed using a CCK-8 assay, flow cytometry, live/dead cell staining, immunofluorescence staining of γ-H2AX, and colony formation assay. For the CCK-8 method, HCT116 cells were seeded in 96-well plates overnight and then treated with PBS, OXA, Rg3-OXA/CaO2, Lip-OXA, Lip-OXA/CaO2 and Rg3-Lip-OXA/CaO2 in a hypoxic environment at concentrations of 5, 10, 20, 40 μM OXA for 48 h, respectively. Subsequently, cell viability was detected using the CCK-8 assay as described above.
For flow cytometry, live/dead cell staining, and immunofluorescence staining of γ-H2AX, cells were seeded into 6-well plates or 96-well plates overnight and then treated with PBS, OXA, Rg3-OXA/CaO2, Lip-OXA, Lip-OXA/CaO2, and Rg3-Lip-OXA/CaO2 at concentrations of 10 μM OXA for 48 h in a hypoxic environment, respectively. For flow cytometry, the cells were stained using an Annexin V-FITC/PI Apoptosis Detection Kit following standard procedures in the instructions and then detected by a flow cytometer. For the live/dead cell assay, the cells were stained using a calcein/PI cell viability/cytotoxicity assay kit and then observed using fluorescence microscopy. For immunofluorescence staining of γ-H2AX, the cells were then washed thrice with cold PBS and fixed with 4% paraformaldehyde for 5 min. The cells were then blocked with QuickBlock™ Blocking Buffer for 20 min and incubated with an anti-γ-H2AX primary antibody overnight at 4°C, followed by incubating with the Alexa Fluor 488-conjugated secondary antibody for 1 h at 25°C. Finally, the cells were observed using fluorescence microscopy after being stained with DAPI.
For the colony formation assay, HCT116 cells (500 cells/well) were seeded in 6-well plates overnight and then treated with PBS, OXA, Rg3-OXA/CaO2, Lip-OXA, Lip-OXA/CaO2, and Rg3-Lip-OXA/CaO2 at concentrations of 10 μM OXA for 24 h in a hypoxic environment. The cells were then cultured for an additional 12 days with fresh medium, which was replaced every two days. Subsequently, the cells were fixed with absolute ethanol for 15 min and stained with a 0.1% crystal violet solution for 30 min.
In vivo Fluorescence Imaging
In vivo fluorescence imaging was conducted using a widely used lipophilic near-infrared fluorescent probe (DiR). HCT116 tumor-bearing mouse models were established by subcutaneously injecting 5×10⁶ HCT116 cells into the lower right abdomen of BALB/c nude mice.44 Once the tumor volume reached 200 mm3, the mice were randomly divided into three groups (n = 3) and were intravenously injected with DiR, Lip-DiR, and Rg3-Lip-DiR, respectively. The dose of DiR was 0.44 µg/g body weight. Fluorescence optical imaging was conducted on the anesthetized mice at intervals of 1, 2, 6, 12, and 24 h using an in vivo imaging system (IVIS Spectrum, USA). The animals were euthanized, and their main organs and tumors were collected at 6 h post-administration for ex vivo fluorescence distribution analysis. The fluorescence intensity of DiR in both the in vivo and ex vivo tumor regions was measured using in vivo imaging system software.
In vivo Antitumor Efficacy Evaluation
The antitumor efficacy was assessed in athymic mice bearing HCT116 tumors, established as described above. Once the average tumor volume reached approximately 80 mm3, the mice were randomly divided into six groups (n = 5) and intravenously injected with normal saline, OXA, Rg3-OXA/CaO2, Lip-OXA, Lip-OXA/CaO2, or Rg3-Lip-OXA/CaO2 at an equivalent OXA dose of 5 mg/kg every four days, continuing for a total of six times. Concurrently, tumor volume was monitored throughout the treatment period. Four days after the last dose, the tumors were surgically removed and weighed to determine the tumor volume inhibitory ratio (TIR). The tumor volume and TIR were calculated as follows:


H&E Staining and TUNEL Assay
At the end of the experiment, the tumors were fixed in a 4.0% paraformaldehyde solution for subsequent hematoxylin and eosin (H&E). Histological evaluation of apoptotic cells in tumor tissues was conducted utilizing the terminal deoxynucleotidyl transferase-mediated dUTP-biotin nick end labeling (TUNEL) assay. The tumor tissues were embedded in paraffin, sliced, treated with proteinase K, and stained according to the standard procedures of the Superbrilliant AF488 TUNEL Apoptosis Assay Kit.
Masson’s Trichrome, Immunohistochemistry and Immunofluorescence Staining Assay
To visualize collagen changes in tumor tissues, the tumors were paraffin-embedded and cut into 3 μm thick slices. Then the slices were stained using a Masson’s trichrome kit following standard procedures. To assess changes in tumor-associated fibroblasts within tumor tissues, immunohistochemistry was conducted on tumor slices to analyze α-SMA expression. The tumor slides obtained using the methods mentioned above underwent deparaffinization using xylene and ethanol, and blocked with 5% goat serum and incubated overnight at 4°C with α-SMA antibody. The slides were then exposed to biotin-labeled secondary antibody at 37°C for 1 h. Finally, visualization was performed using 3.3’-Diaminobenzidine (DAB). For immunofluorescence staining, the tumor slides were first incubated with HIF-1α antibody overnight at 4°C after antigen retrieval and blocking. The slides were then exposed to CoraLite488-conjugated goat anti-rabbit IgG (H&L) for 1 h.
Safety Evaluation in in vivo Antitumor Efficacy Study
Body weight was recorded during the 24-day experiment, and blood samples were obtained for routine blood tests and biochemical analyses using an HF-3800 blood analyzer (Hai Li Fu, China) and HF-240 automatic biochemical analyzer (Hai Li Fu, China) upon euthanasia. Furthermore, the main organs were collected and weighed to calculate the organ coefficient (OC). Finally, the organ tissues were fixed for H&E staining to assess pathological safety. The OC was calculated as follows:

In Vivo Acute Toxicity
To examine the safety of liposomal formulations, an in vivo acute toxicity assay was conducted on healthy ICR mice. A total of 160 ICR mice were randomly assigned to four groups (n = 10 each): control (normal saline), OXA, Rg3-OXA/CaO2, and Rg3-Lip-OXA/CaO2. Administration dosages were determined in a preliminary study. The doses of OXA in the OXA group ranged from 12 to 16 mg/kg, in Rg3-OXA/CaO2 group from 16 to 20 mg/kg, in Rg3-Lip-OXA/CaO2 group from 19 to 23 mg/kg. These doses were injected intravenously as a single administration, and body weights and mortality were monitored and recorded for 14 days. On the 14th day post-treatment, mice in the minimum dose group of each formulation were euthanized to obtain blood samples from the eye socket. Routine blood tests and blood biochemical analysis were performed to assess myelosuppression and hepatorenal function. Ultimately, the main organs were collected for H&E staining and weighed to calculate OC using the formula described above.
Statistical Analysis
The data were expressed as mean ± standard deviation (SD) and analyzed using GraphPad Prism software (version 9.0; GraphPad Software, San Diego, CA, USA). Values of p < 0.05 were deemed significant difference between groups.
Results and Discussion
Characterization of CaO2
To confirm the successful synthesis of CaO2 nanoparticles, XRD and XPS analyses were conducted. As illustrated in Figure 1A, the XRD spectra of CaO2 revealed distinct peaks at 2θ values of 30.1°, 35.6°, 47.3°, 51.6°, 53.1°, and 60.4°, corresponding to the standard card for CaO2 (PDF#03–0865). The chemical composition of CaO2 was analyzed via XPS, and Ca and O signals were detected in the XPS spectrum (Figure 1B). Overall, these results demonstrate the successful synthesis of CaO2 nanoparticles. Figure 1C showed the particle size of CaO2, which was 23.9 ± 0.806 nm. In addition, the PDI of CaO2 was 0.181 ± 0.008, indicating uniform particle size distribution. The morphology of CaO2 observed by TEM (Figure 1D) was uniform and spherical at 20.0–40.0 nm, consistent with the particle size measurement.
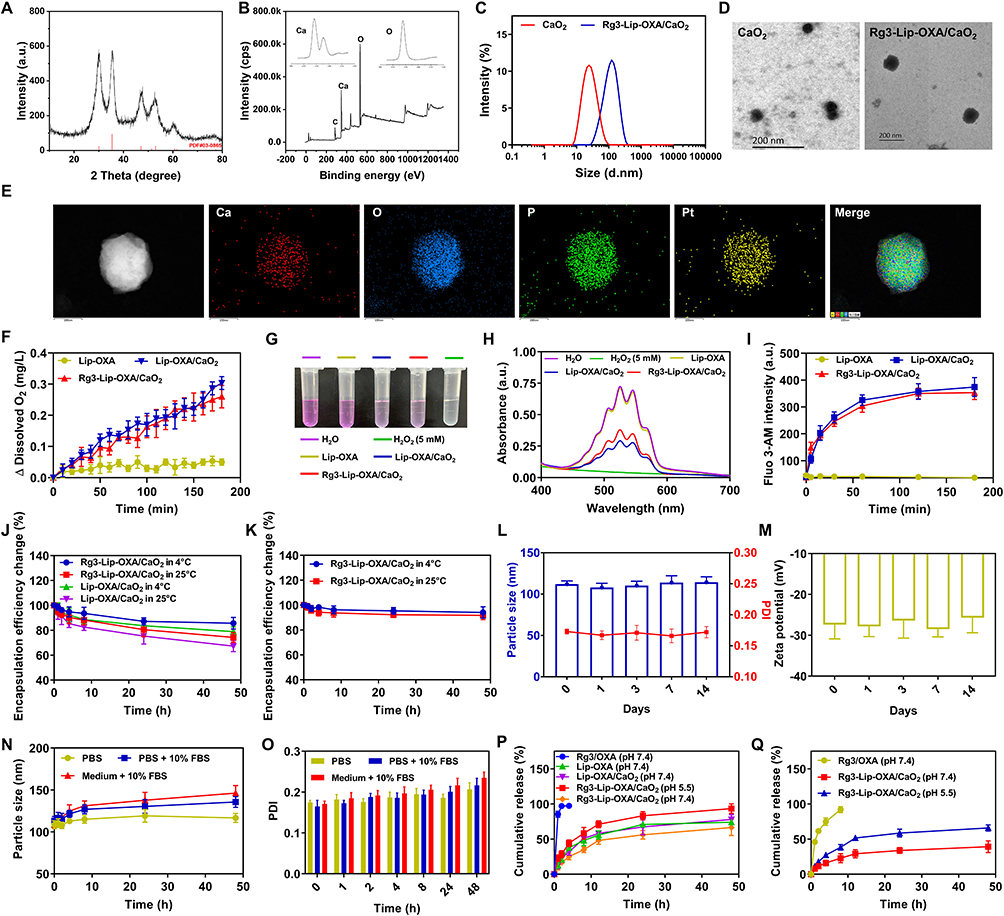 |
Figure 1 Characterization of CaO2 and Rg3-Lip-OXA/CaO2. (A) XRD spectra and (B) XPS spectrum of CaO2. (C) Particle sizes and (D) TEM images of CaO2 and Rg3-Lip-OXA/CaO2. (E) EDS elemental mapping of Rg3-Lip-OXA/CaO2. (F) O2 release profiles of Lip-OXA, Lip-OXA/CaO2, and Rg3-Lip-OXA/CaO2 in PBS at pH 7.4. (G) Photographs and (H) UV–vis absorption spectra of KMnO4 treated with Lip-OXA, Lip-OXA/CaO2, or Rg3-Lip-OXA/CaO2. (I) Cumulative Ca2+ release profiles of Lip-OXA, Lip-OXA/CaO2, and Rg3-Lip-OXA/CaO2 in PBS at pH 7.4. (J) Changes in EE of OXA in Lip-OXA/CaO2 and Rg3-Lip-OXA/CaO2 and (K) Rg3 in Rg3-Lip-OXA/CaO2 within 48 h at different temperatures. (L) Particle sizes, PDI, and (M) zeta potential changes of Rg3-Lip-OXA/CaO2 stored at 4°C for 14 days. (N) Particle sizes and (O) PDI of Rg3-Lip-OXA/CaO2 mixed with different dispersion medium for 48 h. Drug release behavior of (P) OXA and (Q) Rg3 in diverse formulations. Data are presented as mean ± SD (n = 3). |
Characterization of Liposomes
Table 1 showed the EE of OXA and Rg3 in Rg3-Lip-OXA/CaO2 was 48.46 ± 3.63% and 95.01 ± 5.34%, respectively, while the DL of OXA and Rg3 in Rg3-Lip-OXA/CaO2 was 1.15 ± 0.09% and 18.09 ± 1.02%, respectively. There was no notable difference in either the EE or DL of OXA between the Lip-OXA/CaO2 and Rg3-Lip-OXA/CaO2 groups, suggesting that substituting cholesterol with Rg3 did not influence the EE and DL of OXA.
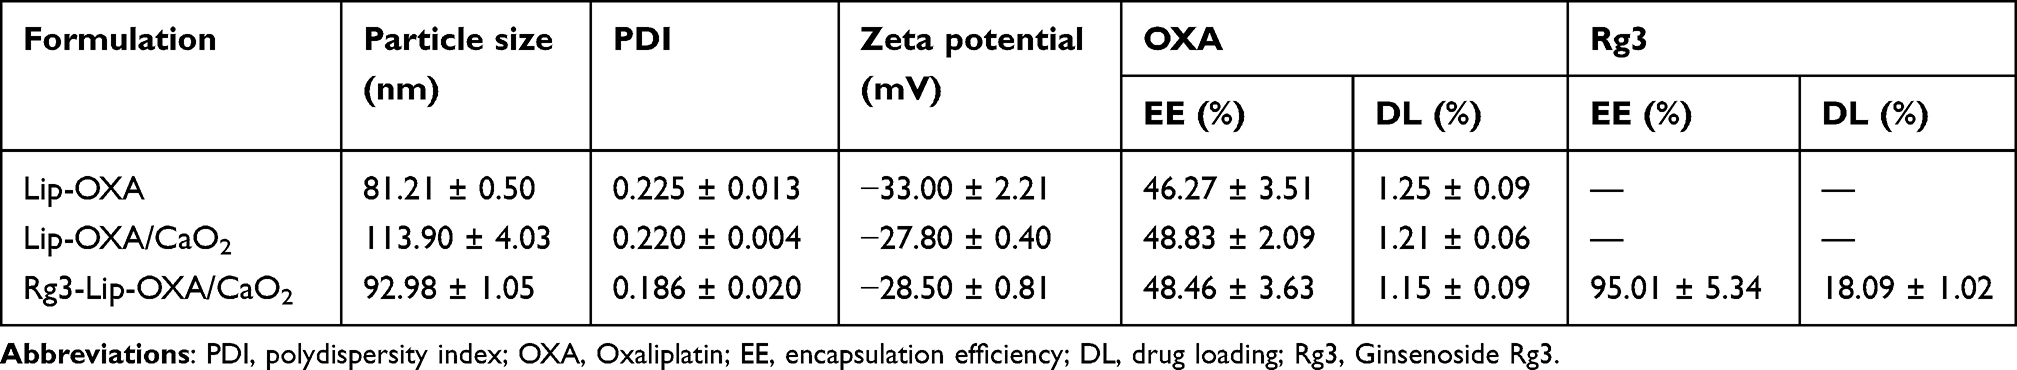 |
Table 1 The Characterizations of Different Liposome Formulations (n=3) |
Figure 1C and D showed the particle size and TEM images of Rg3-Lip-OXA/CaO2, respectively. The particle size of Rg3-Lip-OXA/CaO2 measured at 92.98 ± 1.05 nm was less than 200 nm, which can enable effective tumor targeting via enhanced permeation and retention (EPR) mechanisms.45 Notably, the particle size of Rg3-Lip-OXA/CaO2 was less than that of Lip-OXA/CaO2, probably due to the unique physicochemical properties of ginsenoside.46 Ginsenoside Rg3 has hydrophilic and hydrophobic parts in its molecular structure, which confer it surfactant features to reduce the surface tension of water, thereby compressing liposomes and reducing particle size.47,48 Small PDI values indicate monodisperse particles.49 The PDI of Lip-OXA, Lip-OXA/CaO2, and Rg3-Lip-OXA/CaO2 was recorded as 0.225 ± 0.013, 0.220 ± 0.004, and 0.186 ± 0.020, respectively (Table 1). The PDI of all liposome groups is below 0.3, indicating uniform particle size without aggregation. In addition, zeta potential is crucial for liposome characterization. Higher zeta potential values prevent particle aggregation through electrostatic repulsion to better stabilize liposome.50 Table 1 illustrated the zeta potential of Lip-OXA, Lip-OXA/CaO2, and Rg3-Lip-OXA/CaO2, which was −33.00 ± 2.21, −27.80 ± 0.40, and −28.50 ± 0.81 mV, respectively, indicating stable liposome formulations.
EDS elemental mapping of Rg3-Lip-OXA/CaO2 showed the presence of Ca and O signals, demonstrating that the CaO2 nanoparticles were successfully loaded into the nanosystem (Figure 1E). In addition, the appearance of P and Pt signals indicated the presence of lipids and OXA.
The UV-Vis absorption spectra of Rg3, OXA, CaO2, Lip, and Rg3-Lip-OXA/CaO2 were shown in Figure S1. The Rg3 and OXA has absorption peaks at around 205 and 260 nm, and Rg3-Lip-OXA/CaO2 remained the absorption peaks of Rg3 and OXA, confirming that Rg3 and OXA were successfully loaded into the liposomes. Additionally, Figure S2 showed the FTIR spectra of Rg3, OXA, CaO2, Lip, and Rg3-Lip-OXA/CaO2. Compared with the Lip spectrum, there was a peak at 1643 cm⁻¹ in the Rg3-Lip-OXA/CaO2 spectrum, corresponding to the C═C stretching of Ginsenoside Rg3. Additionally, the sharp peak at around 866 cm−1 corresponded to the O–O bridge of CaO2, and the sharp peak at 573 cm−1 contributed to the both symmetric and asymmetric stretching vibrations of Pt-N of OXA.21,51,52 These bands of Rg3-Lip-OXA/CaO2 conformed that OXA and CaO2 were both encapsulated into the liposome successfully. The results of UV-Vis and FTIR further confirm the successful preparation of Rg3-Lip-OXA/CaO2.
O2, H2O2, and Ca2+ Generation Ability of Liposomes in Solution
The physicochemical properties of CaO2-loaded nanosystems were assessed in vitro. First, O2 generation was quantified using a dissolved oxygen meter to demonstrate the swift oxygen production of the CaO2-loaded nanosystem. Figure 1F depicted substantial O2 generation in the Lip-OXA/CaO2 and Rg3-Lip-OXA/CaO2 groups than those in the CaO2-uncontained group of Lip-OXA, with dissolved O2 levels increasing by over 0.2 mg/mL in 180 min. H2O2 generation was evaluated using KMnO4 as an indicator. After treatment with Lip-OXA/CaO2 and Rg3-Lip-OXA/CaO2, the color intensity of KMnO4 was clearly lower than that in the CaO2-uncontained group of Lip-OXA, and the UV–vis absorbance spectra of KMnO4 at 530 nm showed a significant decline (Figure 1G and H). In addition, the release of Ca2+ from CaO2 was measured using a Ca2+ fluorescence indicator. Figure 1I illustrated a significant release of Ca2+ upon contact of Lip-OXA/CaO2 and Rg3-Lip-OXA/CaO2 with H2O, whereas the Lip-OXA group showed no Ca2+ release. Overall, Rg3-Lip-OXA/CaO2 is an effective formulation to produced O2, H2O2, and Ca2+.
As shown in Figures S3-S5, the amount of O2, H2O2, and Ca2+ released from Rg3-Lip-OXA/CaO2 under pH 5.5 was higher than that under pH 5.5. Regarding the release of O2, the dissolved O2 level increased by over 0.4 mg/mL within 180 min in the Rg3-Lip-OXA/CaO2 (pH 5.5) group, which was higher than that in the Rg3-Lip-OXA/CaO2 (pH 7.4) group. Regarding the release of H2O2, the color intensity of KMnO4 in the Rg3-Lip-OXA/CaO2 (pH 5.5) group was comparable to the positive control group (H2O2), and the decline in the UV-visible absorption spectrum was greater than that in the Rg3-Lip-OXA/CaO2 (pH 7.4) group. Regarding the release of Ca2+, the Rg3-Lip-OXA/CaO2 (pH 5.5) group exhibited higher Ca2+ release than the Rg3-Lip-OXA/CaO2 (pH 7.4) group.
Stability of Liposomes
The stability of Rg3-Lip-OXA/CaO2 was examined based on EE changes, storage and dispersion stability. Figure 1J illustrated the EE of OXA in Lip-OXA/CaO2 and Rg3-Lip-OXA/CaO2 changed slightly within 48 h at 4°C and 25°C. The changes in the EE of OXA in liposome at 4°C were less than that those at 25°C, indicating suitable storage conditions at 4°C. Rg3-Lip-OXA/CaO2 exhibited superior stability over Lip-OXA/CaO2, with the change in EE of OXA below 15% at 4°C and 26% at 25°C, revealing the good stability of Rg3-Lip. Additionally, the change in the EE of Rg3 was less than 10% in all cases, suggesting negligible changes (Figure 1K).
Rg3-Lip-OXA/CaO2 was then stored at 4°C for 14 days to assess its storage stability. The storage stability of the liposomes was determined by evaluating particle size, PDI, and zeta potential.46 The results showed that Rg3-Lip-OXA/CaO2 maintained stable throughout the testing phase, exhibiting slight alterations in particle size, PDI, and zeta potential (Figure 1L and M). On the 14th day, the particle size and PDI of Rg3-Lip-OXA/CaO2 remained below 120 nm and 0.2, respectively, with a negative potential. Finally, the dispersion stability was evaluated in PBS, PBS containing 10% FBS, and medium containing 10% FBS. Rg3-Lip-OXA/CaO2 was relatively stable across different dispersion media over a 48-hour period, with particle size and PDI below 150 nm and 0.25, respectively (Figure 1N and O). The liposomes changed greatly in the other two groups containing serum compared to those in the PBS group, which may be due to the aggregation of liposomes caused by serum.
Drug Release Behavior
Drug release behavior was examined at 37°C for 48 h in the physiological environment (pH 7.4) and acidic tumor environment (pH 5.5). Figure 1P showed that OXA exhibited a burst release in free Rg3/OXA to 94.31% within 2 h, whereas Lip-OXA, Lip-OXA/CaO2, and Rg3-Lip-OXA/CaO2 displayed sustained release over 48 h. In addition, the cumulative release of OXA in Rg3-Lip-OXA/CaO2 showed better sustained release behavior than that in Lip-OXA/CaO2. To further assess the release profiles of OXA and Rg3 in an acidic environment, Rg3-Lip-OXA/CaO2 was dialyzed against PBS (pH 5.5). Results (Figure 1P and Q) showed faster and more complete release of OXA (93.37%) and Rg3 (65.90%) from Rg3-Lip-OXA/CaO2 at pH 5.5 than that at pH 7.4 (66.45% and 39.13%), possibly due to the swift breakdown and transformation of ginsenosides under acidic conditions.37 These findings suggest that Rg3-Lip-OXA/CaO2 had better sustained release behavior and TME-responsive release, which could reduce the administration frequency and enhance drug concentration at the tumor site for improved therapeutic effects.
Intracellular Uptake and Mechanism
The intracellular uptake of Rg3-Lip-Rh B was determined using fluorescence microscopy and flow cytometry. Figure 2A illustrated the red fluorescence emitted by Rh B, which indicates the location of the preparations. The red fluorescence intensity in HCT116 cells treated with liposomes was considerably stronger than that in the cells treated with free Rh B. This result suggests that the liposomes were more easily absorbed by the cells due to their biocompatibility. Liposomes are versatile self-assembling supramolecular structures comprising an aqueous core enclosed by a lipid bilayer, able to host hydrophobic and hydrophilic cargo, with superior biocompatibility and great similarity with biological membranes.53–55 Owing to its lipid bilayer structure similar to that of biological membranes, it has high biocompatibility and can effectively improve cellular uptake.56,57 Furthermore, the cells treated with Rg3-Lip-RhB showed stronger red fluorescence intensity than those treated with Lip-Rh B due to the targeting effects of Rg3 on Glut1, a protein highly expressed in HCT116 cells and CRC tumors.58,59 Similarly, flow cytometric assessment and quantification revealed that the fluorescence intensity of cells treated with Rg3-Lip-Rh B was 2.09 times and 1.42 times stronger than that of cells exposed to free Rh B and Lip-Rh B, respectively (Figure 2B and C).
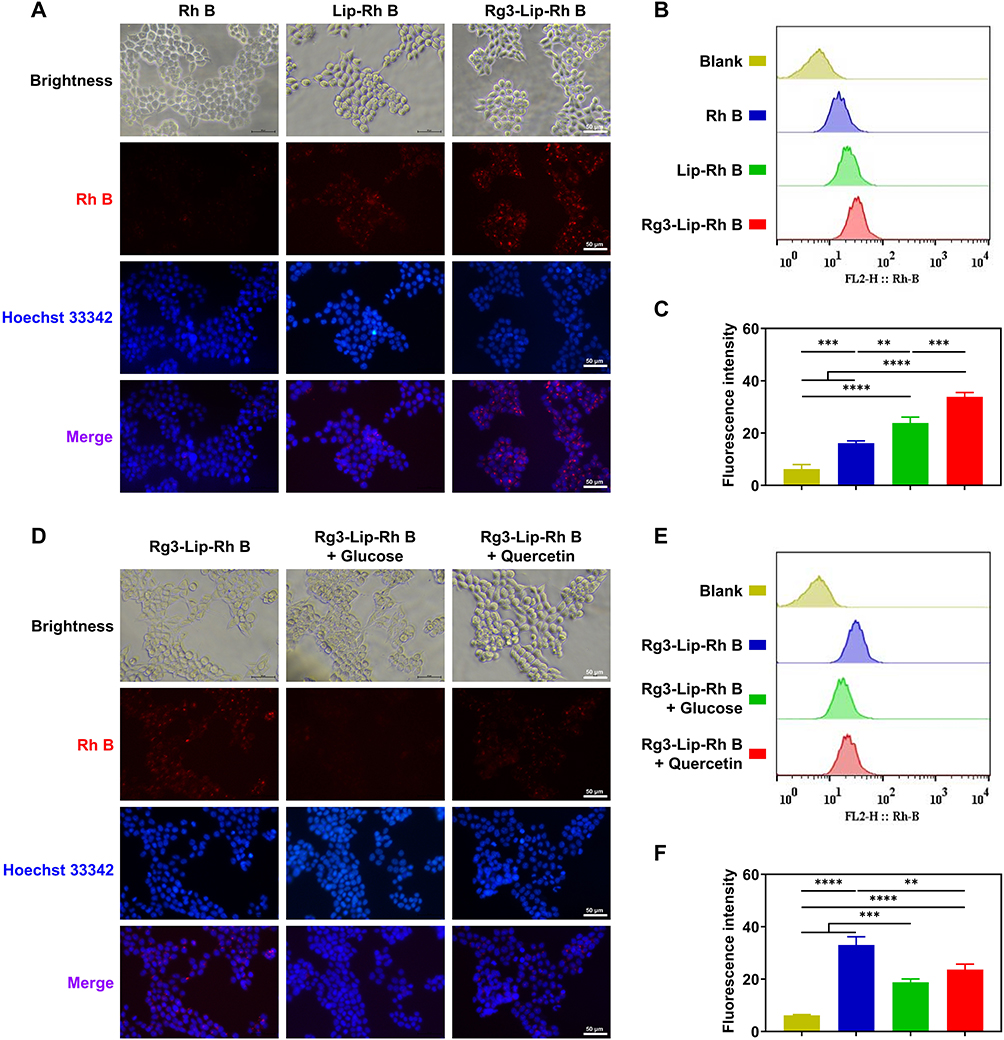 |
Figure 2 Intracellular uptake and mechanism of Rg3-Lip-Rh B in HCT116 cells. (A) Fluorescence images of HCT116 cells incubated with different Rh B formulations for 6 h. (B) Flow cytometry analysis and (C) quantification of the cellular uptake of different Rh B formulations. (D) Examination of Rg3-Lip-Rh B cellular uptake in the presence of various Glut inhibitors, including glucose and quercetin. (E) Flow cytometry analysis and (F) quantification of the cellular uptake of Rg3-Lip-Rh B in the presence of different Glut inhibitors. Data are expressed as mean ± SD (n = 3). **p < 0.01, ***p < 0.001, ****p < 0.0001. |
To further explore the intracellular mechanism of Rg3-Lip-Rh B, the cellular uptake in the presence of various Glut inhibitors including glucose and quercetin60 was observed via fluorescence microscopy and flow cytometry. Figure 2D showed that the red fluorescence intensity was significantly reduced in the presence of glucose and quercetin due to the competitive inhibition of Glut by free glucose and the inhibitory effect of quercetin61,62 on Glut. Flow cytometric analysis and quantification demonstrated the same results as described above in Figure 2E and F. The presence of glucose and quercetin led to a notable reduction in the fluorescence intensity of intracellular Rh B levels. These findings indicate that the internalization of Rg3-Lip-Rh B into HCT116 cells was mainly mediated by Glut-mediated endocytosis.
Intracellular O2, ROS, and Ca2+ Levels Determination
Considering the versatility of CaO2-loaded nanosystem in solution, the capability of CaO2-loaded nanosystems to generate O2, ROS, and Ca2+ within HCT116 cells was investigated. [Ru(dpp)3]Cl2 is an oxygen-sensitive fluorescent probe, which exhibited robust red fluorescence in a hypoxic environment and diminished in the presence of O2. Figure 3A showed strong red fluorescence of [Ru(dpp)3]Cl2 in untreated and Lip-OXA-treated HCT116 cells in a hypoxic environment, while the fluorescence diminished significantly in cells exposed to CaO2-loaded liposomes of Lip-OXA/CaO2 and Rg3-Lip-OXA/CaO2, indicating efficient O2 supply by CaO2. The fluorescence intensity of HCT116 cells exposed to Rg3-Lip-OXA/CaO2 was weaker than that of cells treated with Lip-OXA/CaO2, indicating that Rg3-Lip-OXA/CaO2 possessed the strongest ability to alleviate tumor hypoxia. Figure 3B presented quantified fluorescence intensity using Image J. In a hypoxic environment, the fluorescence intensity of the Rg3-Lip-OXA/CaO2 group significantly differed from that of the Lip-OXA/CaO2, Lip-OXA, and untreated groups. Notably, no significant difference was observed between the Rg3-Lip-OXA/CaO2 group in a hypoxic environment and the untreated group in a normal oxygen environment. These results indicated that Rg3-Lip-OXA/CaO2 could effectively improve tumor hypoxia, thereby enhancing the effect of chemotherapy.
 |
Figure 3 Detection of intracellular O2, ROS, Ca2+ levels, and mitochondrial membrane potential (MMP) in HCT116 cells treated with a CaO2-loaded nanosystem. Fluorescence images of cellular (A) O2, (C) ROS, and (E) Ca2+ levels in HCT116 cells treated with Lip-OXA, Lip-OXA/CaO2, or Rg3-Lip-OXA/CaO2 for 12 h. Scale bar = 50 μm. The fluorescence quantitative analysis of cellular (B) O2, (D) ROS, and (F) Ca2+ levels. (G) MMP in HCT116 cells treated with Lip-OXA, Lip-OXA/CaO2, and Rg3-Lip-OXA/CaO2 for 12 h. (H) The fluorescence quantitative analysis of (G). Data are presented as mean ± SD (n = 3). *p < 0.05, **p < 0.01, ***p < 0.001, ****p < 0.0001. |
To assess intracellular ROS levels, a DCFH-DA fluorescence probe was employed, which converted into the green fluorescent compound DCF upon oxidation by ROS. Figure 3C revealed a negligible presence of intracellular green fluorescence within the untreated sample, both in hypoxic and normoxic environments, indicating ROS absence. Conversely, intracellular green fluorescence was observed in the Lip-OXA/CaO2 and Rg3-Lip-OXA/CaO2 groups, with the latter exhibiting the brightest intracellular green fluorescence. Figure 3D depicted the quantification of the fluorescence intensity. The fluorescence intensities of the Lip-OXA/CaO2 and Rg3-Lip-OXA/CaO2 groups significantly differed from those of the untreated group in hypoxic or normoxic conditions, as well as from the Lip-OXA-treated group in a hypoxic environment. Simultaneously, the Rg3-Lip-OXA/CaO2 group showed stronger fluorescence intensity compared to the Lip-OXA/CaO2 group.
Intracellular Ca2+ levels in HCT116 cells were assessed using Fluo 3-AM as a Ca2+ probe, emitting green fluorescence. Figure 3E showed that the green fluorescence signal of Ca2+ was almost absent in untreated cells in normoxic and hypoxic environments, similar to that in the Lip-OXA-treated group in a hypoxic environment. However, cells in the Lip-OXA/CaO2 and Rg3-Lip-OXA/CaO2 groups emitted green fluorescence, confirming Ca2+ overloading induced by CaO2. Figure 3F illustrated that the fluorescence intensities of the Lip-OXA/CaO2 and Rg3-Lip-OXA/CaO2 groups significantly differed from those of the other three groups (p < 0.001), with the fluorescence intensity of the CaO2-loaded group at least 2.55 times stronger than that of the other groups. Furthermore, cells in the Rg3-Lip-OXA/CaO2 group exhibited stronger green fluorescence than that of the other four groups (p < 0.01). These findings demonstrate that Rg3-Lip-OXA/CaO2 displayed good tumor hypoxia regulation properties and produced ROS and Ca2+ to induce mitochondrial damage.
Mitochondrial Damage
The extent of mitochondrial damage in HCT116 tumor cells was evaluated using the JC-1 probe. JC-1 is a dual-emission potential-sensitive probe,43 which exhibits red fluorescence as J-aggregates in healthy mitochondria with high mitochondrial membrane potential (MMP). Conversely, when the mitochondria are damaged, JC-1 presents green fluorescence as a monomer in the cytoplasm.63 As shown in Figure 3G and H, the control group exhibited complete red fluorescence, while CaO2-loaded liposomes, including Lip-OXA/CaO2 and Rg3-Lip-OXA/CaO2, presented varying degrees of green fluorescence. Notably, the Rg3-Lip-OXA/CaO2 group demonstrated the highest green fluorescence compared to the other groups, indicating a strong effect of Rg3-Lip-OXA/CaO2 on MMP. These results directly indicate that Rg3-Lip-OXA/CaO2 has a significant capability to induce mitochondrial damage, leading to effective apoptosis of tumor cells.
In vitro Cytotoxicity and Apoptosis
As shown in Figure S6, the cell survival rate of the combination group was lower than that in the single-drug group, indicating that Rg3 can enhance the cytotoxic effect of OXA on tumor cells. A CI value less than 1 indicates synergism, a value equal to 1 indicates additive effects, and a value greater than 1 indicates antagonism. The CI values for the Rg3 and OXA combination at all molar ratios were significantly less than 1, demonstrating a strong synergistic effect. Among the tested ratios, the combination ratio of 4:1 yielded the lowest CI value, indicating that Rg3 and OXA achieve the best synergistic effect at this ratio.
The cytotoxicity of various formulations, including OXA, Rg3-OXA/CaO2, Lip-OXA, Lip-OXA/CaO2, and Rg3-Lip-OXA/CaO2 in HCT116 cells was detected using CCK-8 assay, flow cytometry, live/dead cell staining, immunofluorescence staining of γ-H2AX, and colony formation assay. Figure 4A and B displayed the results of the CCK-8 method. All treatment groups exhibited decreased cell viability with concentration-dependent inhibitory effects. Rg3-OXA/CaO2 showed higher cytotoxicity in HCT116 cells than the free OXA group did, probably due to the enhance chemotherapy effect of Rg3 and CaO2. Furthermore, Lip-OXA/CaO2 showed higher cytotoxicity in HCT116 cells than Lip-OXA, probably due to hypoxia relief and mitochondria damage induced by CaO2. Due to the chemotherapeutic adjuvant and active targeting effect of Rg3, the cytotoxicity of Rg3-Lip-OXA/CaO2 was higher than Lip-OXA/CaO2. Rg3-Lip-OXA/CaO2 exhibited the strongest cytotoxicity among all liposome groups, with an IC50 value of 12.56 μM, which was 3.44, 1.66, 2.45, and 1.40 times lower than that of OXA, Rg3-OXA/CaO2, Lip-OXA, and Lip-OXA/CaO2 groups, respectively.
 |
Figure 4 In vitro cytotoxicity and apoptosis of different formulations in HCT116 cells. (A) Cell viability of HCT116 cells treated with different formulations for 48 h. (B) IC50 of various formulations. (C) The apoptosis quantitative analysis and (D) apoptosis assay results of HCT116 cells treated with different formulations for 48 h by flow cytometry. (E) Live/dead cell staining images of HCT116 cells treated with different formulations for 48 h. Data are presented as mean ± SD (n = 3). *p < 0.05, **p < 0.01, ***p < 0.001, ****p < 0.0001. |
To further confirm the cytotoxicity of Rg3-Lip-OXA/CaO2, flow cytometry and live/dead cell staining were conducted. The results were similar to those obtained from the CCK-8 assay. As illustrated in Figure 4C and D, the proportion of total apoptotic cells including early and late apoptosis in the OXA, Rg3-OXA/CaO2, Lip-OXA, Lip-OXA/CaO2, and Rg3-Lip-OXA/CaO2 groups was 16.78%, 24.75%, 19.7%, 37.87%, and 55.03%, respectively. Rg3-Lip-OXA/CaO2 significantly induced cell apoptosis in contrast to the other groups. The enhanced cytotoxicity of Rg3-Lip-OXA/CaO2 was further affirmed through live/dead cell staining using fluorescence microscopy (Figure 4E). The red fluorescence emitted by dead cells in the Rg3-Lip-OXA/CaO2 group far surpasses that observed in the other groups. As shown in Figure S7, the intensity of green fluorescence (indicating γ-H2AX proteins) in control group was barely visible, whereas the fluorescence intensity increased after treated with different OXA formulations. Notably, the fluorescence intensity was more highly concentrated in the nuclei of Rg3-Lip-OXA/CaO2-treated cells compared to the other groups. The fluorescence quantitative results showed that the fluorescence intensity in Rg3-Lip-OXA/CaO2 group was highest, which was significantly different from the other five groups. This result confirms that Rg3-Lip-OXA/CaO2 induced the strongest DNA damage. In the colony formation assays, the control group cells formed a large number of colonies (Figure S8). However, after being treated with different formulations, the number of colonies decreased to varying extents. Notably, the number of colonies in the Rg3-Lip-OXA/CaO2 group was the lowest, indicating that Rg3-Lip-OXA/CaO2 significantly inhibited the colony-forming ability of HCT116 cells. These results underscore the strongest cytotoxicity of Rg3-Lip-OXA/CaO2 in HCT116 cells, mainly attributed to the improved cellular uptake of Rg3-Lip and the enhanced chemotherapy effect of Rg3 and CaO2.
In vivo Fluorescence Imaging
To assess liposome biodistribution, DiR was used as a lipid-soluble probe instead of a drug for in vivo fluorescence imaging. Figure 5A illustrated tumor fluorescence intensity gradually increased over time in the liposome groups of Lip-DiR and peaked at 6 h, likely attributed to the long-circulation time and EPR effect of liposomes.64 Conversely, no fluorescence was detected in the tumor area among the free DiR group at any time point, indicating the absence of tumor uptake because of the DiR rapid clearance from blood circulation. At every time points, the tumor fluorescence intensity of the Rg3-Lip-DiR group was superior compared to that of Lip-DiR group due to the modification of Rg3. Quantitative results (Figure 5C) indicated that the Rg3-Lip-DiR group exhibited greater tumor retention compared to the Lip-DiR group. Throughout all time points assessed, the fluorescence intensity within the tumors of the Rg3-Lip-DiR group was markedly elevated compared to both the DiR and Lip-DiR groups (p < 0.0001), highlighting the effective targeting capability of Rg3.
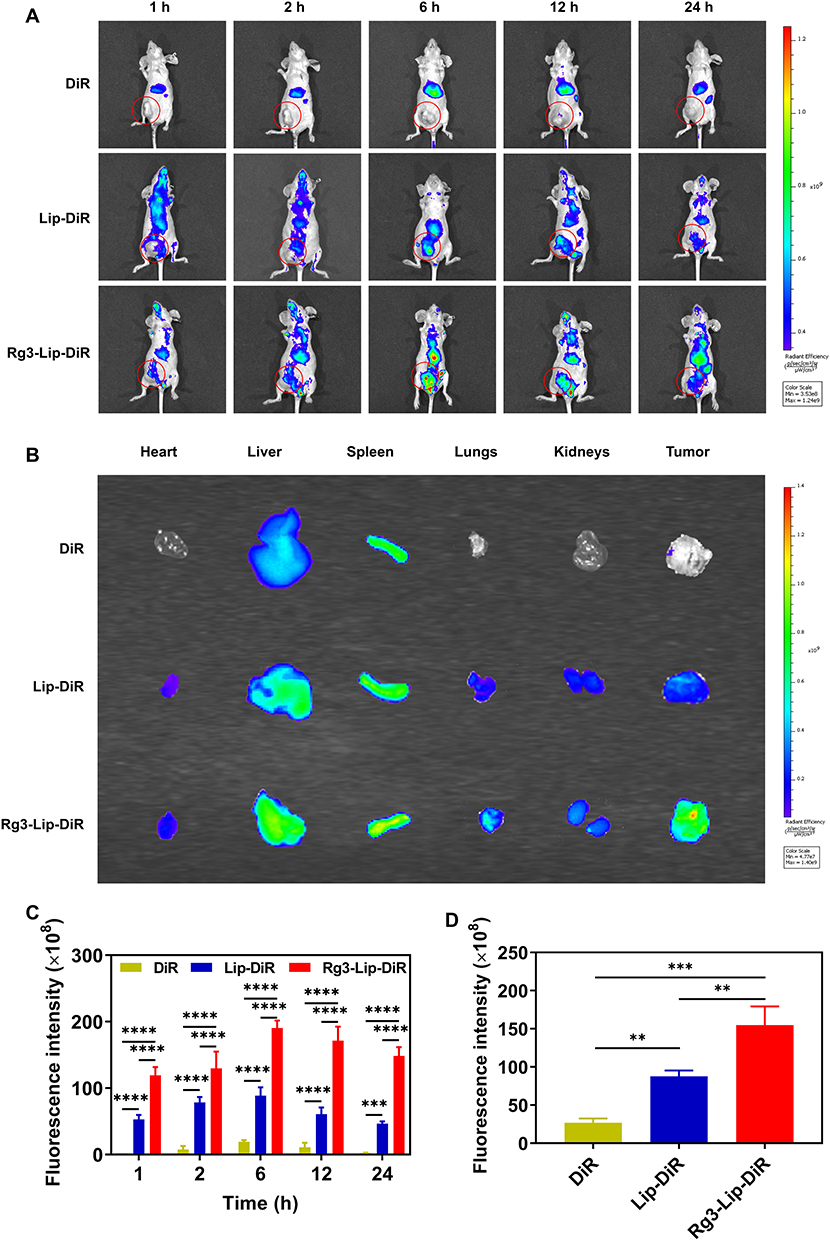 |
Figure 5 In vivo fluorescence imaging of Rg3-Lip-DiR. (A) In vivo fluorescence imaging of different DiR formulations in HCT116 tumor-bearing athymic mice at predetermined time points. (B) Ex vivo fluorescence images of the main organs and tumors at 6 h. (C) Quantification of fluorescence intensity at tumor sites of (A). (D) Quantification of fluorescence intensity at tumor sites of (B). Data are presented as mean ± SD (n = 3). **p < 0.01, ***p < 0.001, ****p < 0.0001. |
To further demonstrate the tumor targetability of Rg3-Lip-DiR, tumor-bearing mice were euthanized 6 h post-administration. Figure 5B showed the fluorescence imaging results of tumors and major organs. Rg3-Lip-DiR showed significantly higher intra-tumoral DiR accumulation than DiR and Lip-DiR. In addition, no fluorescence was observed in organs or tumor sites in the free DiR group, likely due to the rapid clearance of free DiR in vivo. Contrastingly, both Lip-DiR and Rg3-Lip-DiR were distributed across various organs, possibly because the liposomes enhanced drug bioavailability, thereby increasing drug accumulation.65,66 The higher fluorescence intensity observed in the liver for both the Lip-DiR and Rg3-Lip-DiR groups, compared to the free DiR group, was primarily attributed to reticuloendothelial system (RES) of the liver.57 Notably, The tumor fluorescence intensity in the Rg3-Lip-DiR group was 5.77 and 1.79 times stronger than that of the DiR and Lip-DiR groups at 6 h, respectively (Figure 5D). These findings confirm that Rg3-modified liposomes significantly enhanced tumor accumulation by actively targeting effect via binding to Glut1 on the tumor cell membrane.
In vivo Antitumor Efficacy Evaluation
As depicted in Figure 6A, an HCT116 tumor-bearing mouse model was established to assess the antitumor efficacy of various OXA formulations in vivo. Over the 24-day treatment period, the tumor volume in the control group increased swiftly, greatly surpassing that of the other groups (Figure 6B). The growth of tumors treated with Rg3-OXA/CaO2 was notably slower than that in the free OXA group, suggesting that Rg3 and CaO2 enhanced chemotherapy for the treatment of CRC. Lip-OXA/CaO2 demonstrated a superior ability to inhibit tumor proliferation compared to Lip-OXA, owing to the ability of CaO2 to relieve hypoxia and induce mitochondria damage. Figure 6C–E showed that the tumors in the Rg3-Lip-OXA/CaO2 group were the smallest among all groups, weighing only 0.41 g with the highest TIR of 81.11%. The tumor weight and TIR in the Rg3-Lip-OXA/CaO2 group significantly differed from those in the other groups (p < 0.05), and the TIR in the Rg3-Lip-OXA/CaO2 group was 4.19, 1.61, 1.75, and 1.23 times higher than that of OXA, Rg3-OXA/CaO2, Lip-OXA, and Lip-OXA/CaO2, respectively. Rg3-Lip-OXA/CaO2 exhibited the highest level of tumor suppression due to the synergistic functions of Rg3 and CaO2. Rg3 serves as a liposomal membrane stabilizer and actively targets Glut1 on tumor cell membranes,60,67 enhancing drug accumulation in tumor tissues. Additionally, Rg3 acts as a chemotherapy adjuvant, boosting the antitumor efficacy of chemotherapeutic agents.68 Meanwhile, the O2 produced from the reaction between CaO2 and H2O in the tumor tissue alleviates hypoxia, thereby sensitizing the tumor to chemotherapy. Furthermore, H2O2 and Ca2+ generated by CaO2 induce mitochondrial damage, leading to tumor cell apoptosis.69
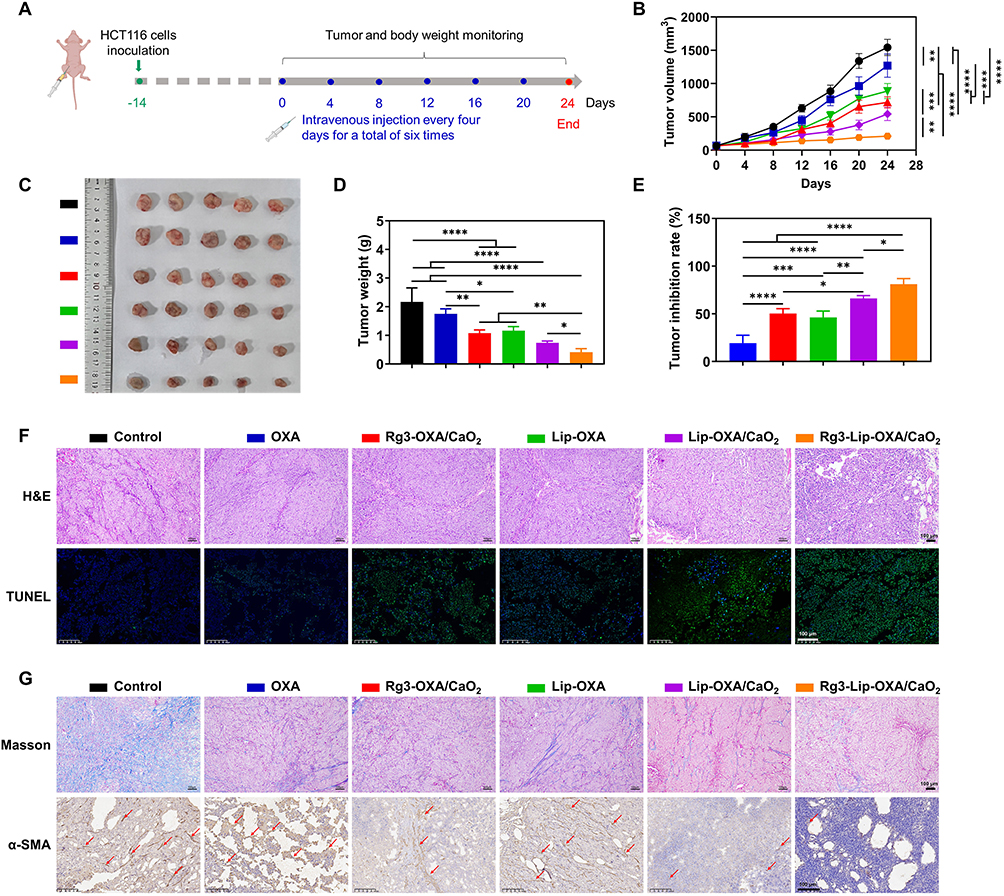 |
Figure 6 In vivo antitumor evaluation on the HCT116 tumor-bearing athymic mice. (A) Tumor inoculation and therapeutic schedule over 24 days. (B) The tumor growth curves, (C) tumor photographs, (D) tumor weight, and (E) tumor inhibition rate of tumor-bearing mice following the treatments. (F) The H&E staining and TUNEL assay of tumor tissues. (G) Masson’s trichrome assay and α-SMA immunohistochemistry staining of tumor tissues. Data are expressed as mean ± SD (n = 5). *p < 0.05, **p < 0.01, ***p < 0.001, ****p < 0.0001. |
H&E Staining and TUNEL Assay
To further determine the therapeutic effect of Rg3-Lip-OXA/CaO2, H&E staining and TUNEL assay were conducted, with the results showed in Figure 6F. The tumor cells in the control group displayed large, deeply stained nuclei, indicative of high proliferative activity. In contrast, the Rg3-Lip-OXA/CaO2-treated group exhibited shrunken nuclei and the largest area of necrosis compared to the other treatment groups. The TUNEL assay results confirmed that the Rg3-Lip-OXA/CaO2 group exhibited the most significant apoptosis. The green fluorescence signal in the control group was nearly absent, whereas it was the strongest in the Rg3-Lip-OXA/CaO2 group, indicating the strongest cytotoxic ability of Rg3-Lip-OXA/CaO2 against tumor cells. Collectively, these findings validated the optimal therapeutic efficacy of Rg3-Lip-OXA/CaO2.
Masson’s Trichrome, Immunohistochemistry and Immunofluorescence Staining Assay
Collagen forms the scaffold of the tumor microenvironment and promotes tumor infiltration, angiogenesis, invasion, and migration.70 The collagen content in tumor tissues was assessed using Masson’s trichrome staining, with results shown in Figure 6G. In the control group, collagen appeared as thick and widespread fibrous structures, whereas its expression was downregulated in the other groups. Notably, Rg3-Lip-OXA/CaO2 had a stronger effect on reducing collagen expression in tumors compared to the other treatments, indicating a significant improvement in the structure of the tumor microenvironment (TME).
Additionally, the expression of α-SMA (a marker for TAFs) in the tumors was evaluated using immunohistochemistry. TAFs are a major cell type in the solid tumor stroma, producing protective barriers and dense scaffolds for tumor cells, thereby inhibiting the interaction between drugs and cancer cells.71 Moreover, TAFs promote tumor growth, angiogenesis, immune escape, invasion, and metastasis by interacting with tumor cells and secreting various cytokines and chemokines.72,73 As shown in Figure 6G, α-SMA expression was high in the control group but decreased slightly in the Rg3-OXA/CaO2 group. All CaO2-containing liposomes, including Lip-OXA/CaO2 and Rg3-Lip-OXA/CaO2, exhibited a significant reduction in α-SMA content compared to the control group, likely due to the hypoxia-relieving effect of CaO2. Previous studies have shown that hypoxia reprograms normal fibroblasts into TAFs and stimulates TAF-mediated collagen secretion.74,75 Notably, Rg3-Lip-OXA/CaO2 showed the most significant inhibitory effect on α-SMA expression, likely due to the combined effects of Rg3 and CaO2. Rg3 inhibits TAF activation, possibly by suppressing TGF-β/Smad signaling, as described in previous studies.33 These findings indicate that Rg3-Lip-OXA/CaO2 enhances the therapeutic effect.
As shown in Figure S9, high HIF-1α expression was observed in the control group, while low expression was noted in the CaO2-contained groups. It is worthing noted that the green fluorescence intensity in Rg3-Lip-OXA/CaO2 group was weakest, which indicated the lowest expression of HIF-1α. The above evidences demonstrated that Rg3-Lip-OXA/CaO2 treatment significantly reduced hypoxia levels in the tumor microenvironment.
Safety Evaluation in in vivo Antitumor Efficacy Study
To preliminarily assess the safety of Rg3-Lip-OXA/CaO2 in vivo, the body weights of mice were recorded during the antitumor study and blood samples and major organs were collected at the end of 24 days of treatment. As shown in Figure 7A, the weight fluctuations of the mice were minimal and within a healthy threshold. While the body weights of mice in the OXA group showed a consistent decline, those in the Rg3-Lip-OXA/CaO2 group increased throughout the experiment, indicating the safety of Rg3-Lip-OXA/CaO2. Figure 7B indicated that the organ coefficients did not vary significantly between the treatment and control groups. Furthermore, H&E staining of the main organs revealed no noticeable pathological changes across all treatment groups (Figure 7C).
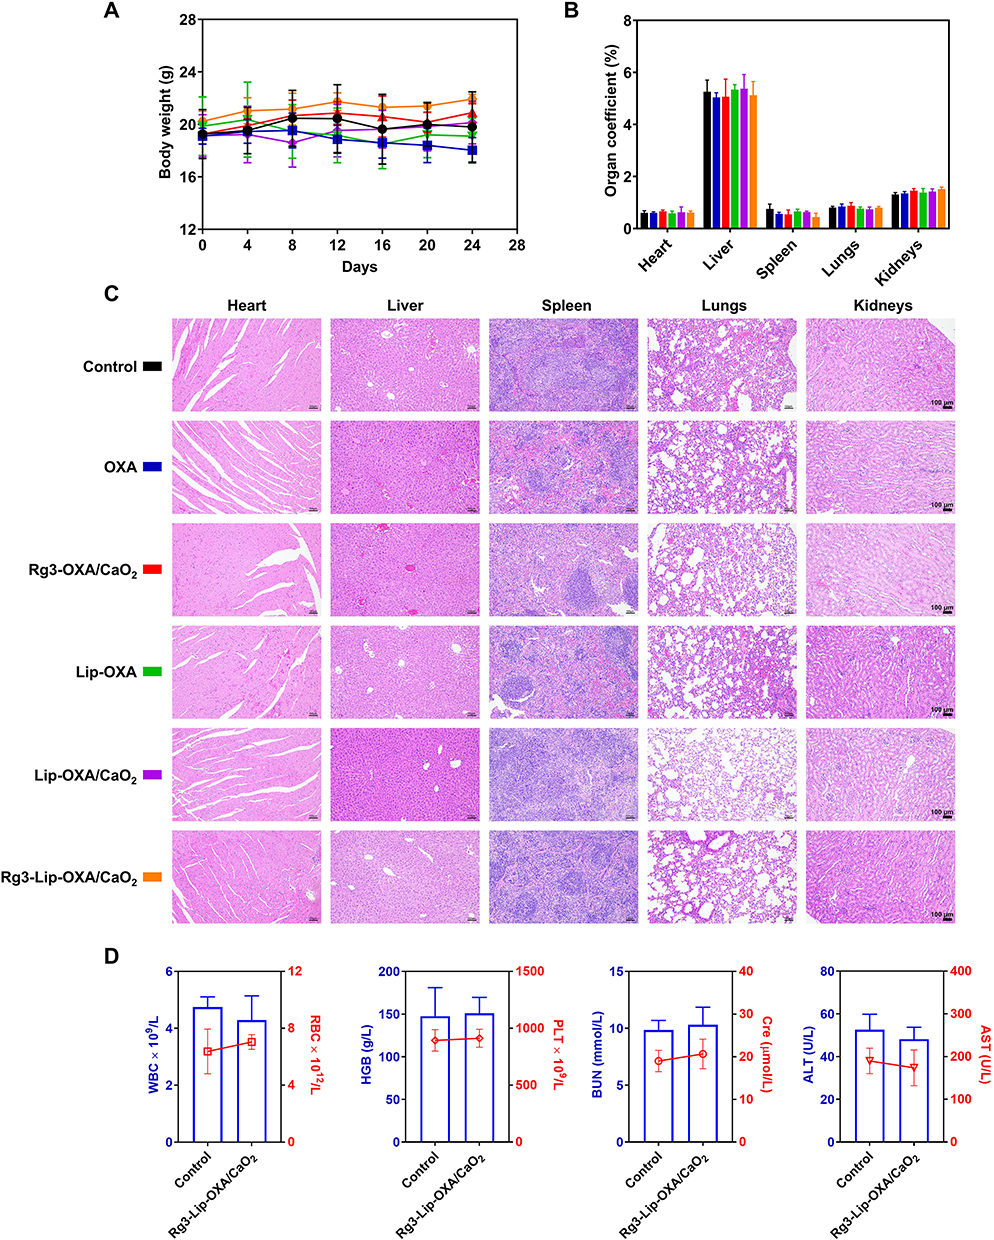 |
Figure 7 The safety evaluation of different formulations on the HCT116 tumor-bearing athymic mice. (A) Body weight change of mice throughout the 24-day experiment. (B) The organ coefficients and (C) H&E staining of major organs. (D) Blood routine analysis and biochemical analysis results of WBC, RBC, HGB, PLT, BUN, Cre, ALT, and AST. Data are presented as mean ± SD (n = 5). |
Hematological parameters are crucial indicators for safety evaluation. Figure 7D showed the results of routine blood tests and blood biochemical analyses conducted on mice injected intravenously with normal saline and Rg3-Lip-OXA/CaO2. The levels of red blood cell (RBC), white blood cell (WBC), platelet (PLT) and hemoglobin (HGB) in the Rg3-Lip-OXA/CaO2 group were comparable to those in the control group, illustrating that Rg3-Lip-OXA/CaO2 had no obvious hematological toxicity. Furthermore, the changes of urea nitrogen (BUN), creatinine (Cre), alanine aminotransferase (ALT), and aspartate aminotransferase (AST) between the control and Rg3-Lip-OXA/CaO2 group was not significant, suggesting that the encapsulation of OXA in Rg3-Lip reduced the hepatotoxicity of OXA. These findings underscore the favorable biocompatibility and low systemic toxicity of Rg3-Lip-OXA/CaO2.
In vivo Acute Toxicity
Due to the systemic toxicity of OXA, evaluating the safety of Rg3-Lip-OXA/CaO2 is crucial. The acute toxicity test mainly involves observing toxic reactions in mice following a single administration, serving as the first step in toxicity research. After 14 days of observation, the median lethal concentration (LD50) was calculated using SPSS software. The LD50 values for Rg3-OXA/CaO2 and Rg3-Lip-OXA/CaO2 were determined to be 18.27 mg/kg and 21.07 mg/kg, respectively, representing 1.31 and 1.51 times greater than that of the OXA group with 13.97 mg/kg. Figure 8A illustrated the fatalities among mice in the OXA group receiving the maximum dosage of 16 mg/kg, which transpired on the fourth day, culminating in a total mortality rate of 100%. In contrast, all mice survived in the Rg3-OXA/CaO2 group at the same dose (16 mg/kg) and in the Rg3-Lip-OXA/CaO2 group at a higher dose (19 mg/kg), demonstrating that the addition of Rg3 and the encapsulation of liposomes significantly increased the safety of OXA (Figure 8B and C). Rg3-OXA/CaO2 was safer than OXA, probably due to the role of Rg3 as a chemotherapy adjuvant in alleviating drug-induced toxicity.76
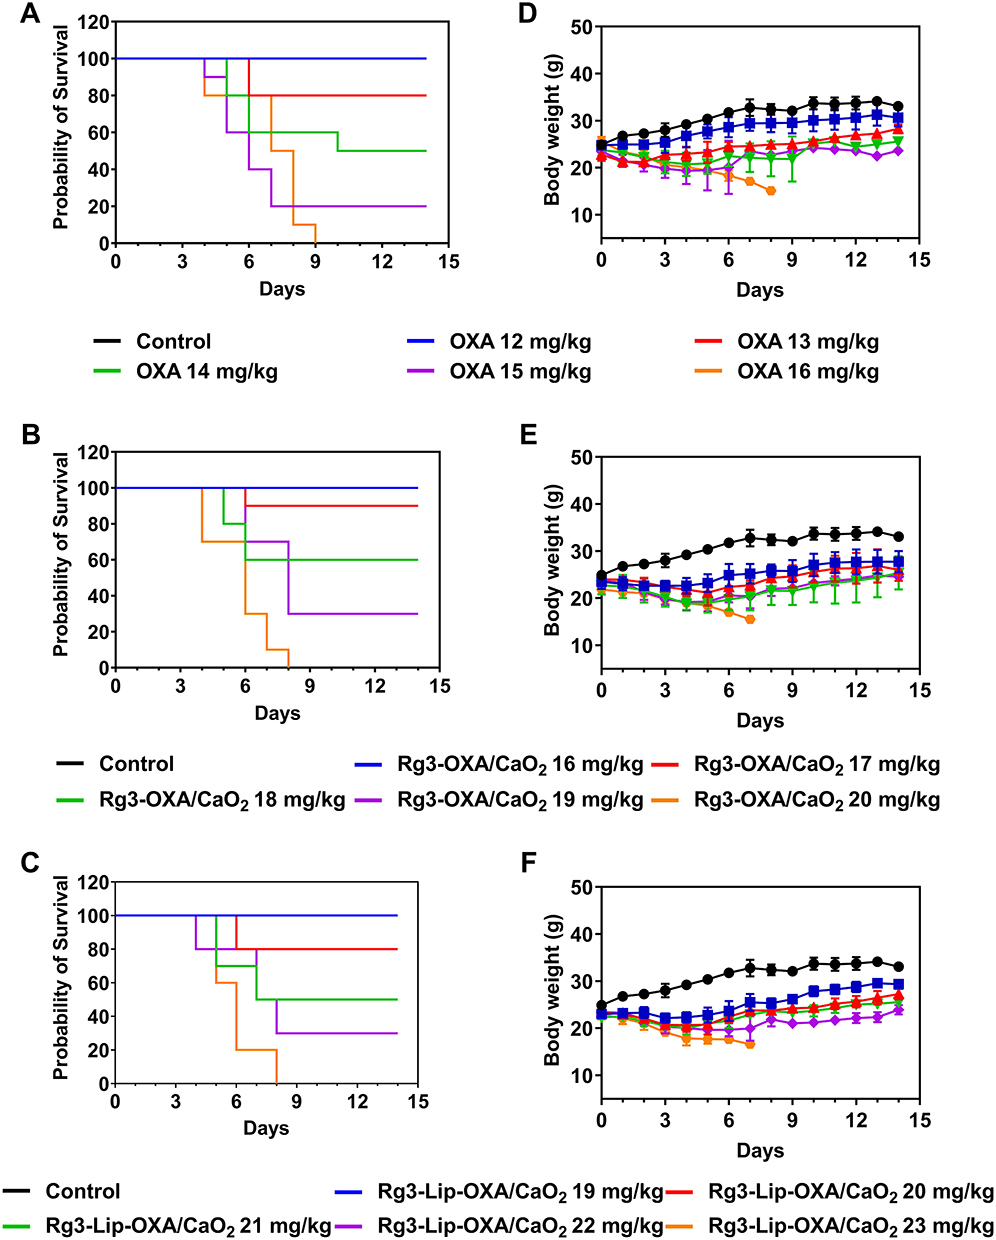 |
Figure 8 Acute toxicity assessment. Survival curves and body weight changes after intravenous administration with (A and D) OXA, (B and E) Rg3-OXA/CaO2, and (C and F) Rg3-Lip-OXA/CaO2 at various doses. Data are presented as mean ± SD (n = 10). |
Figure 8D–F illustrated the body weight changes of the mice monitored over a 14-day trial. Mice receiving normal saline exhibited marked weight gain. In contrast, the mice administered with various formulations experienced a decline in body weight that was dependent on the dosage. At a dose of 16 mg/kg, the OXA-treated mice continued to lose weight until death, whereas the Rg3-OXA/CaO2 group remained a stable weight for the first four days and then gradually increased by 18.33% at the end of the experiment. Moreover, the Rg3-Lip-OXA/CaO2 group receiving a higher dose of 19 mg/kg recorded a weight increase of 27.45%. These findings corroborated the results of survival rates, suggesting that Rg3 liposomes effectively mitigated the toxicity of chemotherapeutic drug.
At the end of the experiment, the mice were euthanized to collect blood samples and main organs for routine blood tests, blood biochemical analysis, calculation of OC, and H&E staining of main organs. Table 2 showed that no notable distinction occurred in OC between the experimental and control groups. The OXA group exhibited reduced levels of WBC, HGB, and PLT compared to the control group, owing to the myelosuppression caused by OXA (Figure 9A). In contrast, the WBC, RBC, HGB, and PLT counts in the Rg3-Lip-OXA/CaO2 group remained comparable to those in the control group, indicating the enhanced safety profile of Rg3 liposomes. Similar trends were observed in the biochemical analysis, with a notable increase in BUN and Cre levels in the OXA group, while minor changes were observed in the Rg3-Lip-OXA/CaO2 group than those in the control group (Figure 9B). Furthermore, the H&E staining of the major organs showed no obvious pathological alterations in the low dose of Rg3-Lip-OXA/CaO2 group (Figure 9C). Overall, the Rg3 liposome is a safe nanosystem for cancer treatment and effectively reduces the toxicity associated with chemotherapeutic drugs.
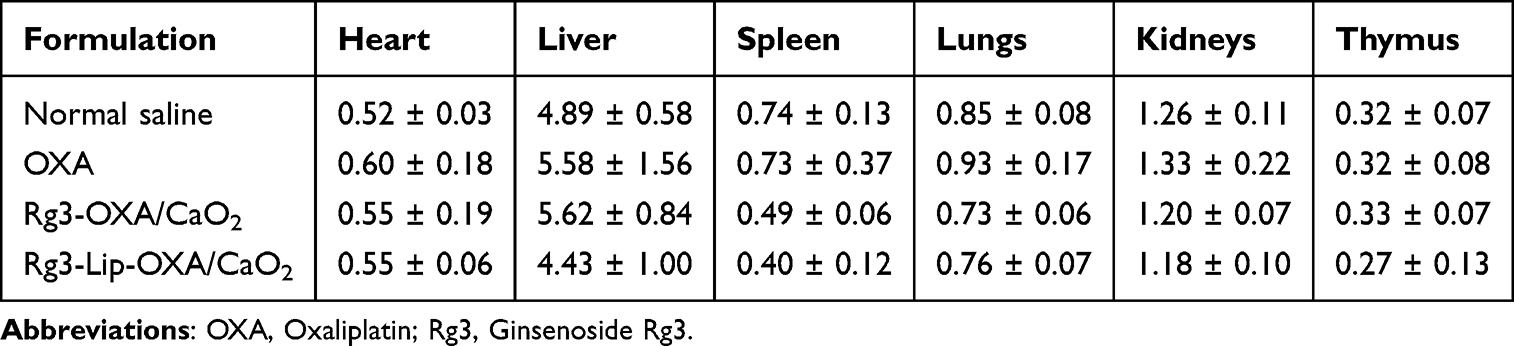 |
Table 2 The Organ Coefficients (%) of Mice in Low-Dose Groups in Acute Toxicity Experiment (n = 10) |
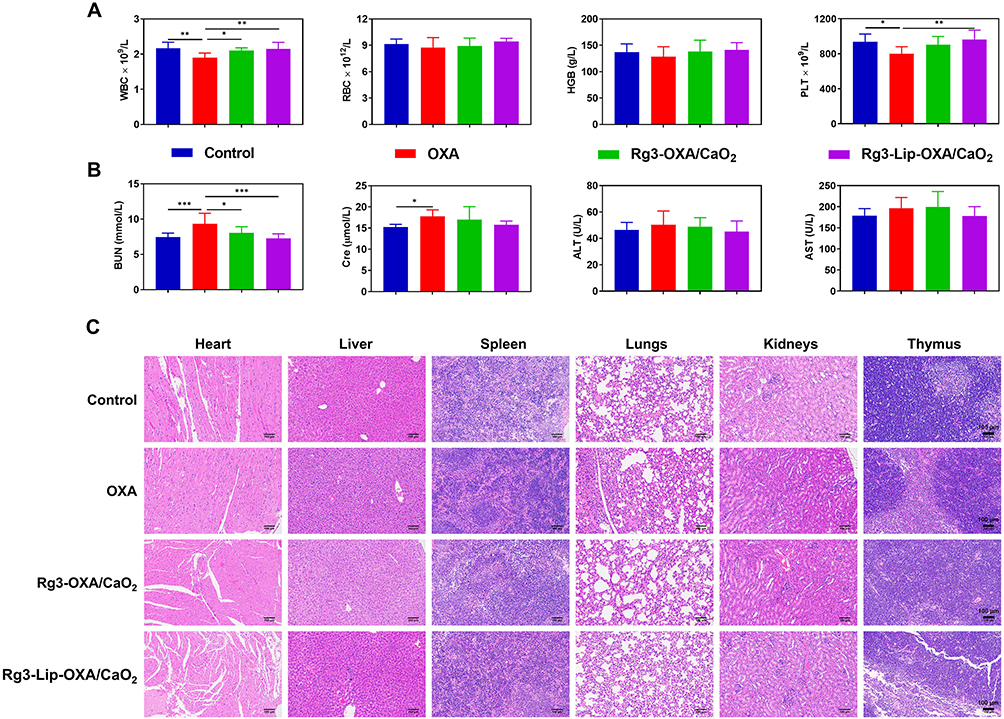 |
Figure 9 Acute toxicity assessment. (A) The blood routine analysis and (B) biochemical analysis results of low dose groups. (C) H&E staining of main organs of low dose groups. Data are expressed as mean ± SD (n = 10). *p < 0.05, **p < 0.01, ***p < 0.001. |
Conclusion
In this study, a multifunctional nanosystem, Rg3-Lip-OXA/CaO2, was designed for the co-delivery of oxaliplatin (OXA) and calcium peroxide (CaO2) to simultaneously modulate the tumor microenvironment (TME) and inhibit tumor growth in colorectal cancer (CRC). The targeting ability of Rg3 for Glut1 enhanced liposome uptake by HCT116 cells and improved the tumor accumulation of chemotherapeutic agents. Rg3-Lip-OXA/CaO2 demonstrated superior efficacy in CRC treatment both in vitro and in vivo by mitigating the hypoxic environment and inducing mitochondrial damage. Additionally, our nanosystem reduced α-SMA and collagen expression in tumors through the combined effects of CaO2 and Rg3. Safety evaluations confirmed that Rg3-Lip-OXA/CaO2 does not significantly affect major organs, supporting its potential as a safe and effective nanotherapeutic for CRC treatment. These results highlight Rg3-Lip-OXA/CaO2 as a promising candidate for clinical application in CRC therapy.
Acknowledgments
This work received the technical support from the Key Laboratory of Pathological Biology of the Ministry of Education at Jilin University for the technical support.
Funding
This work was funded by the Science and Technology Development Project from Jilin Science and Technology Department (YDZJ202301ZYTS531).
Disclosure
The authors report no conflicts of interest in this work.
References
1. Malki A, Abu ElRuz R, Gupta I, Allouch A, Vranic S, Al Moustafa AE. Molecular mechanisms of colon cancer progression and metastasis: recent insights and advancements. Int J Mol Sci. 2021;22(1):130. doi:10.3390/ijms22010130
2. Keum N, Giovannucci E. Global burden of colorectal cancer: emerging trends, risk factors and prevention strategies. Review. Nat Rev Gastroenterol Hepatol. 2019;16(12):713–732. doi:10.1038/s41575-019-0189-8
3. Liu Y, Zheng Z. Understanding the global cancer statistics 2022: growing cancer burden. Article; Early Access. Sci Chin Life Sci. 2024. doi:10.1007/s11427-024-2657-y
4. Bray F, Laversanne M, Sung H, et al. Global cancer statistics 2022: GLOBOCAN estimates of incidence and mortality worldwide for 36 cancers in 185 countries. Article. CA-Cancer J Clin. 2024;74(3):229–263. doi:10.3322/caac.21834
5. Nierengarten MB. Global cancer statistics 2022. News Item. Cancer. 2024;130(15). doi:10.1002/cncr.35444
6. Lichtenstern CR, Ngu RK, Shalapour S, Karin M. Immunotherapy, inflammation and colorectal cancer. Cells. 2020;9(3):618. doi:10.3390/cells9030618
7. Du W, Yang X, He S, et al. Novel hyaluronic acid oligosaccharide-loaded and CD44v6-targeting oxaliplatin nanoparticles for the treatment of colorectal cancer. Article. Drug Delivery. 2021;28(1):920–929. doi:10.1080/10717544.2021.1914777
8. Hu L, Huang S, Chen G, et al. Nanodrugs incorporating LDHA siRNA inhibit M2-like polarization of TAMs and amplify autophagy to assist oxaliplatin chemotherapy against colorectal cancer. Article; Early Access. ACS Appl. Mater. Interfaces. 2022. doi:10.1021/acsami.2c05841
9. Wang Y, Ma J, Qiu T, Tang M, Zhang X, Dong W. In vitro and in vivo combinatorial anticancer effects of oxaliplatin- and resveratrol-loaded N,O-carboxymethyl chitosan nanoparticles against colorectal cancer. Eur J Pharm Sci. 2021;163105864. doi:10.1016/j.ejps.2021.105864
10. Chen Z, Han F, Du Y, Shi H, Zhou W. Hypoxic microenvironment in cancer: molecular mechanisms and therapeutic interventions. Review. Signal Transduction and Targeted Therapy. 2023;8(1):70. doi:10.1038/s41392-023-01332-8
11. Chen M, Liu D, Liu F, Wu Y, Peng X, Song F. Recent advances of redox-responsive nanoplatforms for tumor theranostics. Review. Early Access. J Controlled Release. 2021;332:269–284. doi:10.1016/j.jconrel.2021.02.030
12. Braumueller H, Mauerer B, Andris J, Berlin C, Wieder T, Kesselring R. The cytokine network in colorectal cancer: implications for new treatment strategies. Review. Cells. 2023;12(1):138. doi:10.3390/cells12010138
13. Sheng Y, Nesbitt H, Callan B, et al. Oxygen generating nanoparticles for improved photodynamic therapy of hypoxic tumours. Article. J Control Release. 2017;264:333–340. doi:10.1016/j.jconrel.2017.09.004
14. Sun W, Xiao H, Zhu J, et al. Multifunctional oxygen-generating nanoflowers for enhanced tumor therapy. Article. ACS Appl. Bio Mater. 2023;6(11):4998–5008. doi:10.1021/acsabm.3c00678
15. Zhang X, He C, Sun Y, et al. A smart O2-generating nanocarrier optimizes drug transportation comprehensively for chemotherapy improving. Article. Acta Pharmaceutica Sinica B. 2021;11(11):3608–3621. doi:10.1016/j.apsb.2021.04.021
16. Dai Z, Zhang Q, Li X, et al. In situ forming pH/ROS-responsive niche-like hydrogel for ultrasound-mediated multiple therapy in synergy with potentiating anti-tumor immunity. Article. Mater Today. 2023;65:62–77. doi:10.1016/j.mattod.2023.03.025
17. Xu M, Liu Y, Luo W, et al. A multifunctional nanocatalytic system based on Chemodynamic- Starvation therapies with enhanced efficacy of cancer treatment. Article. J Colloid Interface Sci. 2023;630:804–816. doi:10.1016/j.jcis.2022.10.145
18. He J, Fu L-H, Qi C, Lin J, Huang P. Metal peroxides for cancer treatment. Review. Bioact. Mater. 2021;6(9):2698–2710. doi:10.1016/j.bioactmat.2021.01.026
19. He C, Zhang S, Liu X, et al. CaO2 nanomedicines: a review of their emerging roles in cancer therapy. Review. Nanotechnology. 2023;34(48):482002. doi:10.1088/1361-6528/acf381
20. Liu L-H, Zhang Y-H, Qiu W-X, et al. Dual-stage light amplified photodynamic therapy against hypoxic tumor based on an O2 self-sufficient nanoplatform. Article. Small. 2017;13(37):1701621. doi:10.1002/smll.201701621
21. Wang Y, Wang S, Li S, Zhen W, Jia X, Jiang X. Hollow cavity CaO2@polydopamine nanocomposites for pH-responsive Ca2+-enhanced efficient mild hyperthermia in the NIR-II region. Article. Adv. Healthcare Mater. 2024;13(5):2302634. doi:10.1002/adhm.202302634
22. Zheng P, Ding B, Shi R, et al. A multichannel Ca2+ nanomodulator for multilevel mitochondrial destruction-mediated cancer therapy. Article. Adv. Mater. 2021;33(15):2007426. doi:10.1002/adma.202007426
23. Pang Y, Lv J, He C, et al. Covalent organic frameworks-derived carbon nanospheres based nanoplatform for tumor specific synergistic therapy via oxidative stress amplification and calcium overload. J Colloid Interface Sci. 2024;661:908–922. doi:10.1016/j.jcis.2024.01.217
24. Gao S, Jin Y, Ge K, et al. Self-supply of O2 and H2O2 by a nanocatalytic medicine to enhance combined chemo/chemodynamic therapy. Article. Adv. Sci. 2019;6(24):1902137. doi:10.1002/advs.201902137
25. Zhao J, Dai W, Zhan L, et al. Sorafenib-encapsulated liposomes to activate hypoxia-sensitive tirapazamine for synergistic chemotherapy of hepatocellular carcinoma. ACS Appl. Mater. Interfaces. 2024;16(9):11289–11304. doi:10.1021/acsami.3c18051
26. Meeroekyai S, Jaimalai T, Suree N, Prangkio P. CD4+ T cell-targeting immunoliposomes for treatment of latent HIV reservoir. Article. Eur. J. Pharm. Biopharm. 2024;195114166. doi:10.1016/j.ejpb.2023.12.006.
27. Wang S, Chen Y, Guo J, Huang Q. Liposomes for tumor targeted therapy: a review. Review. Int J Mol Sci. 2023;24(3):2643. doi:10.3390/ijms24032643
28. Favarin BZ, Andrade MAR, Bolean M, et al. Effect of the presence of cholesterol in the interfacial microenvironment on the modulation of the alkaline phosphatase activity during in vitro mineralization. Article. Colloids Surf B Biointerfaces. 2017;155:466–476. doi:10.1016/j.colsurfb.2017.04.051
29. Chen C, Xia J, Ren H, et al. Effect of the structure of ginsenosides on the in vivo fate of their liposomes. Article. Asian J. Pharm. Sci. 2022;17(2):219–229. doi:10.1016/j.ajps.2021.12.002
30. Xia J, Ma S, Zhu X, et al. Versatile ginsenoside Rg3 liposomes inhibit tumor metastasis by capturing circulating tumor cells and destroying metastatic niches Article. Sci Adv. 2022;8(6):eabj1262. doi:10.1126/sciadv.abj1262
31. Oh H-M, Cho C-K, Son C-G. Experimental evidence for the anti-Metastatic action of ginsenoside Rg3: a systematic review. Int J Mol Sci. 2022;23(16):9077. doi:10.3390/ijms23169077
32. Li M, Wang X, Wang Y, et al. Strategies for remodeling the tumor microenvironment using active ingredients of Ginseng-A promising approach for cancer therapy. Review. Front Pharmacol. 2021;12797634. doi:10.3389/fphar.2021.797634.
33. Xia J, Zhang S, Zhang R, et al. Targeting therapy and tumor microenvironment remodeling of triple-negative breast cancer by ginsenoside Rg3 based liposomes. Article. J Nanobiotechnol. 2022;20(1):414. doi:10.1186/s12951-022-01623-2
34. Sun D, Zou Y, Song L, et al. A cyclodextrin-based nanoformulation achieves co-delivery of ginsenoside Rg3 and quercetin for chemo-immunotherapy in colorectal cancer. Article. Acta Pharmaceutica Sinica B. 2022;12(1):378–393. doi:10.1016/j.apsb.2021.06.005
35. Wu H, Wei G, Luo L, et al. Ginsenoside Rg3 nanoparticles with permeation enhancing based chitosan derivatives were encapsulated with doxorubicin by thermosensitive hydrogel and anti-cancer evaluation of peritumoral hydrogel injection combined with PD-L1 antibody. Article. Biomater Res. 2022;26(1):77. doi:10.1186/s40824-022-00329-8
36. Chen M, Qiao Y, Cao J, Ta L, Ci T, Ke X. Biomimetic doxorubicin/ginsenoside co-loading nanosystem for chemoimmunotherapy of acute myeloid leukemia. Article. J Nanobiotechnol. 2022;20(1):273. doi:10.1186/s12951-022-01491-w
37. Zhu Y, Wang A, Zhang S, et al. Paclitaxel-loaded ginsenoside Rg3 liposomes for drug-resistant cancer therapy by dual targeting of the tumor microenvironment and cancer cells. Article. J Adv Res. 2023;49:159–173. doi:10.1016/j.jare.2022.09.007
38. Wang J, Tian L, Khan MN, et al. Ginsenoside Rg3 sensitizes hypoxic lung cancer cells to cisplatin via blocking of NF-κB mediated epithelial-mesenchymal transition and stemness. Article. Cancer Lett. 2018;415:73–85. doi:10.1016/j.canlet.2017.11.037
39. Jiang Z, Yang Y, Yang Y, et al. Ginsenoside Rg3 attenuates cisplatin resistance in lung cancer by downregulating PD-L1 and resuming immune. Article. Biomed. Pharmacother. 2017;96:378–383. doi:10.1016/j.biopha.2017.09.129
40. Haber RS, Rathan A, Weiser KR, et al. GLUT1 glucose transporter expression in colorectal carcinoma: a marker for poor prognosis.; Research Support, U.S. Gov’t, P.H.S. Cancer. 1998;83(1):34–40. [10.1002/(sici)1097-0142(19980701)83:1<34::Aid-cncr5>3.0.Co;2-e]. doi:10.1002/(SICI)1097-0142(19980701)83:1<34::AID-CNCR5>3.0.CO;2-E
41. Zhang X, He C, Chen Y, et al. Cyclic reactions-mediated self-supply of H2O2 and O2 for cooperative chemodynamic/starvation cancer therapy. Article. Biomaterials. 2021;275120987. doi:10.1016/j.biomaterials.2021.120987.
42. Xie Y, Ren Z, Chen H, et al. A novel estrogen-targeted PEGylated liposome co-delivery oxaliplatin and paclitaxel for the treatment of ovarian cancer. Biomed Pharmacothe. 2023;160:114304. doi:10.1016/j.biopha.2023.114304
43. Chen Y-C, Liu Y-J, Lee C-L, et al. Engineering H2O2 and O2 self-supplying nanoreactor to conduct synergistic chemiexcited photodynamic and calcium-overloaded therapy in orthotopic hepatic tumors. article; early access. Adv. Healthcare Mater. 2022;11(20):2201613. doi:10.1002/adhm.202201613
44. Choi YS, Cho H, Choi WG, et al. Beyond hydrophilic polymers in amphiphilic polymer-based self-assembled NanoCarriers: small hydrophilic carboxylate-capped disulfide drug delivery system and its multifunctionality and multispatial targetability. Biomaterials. 2022;280121307. doi:10.1016/j.biomaterials.2021.121307.
45. Nikpoor AR, Tavakkol-Afshari J, Gholizadeh Z, et al. Nanoliposome-mediated targeting of antibodies to tumors: IVIG antibodies as a model. Article. Int J Pharm. 2015;495(1):162–170. doi:10.1016/j.ijpharm.2015.08.048
46. Hong C, Wang D, Liang J, et al. Novel ginsenoside-based multifunctional liposomal delivery system for combination therapy of gastric cancer. Article. Theranostics. 2019;9(15):4437–4449. doi:10.7150/thno.34953
47. Jolly A, Hour Y, Lee Y-C. An outlook on the versatility of plant saponins: a review. Review. Fitoterapia. 2024;174105858. doi:10.1016/j.fitote.2024.105858
48. Kaur R, Mishra V, Gupta S, Sharma S, Vaishnav A, Singh SV. Industrial and environmental applications of plant-derived saponins: an overview and future prospective. Review. J Plant Growth Regul. 2024;43(9):3012–3026. doi:10.1007/s00344-023-11201-x
49. Maritim S, Boulas P, Lin Y. Comprehensive analysis of liposome formulation parameters and their influence on encapsulation, stability and drug release in glibenclamide liposomes. Article. Int J Pharm. 2021;592120051. doi:10.1016/j.ijpharm.2020.120051
50. Wu P, Chen L, Chen M, et al. Use of sodium alginate coatings to improve bioavailability of liposomes containing DPP-IV inhibitory collagen peptides. Article. Food Chem. 2023;414135685. doi:10.1016/j.foodchem.2023.135685.
51. Ali M, Farooq U, Lyu S, et al. Synthesis of controlled release calcium peroxide nanoparticles (CR-nCPs): characterizations, H2O2 liberate performances and pollutant degradation efficiency. Article. Sep Purif Technol. 2020;241116729. doi:10.1016/j.seppur.2020.116729.
52. Farshi Azhar F, Ahmadi M, Khoshmaram L. Chitosan-graphene quantum dot-based molecular imprinted polymer for oxaliplatin release. Article. J Biomater Sci-Polym Ed. 2024;35(14):2115–2136. doi:10.1080/09205063.2024.2366645
53. De Leo V, Maurelli AM, Giotta L, Catucci L. Liposomes containing nanoparticles: preparation and applications. Article. Colloids Surf B Biointerfaces. 2022;218112737. doi:10.1016/j.colsurfb.2022.112737
54. Li M, Du C, Guo N, et al. Composition design and medical application of liposomes. Review. Eur. J. Med. Chem. 2019;164:640–653. doi:10.1016/j.ejmech.2019.01.007
55. Lombardo D, Kiselev MA. Methods of liposomes preparation: formation and control factors of versatile nanocarriers for biomedical and nanomedicine application. Review. Pharmaceutics. 2022;14(3):543. doi:10.3390/pharmaceutics14030543
56. Sheikholeslami B, Lam NW, Dua K, Haghi M. Exploring the impact of physicochemical properties of liposomal formulations on their in vivo fate. Review. Life Sci. 2022;300120574. doi:10.1016/j.lfs.2022.120574
57. Allen TM, Cullis PR. Liposomal drug delivery systems: from concept to clinical applications. Review. Adv. Drug Delivery Rev. 2013;65(1):36–48. doi:10.1016/j.addr.2012.09.037
58. Almahmoud S, Jin W, Geng L, et al. Ligand-based design of GLUT inhibitors as potential antitumor agents. Article. Bioorg. Med. Chem. 2020;28(7):115395. doi:10.1016/j.bmc.2020.115395
59. Yang C, Xia A-J, Du C-H, et al. Discovery of highly potent and selective 7-ethyl-10-hydroxycamptothecin-glucose conjugates as potential anti-colorectal cancer agents. Article. Front Pharmacol. 2022;131014854. doi:10.3389/fphar.2022.1014854.
60. Zhu Y, Liang J, Gao C, et al. Multifunctional ginsenoside Rg3-based liposomes for glioma targeting therapy. Article. J Control Release. 2021;330:641–657. doi:10.1016/j.jconrel.2020.12.036
61. Bhattacherjee A, Hrynets Y, Betti M. Transport of the glucosamine-derived browning product fructosazine (polyhydroxyalkylpyrazine) across the human intestinal Caco-2 cell monolayer: role of the hexose transporters. Article. Journal of Agricultural and Food Chemistry. 2017;65(23):4642–4650. doi:10.1021/acs.jafc.7b01611
62. Vlachodimitropoulou E, Sharp PA, Naftalin RJ. Quercetin-iron chelates are transported via glucose transporters. Article. Free Radic Biol Med. 2011;50(8):934–944. doi:10.1016/j.freeradbiomed.2011.01.005
63. Chen X, Xu C, Zhao P, et al. A multichannel Ca2+nanomodulator amplifies exogenous and endogenous calcium overload for efficient antitumor and antimetastasis therapy. Article. Chem Eng J. 2023;463142478. doi:10.1016/j.cej.2023.142478.
64. Wang J, Wu Q, Wang Y, et al. Collagenase-loaded pH-sensitive nanocarriers efficiently remodeled tumor stroma matrixes and improved the enrichment of nanomedicines. Nanoscale. 2021;13(20):9402–9414. doi:10.1039/d1nr00950h
65. Fidan Y, Mucaj S, Timur SS, Gursoy RN. Recent advances in liposome-based targeted cancer therapy. Review. J Liposome Res. 2024;34(2):316–334. doi:10.1080/08982104.2023.2268710
66. Banerjee T, Sen K. Liposomal encapsulation of different anticancer drugs: an effective drug delivery technique. Review. Bionanoscience. 2024;14(3):3476–3495. doi:10.1007/s12668-024-01580-0
67. Li J, Zhang Y, Zhu A, Zeng W, Di L, Wang R. Ginsenoside Rg3-engineered exosomes as effective delivery platform for potentiated chemotherapy and photoimmunotherapy of glioblastoma. Article. Chem Eng J. 2023;471144692. doi:10.1016/j.cej.2023.144692
68. Lan J, Chen L, Li Z, et al. Multifunctional biomimetic liposomes with improved tumor-targeting for TNBC treatment by combination of chemotherapy, antiangiogenesis and immunotherapy. Article; Early Access. Adv. Healthcare Mater. 2024;13(26). doi:10.1002/adhm.202400046
69. Zhao W-N, Xing J, Wang M, et al. Engineering a hyaluronic acid-encapsulated tumor-targeted nanoplatform with sensitized chemotherapy and a photothermal effect for enhancing tumor therapy. Article. Int J Biol Macromol. 2024;264130785. doi:10.1016/j.ijbiomac.2024.130785.
70. Fang M, Yuan J, Peng C, Li Y. Collagen as a double-edged sword in tumor progression. Review. Tumor Biol. 2014;35(4):2871–2882. doi:10.1007/s13277-013-1511-7
71. Khawar IA, Kim JH, Kuh H-J. Improving drug delivery to solid tumors: priming the tumor microenvironment. Review. J Control Release. 2015;201:78–89. doi:10.1016/j.jconrel.2014.12.018
72. Ziani L, Buart S, Chouaib S, Thiery J. Hypoxia increases melanoma-associated fibroblasts immunosuppressive potential and inhibitory effect on T cell-mediated cytotoxicity. Article. Oncoimmunology. 2021;10(1):1950953. doi:10.1080/2162402x.2021.1950953
73. Yang S, Gao H. Nanoparticles for modulating tumor microenvironment to improve drug delivery and tumor therapy. Review. Pharmacol Res. 2017;126:97–108. doi:10.1016/j.phrs.2017.05.004
74. Kim I, Choi S, Yoo S, Lee M, Kim I-S. Cancer-associated fibroblasts in the hypoxic tumor microenvironment. Review. Cancers. 2022;14(14):3321. doi:10.3390/cancers14143321
75. Chen G, Wu K, Li H, Xia D, He T. Role of hypoxia in the tumor microenvironment and targeted therapy. Review. Front Oncol. 2022;12961637. doi:10.3389/fonc.2022.961637
76. Peng Z, Wu WW, Yi P. The efficacy of ginsenoside Rg3 combined with first-line chemotherapy in the treatment of advanced non-small cell lung cancer in China: a systematic review and meta-analysis of randomized clinical trials. Rev Front Pharmacol. 2021;11630825. doi:10.3389/fphar.2020.630825
 © 2025 The Author(s). This work is published and licensed by Dove Medical Press Limited. The
full terms of this license are available at https://www.dovepress.com/terms.php
and incorporate the Creative Commons Attribution
- Non Commercial (unported, 3.0) License.
By accessing the work you hereby accept the Terms. Non-commercial uses of the work are permitted
without any further permission from Dove Medical Press Limited, provided the work is properly
attributed. For permission for commercial use of this work, please see paragraphs 4.2 and 5 of our Terms.
© 2025 The Author(s). This work is published and licensed by Dove Medical Press Limited. The
full terms of this license are available at https://www.dovepress.com/terms.php
and incorporate the Creative Commons Attribution
- Non Commercial (unported, 3.0) License.
By accessing the work you hereby accept the Terms. Non-commercial uses of the work are permitted
without any further permission from Dove Medical Press Limited, provided the work is properly
attributed. For permission for commercial use of this work, please see paragraphs 4.2 and 5 of our Terms.