")
Back to Journals » ClinicoEconomics and Outcomes Research » Volume 17
Evaluating the Fiscal Impact of Antiretroviral Therapy for the Management of HIV in the United States 1987–2023
Authors Paquete AT , Mordi U, Jarrett J, Thaliffdeen R, Chaudhari P, Connolly MP , Kotsopoulos N, Sullivan PS
Received 30 January 2025
Accepted for publication 29 April 2025
Published 28 May 2025 Volume 2025:17 Pages 407—418
DOI https://doi.org/10.2147/CEOR.S520050
Checked for plagiarism Yes
Review by Single anonymous peer review
Peer reviewer comments 2
Editor who approved publication: Dr Xing Lin Feng
Ana Teresa Paquete,1 Uche Mordi,2 James Jarrett,3 Ryan Thaliffdeen,2 Paresh Chaudhari,2 Mark P Connolly,1,4 Nikos Kotsopoulos,1,5 Patrick S Sullivan6
1Department of Health Economics, Global Market Access Solutions LLC, Mooresville, North Carolina, USA; 2Gilead Sciences, Inc, Foster City, California, USA; 3Gilead Sciences Europe Ltd., Uxbridge, UK; 4Health Economics Outcomes Research, Global Health, University Medical Center Groningen, Groningen, Netherlands; 5Department of Economics, University of Athens MBA, University of Athens, Athens, Greece; 6Department of Epidemiology, Rollins School of Public Health, Emory University, Atlanta, Georgia, USA
Correspondence: Mark P Connolly, Email [email protected]
Purpose: Investments in antiretroviral therapy (ART) have shown to improve outcomes for those living with human immunodeficiency virus (HIV) and reduce exposure to and transmission of the virus. In the current work, we assess the impact of ART on government public accounts since its introduction in 1987.
Methods: National HIV epidemiological data from 1987 to 2023 were compared to a hypothetical no ART treatment scenario. This scenario was based on time series analysis, and on a transmission equation based on the effectiveness of ART. In the absence of historical epidemiological data, trend extrapolations were considered. The model assumes that individuals on ART are virally suppressed and, conservatively, excludes the impact of pre-exposure prophylaxis. The resulting differences in the number of HIV infections, acquired immunodeficiency syndrome (AIDS) cases and HIV-related deaths per year, were then considered to evaluate the impact on the labor market and on healthcare costs, based on the literature. The impact on employment was then used to estimate tax revenue and social benefits transfers. Results are presented separately with and without longevity effects.
Results: The investment in ART from 1987 to 2023 was estimated to prevent millions of new infections and AIDS cases and to avoid HIV-related deaths. This investment was estimated to provide a return of US$2.11 trillion from 1987 to 2023; each US$1 spent on ART was estimated to create a revenue of US$4.3 to the public sector in the USA. Results remained positive when longevity effects were included. One-way sensitivity analysis showed results were robust.
Conclusion: The analysis illustrates the broader economic benefits to the government attributed to public and private investments to develop and make ART available. The fiscal analysis of investing in ART shows a fourfold gain for the US government. This broader analysis is crucial to help shape health policy and funding decisions.
Plain Language Summary: Treatments for human immunodeficiency virus (HIV) infection cost money to provide, but also can have positive economic effects by keeping people healthy, avoiding healthcare costs from HIV-related illnesses, and allowing people living with HIV to stay healthy and contribute to the workforce. To describe the overall impact of HIV treatments on the US public economy, we used historical data since antiretroviral therapy (ART) was first made available in the United States (US) for the treatment of HIV and compared it with a scenario in which ART was not available (1987– 2023). The aims were to consider the benefits of ART use for health outcomes and in the labor market and to quantify the overall costs and benefits to the US government. The impact of ART use in reducing the number of HIV infections, AIDS (acquired immunodeficiency syndrome) cases, HIV-related deaths and on improving the outcomes of those living with HIV was analyzed in terms of economic transfers to the government. More workers in the labor market attributed to using ART stopped the loss of tax revenue and the need for governmental payments, such as unemployment insurance and disability benefits. The reduction of healthcare costs for HIV care financed by the government was also considered. Our model suggests that public investment in the development of progressively more effective ART resulted in a net financial gain for the government since the mid 1990s, with a current gain of US$ 4.3 per every US$ 1 spent on ART and a net present value of US$ 2.11 trillion from 1987 to 2023. An analysis of the impact of healthcare public spending in broader economic sectors is essential to improve the evidence available to public decision makers.
Keywords: antiretroviral therapy, HIV, economics, employment, viral suppression, innovation
Introduction
More than 30,000 people are diagnosed with the human immunodeficiency virus (HIV) every year in the United States (US),1,2 and the prevalence of people living with diagnosed or undiagnosed HIV was estimated at 1.2 million in 2022.2 The introduction of antiretroviral therapy (ART) for the treatment of HIV has dramatically extended and improved the lives of people living with HIV (PLHIV). Viral suppression after initiation of treatment with ART allows PLHIV to have healthier lives and reduces sexual transmission of the virus.3 Despite efficacious and effective treatment, PLHIV can still face challenges in maintaining viral suppression, including barriers to care, ART access issues, and other health-related challenges.4
Unsuppressed HIV infection results in increased morbidity and mortality, healthcare resource use, and increased costs for PLHIV, private insurers and government programs. Although the healthcare-related costs for PLHIV associated with the clinical burden of HIV have been widely discussed,5,6 there are several other economic factors which are impacted by HIV. Changes in employment status and lost wages due to ill health associated with HIV can impact the individuals and their families and also have profound impacts on decreasing tax revenue and increasing spending on public benefit programs.7–10 These indirect costs associated with HIV could comprise billions in productivity losses annually; therefore, improving the health outcomes of PLHIV and preventing new HIV infections is likely to have positive economic impacts on the government.11
The aim of the current work was to assess the public economic impact from the introduction and subsequent improvements to ART in the US. A cost–benefit analysis was used to quantify the return on investment since the first ART approval in 1987. A fiscal perspective was applied, quantifying costs and benefits to the US government. Public health outcomes such as prevented HIV infections, acquired immunodeficiency syndrome (AIDS) cases and HIV-related deaths were estimated, and expenditures on ART, healthcare costs, tax revenue, and social benefits transfers were considered. In addition, a secondary analysis was conducted from the perspective of Medicare, utilizing health economic data that corresponds to the population covered by Medicare. Methodological challenges were faced given the lack of historical epidemiological data. Also, the current analysis is based on the premise that PLHIV on ART are virally suppressed, given the complexity of modelling ART effectiveness across multiple innovations and settings in the US. Moreover, the impact of pre-exposure prophylaxis (PrEP) was conservatively not considered in the current analysis.
Materials and Methods
Historical data on the HIV epidemic in the US (1987–2023) were compared to a hypothetical scenario in which ART was not available for treating PLHIV and consequently preventing new infections. A decision analytic model was developed in Microsoft Excel to compare the two scenarios: the observed epidemic outcomes and a counterfactual scenario with no ART. The model used a time series analysis12 to project what would have happened had ART not been discovered and brought to market in the late 1980s. Specifically, historical data on AIDS cases and HIV-related deaths attributable to HIV before the discovery of ART were extrapolated to simulate epidemic outcomes without the therapeutic benefits of ART. This hypothetical scenario was then compared with the historical data of the HIV epidemic in the US for the study period.
Epidemiological Data, Treatment Coverage and Transmission Rates
The number of AIDS cases and HIV-attributable deaths from 1987 to 2021 were sourced from population-based data,13,14 and were assumed to be constant from 2021 to 2023, years for which data were not available. For HIV incidence, the most recent available data at the time of the analysis were considered (1987–2021).1,15 HIV prevalence was calculated from the data reported in HIV Surveillance reports published by the Centers for Disease Control and Prevention (CDC) from 2006 to 2021.16–20 Interpolation was used to estimate HIV prevalence from 1980 to 2006, and the estimated population of PLHIV over time was obtained from the literature.21 Data on uptake of ART were accessed through the North American AIDS Cohort Collaboration on Research and Design (NA-ACCORD) and assumed as nationally representative.22,23
To estimate the number of new HIV infections in scenarios with and without ART, a transmission equation was created (Equation 1 in Appendix), considering the impact of being on ART on the transmission risk. This equation did not include the impact of PrEP on HIV transmission rates, and all patients on ART were assumed to be virally suppressed and thus have no risk of transmitting HIV infections to others. Transmission rates per exposure category for PLHIV and those who were not virally suppressed (β0 in Appendix Equation 1) were based on a prior systematic review24 and the effectiveness of ART on preventing new infections (RRART) was sourced from a meta-analysis.25
The population covered by Medicare included PLHIV aged <65 years old covered by Medicare due to disability (estimated at 6% of the prevalent PLHIV) and PLHIV relying on Medicare after turning 65 years old (estimated at 31% of the prevalent PLHIV).2,26 Historical data of HIV infections and AIDS cases below the age of 65 years old was obtained from HIV surveillance data.27 The number of PLHIV aged 65 years or more was estimated based on life expectancy of each group (general population, PLHIV and PLAIDS).28,29
Estimation of Tax Revenue and Fiscal Transfers
The averted epidemiological burden (averted new HIV infections, AIDS cases, and HIV-related deaths) of HIV due to ART was monetized to estimate the fiscal consequences of ART. The prevention of new HIV infections and AIDS cases avoids a lower employment rate and consequently, the loss of tax revenue from earnings and consumption (direct and indirect taxes). The impact on unemployment insurance, healthcare costs of ART, HIV or AIDS management and non-HIV related care were also considered. Increasing life expectancy impacts the number and duration of transfers provided (longevity effects). Transfers include unemployment insurance, disability benefits and retirement pensions. These effects were considered in a secondary scenario in which longevity effects were included.
The impact of HIV and AIDS on employment, unemployment and on disability benefits were based on the literature.30–35 Relative risks were identified comparing PLHIV or PLAIDS to a matched cohort with no HIV infection. The matched cohort was assumed to represent the demographically identical group in the US general population, in terms of age and gender. The effects of HIV/AIDS on occupational outcomes considered in the model are detailed in Table 1.
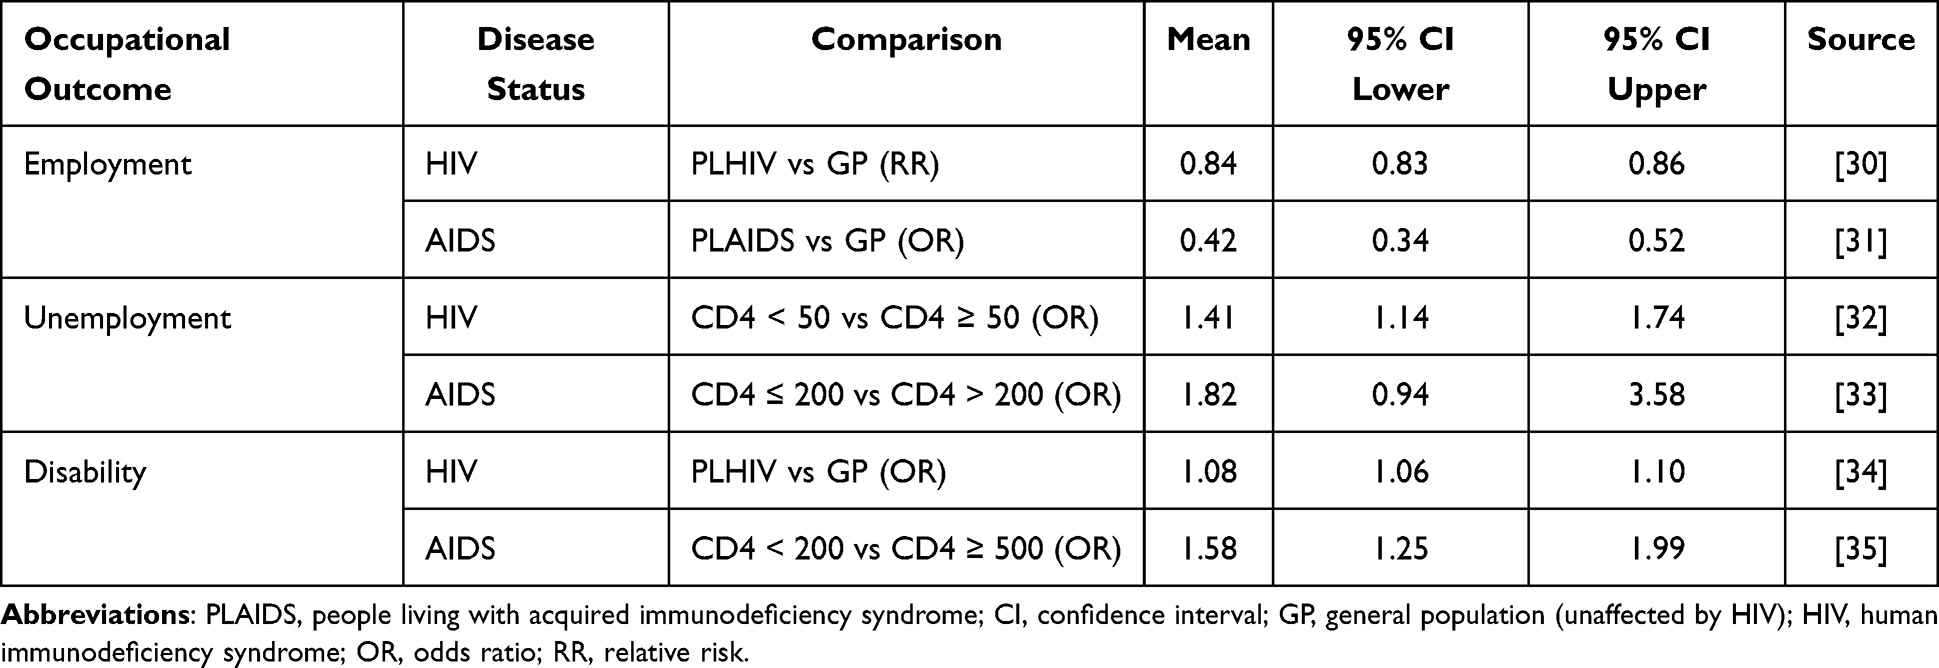 |
Table 1 Effect of HIV/AIDS on Occupational Outcomes |
The age at HIV diagnosis and life expectancy of each group (general population, PLHIV and PLAIDS) were used to estimate lifetime earnings, and lifetime government costs and benefits. The mean age at HIV diagnosis was based on the age group-specific weighted distribution of HIV incidence from 2000 to 2021.15 The age of diagnosis before 2000 was assumed to be similar to the one reported in 2000 (37 years old). Life expectancy of the three groups was sourced from literature based in North America.28,29 Life expectancy from 1987 to 2003 was assumed unchanged in the three groups.
The average national annual tax wedge36 was applied to earnings from employment to estimate direct taxes. The tax wedge considers both taxes and contributions to social security, supported by employees or employers. National employment rates and earnings from employment by age group since 1987 were considered.37,38 A maximum working-age of 75 years of age was assumed to limit the contribution of taxes from employment in the model. Indirect taxes were based on the average national tax on goods and services per year, as a percentage of the Gross Domestic Product (GDP).39 This tax rate was applied to the total personal age-specific income, which was estimated using the per year ratio of personal income to earnings from employment per year (1987–2021) and the 2013–2022 average ratio of disposable income to total personal earnings.40,41
Age-specific data on the proportion of people receiving disability and retirement pensions and the recipients of public transfers monthly payments were obtained from Social Security historical datasets.42,43 The number of people receiving unemployment insurance in the general population was assumed as 50% of the annual number of unemployed per age group37 and multiplied by the average weekly benefit paid and the average duration of the benefit.44 Rates were applied to the total resident population in the same age-group, per year.45–49
Equations used to estimate lifetime earnings from employment (Appendix Equations 2 to 4), lifetime tax revenue (Appendix Equations 5 and 6) and lifetime governmental transfers (Appendix Equations 7 to 9) in the three population groups (general population, PLHIV, PLAIDS) are detailed in the Appendix. Differences between the three groups were used to value the scenarios with and without ART.
Historical prices were converted to 2023 values, based on consumer price index (CPI) tables,40 and the net present value (NPV) of lifetime fiscal effects was estimated.
Estimation of Healthcare Costs
Annual healthcare costs were based on studies identified in the published literature.6,50–58 All costs were converted to 2023 values, based on the health CPI.40 The proportion of PLHIV whose healthcare was covered by the public sector was assumed to be at a constant rate of 47.5%; this estimate was modelled based on the proportion of healthcare resources financed by the public sector.59 For years with missing annual healthcare cost data (AIDS-related costs after 2012 and annual HIV-related and ART costs after 2018), available costs from previous years were inflated, according to the year-specific health CPI.40 Moreover, healthcare costs unrelated to HIV were applied to all groups: general population, PLHIV and PLAIDS. Based on findings from matched cohorts with no HIV, a constant 2.42 ratio of HIV to non-HIV healthcare costs was adopted from 1984 to 2011.6 From 2012 onwards, an annual decrease of 6% on non-HIV healthcare costs was applied based on the weighted average variation of HIV to non-HIV costs.58 An illustration of the total annual healthcare costs used in the model is presented in Figure 1. Equations used to compare disease management healthcare costs and ART costs between PLHIV (with or without the progression to AIDS) and the general population are presented in the Appendix.
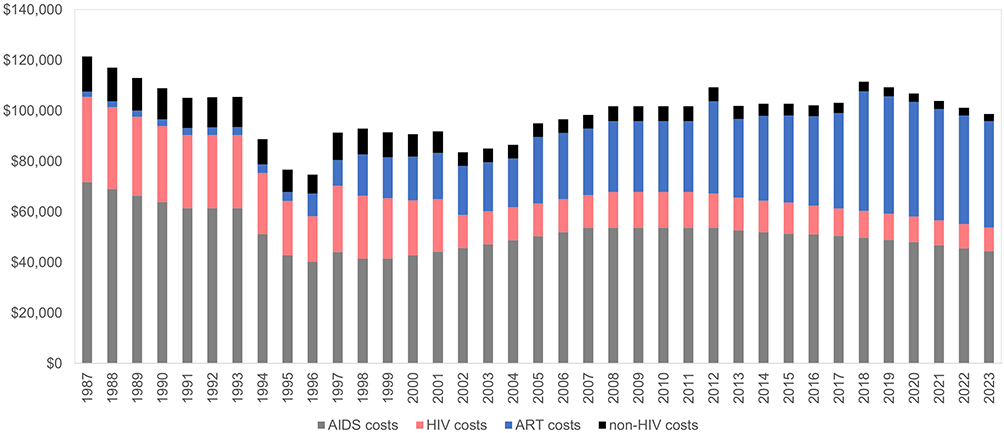 |
Figure 1 Average modeled annual healthcare costs per person with HIV in the United States (US $). Abbreviations: AIDS, acquired immunodeficiency syndrome; ART, antiretroviral therapy; HIV, human immunodeficiency syndrome. |
The Medicare perspective analysis assumed that all healthcare costs were public. Per-patient Medicare costs were at 81% of the average overall healthcare costs for PLHIV in the US.26 When those older than 65 years old were considered separately, this proportion changed to 61%.60 Healthcare costs unrelated to HIV were estimated to be higher among the Medicare population (+304% when compared to the average PLHIV and +60% when compared to PLHIV older than 65 years old).26,60
Economic Evaluation
A cost–benefit analysis was conducted, and results were reported in terms of the NPV of ART and its benefit–cost ratio. Equations are detailed in the Appendix. The analysis was conducted with and without the inclusion of excess healthcare and other fiscal costs resulting from the survival benefit associated with ART (ie, the longevity effect). In the Medicare perspective analysis, we report the difference in healthcare costs only. Lifetime costs and benefits of survivors diagnosed before 2023 were discounted at 3%.61
Sensitivity Analysis
One-way deterministic sensitivity analysis was conducted and summarized in a tornado diagram, applying a variation of ±25% to all parameters included in the model. Scenario analyses were conducted for a proportion of non-virally suppressed PLHIV on ART, and excluding the impact of deaths from model estimates to minimize the likelihood of double counting the impact of avoided AIDS cases and HIV-related deaths occurring within the same year. Additionally, ten-year periods were used to assess the impact of incremental innovation across time. Scenario analyses were also conducted from Medicare’s perspective, in order to assess the robustness of its results.
Results
Public investment in ART in the US, from 1987 to 2023 was estimated at US$643 billion in present value (Appendix Equation 11). This investment led to public healthcare cost savings of US$1.4 trillion due to the improved health outcomes of PLHIV on ART and reduced transmission rates (Appendix Equation 10). We estimated that, during the same period, 1.4 million HIV infections (Appendix Equation 1), 1.9 million AIDS cases and 2.0 million HIV-related deaths were avoided as a result of the use of ART. These public health gains resulted in higher labor market participation, which, in turn, generated increased earnings from employment. Compared to the no ART scenario, these gains averted a potential tax revenue loss for the US government of US$1.3 trillion from 1987 to 2023 (Appendix Equation 6). Unemployment insurance was estimated to be slightly higher in the ART scenario, representing a loss of US$523 million for the US government (Appendix Equation 9). This can be explained by the larger number of PLHIV who were on treatment and therefore were economically active at higher rates compared to a scenario with no access to treatment. From a fiscal standpoint, unemployment is a transient state for economically active individuals.
Results of this cost–benefit analysis are presented in Table 2. The estimated NPV of ART investment, from 1987 to 2023, was positive: US$2.1 trillion (Appendix Equation 14). The corresponding benefit–cost ratio was estimated at 4.3, indicating that every $1 of public spending on ART yielded more than a fourfold fiscal gain (Appendix Equation 15). Over time, fiscal gains continued to accrue as ART effectiveness increased in the late 1980s because of incremental innovations in ART medications (Figure 2). This is also reflected in the different benefit–cost ratios observed over different periods of time: benefit-cost ratio increased from 1.2 during the period 1987–1996 to 7.6 over the observed period 2017–2023 (Table 3). Despite the increase in ART costs in later time periods, fiscal gains continued to accrue resulting in improved net fiscal gains.
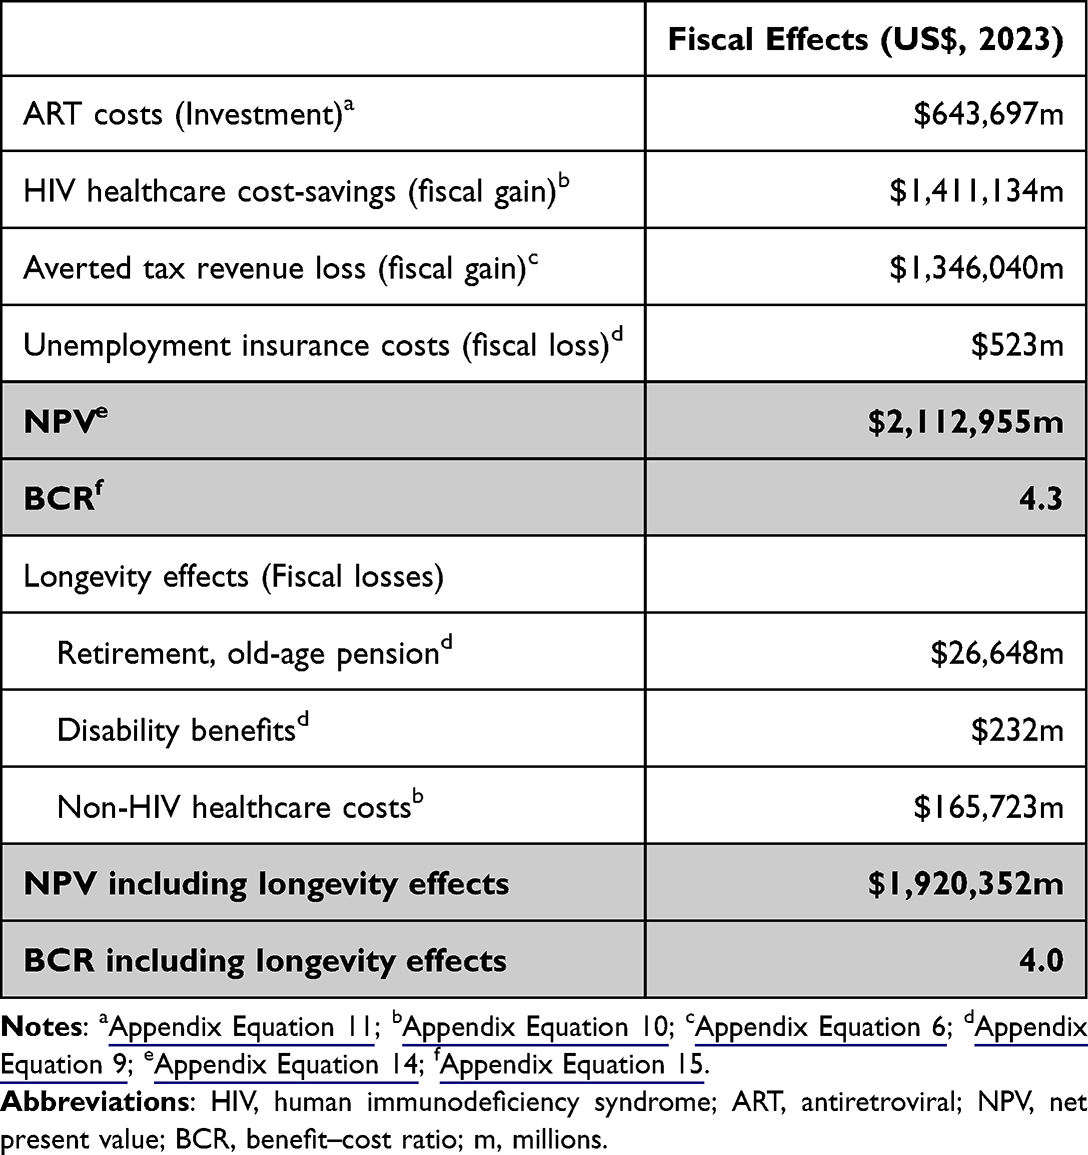 |
Table 2 Fiscal Consequences of Treating HIV in the US 1987–2023 |
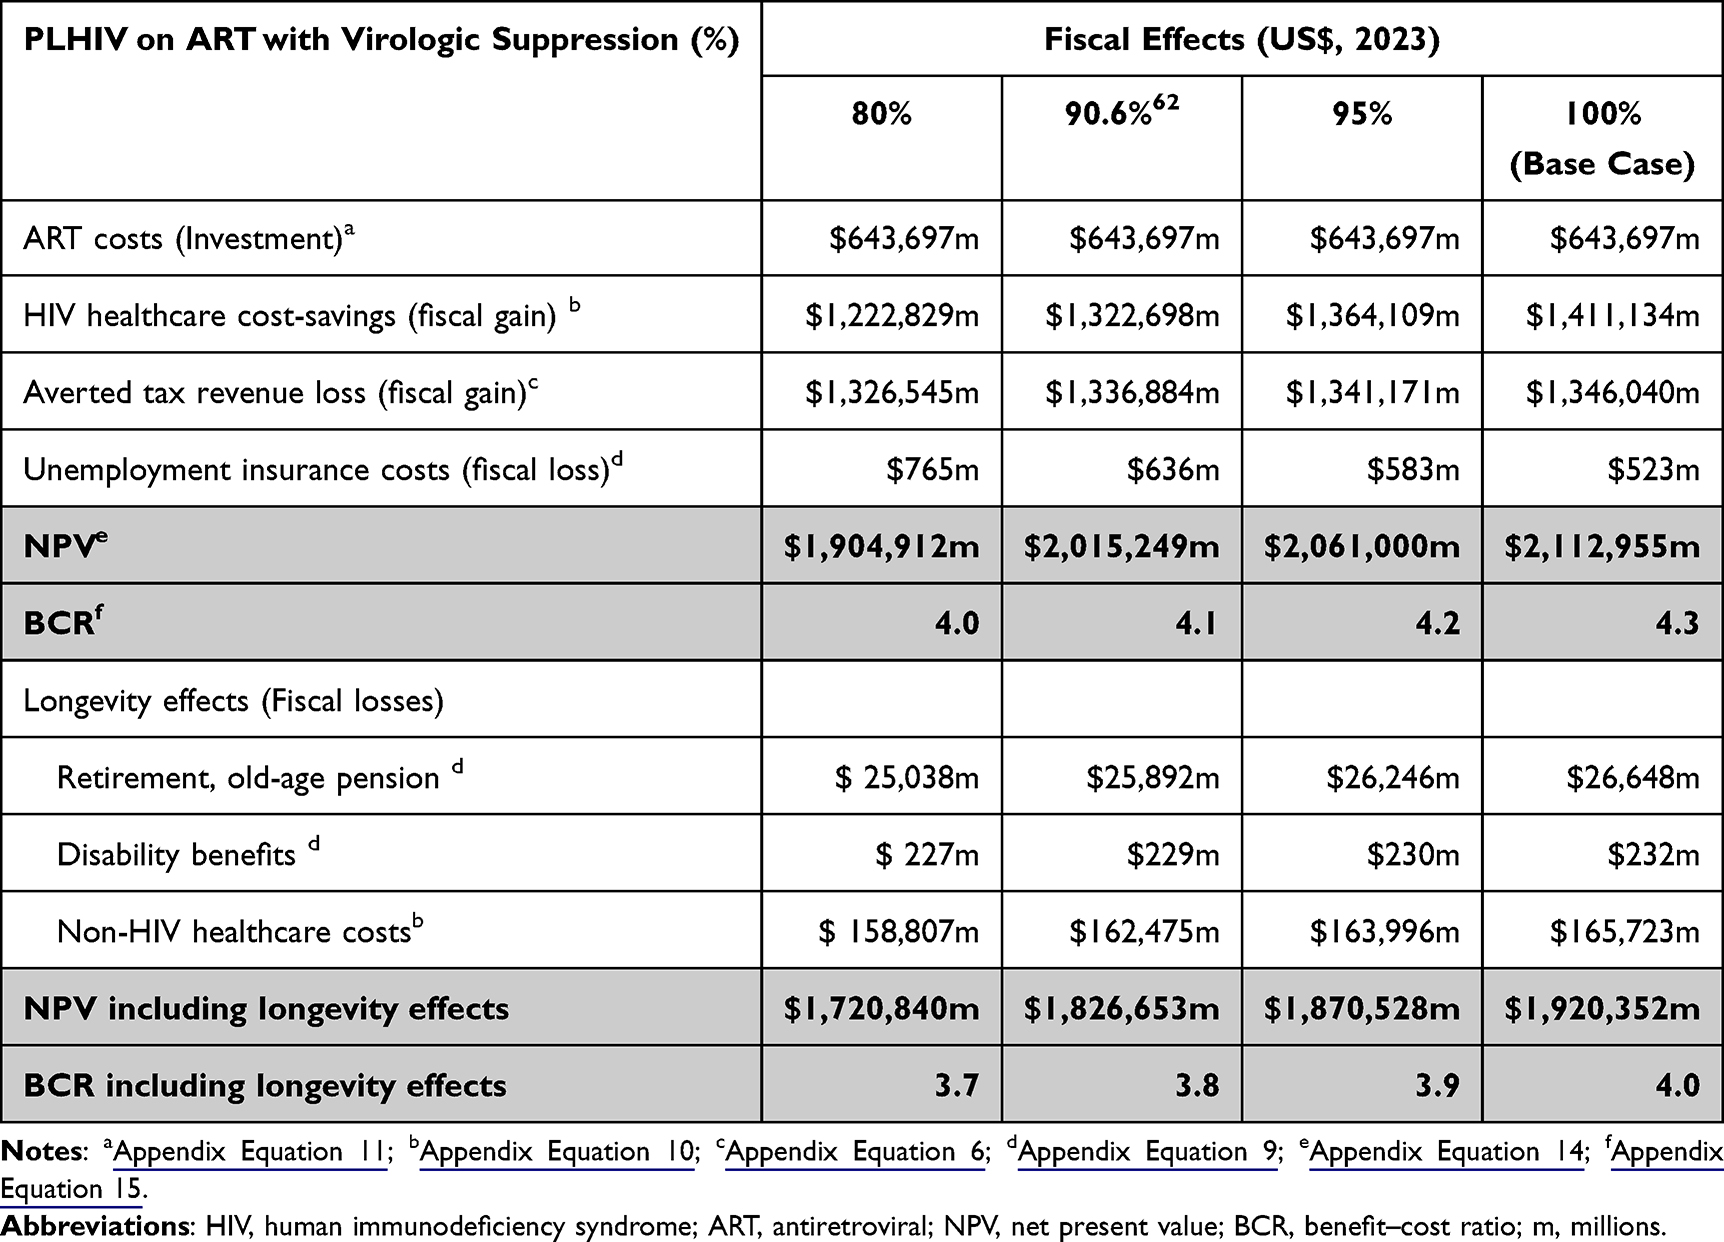 |
Table 3 Fiscal Impact of Varying the Proportion of PLHIV on ART with Viral Suppression |
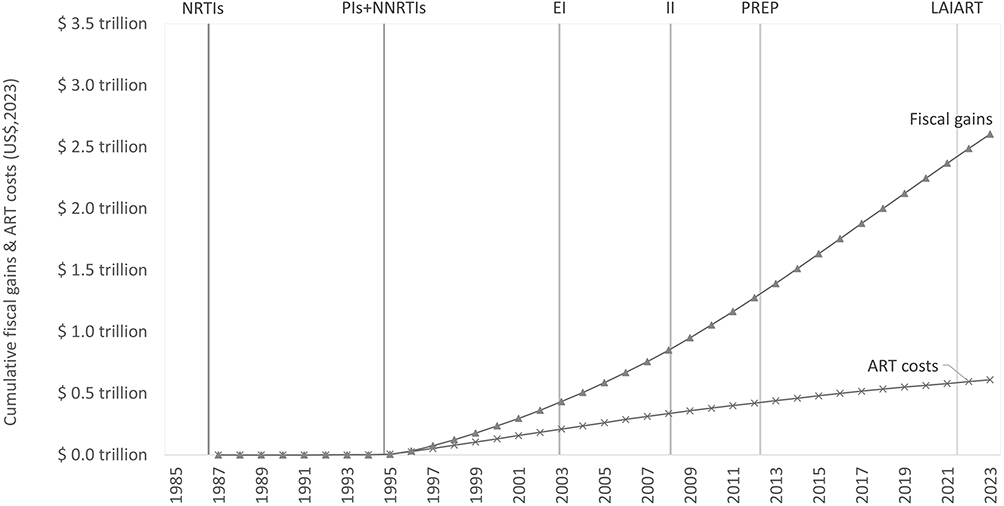 |
Figure 2 Evolution of sustained fiscal gains and costs of investing in antiretroviral therapy in the United States (1987–2023). Abbreviations: ART, antiretroviral therapy; NPV, net present value; NRTIs, nucleoside/tide reverse transcriptase inhibitors; PIs, protease inhibitors; NNRTIs, non-nucleoside reverse transcriptase inhibitors; EI, early inhibitors; STR, single tablet regimens; II, integrase inhibitors; LAIART, long-acting injectable antiretroviral therapy; PrEP, pre-exposure prophylaxis. |
The analysis that included the effects of longevity considered the excess costs caused by the survival benefits of ART. Those excess costs included costs of retirement (Social Security retirement benefits), disability benefits and non-HIV-related healthcare costs (Appendix Equation 13). These costs reduced the estimated NPV of ART by 9%, to an overall positive economic result of US$1.9 trillion. The benefit–cost ratio accounting for the effects of longevity was 4.0.
From the perspective of Medicare, historical and prospective ART costs were estimated at US$77 billion which, in turn, yielded healthcare cost savings of US$153 billion in present values. These savings correspond to US$77 billion in NPV and a benefit–cost ratio of 2.0 (Table A.1).
Sensitivity Analysis
Results without longevity effects were positive after varying each parameter by ±25% (Figure 3). The NPV remained consistently positive and > US$1.5 trillion. Results were most sensitive to: HIV transmission rates, incidence of AIDS cases, life expectancy of those with AIDS, effects of HIV on employment, the tax wedge, and the proportion of healthcare costs financed by the government. Uncertainty in transmission rates and life expectancy of PLHIV or AIDS mostly impacts the estimated healthcare cost savings, while uncertainty in the effect of HIV on employment and in tax rates only impacts the averted tax revenue loss. The proportion of healthcare costs financed by the government has an opposite effect on the investment in ART and on the estimated healthcare cost-savings.
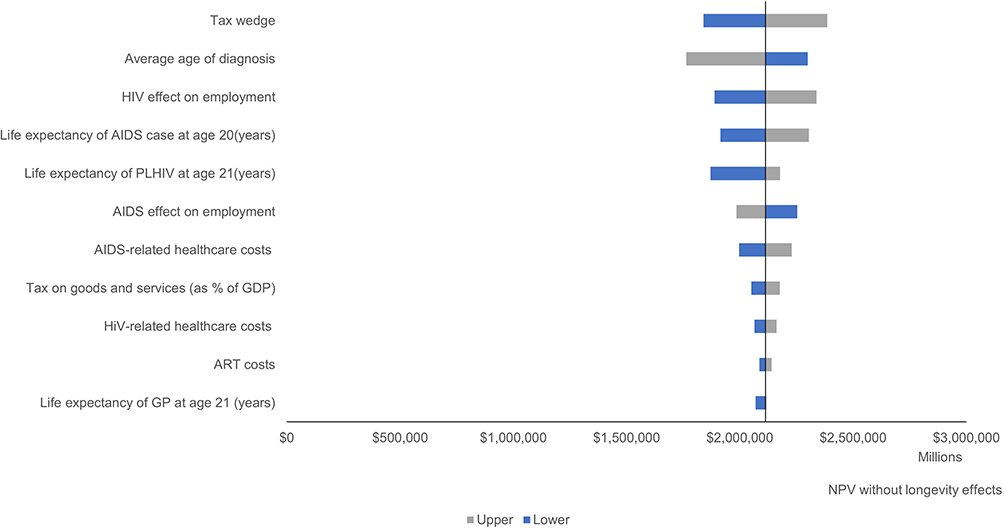 |
Figure 3 Tornado diagram of the most influential parameters (±25%): results for the net present value without the longevity effects (1987–2023). Abbreviations: AIDS, acquired immunodeficiency syndrome; ART, antiretroviral therapy; HIV, human immunodeficiency syndrome; NPV, net present value; GP, general population; PLHIV, people with human immunodeficiency syndrome; GDP, Gross domestic product. |
Scenario analysis on introducing a proportion of non-virally suppressed PLHIV on ART is presented in Table 3. If 20% of ART users would not achieve viral suppression, benefits from ART would be reduced mainly due to lower healthcare cost-savings, but the return on investing on ART would still be estimated at a fourfold gain for the US government. Furthermore, the scenario excluding the impact of deaths from model estimates would still return a NPV of US$1.4 trillion. Additionally, Table 4 shows the benefit–cost ratio for different ART innovation eras,63 suggesting an increased return on investing on ART in the latest periods.
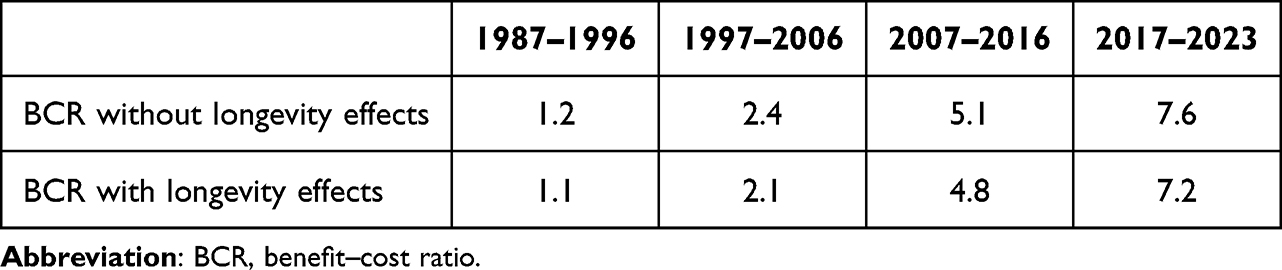 |
Table 4 Benefit Cost Ratio (BCR) in Relation to Different Time Periods Invested in Antiretroviral Therapy |
Sensitivity analysis on the Medicare perspective results was consistently favorable and was most sensitive to the distribution of ART users by age-group (below and above the age of 65 years old) and to the variation in non-HIV costs in those covered by Medicare when compared to the average PLHIV (Table A.2).
Discussion
The introduction of ART for the management of HIV over thirty years ago helped to transform the lives of PLHIV and prevent onward transmission of HIV.64 We estimated the broader fiscal costs and benefits attributed to maintaining viral suppression, preventing onward HIV transmission and reducing HIV-related deaths by comparing observed data about the epidemic to a counterfactual scenario in which ART was not available. We applied publicly available data on HIV cases and reported HIV-related deaths over the time period observed and converted outcome improvements into fiscal consequences for the public sector in the US between 1987 and 2023. Since the introduction of ART, we estimate the investment’s net value at US$ 2.1trillion (NPV) to the US government. This value indicates that for every US$1. spent on ART, US$4.3 have been achieved in fiscal gains for federal and state governments.
When accounting for the improvements in mortality arising from ART use, increasing social security obligations, we have observed a modestly lowered benefit–cost ratio to US$4.0 for each US$1 spent on ART, illustrating the investment’s sustainability on public finances. Even when only PLHIV covered by Medicare were considered, the healthcare benefit–cost ratio was deemed positive. Furthermore, if the proportion of ART users above the age of 65 were 20% higher, the healthcare benefit–cost ratio would continue to be favorable (Table A.2).
Our analysis focused purely on the public economic sector. The broader societal economic consequences of ART therapy might be much greater when considering the interactions across economic domains and the effects of multipliers which amplify the gains from public spending. In addition, our base case model’s epidemiological outputs did not distinguish where the costs and benefits were realized (Medicare, Medicaid, private insurance or patient out-of-pocket expenses). In reality, all paying parties have paid for and can benefit from the introduction of ART use.
There is typically a lag between the costs and benefits associated with an innovative treatment (Figure 2). The fiscal gains in the early stages of the epidemic were evident after 1997, following the introduction of drugs with increased efficacy – protease inhibitors and non-nucleoside reverse transcriptase inhibitors (Figure 2). This lag reflects the slow uptake of products early in the epidemic due to a range of challenges, including less efficacious early treatments.65 This lag is less likely to be apparent as new improved treatments are introduced, because of increased public awareness, health system response to the ongoing epidemic and attributes of newer therapies. Although it is not possible and not the goal of this analysis to directly link the fiscal gains with specific products, we attempted to delineate the gains by ART innovation eras63 as reported in Table 3. The model indicated that there may be compounding effects of the continued investments in ART over time, because people with viral suppression will have sustained increases in their economic contributions.
Technological innovation is often cited as a driver of economic growth and improving well-being.66 There are few better examples of this than innovations achieved through advances in medicine, which act on multiple phases of health impacts – preventing disease and premature death, improving patient outcomes, and increasing overall population health and life expectancy.67 Importantly, the benefits of advances in medical innovation do not materialize immediately. As population health improves, more human and health capital can be directed towards productive output, which drives economic growth. It is also important to recognize that not all innovations will translate directly to economic gains. For example, medications that offer primarily convenience benefits and tailored treatment regimens are likely to have more modest or no economic benefits.
Advances in therapy are often developed through incremental innovations. As new products are developed, subsequent products can address unmet needs from the original innovator through mechanisms like reducing pill burden, extending half-life, reducing side effects such as drug–drug interactions and improving health outcomes. The introduction of ART is a good example of incremental innovation. Since the introduction of ARTs in 1987, steady progress has been made building on previous innovations, each likely resulting in economic gains.68 Furthermore, microeconomic analyses like the results described here underestimate the effects of therapies, because they do not capture the interactions between economic domains. Economic domains create economic multipliers, from which all benefit.67 In this respect, innovations in one area of medicine do not only benefit those exposed to the condition or the risks of the condition but also benefit all members of society. A wide range of economic interdependencies exists, and all members of society depend on and benefit from them.69
The underlying premise of this work links health outcomes of PLHIV with attributable impacts on the labor market, and consequently on fiscal outcomes to the government. Several European studies have shown the negative impact of HIV infections on employment outcomes before ART therapies were available; these impacts were driven by lower probabilities of returning to work after diagnosis in that era.30,70–73 In contrast, recent studies have shown increasing likelihoods of PLHIV returning to work related to the availability of ART and increasing ART coverage.7,30,74,75 If PLHIV are unable to work, they may receive social transfers from the government, such as unemployment insurance or disability benefits. The need for social transfers increases the government’s expenditures. These direct costs are compounded by the lower employment rates and lower disposable income of PLHIV, who are not working. This, in turn, represents a loss of tax revenue to the government. Innovation and investment in reducing infections and promoting better health outcomes benefits the public sector by preventing disease management costs, avoiding a loss of tax revenue, and reduces the need for social transfers.76 Through these mechanisms, the reduced incidence of HIV and the increased life expectancy of PLHIV provided cumulative benefits for the government.
Our work has important limitations. A potential limitation of the current study is the lack of detailed historical epidemiologic data for subgroup analysis and the lack of data on public healthcare costs. Published data on HIV prevalence and costs are based on estimations using different sources and methods. Furthermore, projections used in the current study were based on time series analysis12 sourced from a period when epidemic registries were not comprehensive in terms of including people with HIV infection but not AIDS. Missing historical data on public healthcare costs required a few assumptions, both in estimating annual healthcare costs of PLHIV, PLAIDS and the general population, and in determining the proportion of costs financed by the public sector. The proportion of healthcare costs financed by the public sector, assumed to remain constant throughout the study period, was found impactful in overall results (Figure 3). Even though this assumption reduces the statistical power of the results, it was deemed reasonable, because the proportion of healthcare costs funded by the public sector would affect both the investment in ART and savings in healthcare management costs, without changing the main results and conclusions of the study.
In the base case scenario, the model assumes that PLHIV on ART are virally suppressed. This assumption excludes any variation due to compliance, regimens, regimen forms or even regional disparities. Still, official statistics and the literature suggest that more than 80% of PLHIV on ART are virally suppressed.62,77 Scenario analysis on this parameter showed that sensitivity to reducing the proportion of virally suppressed does not impact findings of the study.
Given the aim of the current work, we have opted for modelling transmission dynamics mainly on the impact of ART therapy, excluding other HIV-related parameters that could have an important effectiveness impact. As an example, related infections and malignancies were not modelled. Also, the impact of PrEP was not included. The lack of data to rigorously introduce the number needed to treat (NNT) to prevent a new infection using PrEP, and the impact of HIV-related infections or malignancies would add confounding factors and uncertainty to the work. Overall, one-way sensitivity analysis showed that results are robust by consistently showing positive returns.
Conclusion
The pharmaceutical industry response to the HIV epidemic and the incremental innovation of ART therapy since 1987 has significantly improved health outcomes for PLHIV and generated positive fiscal returns for the US public sector. The fiscal return on ART investment was estimated at US$4.3 for every US$1 spent, with a net present value of US$2.11 trillion from 1987 to 2023. From a Medicare perspective, ART yielded favorable returns derived from medical cost-savings. Although these results are specific to HIV and ART, other investments in healthcare with a positive impact on labor participation are likely to have similar positive fiscal effects. Assessing fiscal outcomes is crucial for decision makers aiming to achieve budget neutrality and ensure the sustainability of publicly funded healthcare.
Ethics
No individual data was utilized in the current work. Therefore, it was exempt from any review or approval from institutional boards or ethics committee.
Acknowledgments
This work was funded by Gilead.
Disclosure
ATP, MPC, and NK are employees of Global Market Access Solutions, who were paid consultants to Gilead. PC was a paid consultant to Gilead at the time of the study. RT, UM and JJ are employees of Gilead. PSS has received research grants and speaker fees from Gilead Sciences; he has also received research grants from Merck and ViiV Healthcare. In addition, he also reports grants and personal fees from National Institutes of Health and Centers for Disease Control and Prevention, outside of the submitted work. The authors report no other conflicts of interest in this work.
References
1. Bosh KA, Hall HI, Eastham L, Daskalakis D, Mermin J. Estimated annual number of HIV Infections. MMWR. 2021;70(22):801–806. doi:10.15585/mmwr.mm7022a1
2. Centers for Disease Control and Prevention. Estimated HIV Incidence and Prevalence in the United States, 2018–2022. Centers for Disease Control and Prevention; 2024.
3. Palella F, Delaney K, Moorman A, et al. Declining morbidity and mortality among patients with advanced human immunodeficiency virus infection. New Engl J Med. 1998;338(13):853–860. doi:10.1056/NEJM199803263381301
4. Dasgupta S, Tie Y, Beer L, Fagan J, Weiser J. Barriers to HIV care by viral suppression status among US adults with HIV: findings from the centers for disease control and prevention medical monitoring project. J Assoc Nurses AIDS Care. 2021;32(5):561–568. doi:10.1097/JNC.0000000000000249
5. Ward T, Sugrue D, Hayward O, et al. Estimating HIV management and comorbidity costs among aging HIV patients in the United States: a systematic review. J Manag Care Spec Pharm. 2020;26(2):104–116. doi:10.18553/jmcp.2020.26.2.104
6. Ritchwood TD, Bishu KG, Egede LE. Trends in healthcare expenditure among people living with HIV/AIDS in the United States: evidence from 10 Years of nationally representative data. Int J Equity Health. 2017;16(1):188. doi:10.1186/s12939-017-0683-y
7. Dray-Spira R, Persoz A, Boufassa F, et al. Employment loss following HIV infection in the era of highly active antiretroviral therapies. Eur J Public Health. 2006;16(1):89–95. doi:10.1093/eurpub/cki153
8. Oliva J. Labour participation of people living with HIV/AIDS in Spain. Health Economics. 2010;19(4):491–500. doi:10.1002/hec.1487
9. Schofield D, Shrestha R, Callander E, et al. Modelling the cost of ill health in Health&WealthMOD (Version II): lost labour force participation, income and taxation, and the impact of disease prevention. Int J Microsimulation. 2011;4(3):33–37.
10. Connolly MP, Kotsopoulos N, Postma MJ, Bhatt A. The fiscal consequences attributed to changes in morbidity and mortality linked to investments in health care: a government perspective analytic framework. Value Health. 2017;20(2):273–277. doi:10.1016/j.jval.2016.11.018
11. Hutchinson AB, Farnham PG, Dean HD, et al. The economic burden of HIV in the United States in the era of highly active antiretroviral therapy: evidence of continuing racial and ethnic differences. J Acquir Immune Defic Syndr. 2006;43(4):451–457. doi:10.1097/01.qai.0000243090.32866.4e
12. Winters PR. Forecasting sales by exponentially weighted moving averages. Manage Sci. 1960;6(3):324–342. doi:10.1287/mnsc.6.3.324
13. Centers for Disease Control and Prevention. AIDS classification per year. Atlas Plus. Available from: https://gis.cdc.gov/grasp/nchhstpatlas/tables.html.
14. National Center for HIV/AIDS VH, STD, and TB Prevention - Division of HIV Prevention. In: HIV Mortality 2021. Centers for Disease Control and Prevention. CDC; 2022.
15. AIDSVu.org. Tools & Resources - Datasets. Available from: https://aidsvu.org/resources/#/datasets.
16. Centers for Disease Control and Prevention.HIV/AIDS surveillance report. 2006.
17. Centers for Disease Control and Prevention. HIV surveillance report 2010. 2012
18. Centers for Disease Control and Prevention. HIV Surveillance report 2012. 2014.
19. Centers for Disease Control and Prevention. Estimated HIV incidence and prevalence in the United States, 2010–2016. HIV Surveillance Supplemental Report 2019. 2019.
20. Centers for Disease Control and Prevention. HIV surveillance supplemental report: estimated HIV incidence and prevalence in the United States 2014–2018. Centers for Disease Control and Prevention 2020.
21. Campsmith M, Rhodes P, Hall HI, Green TA. Undiagnosed HIV prevalence among adults and adolescents in the United States at the end of 2006. Acquir Immune Defic Syndr. 2010;53(5):619–624. doi:10.1097/QAI.0b013e3181bf1c45
22. NA/ACCORD NAACCoRaD. ART use - Initiation of Antiretroviral Therapy.
23. Palella FJ. Clinical cohort study: HOPS data. Infect Dis Clin Pract. 2001;10(Supplement 1):S2–S4. doi:10.1097/00019048-200103001-00002
24. Patel P, Borkowf CB, Brooks JT, Lasry A, Lansky A, Mermin J. Estimating per-act HIV transmission risk: a systematic review. AIDS. 2014;28(10):1509–1519. doi:10.1097/QAD.0000000000000298
25. Davari M, Giwa H, Nabizade A, Taheri F, Giwa A. Antiretroviral therapy and the risk of sexual transmission of HIV: a systematic review and meta-analysis. HIV Medicine. 2020;21:349–357. doi:10.1111/hiv.12841
26. Dawson L, Kates J, Tatyana R. et al. Medicare and People with HIV. 2023. https://www.kff.org/hivaids/issue-brief/medicare-and-people-with-hiv/#:~:text=In%20FY%202022%2C%20Medicare%20spending,just%201.2%25%20all%20Medicare%20spending
27. Centers for Disease Control and Prevention.HIV diagnoses (2008-2023).
28. Patterson S, Cescon A, Samji H, et al. Life expectancy of HIV-positive individuals on combination antiretroviral therapy in Canada. BMC Infect Dis. 2015;15(1). doi:10.1186/s12879-015-0969-x
29. Marcus JL, Leyden WA, Alexeeff SE, et al. Comparison of overall and comorbidity-free life expectancy between insured adults with and without HIV Infection, 2000-2016. JAMA Netw Open. 2020;3(6):e207954. doi:10.1001/jamanetworkopen.2020.7954
30. Carlander C, Wagner P, Yilmaz A, Sparen P, Svedhem V. Employment by HIV status, mode of HIV transmission and migrant status: a nation-wide population-based study. AIDS. 2021;35(1):115–123. doi:10.1097/QAD.0000000000002724
31. García Gómez P, Labeaga J, Oliva J. Employment and Wages of People Living with HIV/AIDS. Maastricht Economic and social Research institute on Innovation and Technology (UNU‐MERIT); 2012.
32. Joy R, Druyts E, Brandson E, et al. Impact of neighborhood-level socioeconomic status on HIV disease progression in a universal health care setting. J Acquir Immune Defic Syndr. 2008;47(4):500–505. doi:10.1097/QAI.0b013e3181648dfd
33. Ibrahim F, Anderson J, Bukutu C, Elford J. Social and economic hardship among people living with HIV in London. HIV Med. 2008;9(8):616–624. doi:10.1111/j.1468-1293.2008.00605.x
34. Legarth R, Omland LH, Kronborg G, et al. Employment status in persons with and without HIV infection in Denmark: 1996-2011. AIDS. 2014;28(10):1489–1498. doi:10.1097/QAD.0000000000000257
35. Annequin M, Lert F, Spire B, Dray-Spira R, Group VS. Has the employment status of people living with HIV changed since the early 2000s? AIDS. 2015;29(12):1537–1547. doi:10.1097/QAD.0000000000000722
36. OECD. Average tax wedge. OECD Stats. Available from: https://stats-3.oecd.org/index.aspx?DatasetCode=AWCOMP. Published 2024. Updated 05/16/2024. Accessed.
37. OECD. Employment and unemployment by five-year age group and sex - levels, United States. OECD Data Explorer. Available from: https://data-explorer.oecd.org/vis?df%5bds%5d=dsDisseminateFinalDMZ&df%5bid%5d=DSD_LFS%40DF_LFS&df%5bag%5d=OECD.ELS.SAE&df%5bvs%5d=1.1&pd=1975%2C2022&dq=USA._T.Y_GE65%2BY55T64%2BY35T44%2BY45T54%2BY25T34%2BY15T24.LF%2BUNE%2BEMP&ly%5bcl%5d=LABOUR_FORCE_STATUS%2CAGE&ly%5brw%5d=TIME_PERIOD&to%5bTIME_PERIOD%5d=false&vw=tb.
38. US Bureau of Labor Statistics. Weekly and hourly earnings data from the current population survey. Available from: https://data.bls.gov/pdq/SurveyOutputServlet.
39. OECD. Tax on goods and services (indicator). OECD data. Available from: https://data.oecd.org/tax/tax-on-goods-and-services.htm#indicator-chart.
40. US Bureau of Economic Analysis. Table 2.3.4. Price Indexes for personal consumption expenditures by major type of Product. 2024 [Updated May 16, 2024]. Available from: https://apps.bea.gov/iTable/?reqid=19&step=3&isuri=1&1921=survey&1903=84#eyJhcHBpZCI6MTksInN0ZXBzIjpbMSwyLDNdLCJkYXRhIjpbWyJOSVBBX1RhYmxlX0xpc3QiLCI2NCJdLFsiQ2F0ZWdvcmllcyIsIlN1cnZleSJdXX0=.
41. OECD. Income distribution database. OECD Data Explorer. Available from: https://data-explorer.oecd.org/vis?df[ds]=DisseminateFinalDMZ&df[id]=DSD_WISE_IDD%40DF_IDD&df[ag]=OECD.WISE.INE&dq=USA.A.OCC%2BSEC%2BSEIC%2BCAP_INC%2BEAR%2BINC_DISP.Y66T75%2BY_GE76%2BY51T65%2BY41T50%2BY26T40%2BY18T65%2BY18T25%2BY_LT18%2B_T.METH2012.D_CUR.&pd=2010%2C&to[TIME_PERIOD]=false&ly[cl]=COMBINED_MEASURE%2CTIME_PERIOD&ly[rw]=AGE&vw=tb.
42. Social Security US. Annual statistical report on the social security disability insurance program. 2022.
43. Social Security US. Annual Statistical Supplement. 2024.
44. US Department of Labor. Employment and training administration. state Unemployment Insurance (UI) program data. Available from: https://oui.doleta.gov/unemploy/claimssum/5159report.asp.
45. U.S. Census Bureau. Intercensal county estimates by age, sex, race: 1980-1989. Available from: https://www.census.gov/data/datasets/time-series/demo/popest/1980s-county.html.
46. U.S. Census Bureau. Intercensal estimates of the United States civilian population by age and sex, 1990-2000: all Months. Available from: https://www.census.gov/data/datasets/time-series/demo/popest/intercensal-1990-2000-national.html.
47. U.S. Census Bureau. Intercensal estimates of the resident population by five-year age groups, sex, race, and Hispanic origin for the United States: April 1, 2000 Available from: https://www.census.gov/data/datasets/time-series/demo/popest/intercensal-2000-2010-national.html.
48. U.S. Census Bureau. Annual estimates of the resident population by single year of age and sex for the United States. Available from: https://www.census.gov/data/tables/time-series/demo/popest/2010s-national-detail.html.
49. U.S. Census Bureau. Annual estimates of the resident population by single year of age and sex for the United States. Available from: https://www.census.gov/data/tables/time-series/demo/popest/2020s-national-detail.html.
50. Hiatt R, Fireman B, Quesenberry C, Selby J. The Impact of AIDS on the Kaiser Permanent Medical Care Program (Northern California Region). Office of Technology Assessment, US Congress; 1988.
51. Andrulis DP. The 1987 US Hospital AIDS Survey. JAMA. 1989;262(6):784–794. doi:10.1001/jama.1989.03430060080030
52. Fasciano N, Cherlow AL, Turner BJ, Thornton C. Profile of Medicare beneficiaries with AIDS: application of an AIDS casefinding algorithm. Health Care Financ Rev. 1998;19(3):19–38.
53. Gebo KA, Chaisson RE, Folkemer JG, Bartlett JG, Moore RD. Costs of HIV medical care in the era of highly active antiretroviral therapy. AIDS. 1999;13(8):963–969. doi:10.1097/00002030-199905280-00013
54. Bozzette SA, Joyce GF, McCaffrey DF, et al. Expenditures for the care of HIV-infected patients in the era of highly active antiretroviral therapy. New Engl J Med. 2001;344(11):817–823. doi:10.1056/NEJM200103153441107
55. Solem CT, Snedecor SJ, Khachatryan A, et al. Cost of treatment in a US commercially insured, HIV-1-infected population. PLoS One. 2014;9(5):e98152–NA. doi:10.1371/journal.pone.0098152
56. Gilden DE, Kubisiak JM, Gilden DM. Managing Medicare’s HIV caseload in the era of suppressive therapy. Am J Public Health. 2007;97(6):1053–1059. doi:10.2105/AJPH.2005.063636
57. McCann NC, Horn TH, Hyle EP, Walensky RP. HIV Antiretroviral Therapy Costs in the United States, 2012-2018. JAMA Intern Med. 2020;180(4):601. doi:10.1001/jamainternmed.2019.7108
58. Cohen JP, Beaubrun A, Ding Y, Wade RL, Hines DM. Estimation of the incremental cumulative cost of HIV compared with a non-HIV population. Pharmacoecon Open. 2020;4(4):687–696. doi:10.1007/s41669-020-00209-8
59. Dawson L, Kates J. Insurance coverage and viral suppression among people with HIV, 2018. KFF. Available from: https://www.kff.org/hivaids/issue-brief/insurance-coverage-and-viral-suppression-among-people-with-hiv-2018/.
60. Turrini G, Chan SS, Klein PW, et al. assessing health care utilization and spending among older medicare beneficiaries with and without HIV. Med Care Res Rev. 2024;81(3):280–289. doi:10.1177/10775587231198903
61. Institute for Clinical and Economic Review (ICER). Value Assessment Framework. 2023
62. US Department of Health and Human Services. Ryan White HIV/AIDS program achieves record-breaking 90.6% viral suppression rate among its more than 576,000 Clients [press release]. HRSA News Room. 2024 https://www.hrsa.gov/about/news/press-releases/ryan-white-record-breaking-viral-suppression-rate
63. Choudhary MC, Mellors JW. The transformation of HIV therapy: one pill once a day. Antivir Ther. 2022;27(2):13596535211062396. doi:10.1177/13596535211062396
64. Eisinger RW, Dieffenbach CW, Fauci AS. HIV Viral Load and Transmissibility of HIV Infection: undetectable Equals Untransmittable. JAMA. 2019;321(5):451–452. doi:10.1001/jama.2018.21167
65. Tseng A, Seet J, Phillips EJ. The evolution of three decades of antiretroviral therapy: challenges, triumphs and the promise of the future. Br J Clin Pharmacol. 2015;79(2):182–194. doi:10.1111/bcp.12403
66. Broughel J, Thierer A. Technological innovation and economic growth: a brief report on the evidence. Mercatus Res Paper. 2019.
67. Kuhn M, Minniti A, Prettner K, Venturini F. Medical innovation, life expectancy, and economic growth. SSRN Electron J. 2023.
68. Forsythe SS, McGreevey W, Whiteside A, et al. Twenty years of antiretroviral therapy for people living with HIV: global costs, health achievements, economic benefits. Health Aff. 2019;38(7):1163–1172. doi:10.1377/hlthaff.2018.05391
69. Mestre-Ferrandiz J, Mordoh A, Sussex J. The Many Faces of Innovation. London: Office of Health Economics; 2012.
70. Dray-Spira R, Gueguen A, Ravaud JF, Lert F. Socioeconomic differences in the impact of HIV infection on workforce participation in France in the era of highly active antiretroviral therapy. Am J Public Health. 2007;97(3):552–558. doi:10.2105/AJPH.2005.081083
71. Gross M, Herr A, Hower M, Kuhlmann A, Mahlich J, Stoll M. Unemployment, health, and education of HIV-infected males in Germany. Int J Public Health. 2016;61(5):593–602. doi:10.1007/s00038-015-0750-3
72. Stolte I, Kuiper J, Schouten J, et al. Prevalence and determinants of unemployment among ageing HIV‐1‐infected and HIV‐uninfected individuals. J Int AIDS Soc. 2012;15(S4). doi:10.7448/IAS.15.6.18130
73. Dray-Spira R, Legeai C, Le Den M, et al. Burden of HIV disease and comorbidities on the chances of maintaining employment in the era of sustained combined antiretoviral therapies use. AIDS. 2012;26(2):207–215. doi:10.1097/QAD.0b013e32834dcf61
74. International Labour Office (ILO). The Impact of HIV and AIDS on the World of Work: Global Estimates. Geneva; 2018.
75. Elzi L, Conen A, Patzen A, et al. Ability to work and employment rates in human immunodeficiency virus (HIV)-1-Infected Individuals receiving combination antiretroviral therapy: the Swiss HIV Cohort Study. Open Forum Infect Dis. 2016;3(1):ofw022. doi:10.1093/ofid/ofw022
76. Baicker K, S J. Health care spending growth and the future of U.S. tax rates. Tax Policy and the Economy. 2011;25(1):39–68. doi:10.1086/658380
77. NA/ACCORD. HIV Viral suppression. Available from: https://naaccord.org/.
 © 2025 The Author(s). This work is published and licensed by Dove Medical Press Limited. The
full terms of this license are available at https://www.dovepress.com/terms.php
and incorporate the Creative Commons Attribution
- Non Commercial (unported, 4.0) License.
By accessing the work you hereby accept the Terms. Non-commercial uses of the work are permitted
without any further permission from Dove Medical Press Limited, provided the work is properly
attributed. For permission for commercial use of this work, please see paragraphs 4.2 and 5 of our Terms.
© 2025 The Author(s). This work is published and licensed by Dove Medical Press Limited. The
full terms of this license are available at https://www.dovepress.com/terms.php
and incorporate the Creative Commons Attribution
- Non Commercial (unported, 4.0) License.
By accessing the work you hereby accept the Terms. Non-commercial uses of the work are permitted
without any further permission from Dove Medical Press Limited, provided the work is properly
attributed. For permission for commercial use of this work, please see paragraphs 4.2 and 5 of our Terms.
Recommended articles
Experiences of Antiretroviral Therapy Initiation Among HIV-Positive Adults in Ethiopia: A Descriptive Phenomenological Design
Tefera E, Mavhandu-Mudzusi AH
HIV/AIDS - Research and Palliative Care 2022, 14:243-254
Published Date: 24 May 2022
Risk Factors for Suboptimal Adherence Identified by Patient-Reported Outcomes Assessments in Routine HIV Care at 2 North American Clinics
Short D, Wang X, Suri S, Hsu TK, Jones B, Fredericksen RJ, Crane HM, Musten A, Bacon J, Wang Y, Gough KA, Ramgopal M, Berry J, Lober WB
Patient Preference and Adherence 2022, 16:2461-2472
Published Date: 5 September 2022
Virological Outcomes After Switching to Abacavir/Lamivudine/Dolutegravir Combined with Adherence Support in People Living with HIV with Poor Adherence: A Phase IV, Multicentre Randomized Prospective Open Label Study (TriiADD-CTN 286)
Klein MB, Young J, Ortiz-Paredes D, Wang S, Walmsley S, Wong A, Martel-Laferrière V, Pick N, Conway B, Angel J, Baril JG, Fraser C, Lebouché B, Tan DH, Sandre R, Trottier S, Peiris H, Jayaraman J, Singer J
Patient Preference and Adherence 2022, 16:3267-3281
Published Date: 13 December 2022
Virological Outcomes Among Pregnant Women Receiving Antiretroviral Treatment in the Amhara Region, North West Ethiopia
Endalamaw Alamneh D, Shiferaw MB, Getachew Demissie M, Emiru MA, Zemene Kassie T, Endaylalu Lakew K, Tadege TZ
HIV/AIDS - Research and Palliative Care 2023, 15:209-216
Published Date: 2 May 2023
Health System Responses to Address Treatment Gaps of Unsuppressed Adolescents on HIV Treatment in Public Primary Health Care Facilities in Windhoek, Namibia
Munyayi FK, van Wyk B
HIV/AIDS - Research and Palliative Care 2024, 16:259-273
Published Date: 10 July 2024