")
Back to Journals » International Journal of General Medicine » Volume 17
Exploring Cortical and Hippocampal Changes in Temporal Lobe Epilepsy Using Automated MRI Segmentation Techniques
Authors Zhang Y, Li J , Wu L , Sun M, Liu S, Tian B, Luo L, Chen B
Received 26 June 2024
Accepted for publication 16 November 2024
Published 10 December 2024 Volume 2024:17 Pages 5959—5971
DOI https://doi.org/10.2147/IJGM.S484443
Checked for plagiarism Yes
Review by Single anonymous peer review
Peer reviewer comments 2
Editor who approved publication: Dr Redoy Ranjan
Yanling Zhang,1,2,* Jian Li,1,* Linhua Wu,1 Mingxing Sun,1 Shan Liu,1 Bo Tian,1 Lei Luo,1 Bing Chen1,*
1Department of Radiology, General Hospital of Ningxia Medical University, Yinchuan, 750004, People’s Republic of China; 2School of Clinical Medicine, Ningxia Medical University, Yinchuan, 750004, People’s Republic of China
*These authors contributed equally to this work
Correspondence: Jian Li; Bing Chen, Department of Radiology, General Hospital of Ningxia Medical University, No. 804 Shengli Street, Xingqing District, Yinchuan, Ningxia Hui Autonomous Region, 50004, People’s Republic of China, Tel +86-18395279801 ; Tel +86-18395210108, Fax +86-0951-6746782, Email [email protected]; [email protected]
Background: To investigate the applicability of MR-based automated segmentation techniques in evaluating cortical and hippocampal changes in adults with temporal lobe epilepsy (TLE), specifically emphasizing the affected hemisphere.
Methods: A retrospective analysis involved 48 cases diagnosed with TLE based on clinical and EEG criteria. The cohort comprised 30 patients with hippocampal sclerosis (HS) and 18 with nonlesional temporal lobe epilepsy (TLE-NL) on MR. 30 healthy volunteers constituted the control group. FreeSurfer software facilitated the segmentation of cortical regions and hippocampal subfields, generating numerical values for cortical thickness and hippocampal subfield volumes on the left hemisphere. Independent sample Wilcoxon rank-sum tests enabled pairwise comparisons of cortical thickness and hippocampal subfield volumes between the control, TLE-NL, and HS groups.
Results: Significant differences emerged in hippocampal total volume and volumes of the head, body, and tail regions between the control and HS groups and the TLE-NL and HS groups. Cortical thickness of 6 regions exhibited statistical differences between the control and TLE-NL groups, while 15 regions showed distinctions between the control and HS groups. 2 regions displayed variations in cortical thickness between the TLE-NL and HS groups.
Conclusion: MRI-based automated segmentation techniques provide valuable insights into cortical and hippocampal structural variations in distinct TLE subtypes. This methodology effectively delineates changes in cortical regions and hippocampal subfields, augmenting clinical comprehension of TLE progression.
Keywords: temporal lobe epilepsy, magnetic resonance imaging, automatic segmentation, hippocampal sclerosis, cerebral cortex
Introduction
In 2010, the International League Against Epilepsy (ILAE) redefined epilepsy, emphasizing its network attributes as a neurological disorder marked by abnormal discharges originating in local brain networks and dynamically spreading to other areas. Temporal lobe epilepsy (TLE) is a prevalent form of drug-resistant epilepsy, mainly localized in the temporal lobe and hippocampal structures, with hippocampal sclerosis (HS) being a leading pathological cause.1 Surgical resection proves effective, alleviating symptoms in 70% to 90% of patients.2 However, TLE’s structural damage extends beyond the temporal lobe and hippocampus, impacting various regions like the thalamus, insula, basal ganglia, frontal lobe, posterior cingulate, cerebellum, and fusiform gyrus.3 This broader involvement correlates with cognitive impairments beyond temporal lobe functions, including declines in executive function, cognitive processing speed, attention, and diffuse reductions in neocortical metabolism and functional connectivity.4 Understanding diverse brain region damage in TLE patients is crucial for comprehending the disease’s mechanisms, guiding clinical intervention, and prevention.
Advanced magnetic resonance imaging (MRI) technology and related research have introduced an array of MRI techniques for epilepsy diagnosis and treatment, especially in diagnosing HS. Techniques like multiplexed sensitivity encoding diffusion weighted imaging (MUSE-DWI) and three-dimensional pseudo-continuous arterial spin labeling (3D-pCASL) significantly enhance preoperative detection rates of HS by assessing changes in blood flow.5 However, about 20–30% of epileptic foci remain undetected in conventional 3.0T MRI scans, known as nonlesional temporal lobe epilepsy (TLE-NL).6 Studies7 suggest varying degrees of brain microstructural damage in TLE-NL patients, emphasizing the need for further evaluation of these undetected microstructural injuries.
Cortical thickness serves as a reliable indicator of brain structural changes. While manual delineation of cortical thickness is time-consuming and prone to low repeatability, automated segmentation software, such as FreeSurfer, minimizes errors caused by subjective factors.8 Proven accurate and reliable for measuring cortical thickness and volume, FreeSurfer is particularly sensitive to hippocampal atrophy in TLE compared to other methods.9 The software segments the brain hemisphere into 31 regions, subdividing frontal, parietal, temporal, and occipital lobes into specific gyri and sulci (Figure 1). The latest guidelines propose recommendations for MRI usage and outline the Harmonized Neuroimaging of Epilepsy Structural Sequences (HARNESS) scheme. The 3D-T1WI-MPRAGE sequence, a commonly used sequence,10 aligns with FreeSurfer’s automatic segmentation capabilities.
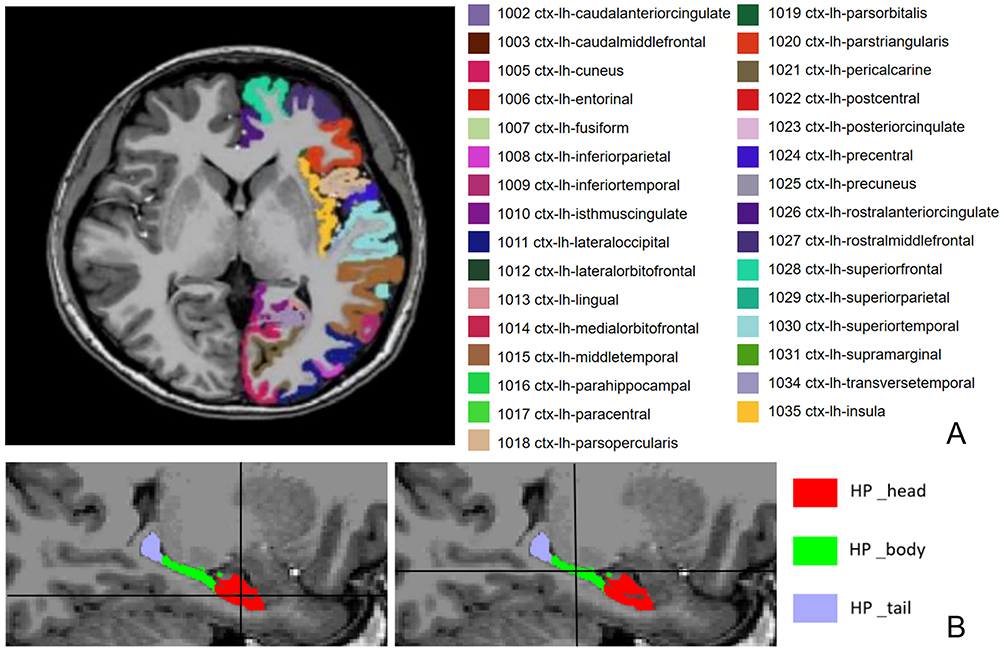 |
Figure 1 (A) The names and corresponding color codes of 31 cerebral hemispheres in the left hemisphere in FreeSurfer. (B) The name and corresponding color code of the hippocampus subregion. |
In summary, this study aims to utilize FreeSurfer software based on the 3D-T1WI-MPRAGE sequence to automatically segment and measure cortical thickness or volume in various brain regions of HS and TLE-NL patients. The investigation seeks to explore the application value of MRI automatic segmentation techniques in assessing the extent of damage in different regions for HS and TLE-NL patients.
Materials and Methods
Study Population
This study, aligned with the Helsinki Declaration, received approval from the Ethics Review Committee of the General Hospital of Ningxia Medical University (Ethics Approval No: KYLL-2021-0295). Each participant was informed about the study content, consent was obtained, and a written informed consent was signed. Between January 2021 and September 2023, 48 patients suspected of epilepsy underwent integrated epilepsy scans at our hospital, with 48 diagnosed with TLE based on clinical presentations and EEG, following ILAE 2017 diagnostic criteria. Two neuroradiologists jointly diagnosed the patients using the 3.0T MRI HARNESS scan protocol.
30 HS patients and 18 TLE-NL patients were included. Additionally, 30 healthy volunteers were randomly recruited from the normal population as a control group.
Inclusion criteria for the patient group were: (1) symptomatic and EEG-confirmed left TLE; (2) MRI showing left HS or normal findings; (3) age between 18 and 60 years; (4) MRI conducted during the interictal period. Exclusion criteria included: (1) neurological or psychiatric disorders or family history; (2) other conditions causing epileptic symptoms; (3) congenital brain malformations; (4) poor MRI image quality, inability for automated segmentation, or mismatched segmentation.
Healthy control participants were recruited from the local community and from hospital staff. Eligible participants were aged 18–59 years, right-handed, and had no history of neurological or psychiatric disorders, including epilepsy, stroke, or dementia. Controls were also required to have no significant cognitive impairments, as assessed by a standard neuropsychological screening battery, and no MRI abnormalities. Individuals with a history of substance abuse, major medical conditions (eg, cardiovascular disease), or any contraindications for MRI scanning were excluded from participation.
MRI Scanning Protocol
A GE SIGNA Architect 3.0T MRI scanner (Signa Architect, GE Healthcare) with a 48-channel phased-array head coil was used. All participants underwent our hospital’s integrated epilepsy MRI scanning protocol, with the main sequence parameters as follows: (1) Axial 3D T1-weighted magnetization-prepared rapid acquisition gradient echo sequence (3D T1WI-MPRAGE), isotropic voxels (1.0 mm×1.0 mm×1.0 mm), FOV 256 mm×256 mm, TR 7.7 ms, TE 3.1 ms, flip angle 8°, one excitation, bandwidth 1.25 hz; (2) Coronal T2-weighted imaging perpendicular to the long axis of the hippocampus, TR 2601 ms, TE 85 ms, slice thickness 2.0 mm, interslice gap 1.0 mm, flip angle 111°, four excitations, bandwidth 50 hz.
Image Analysis
Two experienced neuroradiologists (J.L and L.W, with over 7 years of experience each) independently analyzed all images in a blinded manner. Using high-resolution coronal T2-weighted images, they visually assessed hippocampal morphology, signal intensity, and internal structure. The MRI-HS diagnostic criteria included: (1) direct signs of reduced overall hippocampal volume, increased signal intensity on T2-weighted or T2 fluid attenuated inversion recovery (T2-FLAIR); (2) indirect signs of internal structure loss, blurred or absent stratum radiatum, flattened cornu ammonis, enlargement of the temporal horn of the lateral ventricle, ipsilateral hippocampal atrophy, and temporal lobe atrophy. The diagnosis for MRI-negative was based on visual analysis confirming normal brain structures. In case of disagreement, a senior radiologist (B.C) reassessed, and consensus was reached through discussion.
Image Post-Processing
In this study, FreeSurfer (http://surfer.nmr.mghharvard. edu. was employed for the segmentation of the cerebral cortex and hippocampal subfields. The segmentation process is outlined as follows: The 3D T1WI images were first converted from the DICOM format to.nii/.nii.gz format using the MRI cron software. Subsequently, these images were processed in the Linux system using FreeSurfer software version 7.3.2 for whole-brain segmentation (recon-all). This comprehensive segmentation includes 31 steps, encompassing head motion correction, non-uniform intensity normalization, and other procedures, all executed through the recon-all script for automation [http://ftp.nmr.mgh.harvard.edu/fswiki/recon-all]. Building upon recon-all, the segmentHA_T1.sh script was applied for the segmentation of hippocampal subfields,11 distinguishing the head, body, and tail of the hippocampus. The thickness of each gyrus and the volume of each hippocampal subfield were obtained in the stats output file.
Statistical Analysis
Statistical analysis was conducted using SPSS 26.0 software. Before conducting statistical tests, we assessed whether statistics including the differences in hippocampal subfield volumes and cortical thickness between patients (TLE subtypes and controls) were normally distributed. We tested the normality of these differences using both graphical methods (Q-Q plots) and formal statistical tests (Shapiro–Wilk test). Descriptive statistics, mean ± standard deviation for normally distributed data, and median (Q1, Q3) for non-normally distributed data, were employed. Independent sample t-tests (for normally distributed data) or independent sample Wilcoxon tests (for non-normally distributed data) were performed to compare the differences in cortical thickness of various brain regions on the left side, hippocampal total volume, and volumes of hippocampal subfields (head, body, tail) between the control group and the TLE-NL group, control group and HS group, and between the TLE-NL and HS groups. A significance level of P < 0.05 was considered statistically significant. Post-hoc power analysis was conducted to assess the statistical power of the study. Parameters such as the observed effect size, sample size, and significance level were used to determine that the study achieved a power of ≥ 0.80, ensuring sufficient sensitivity to detect differences in cortical thickness and hippocampal subfield volumes between groups.
Results
Characteristics of the Study Participants
A total of 48 TLE patients were included in this study, including 30 hS patients (16 male, 14 female; average age, 32.30±11.38 years; range, 18 ~ 55 years); 18 TLE patients (10 male, 8 female; average age, 33.55±14.25 years; range, 18 ~ 59years). Thirty healthy volunteers (17 male, 13 female; average age, 28.03±10.11 years; range, 18 ~ 58 years) were recruited. No statistically significant differences in age or gender were observed among the three groups (age: Z1 = −1.095, P1 = 0.273; Z2 = −1.487, P2 = 0.137; Z3 = −0.032, P3 =0.974; gender: χ2 = 2.468, P = 0.291). The demographic characteristics, electrophysiological findings, and semiology of all participants are shown in Table 1.
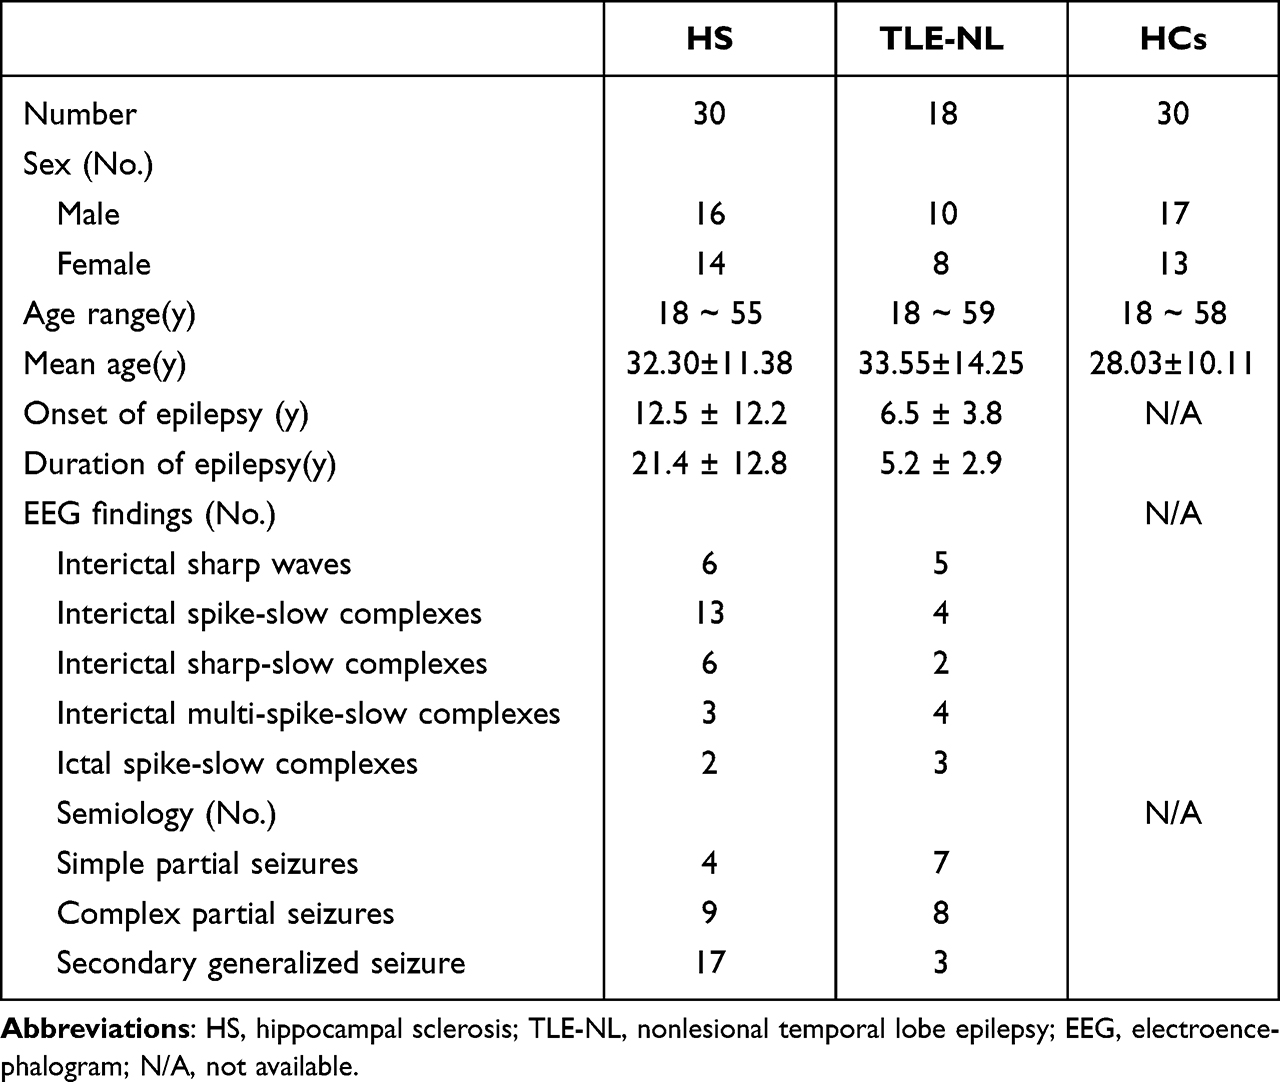 |
Table 1 The Demographics, Electrophysiological Findings, and Semiology of the Study Participants |
Differences in Cortical Thickness and Hippocampal Subfield Volumes in the HC
In the control group, normal distribution characterizes hippocampal volumes on both sides. Paired-sample t-tests unveil significant differences in total volume, head, and body of the hippocampus between the left and right sides. Regarding cortical thickness measurements, some conform to a normal distribution on both sides, while others do not. Employing paired-sample t-tests and paired-sample Wilcoxon rank-sum tests, we identify 11 cortical thickness measurements with significant differences between the left and right sides. These include the posterior cingulate cortex, olfactory cortex, cingulate gyrus, inferior parietal lobule, lateral occipital gyrus, middle temporal gyrus, precuneus, posterior cingulate gyrus, superior frontal gyrus, middle frontal gyrus, and inferior frontal gyrus. Significance is set at P < 0.05, and detailed results are provided in Table 2 and 3.
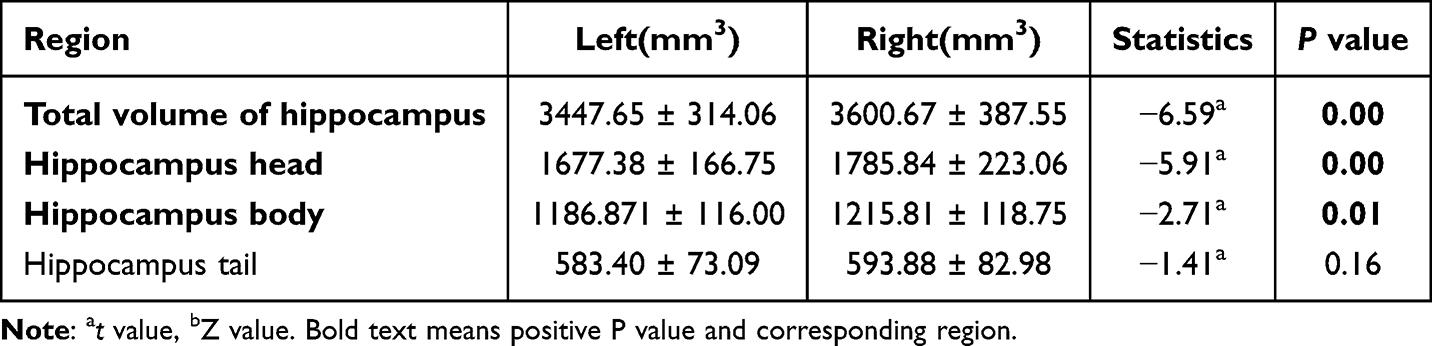 |
Table 2 Results in Total Volume and Subregion Volume Values of the Left and Right Hippocampus in the Control Group |
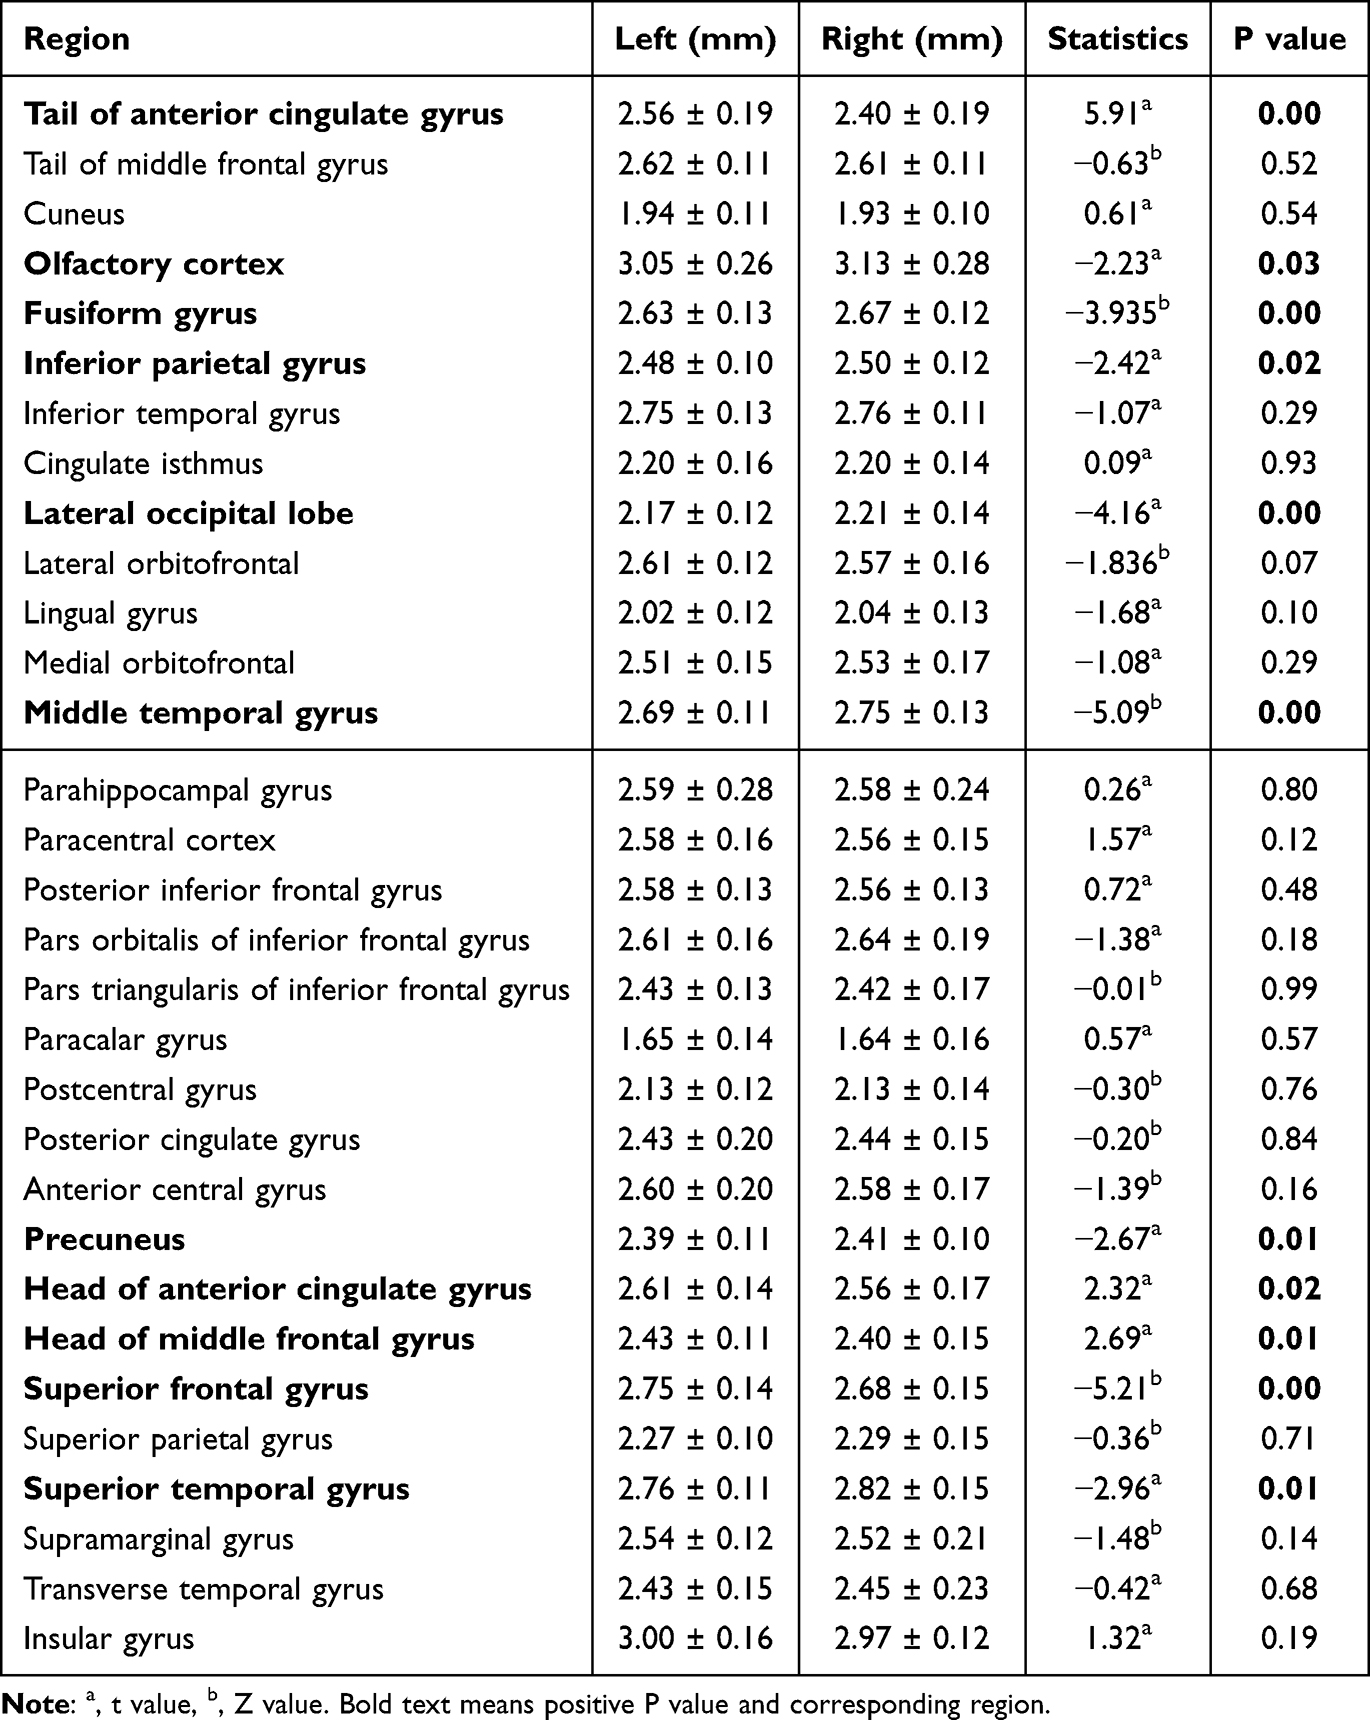 |
Table 3 The Thickness of 31 Cerebral Cortexes on the Left and Right Sides of the Control Group |
Differences in Cortical Thickness Among HC, TLE-NL, and HS Groups in the Left Hemisphere
Cortical thickness across various regions of the left hemisphere deviated from a normal distribution in all three groups. Employing independent sample Wilcoxon rank-sum tests for statistical analysis, we identified significant differences in six cortical thickness regions between the control and TLE-NL groups. These regions included the medial frontal gyrus (head and tail), superior frontal gyrus, triangular part of the inferior frontal gyrus, paracentral lobule, and posterior cingulate gyrus. Notably, the frontal lobe encompassed the medial frontal gyrus (head and tail), superior frontal gyrus, and triangular part of the inferior frontal gyrus, while the posterior cingulate gyrus belonged to the parietal lobe. Fifteen cortical thickness regions exhibited significant differences between the control and HS groups, spanning areas such as the medial frontal gyrus (head and tail), lateral orbital gyrus, triangular part of the inferior frontal gyrus, lateral orbital gyrus (frontal lobe), olfactory cortex (temporal lobe), fusiform gyrus, superior temporal gyrus, middle temporal gyrus, inferior temporal gyrus, parahippocampal gyrus (temporal lobe), posterior cingulate gyrus, and marginal gyrus (parietal lobe). Additionally, differences in cortical thickness between the TLE-NL and HS groups were observed in the olfactory cortex (temporal lobe) and the tail of the rostral cingulate gyrus (frontal lobe). Detailed information can be found in Table 4, Figures 2–4, with statistical significance set at P < 0.05.
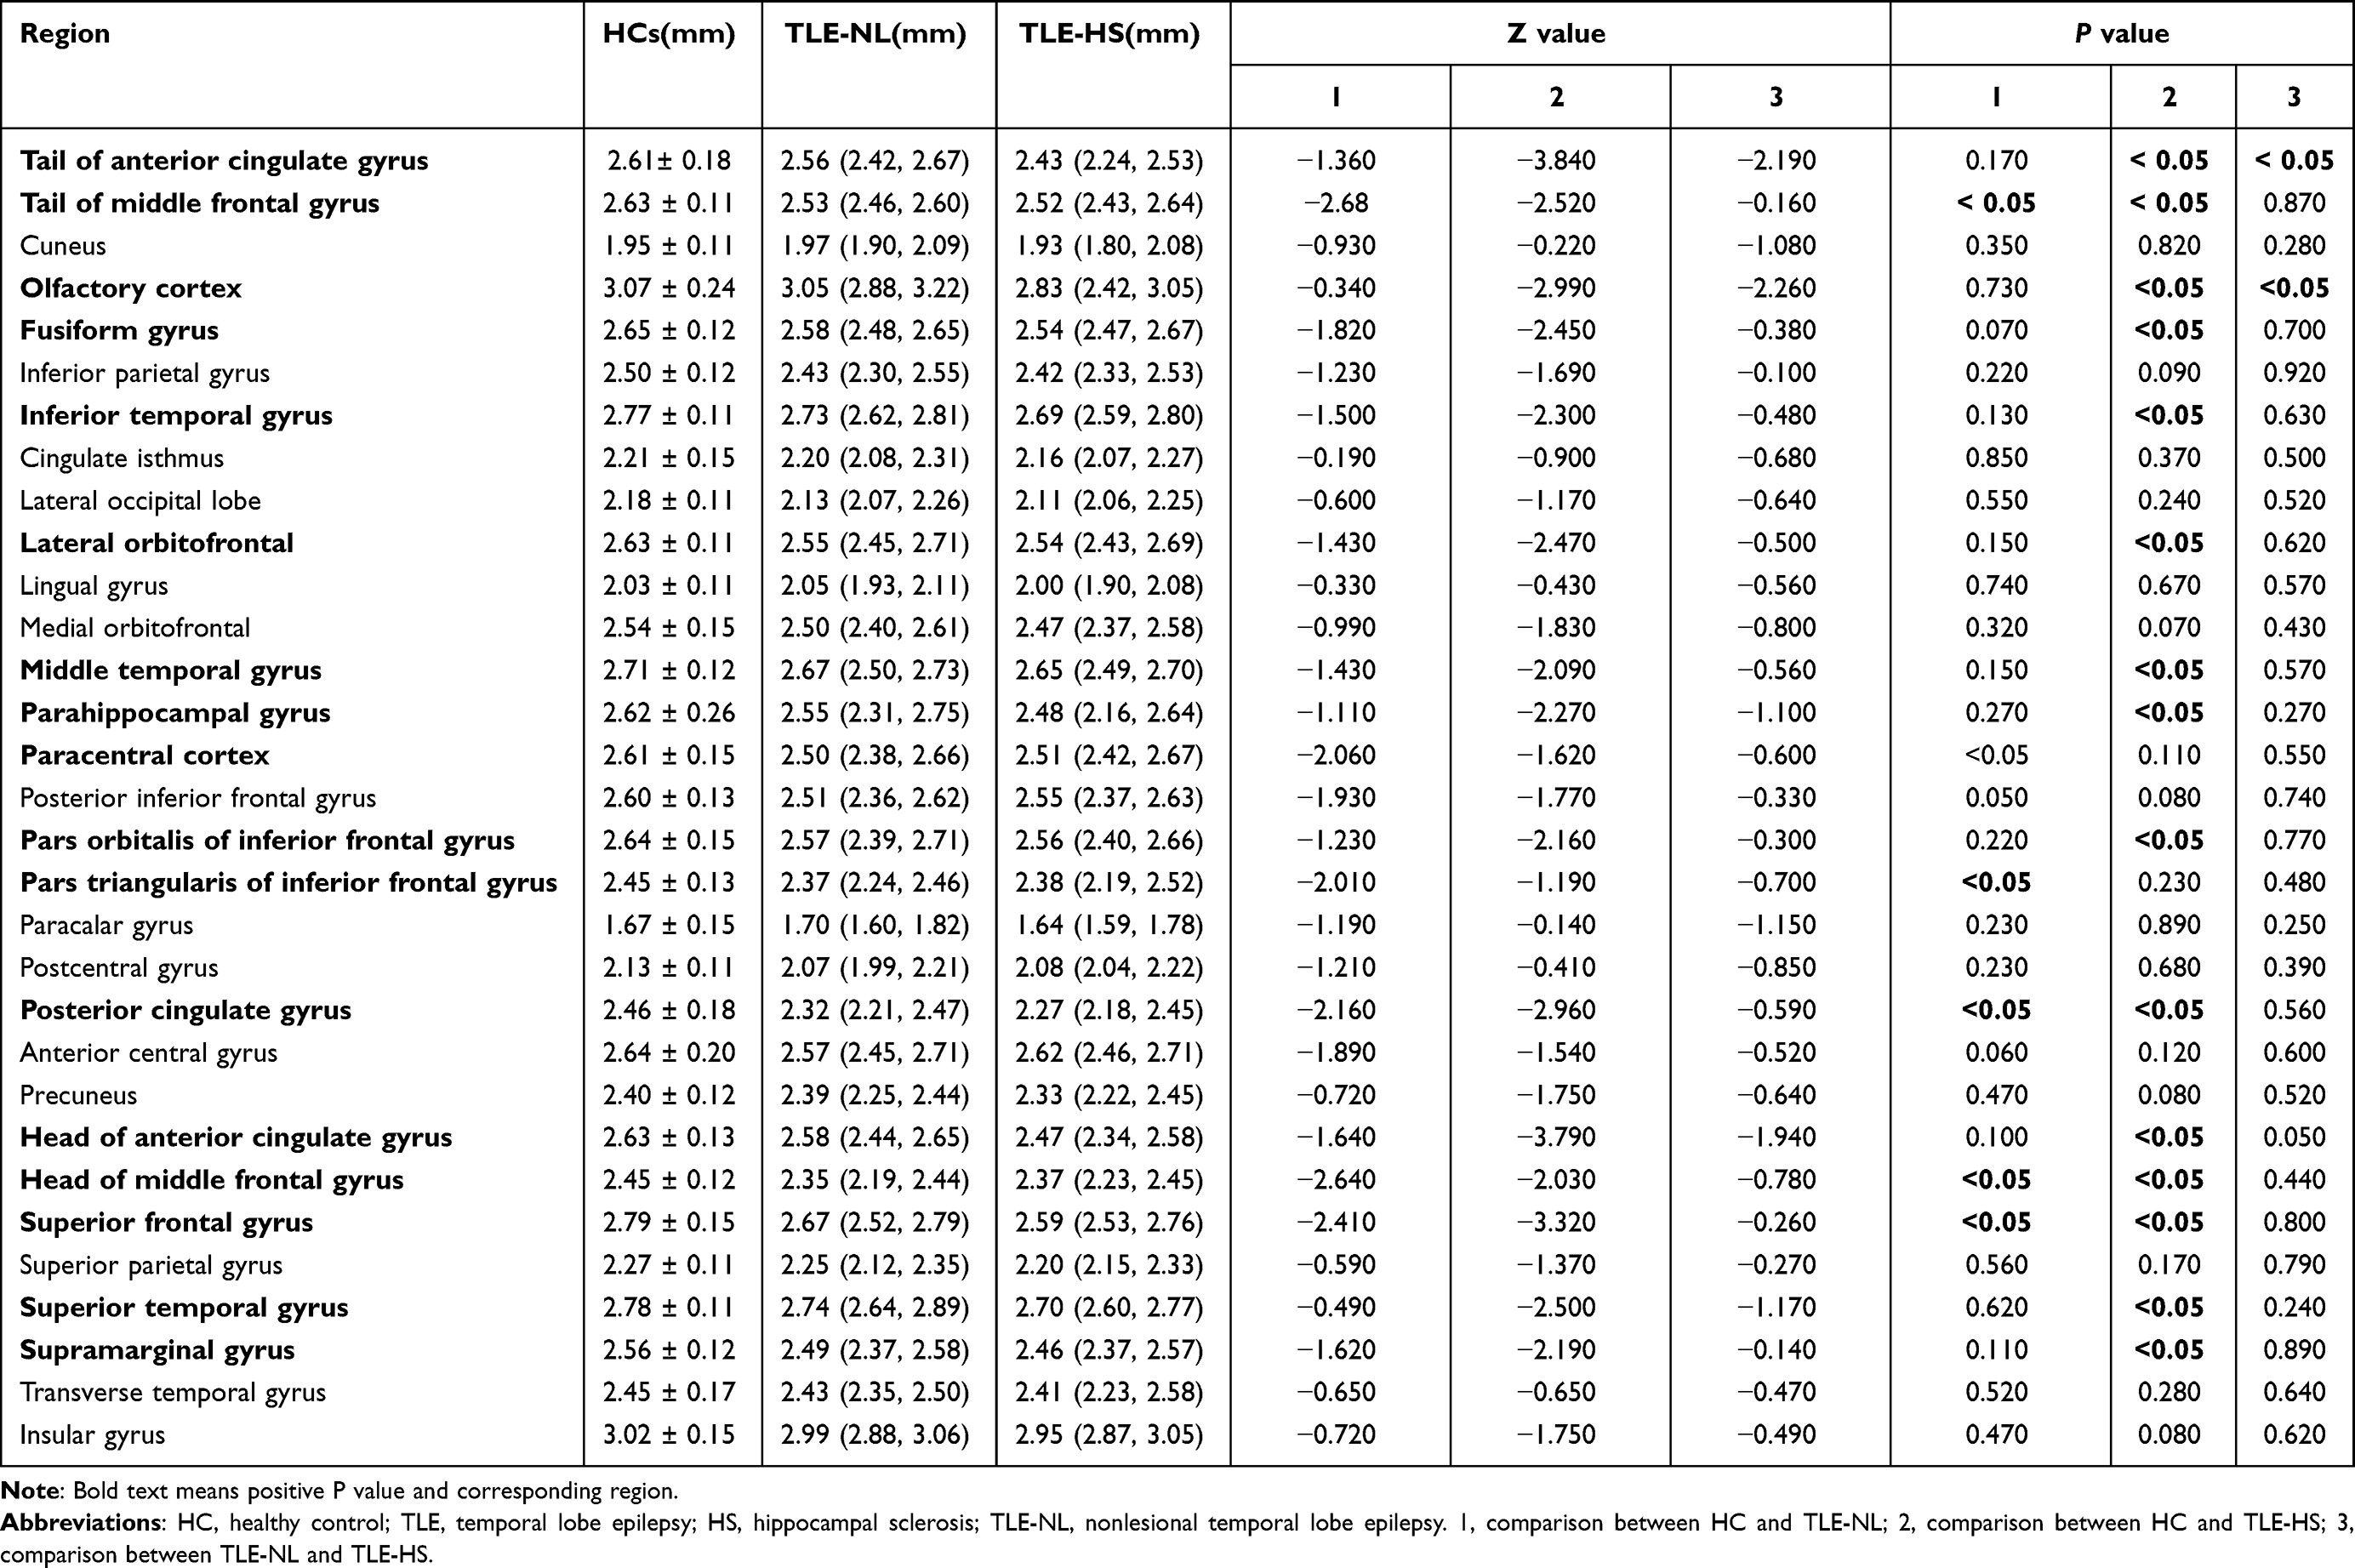 |
Table 4 Cortical Thickness of 31 Left Brain Regions in the Three Groups and Comparison Between Groups |
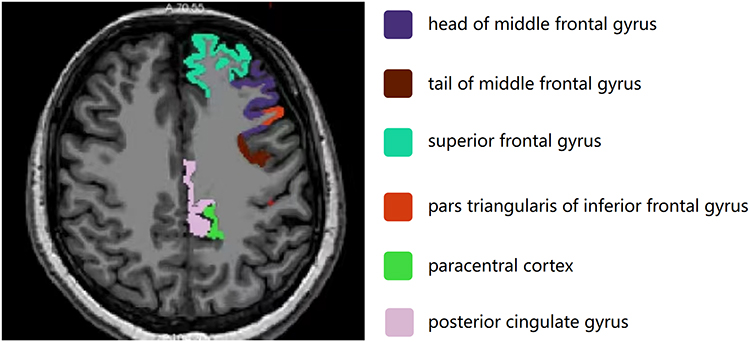 |
Figure 2 6 different thinning cortical color codes and names of TLE-NL patients. Abbreviation: TLE-NL, nonlesional temporal lobe epilepsy. |
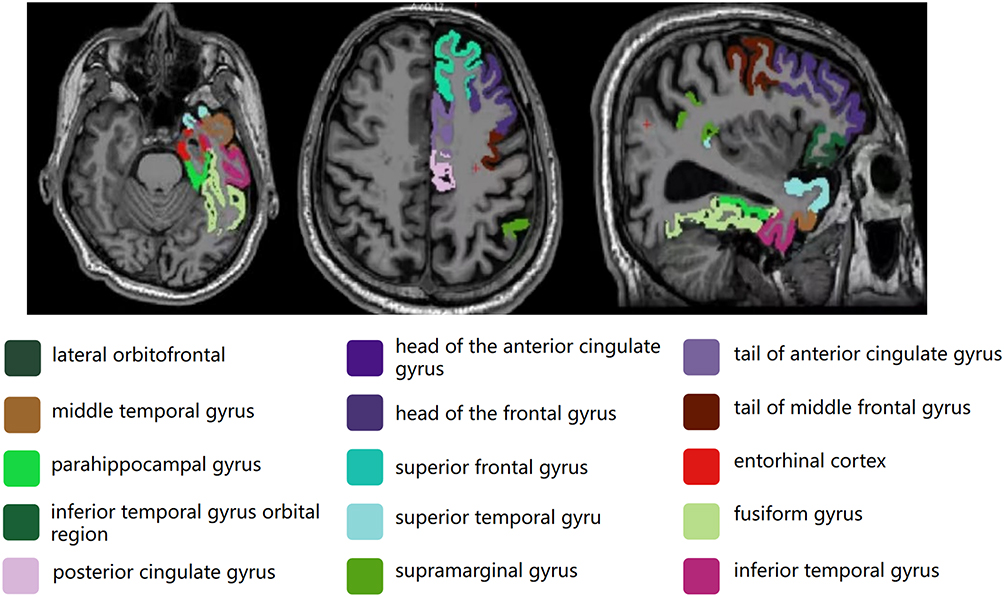 |
Figure 3 15 thinning cortical color codes and names in HS patients. Abbreviation: HS, hippocampal sclerosis. |
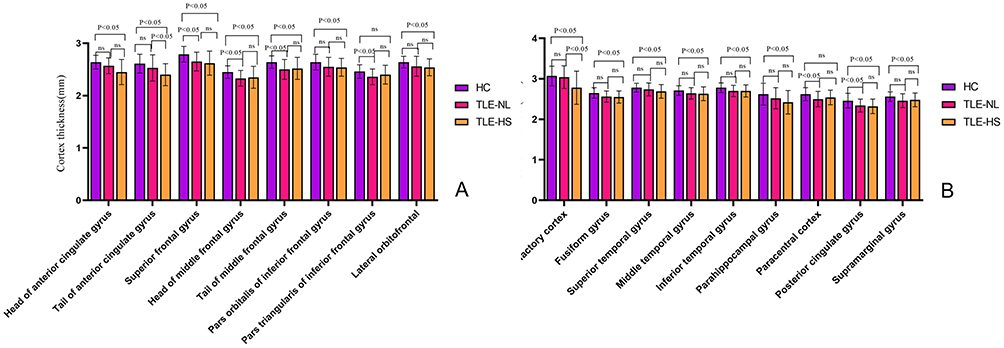 |
Figure 4 (A and B) Comparison of cortical thickness in various regions between HC, TLE-NL and HS groups. Abbreviations: HC, healthy control; TLE-NL, nonlesional temporal lobe epilepsy; HS, hippocampal sclerosis. |
Differences in Hippocampal Total Volume and Subfield Volumes among Control, TLE-NL, and HS Groups in the Left Hemisphere
Volumes of the hippocampus total, head, body, and tail deviated from a normal distribution in all three groups. Employing independent sample Wilcoxon rank-sum tests, no statistically significant differences emerged in hippocampal total volume, head, body, and tail volumes between the control and TLE-NL groups. However, notable differences were observed between the control and HS groups, as well as between the TLE-NL and HS groups, across all hippocampal measurements (total volume, head, body, and tail volumes), with P < 0.01. Specific values can be found in Table 5 and Figure 5.
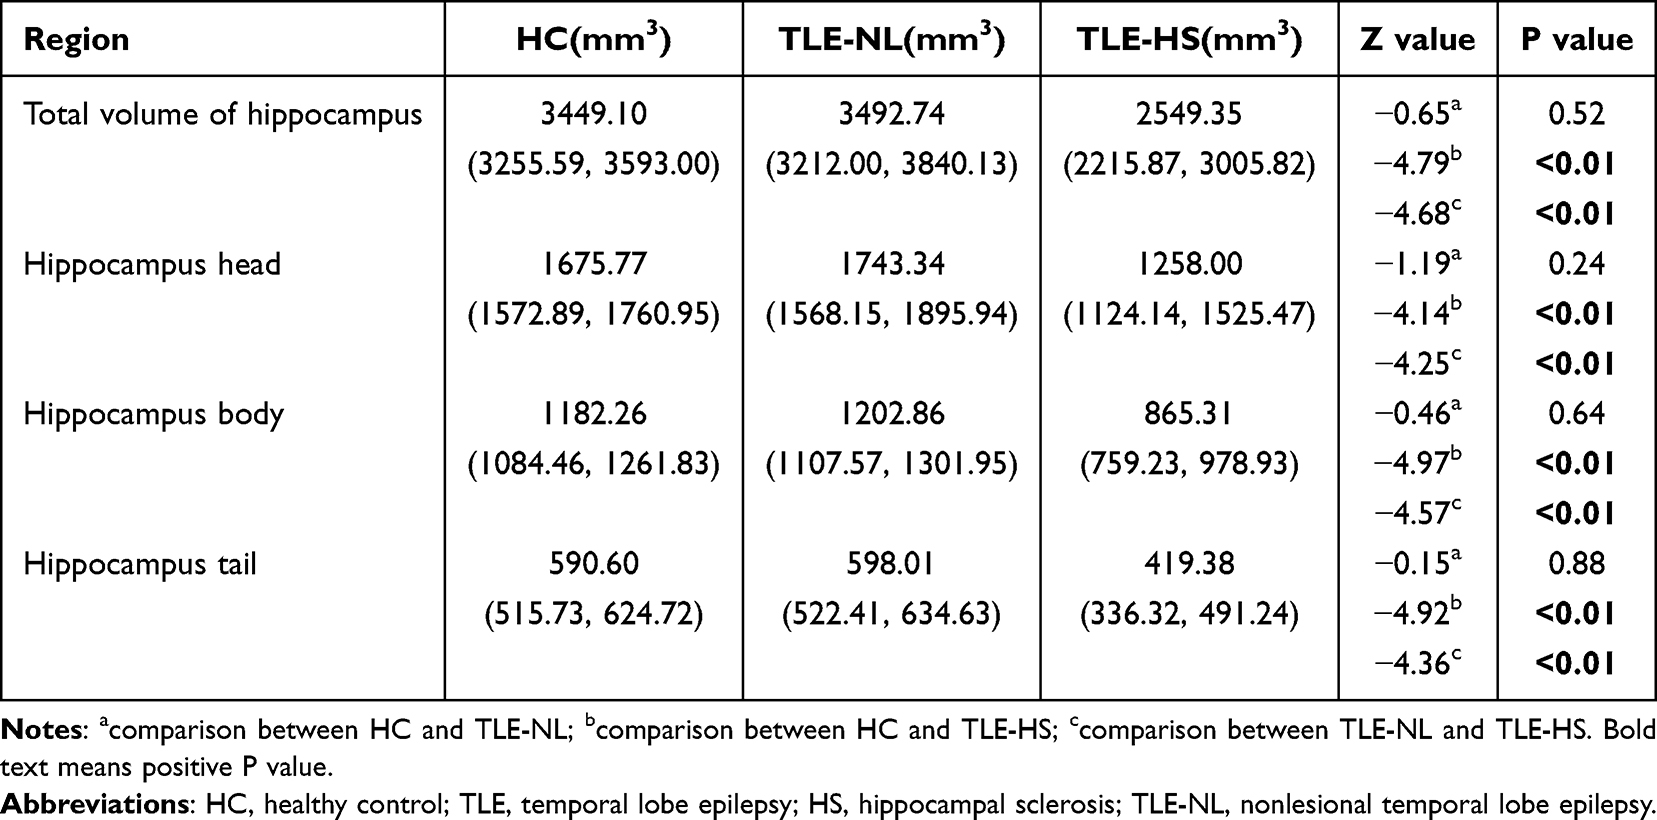 |
Table 5 Total Volume and Subregion Volume of Left Hippocampus in Three Groups and Comparison Between Groups |
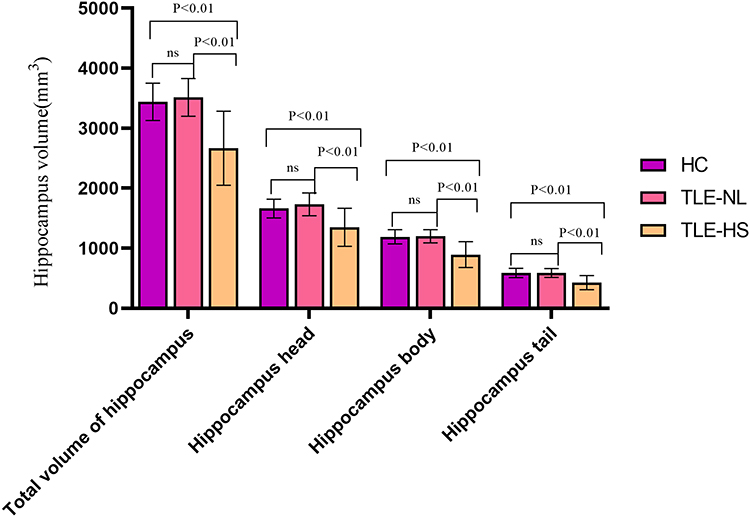 |
Figure 5 Comparison of total hippocampal volume and volume of each part in HC, TLE-NL and HS groups. Abbreviations: HC, healthy control; TLE-NL, nonlesional temporal lobe epilepsy; HS, hippocampal sclerosis. |
Discussion
This study, encompassing healthy controls and two TLE subtypes (hippocampal sclerosis - HS and MRI-negative cases), delves into distinctive gray matter abnormalities indicated by structural MRI studies. Notably, patients with medial temporal lobe sclerosis exhibit pronounced abnormalities in the ipsilateral medial temporal lobe, along with frontal, parietal lobes, basal ganglia, and thalamus involvement. Conversely, MRI-NL patients manifest anomalies in the ipsilateral inferior temporal lobe cortex, extending to the insula and frontal lobe regions.12–15
For the diagnosis of hippocampal sclerosis, this study adopted the ILAE 2017 diagnostic criteria. Regarding the detection of hippocampal sclerosis from MRI images, we used blind analysis by radiologists and visual assessment of the hippocampus, as in previous studies.5,16 Princich et al16 reported that measuring the total hippocampal volume using automatic classifiers such as FreeSurfer can improve the detection rate of hippocampal sclerosis (AUC: >0.960). This study used FreeSufer to detect changes in hippocampal subregion volume in hippocampal sclerosis.
Asymmetries in the Cerebral Cortex of Healthy Humans
Consistent with prior research,17,18 our study underscores cortical thickness variations across diverse brain regions in the healthy control group (Table 3). Additionally, it elucidates differences in hippocampal total volume and subfield volumes (Table 2), aligning with recognized asymmetries in the human cerebral cortex. Intriguingly, asymmetry in cerebellar structures is discerned in HS patients, particularly those with left TLE-HS.19 Unilateral hippocampal sclerosis affects not only the cerebral cortex on the ipsilateral side but also the cerebral cortex on the contralateral side. Moreover, there is asymmetry in the thickness of the cerebral cortex on both sides. If left and right hippocampal sclerosis are included in the study at the same time, the problem will be complicated. It is difficult to determine whether it is asymmetry or changes in cortical thickness caused by hippocampal sclerosis. To precisely delineate unilateral HS’s impact, we exclusively enrolled left-sided HS patients to improve consistency, concentrating on the extent of involvement in the left hemisphere.
Changes in Hippocampal Volume and Cortical Thickness in TLE-NL Patients
Approximately 30% of TLE cases fall under the category of TLE-NL,3 with existing research pointing to structural cortical alterations in these patients. Traditional visual analysis and routine MRI might not unveil apparent changes, making FreeSurfer software instrumental for precise structural quantification. This study underscores that TLE-NL patients exhibit cortical thinning in specific regions, primarily affecting the ipsilateral frontal lobe cortex. Notably, thinning involves the medial frontal gyrus (head and tail), superior frontal gyrus, triangular part of the inferior frontal gyrus (frontal lobe), paracentral lobule (frontal and parietal lobes), and posterior cingulate gyrus (parietal lobe). Despite the absence of significant hippocampal volume changes, cortical thinning in TLE-NL predominantly impacts the frontal lobe, with limited parietal lobe involvement, while the temporal lobe remains unaffected—a trend in line with previous findings.11
TLE emerges as a complex interplay among multiple brain regions, influenced by the propagation pathways of epileptic discharges. The well-established phenomena of discharges spreading through neural networks to other brain areas and evolving into generalized seizures add complexity to understanding TLE.20 Presently, conclusive evidence regarding the sequential relationship between temporal lobe cortex changes and those extending beyond in TLE patients is lacking, necessitating further investigation for comprehensive insights.
Changes in Hippocampal Volume and Cortical Thickness in TLE-HS Patients
Approximately 65% of TLE cases manifest as TLE-HS.15 While TLE was historically perceived as a hippocampal disorder, it’s now acknowledged as a network disease with implications for various cortical and subcortical structures beyond the temporal lobe.21 This study delves into cortical thickness alterations across diverse brain regions in TLE-HS patients, providing a comprehensive examination of structural changes. Findings not only unveil reduced hippocampal volume but also cortical thinning in areas like the medial frontal gyrus (head and tail), superior frontal gyrus, triangular part of the inferior frontal gyrus (frontal lobe), lateral orbitofrontal cortex, orbital part of the inferior frontal gyrus, head and tail of the anterior cingulate gyrus (frontal lobe), olfactory cortex, insula, superior temporal gyrus, middle temporal gyrus, inferior temporal gyrus, parahippocampal gyrus (temporal lobe), posterior cingulate gyrus, precuneus (parietal lobe), and superior parietal gyrus (parietal lobe).12 The identified regions of cortical thinning align with the commonly observed propagation pattern during intracranial depth electrode monitoring in focal temporal lobe epilepsy patients, involving sequential spread to the ipsilateral frontal lobe, contralateral frontal lobe, and contralateral temporal lobe.22
The frontal lobe cortex, crucial for decision-making and flexible behavior,23 and the temporal lobe cortex, involved in high-level cognitive functions,24,25 both undergo thinning in TLE. This dual impact affects decision-making abilities and cognitive functions, significantly impacting patients’ quality of life. Concurrent damage to the brain cortex and white matter fiber bundles26 collectively shapes brain function, suggesting that future research could explore the combined impact for a more nuanced understanding of TLE development and mechanisms. Such insights could serve as imaging-based evidence for refining clinical treatment strategies.
Although we observed some cortical thickness changes in TLE-NL and HS patients, we did not observe scalp EEG differences in corresponding regions. We believe that the corresponding changes in cortical thickness may precede EEG changes, which requires further study.
In this study, an 18-year-old male patient with left hippocampal sclerosis, whose hippocampal volume was reduced mainly in the head of the hippocampus, completely disappeared after neurosurgery surgically removed the head of the hippocampus. Regarding the correlation between the treatment effect and the volume changes in the head, body, and tail subregions of the hippocampus, there is only one case in this study, and more cases are needed for further verification. The identification of distinct cortical and hippocampal changes in different TLE subtypes using automated MRI-based segmentation techniques offers a non-invasive method for better understanding the pathophysiology of TLE. This could lead to more accurate diagnostic tools, particularly for TLE-NL, which is often difficult to diagnose using conventional imaging. Furthermore, these findings could inform personalized treatment strategies, targeting specific regions of the brain that are affected in each subtype.
While our study provides valuable insights into the structural changes in TLE, there are limitations such as the retrospective nature of the analysis and the relatively small sample size. Future studies with larger cohorts, longitudinal designs, and the incorporation of functional imaging techniques are needed to validate these findings and explore their potential role in predicting treatment outcomes.
Conclusion
To conclude, TLE manifests cortical thinning, primarily in the frontal and temporal lobes, with marginal involvement in the parietal lobe. TLE-NL exhibit frontal lobe cortex alterations, sparing the parietal lobe, and lack significant hippocampal volume changes. In contrast, patients with HS display more extensive cortical changes, impacting the frontal, temporal, and a limited portion of the parietal lobes, accompanied by a more pronounced reduction in hippocampal volume. These findings equip clinicians with nuanced imaging-based insights into microstructural brain alterations, facilitating a comprehensive preoperative assessment. The segmentation precision of FreeSurfer software emerges as instrumental in detecting subtle changes in brain cortical structures.
Ethical Approval/Consent to Participate
The study was approved by the institution’s research committee. Each participant was informed about the study content, consent was obtained, and a written informed consent was signed.
Acknowledgments
The authors appreciate the support from the Ningxia Natural Science Foundation project (No.2023AAC03611). The authors thank the staff of the Department of Radiology, General Hospital of Ningxia Medical University for their selfless and valuable assistance.
Author Contributions
All authors made a significant contribution to the work reported, whether that is in the conception, study design, execution, acquisition of data, analysis and interpretation, or in all these areas; took part in drafting, revising or critically reviewing the article; gave final approval of the version to be published; have agreed on the journal to which the article has been submitted; and agree to be accountable for all aspects of the work.
Funding
This study has received funding by the Ningxia Natural Science Foundation Project (No.2023AAC03611).
Disclosure
The authors declare that they have no known competing financial interests or personal relationships that could have appeared to influence the work reported in this paper.
References
1. Thom M. Review: hippocampal sclerosis in epilepsy: a neuropathology review. Neuropathol Appl Neurobiol. 2014;40(5):520–543. PMID: 24762203. doi:10.1111/nan.12150
2. Blumcke I, Spreafico R, Haaker G, et al. Histopathological findings in brain tissue obtained during epilepsy surgery. N Engl J Med. 2017;377(17):1648–1656. PMID: 29069555. doi:10.1056/NEJMoa1703784
3. Muhlhofer W, Tan YL, Mueller SG, Knowlton R. MRI-negative temporal lobe epilepsy-What do we know? Epilepsia. 2017;58(5):727–742. PMID: 28266710. doi:10.1111/epi.13699
4. Englot DJ, Morgan VL, Chang C. Impaired vigilance networks in temporal lobe epilepsy: mechanisms and clinical implications. Epilepsia. 2020;61(2):189–202. PMID: 31901182. doi:10.1111/epi.16423
5. Li J, Bai YC, Wu LH, et al. Synthetic relaxometry combined with MUSE DWI and 3D-pCASL improves detection of hippocampal sclerosis. Eur J Radiol. 2022;157:110571. PMID: 36327855. doi:10.1016/j.ejrad
6. Kendall K, Robertson NP. Neuroimaging. J Neurol. 2012;259(9):2009–2011. PMID: 22918455. doi:10.1007/s00415-012-6652-x
7. Beheshti I, Sone D, Farokhian F, Maikusa N, Matsuda H. Gray matter and white matter abnormalities in temporal lobe epilepsy patients with and without hippocampal sclerosis. Front Neurol. 2018;9:107. PMID: 29593628. doi:10.3389/fneur.2018.00107
8. Müller SJ, Khadhraoui E, Hansen N, et al. Brainstem atrophy in dementia with Lewy bodies compared with progressive supranuclear palsy and Parkinson’s disease on MRI. BMC Neurol. 2023;23(1):114. PMID: 36944914. doi:10.1186/s12883-023-03151-4
9. Pardoe HR, Pell GS, Abbott DF, Jackson GD. Hippocampal volume assessment in temporal lobe epilepsy: how good is automated segmentation? Epilepsia. 2009;50(12):2586–2592. PMID: 19682030. doi:10.1111/j.1528-1167.2009.02243.x
10. Bernasconi A, Cendes F, Theodore WH, et al. Recommendations for the use of structural magnetic resonance imaging in the care of patients with epilepsy: a consensus report from the international league against epilepsy neuroimaging task force. Epilepsia. 2019;60(6):1054–1068. PMID: 31135062. doi:10.1111/epi.15612
11. Menzler K, Hamer HM, Mross P, et al. Validation of automatic MRI hippocampal subfield segmentation by histopathological evaluation in patients with temporal lobe epilepsy. Seizure. 2021;87:94–102. PMID: 33752160. doi:10.1016/j.seizure.2021.03.007
12. Scanlon C, Mueller SG, Tosun D, et al. Impact of methodologic choice for automatic detection of different aspects of brain atrophy by using temporal lobe epilepsy as a model. AJNR Am J Neuroradiol. 2011;32(9):1669–1676. PMID: 21852375. doi:10.3174/ajnr.A2578
13. Kasa LW, Peters T, Mirsattari SM, Jurkiewicz MT, Khan AR, A.M Haast R. The role of the temporal pole in temporal lobe epilepsy: a diffusion kurtosis imaging study. Neuroimage Clin. 2022;36:103201. PMID: 36126518. doi:10.1016/j.nicl.2022.103201
14. Sharma AA, Nenert R, Goodman A, Szaflarski JP. Concordance between focal brain temperature elevations and focal edema in temporal lobe epilepsy. Epilepsia. 2023;64(5):1289–1304. PMID: 36762949. doi:10.1111/epi.17538
15. Mueller SG, Laxer KD, Barakos J, Cheong I, Garcia P, Weiner MW. Widespread neocortical abnormalities in temporal lobe epilepsy with and without mesial sclerosis. Neuroimage. 2009;46(2):353–359. PMID: 19249372. doi:10.1016/j.neuroimage.2009.02.020
16. Princich JP, Donnelly-Kehoe PA, Deleglise A, et al. Diagnostic performance of MRI volumetry in epilepsy patients with hippocampal sclerosis supported through a random forest automatic classification algorithm. Front Neurol. 2021;12:613967. doi:10.3389/fneur.2021.613967
17. Chen YC, Arnatkevičiūtė A, McTavish E, et al. The individuality of shape asymmetries of the human cerebral cortex. Elife. 2022;11:e75056. PMID: 36197720. doi:10.7554/eLife.75056
18. Mei L, Xue G, Lu ZL, et al. Long-term experience with Chinese language shapes the fusiform asymmetry of English reading [published correction appears in neuroimage. Neuroimage. 2015;110:3–10. PMID: 25598049. doi:10.1016/j.neuroimage.2015.01.030
19. Marcián V, Mareček R, Pail M, Brázdil M. Cerebrocerebellar structural covariance in temporal lobe epilepsy with hippocampal sclerosis. Epilepsy Behav. 2020;111:107180. PMID: 32599430. doi:10.1016/j.yebeh.2020.107180
20. González Otárula KA, Schuele S. Networks in Temporal Lobe Epilepsy. Neurosurg Clin N Am. 2020;31(3):309–317. PMID: 32475481. doi:10.1016/j.nec.2020.02.001
21. Caciagli L, Wandschneider B, Centeno M, et al. Motor hyperactivation during cognitive tasks: an endophenotype of juvenile myoclonic epilepsy. Epilepsia. 2020;61(7):1438–1452. PMID: 32584424. doi:10.1111/epi.16575
22. Snelleksz M, Rossell SL, Gibbons A, Nithianantharajah J, Dean B. Evidence that the frontal pole has a significant role in the pathophysiology of schizophrenia. Psychiatry Res. 2022;317:114850. PMID: 36174274. doi:10.1016/j.psychres.2022.114850
23. Klein-Flügge MC, Bongioanni A, Rushworth MFS. Medial and orbital frontal cortex in decision-making and flexible behavior. Neuron. 2022;110(17):2743–2770. PMID: 35705077. doi:10.1016/j.neuron.2022.05.022
24. Garcin B, Urbanski M, Thiebaut de Schotten M, Levy R, Volle E. Anterior temporal lobe morphometry predicts categorization ability. Front Hum Neurosci. 2018;12:36. PMID: 29467637. doi:10.3389/fnhum.2018.00036
25. Blazquez Freches G, Haak KV, Bryant KL, Schurz M, Beckmann CF, Mars RB. Principles of temporal association cortex organisation as revealed by connectivity gradients. Brain Struct Funct. 2020;225(4):1245–1260. PMID: 32157450. doi:10.1007/s00429-020-02047-0
26. Braunsdorf M, Blazquez Freches G, Roumazeilles L, et al. Does the temporal cortex make us human? A review of structural and functional diversity of the primate temporal lobe. Neurosci Biobehav Rev. 2021;131:400–410. PMID: 34480913. doi:10.1016/j.neubiorev.2021.08.032
 © 2024 The Author(s). This work is published and licensed by Dove Medical Press Limited. The
full terms of this license are available at https://www.dovepress.com/terms.php
and incorporate the Creative Commons Attribution
- Non Commercial (unported, 3.0) License.
By accessing the work you hereby accept the Terms. Non-commercial uses of the work are permitted
without any further permission from Dove Medical Press Limited, provided the work is properly
attributed. For permission for commercial use of this work, please see paragraphs 4.2 and 5 of our Terms.
© 2024 The Author(s). This work is published and licensed by Dove Medical Press Limited. The
full terms of this license are available at https://www.dovepress.com/terms.php
and incorporate the Creative Commons Attribution
- Non Commercial (unported, 3.0) License.
By accessing the work you hereby accept the Terms. Non-commercial uses of the work are permitted
without any further permission from Dove Medical Press Limited, provided the work is properly
attributed. For permission for commercial use of this work, please see paragraphs 4.2 and 5 of our Terms.
Recommended articles
Activation of the Reelin/GSK-3β/p-Tau Signaling Pathway in the Hippocampus of Patients with Temporal Lobe Epilepsy
Lin J, Lin X, Fu YJ, Li X, Li X, Wang Y, Zhao L, Yu S, Piao YS
Neuropsychiatric Disease and Treatment 2025, 21:409-419
Published Date: 27 February 2025