")
Back to Journals » Neuropsychiatric Disease and Treatment » Volume 21
Functional and Structural Network Alterations in HIV-Associated Asymptomatic Neurocognitive Disorders: Evidence for Functional Disruptions Preceding Structural Changes
Authors Zhou Z , Gong W , Hu H, Wang F , Li H , Xu F , Li H, Wang W
Received 28 November 2024
Accepted for publication 25 March 2025
Published 1 April 2025 Volume 2025:21 Pages 689—709
DOI https://doi.org/10.2147/NDT.S508747
Checked for plagiarism Yes
Review by Single anonymous peer review
Peer reviewer comments 2
Editor who approved publication: Dr Roger Pinder
Zhongkai Zhou,1,* Wenru Gong,1,* Hong Hu,2,* Fuchun Wang,3 Hui Li,4 Fan Xu,1 Hongjun Li,1 Wei Wang1
1Department of Radiology, Beijing YouAn Hospital, Capital Medical University, Beijing, People’s Republic of China; 2Department of Neurosurgery, First Affiliated Hospital of Harbin Medical University, Harbin, Heilongjiang Province, People’s Republic of China; 3Center of Infectious Disease, Beijing YouAn Hospital, Capital Medical University, Beijing, People’s Republic of China; 4Department of Neurology, XuanWu Hospital, Capital Medical University, Beijing, People’s Republic of China
*These authors contributed equally to this work
Correspondence: Wei Wang, Department of Radiology, Beijing YouAn Hospital, Capital Medical University, No. 8 Xi Tou Tiao, Youanmenwai, Fengtai District, Beijing, 100069, People’s Republic of China, Tel +8618001022256, Email [email protected] Hongjun Li, Department of Radiology, Beijing YouAn Hospital, Capital Medical University, No. 8 Xi Tou Tiao, Youanmenwai, Fengtai District, Beijing, 100069, People’s Republic of China, Tel +8613520278511, Email [email protected]
Purpose: This study focuses on the asymptomatic neurocognitive impairment (ANI) stage of HIV-associated neurocognitive disorders (HAND). Using multimodal MRI and large-scale brain network analysis, we aimed to investigate alterations in functional networks, structural networks, and functional-structural coupling in persons with ANI.
Patients and Methods: A total of 95 participants, including 48 healthy controls and 47 persons with HIV-ANI, were enrolled. Resting-state fMRI and diffusion tensor imaging were used to construct functional and structural connectivity matrices. Graph-theoretical analysis was employed to assess inter-group differences in global metrics, nodal characteristics, and functional-structural coupling patterns. Furthermore, machine learning classifiers were used to construct and evaluate classification models based on imaging features from both groups. The performance of different models was compared to identify the optimal diagnostic model for detecting HIV-ANI.
Results: Structural network analysis showed no significant changes in the global or local topological properties of persons with ANI. In contrast, functional networks exhibited significant reorganization in key regions, including the visual, executive control, and default mode networks. Functional-structural coupling was significantly enhanced in the occipital and frontal networks. These changes correlated with immune status, infection duration, and cognitive performance. Furthermore, the classification model integrating graph-theoretical topological features and functional connectivity achieved the best performance, with an area under the curve (AUC) of 0.962 in the test set.
Conclusion: Functional network reorganization and enhanced functional-structural coupling may reflect early synaptic and dendritic damage in persons with ANI, serving as potential early warning signals for HAND progression. These findings provide sensitive biomarkers and valuable perspectives for early diagnosis and intervention.
Keywords: HIV-associated neurocognitive disorders, symptomatic neurocognitive impairment, functional connectivity network, structural connectivity network, functional-structural coupling
Introduction
Although combined antiretroviral therapy (cART) has made significant strides in suppressing HIV replication, effectively normalizing life expectancy for people living with HIV (PLWH) to levels comparable with the general population, a complete cure for HIV remains elusive.1,2 HIV-associated neurocognitive disorders (HAND) are among the most prevalent neurological sequelae, affecting an estimated 18% to 47% of PLWH. These disorders are primarily characterized by deficits in attention, working memory, information processing speed, and fine motor skills.3,4 Such impairments continue to undermine the quality of life of individuals with HIV, impairing their ability to adhere to medication regimens, manage finances, operate vehicles, and maintain employment, thereby placing a considerable strain on both families and society.5,6
HAND is classified into three stages based on the severity of cognitive impairment: asymptomatic neurocognitive impairment (ANI), mild neurocognitive disorder (MND), and HIV-associated dementia (HAD).7 With the advent of cART and its efficacy in viral suppression, the incidence of HAD has markedly decreased, and HAND now predominantly manifests as milder forms of cognitive dysfunction, particularly ANI.8 Notably, ANI has been shown to be a potentially progressive condition, with persons with ANI exhibiting a 2- to 6-fold increased risk of progressing to symptomatic neurocognitive impairment compared to neuropsychologically normal (NP-N) individuals.9,10 As an early stage of HAND, ANI is often reversible.11 Therefore, the accurate identification of ANI and the implementation of early interventions are crucial for delaying or even halting the progression of HAND.
The current diagnostic criteria for HAND predominantly rely on neuropsychological (NP) testing. However, these assessments are often time-intensive and hindered by subjectivity and environmental limitations, posing challenges for the early and accurate identification of HAND in clinical settings.12 Thus, there is an urgent need to identify sensitive, reliable, and easily deployable imaging biomarkers to facilitate early diagnosis and intervention. In recent years, multimodal MRI techniques and graph theory-based network analysis have emerged as pivotal tools for investigating the neuropathological mechanisms underlying HAND. The human brain is conceptualized as a complex, large-scale network, where specific connectivity patterns enable local information processing and global integration.13 Structural connectivity networks represent the anatomical links between brain regions, while functional connectivity networks capture dynamic interactions. Together, these networks exhibit small-world properties that optimize information processing efficiency.14,15 Structural connectivity forms the physical substrate for functional connectivity, which, through neuroplastic mechanisms, reciprocally influences structural connectivity. The dynamic coupling between these networks is critical for maintaining optimal brain function.16–18 Previous multimodal MRI studies have revealed persistent deficits in the structure, function, and connectivity of the brains of HIV-infected individuals.19–23 However, the precise patterns of functional and structural network alterations during the early ANI phase of HAND remain poorly characterized, particularly regarding the functional-structural coupling across different network levels. Additionally, significant inconsistencies in existing research findings hinder a comprehensive understanding of the early neuropathological mechanisms of HAND.24–27
To deepen our understanding of the neuropathological characteristics underlying early HAND and to provide sensitive, objective imaging markers for its early diagnosis and intervention, this study integrates multimodal MRI data with large-scale brain network analysis to systematically examine functional and structural network alterations in persons with ANI. Using Resting-state functional MRI (rs-fMRI) and diffusion tensor imaging (DTI) data from a unified cohort, functional connectivity networks (FCN) and structural connectivity networks (SCN) were constructed. Through graph-theoretical analysis, this study addresses four key objectives: (1) systematically characterize the topological properties of FCN and SCN in persons with ANI to identify potential convergent or divergent disruptions; (2) investigate alterations in functional-structural coupling at both whole-brain and subnetwork levels to uncover patterns of coupling dysregulation; (3) employ network-based statistical approaches to pinpoint abnormal regions of functional or structural connectivity in persons with ANI; and (4) evaluate the associations between network topological changes and clinical variables, including immune status, infection duration, and cognitive performance.
Materials and Methods
Participants
This study was approved by the Medical Ethics Committee of Beijing YouAn Hospital, Capital Medical University, and conducted in compliance with the Declaration of Helsinki (Ethics approval number: LL-2020-047-K). Written informed consent was obtained from all participants. Between November 2020 and April 2024, 47 individuals with HIV in the ANI phase and 48 age-, gender-, and education-matched healthy controls (HC) were recruited from the outpatient clinic of the Infectious Disease Center at Beijing YouAn Hospital. The HC group was confirmed to be free of HAND through NP testing, as per Gisslén criteria.28 Inclusion criteria for HIV patients included: (1) Asian ethnicity (Han Chinese); (2) age between 20 and 60 years; and (3) right-handedness. Exclusion criteria encompassed: (1) central nervous system (CNS) tumors, infections, cerebrovascular diseases, or other systemic conditions; (2) history of neurological or psychiatric disorders, such as anxiety or depression; (3) history of alcohol or substance abuse; and (4) contraindications to MRI. Demographic and clinical data were retrieved from electronic health records (EHR), including age, gender, education level, duration of HIV diagnosis, duration of cART treatment, lowest CD4+ cell count post-HIV infection, plasma CD4+ cell count within two weeks of NP assessment, CD4+/CD8+ ratio, and current plasma viral load.
Neuropsychological Test
According to the Gisslén criteria, the assessment must encompass at least five cognitive domains, with ANI defined as performance falling more than 1.5 standard deviations below the age- and education-adjusted normative mean in at least two domains.28 In this study, five cognitive domains were evaluated in people living with HIV (PLWH) using a comprehensive battery of neurocognitive tests standardized for age, gender, education level, and residential area size.29 The assessed domains included: (1) speed of information processing [Trail-Making Test Part A (TMT A)]; (2) memory, including learning and recall [Hopkins Verbal Learning Test-Revised (HVLT-R) and Brief Visuospatial Memory Test-Revised (BVMT-R)]; (3) attention and working memory [Continuous Performance Test-Identical Pairs (CPT-IP), Wechsler Memory Scale-III (WMS-III), and Paced Auditory Serial Addition Test (PASAT)]; (4) fine motor skills [Grooved Pegboard Test]; and (5) verbal and language skills [Animal Naming Test].
Data Acquisition
Structural, functional, and DTI data were acquired for all participants using a Siemens 3.0 T magnetic resonance imaging (MRI) scanner (Siemens Trio Tim B17 software, Germany) equipped with a 32-channel dedicated head coil. To minimize motion artifacts, headrests and neck supports were adjusted to ensure participants were comfortably positioned supine on the examination table, with their heads secured using latex pads. Prior to scanning, researchers communicated with participants to promote a relaxed state. Participants were instructed to close their eyes while remaining awake and wore earplugs or headphones to mitigate scanner noise. T1-weighted structural imaging was performed using a magnetization-prepared rapid gradient echo sequence (MP-RAGE) with the following scanning parameters: repetition time (TR) = 1900 ms, echo time (TE) = 2.52 ms, inversion time (TI) = 900 ms, acquisition matrix = 256 x 246, field of view (FOV) = 250×250 mm², flip angle = 9°, voxel size = 1×0.9766 x 0.9766 mm³, and acquisition time of 4 minutes and 18 seconds. Rs-fMRI was performed using a gradient echo single-shot echo planar imaging sequence (GE-EPI) with the following scanning parameters: TR = 2000 ms, TE = 30 ms, acquisition matrix = 64 x 64, voxel size = 3.5×3.5 x 4.2 mm³, flip angle = 90°, 35 slices, 240 time points, with an acquisition time of 8 minutes and 6 seconds. DTI was performed using a spin-echo planar imaging sequence (SE-EPI) with the following scanning parameters: TR = 9200 ms, TE = 85 ms, slice thickness = 2 mm, no gap, 65 slices, matrix size = 112 x 112, FOV = 224×224 mm², number of excitations = 1, spatial resolution = 2.0 x 2.0×2.0 mm³, total acquisition time = 10 minutes and 27 seconds, and phase encoding direction = anterior-posterior (AP). Diffusion-sensitized gradients were applied along 64 non-collinear directions, with b-values of 1000 s/mm² and 0 s/mm².
Brain Network Construction
Anatomical Parcellation
Functional connectivity MRI studies have demonstrated that the cerebellum forms extensive projections to multiple brain networks and limbic regions via the cortico-ponto-cerebellar and cerebello-thalamo-cortical circuits. These connections are implicated in disruptions of executive function, spatial cognition, language processing, and alterations in personality and emotional regulation.30,31 Structural MRI further corroborates that HIV infection induces significant atrophy in the cerebellar cortex.32 To delineate the nodes of whole-brain functional and structural connectivity networks in this study, we employed the AAL116 brain atlas.33 This atlas segments the entire brain, including the cerebellum, into 116 anatomically defined regions of interest (ROIs), encompassing 90 regions within cortical and subcortical structures and 26 within the cerebellum. A comprehensive list of anatomical labels for the ROIs is provided in the supplementary materials (Table S1).
Functional Connectivity Network Construction
The rs-fMRI data were preprocessed, and functional connectivity matrices were constructed using RESTplus 1.25 software,34 implemented on the Matlab 2022b platform (MathWorks, Natick, MA, USA) and based on Statistical Parametric Mapping (SPM 12, https://www.fil.ion.ucl.ac.uk/spm/). The preprocessing workflow comprised the following steps: (1) converting raw MRI data into Neuroimaging Informatics Technology Initiative (NIFTI) format for subsequent analyses; (2) discarding the initial 10 volumes from the 240 time points to correct for temporal shifts within volumes and geometric displacements between volumes; (3) performing slice-timing correction; (4) correcting head motion, with exclusion criteria ensuring no participant’s displacement exceeded 3 mm or angular rotation surpassed 3° in any direction; (5) spatial normalization using the DARTEL algorithm, employing an extended exponential Lie algebra deformation model,35 followed by resampling to a voxel size of 3 × 3×3 mm³; (6) removing linear trends from the time series; (7) regressing out confounding variables, including the Friston-24 head motion parameters, global brain signal, white matter signal, and cerebrospinal fluid signal;36 and (8) applying a bandpass filter with a frequency range of 0.01–0.08 hz. To compute functional connectivity for each participant, the 116 regions of interest (ROIs) defined by the AAL116 atlas were treated as network nodes. The Pearson correlation coefficient was calculated between the time series of each pair of nodes to construct the functional connectivity correlation matrix (r matrix). Due to uncertainties surrounding the biological significance of negative correlations,37 the analysis was confined to positive correlations, with negative correlation coefficients set to zero. Each participant’s functional connectivity was then represented as an undirected weighted network. Furthermore, Fisher’s Z transformation was applied to the r matrix, generating a z matrix to improve the normality of the data distribution.
Structural Connectivity Network Construction
The DTI data were initially converted from DICOM to NIFTI format using MRIcroGL software, followed by the construction of a whole-brain fiber number (FN) connectivity matrix using DSI Studio software (https://dsi-studio.labsolver.org/). The detailed workflow included the following steps: (1) Image Preparation: NIFTI format images were loaded to create SRC files. An automated quality control program was employed to verify the accuracy of the b-table, ensuring correct diffusion directions and b-values. A white matter region mask was applied to enhance reconstruction quality; (2) Preprocessing: Head motion and eddy current distortions were corrected, and image reconstruction was performed using the generalized q-sampling imaging (GQI) method. The reconstructed images were registered to the ICBM152 standard space, producing FIB files; (3) Fiber Tracking: FIB files were loaded into the software for fiber tracking, using a deterministic fiber tracking algorithm. Fiber pathways shorter than 20 mm or longer than 200 mm were excluded, with a termination threshold set at 1 million fibers; (4) Brain Parcellation and Network Construction: Brain parcellation was conducted using automated anatomical labeling (AAL) software, dividing the brain into 116 regions of interest (ROIs), consistent with those used for the rs-fMRI analysis. The number of fiber bundles connecting each pair of ROIs was calculated to construct an undirected, unweighted FN matrix, representing the whole-brain structural connectivity network.
Network Analysis
Graph theory analysis was conducted for both the HC and ANI groups using the Brain Connectivity Toolbox, GRETNA (https://www.nitrc.org/projects/gretna/).38 Initially, the r matrix and FN matrix were each converted into binary undirected 116×116 network matrices through sparsity thresholding and element-value thresholding. Following this, the global and nodal network properties of the FCN and SCN were computed.
Global Topologic Parameters
The global attributes analyzed in this study focus on key metrics of the FCN and SCN, including small-world properties, global efficiency, and modularity. Small-world properties encompass clustering coefficient (Cp), characteristic path length (Lp), normalized clustering coefficient (γ), normalized characteristic path length (λ), and the small-worldness index (σ).39
Specifically, γ represents the ratio of the network’ s clustering coefficient to that of a random network, λ represents the ratio of the network’ s characteristic path length to that of a random network, and σ is calculated as the ratio of γ to λ (σ = γ/λ). To ensure that the FCN of all participants met the small-world property criterion (σ > 1.1), 1000 random networks were generated using the Markov-chain algorithm.40 The function [a, b, c] = gretna_get_rmax (rand(116)) was employed to calculate the lower limit of the sparsity threshold, with a step size of 0.01. The upper limit of sparsity was determined under the condition of σ > 1.1, thereby integrating absolute connectivity strength thresholds with relative sparsity thresholds.41 Global efficiency metrics included global efficiency (Eg) and local efficiency (Eloc).42 Eg evaluates the overall capacity of the network for parallel information transmission, while Eloc quantifies local information transmission efficiency, reflecting the network’ s resilience to external perturbations. Modularity was employed to segment the whole-brain network into multiple subnetworks, wherein nodes within each module exhibited higher connectivity density, while inter-modular connections were relatively sparse.43 Given that both FCN and SCN were analyzed, the whole-brain network was partitioned into seven anatomically defined subnetworks: frontal lobe, prefrontal lobe, subcortical structures, parietal lobe, temporal lobe, occipital lobe, and cerebellar network.44,45
Regional Nodal Characteristics
This study evaluated six nodal metrics: degree centrality (Dc), betweenness centrality (Bc), nodal clustering coefficient (NCp), nodal efficiency (Ne), nodal local efficiency (NLe), and nodal shortest path length (NLp). These metrics provide detailed insights into the roles and characteristics of individual nodes within the network: (1) Dc: Represents the number of connections a node has with other nodes, serving as a measure of the node’s direct influence within the network; (2) Bc: Quantifies the frequency with which a node acts as an intermediary in the shortest paths between other nodes, highlighting its role as a critical mediator within the network; (3) NCp: Assesses the extent of interconnectivity among a node’s neighbors, reflecting the local clustering tendency of the network. It is calculated as the ratio of the actual number of connections to the maximum possible connections among a node’s neighbors; (4) Ne: Measures the efficiency of information transfer from a node to all other nodes, typically computed as the inverse of the shortest path length between the node and others; (5) NLe: Evaluates the efficiency of communication that can be maintained among neighboring nodes when a node fails, offering insight into the network’s local fault tolerance; (6) NLp: Reflects the average shortest path length from a node to all other nodes, providing an indicator of the node’s average distance within the network.39,46–48
Network Connectivity Characteristics
This study utilized z-matrices and FN matrices to perform localization analyses of connectivity changes between brain regions in the FCN and SCN using the Network-Based Statistic (NBS) method. The NBS method offers robust control of the familywise error rate through large-scale univariate testing. Its underlying principle aligns with traditional cluster-based thresholding methods in statistical parametric mapping.49
Coupling Between Functional and Structural Connectivities
The coupling between functional connectivity (FC) and structural connectivity (SC) was examined for each participant, focusing on both the whole-brain connectivity level and the modular level: (1) Whole-Brain Connectivity Level: Coupling between FC (quantified as the Fisher’s Z-transformed Pearson correlation coefficient) and SC was assessed by calculating the correlation between the FC and SC matrices. The correlation between functional and structural connectivity is constrained by the presence of non-zero structural connections.50 Non-zero structural connections were first extracted to form a structural connectivity vector, which was resampled to approximate a Gaussian distribution with a mean of 0.5 and a standard deviation of 0.1.16 The corresponding functional connectivity vector was then extracted, and the Pearson correlation coefficient between the two vectors was calculated; (2) Modular-Level Coupling: Analysis was focused on differential modules identified in the functional and structural modularity analyses. For each differential module, non-zero structural connections within and between the modules were extracted to create the structural connectivity vector, while the corresponding functional connectivity vector was also generated. Using the same approach as for the whole-brain connectivity level, the Pearson correlation coefficient between these vectors was computed to determine the coupling value of the differential modules.
Statistical Analysis
Statistical analyses of clinical demographic data and cognitive performance between the HC and ANI groups were conducted using IBM SPSS Statistics 29 (IBM Corp., Armonk, NY, USA). Categorical variables were presented as frequencies (percentages), and chi-square tests were used to evaluate inter-group differences. The normality of continuous variables was assessed using the Shapiro–Wilk test. Variables with a normal distribution were expressed as means ± standard deviations ( ± s), while non-normally distributed variables were presented as medians (interquartile ranges) [M (IQR)]. Inter-group comparisons were performed using t-tests or Mann–Whitney U-tests, with the significance level set at P < 0.05. To assess global properties-including small-world characteristics, whole-brain efficiency, and modularity-as well as node-level attributes, two-sample t-tests were performed using GRETNA to compare inter-group differences in network metrics. Bonferroni correction for multiple comparisons (P < 0.05) was applied in modularity and node-level attribute analyses to control for false-positive rates.
For inter-group differences in functional and structural network connectivity, NBS analysis was conducted in GRETNA. Initially, two-sample t-tests were used to identify connectivity differences, with an initial threshold of P < 0.001 applied to identify supra-threshold connections.51 Subsequently, a P-value threshold of 0.05 was used in permutation tests to determine the significance of subnetworks forming clusters. A total of 5000 permutations were performed to generate an empirical null distribution based on random group assignments, enabling evaluation of the statistical significance of each observed component size.
Two-sample t-tests and visualizations of functional-structural connectivity coupling were conducted using GraphPad Prism 10.1.2 (https://www.graphpad-prism.cn/), with the significance level set at P < 0.05.
Additionally, to explore the relationships between network topology changes in persons with ANI and clinical variables or cognitive performance, correlation heatmaps were generated using the corrplot package in RStudio (https://posit.co/products/open-source/rstudio/). Heatmaps displayed Pearson correlation coefficients between variables, with color intensity reflecting the strength of correlations. During correlation analysis, False Discovery Rate (FDR) correction was applied to control for multiple comparisons, with the significance level set at P < 0.05.
To further validate the inter-group differences in graph-theoretical metrics and connectivity features between the HC and HIV-ANI groups, and to preliminarily explore their potential diagnostic value, this study employed the Elastic Net feature selection method in combination with the LASSO model to construct and analyze a classification task between HC and ANI. First, a dataset containing the graph-theoretical metrics and connectivity features that differed between the two groups was loaded. To eliminate discrepancies in feature scales, all features were standardized using Z-score normalization before feature selection and model construction. The dataset was then randomly split into training and validation sets using a stratified sampling approach with a 7:3 ratio, ensuring class balance and result reproducibility. During the model training phase, grid search was utilized to optimize the Elastic Net parameters (Alpha and Lambda), and five-fold cross-validation was conducted to select the optimal feature subset based on Youden’s index. The LASSO model was then trained using the selected optimal feature subset and evaluated on the test set. The model’s performance was assessed using evaluation metrics including accuracy, sensitivity, specificity, precision, and area under the curve (AUC). Additionally, Shapley Additive Explanations (SHAP) values were computed to quantify the contribution of each feature to the classification predictions, and a feature importance plot was generated to visually present the key contributing features.
Results
Demographic Data and Cognitive Performance
No significant differences were detected between the HC group and the ANI group with respect to age, gender, or educational level (all P > 0.05). As expected, persons with ANI demonstrated significantly poorer performance across all evaluated cognitive domains, including information processing speed, memory (learning and recall), attention/working memory, fine motor skills, and verbal and language abilities (all P < 0.05). Comprehensive demographic data and cognitive performance metrics for the 95 participants are summarized in Table S2.
Disrupted Functional Connectivity Network
Both the HC and ANI groups demonstrated small-world characteristics in the functional network, with σ > 1.1, and the sparsity upper limit set to 0.5. Statistical analysis revealed that compared to HC, persons with ANI exhibited significantly increased σ (P = 0.032) and global efficiency (Eg, P = 0.005), while clustering coefficient (Cp, P = 0.004), characteristic path length (Lp, P = 0.007), normalized characteristic path length (λ, P = 0.009), and local efficiency (Eloc, P = 0.005) were significantly decreased. No significant difference was observed in normalized clustering coefficient (γ, P = 0.735), as shown in Figure 1 and Table S3. Modular analysis revealed significant alterations in functional connectivity at the network level. Within the occipital network, functional connectivity was significantly enhanced in persons with ANI (P < 0.001, T = −3.472, Bonferroni correction). Conversely, intermodular functional connectivity between the prefrontal and cerebellar networks was significantly reduced (P = 0.002, T = 3.145, Bonferroni correction), as depicted in Figure 2.
 |
Figure 1 Global properties of the functional connectivity network and their functional relationships across varying sparsity thresholds. The embedded bar chart illustrates the mean area under the curve (AUC) for each metric, with error bars representing the standard error of the mean across subjects. Statistical significance is denoted as follows: *P < 0.05, **P < 0.01. Abbreviations: HC, healthy control; ANI, asymptomatic neurocognitive impairment; Cp, clustering coefficient; Lp, characteristic path length; λ, normalized characteristic path length; γ, normalized clustering coefficient; σ, small-world topology; Eg, global efficiency; Eloc, local efficiency; ns, not significant. |
 |
Figure 2 Changes in intra- and inter-module functional connectivity associated with ANI (P < 0.05, Bonferroni corrected). Thick lines represent significant T-values from between-group comparisons, with red indicating HC>ANI and purple indicating HC<ANI. |
At the node level, persons with ANI displayed significant alterations in network properties compared to the HC group. Specifically, Dc was markedly reduced in the left inferior frontal gyrus (orbital part) (P < 0.001, Bonferroni correction). Conversely, Dc was significantly elevated in the right calcarine fissure and surrounding cortex, left superior occipital gyrus, left paracentral lobule, and right paracentral lobule (all P < 0.001, Bonferroni correction). The NCp was notably diminished in the left olfactory cortex, left lenticular nucleus (pallidum), and right lenticular nucleus (pallidum) (all P < 0.001, Bonferroni correction). Ne was significantly reduced in the left and right calcarine fissures and surrounding cortices, left and right lingual gyri, left superior, middle, and inferior occipital gyri, left and right precuneus, left and right paracentral lobules, and left cerebellum lobule VI (all P < 0.001, Bonferroni correction). Additionally, NLe was significantly reduced in the left caudate nucleus (P < 0.001, Bonferroni correction). NLp was significantly reduced in the left and right lingual gyri and left cerebellum lobule VI (all P < 0.001, Bonferroni correction). No significant differences were observed in Bc between the two groups, as illustrated in Figure 3 and detailed in Table S4.
 |
Figure 3 Significant alterations in node properties of the functional connectivity network in persons with ANI compared to HC, mapped using the AAL_116 atlas (P < 0.05, Bonferroni correction). Red nodes represent HC > ANI, while Klein blue nodes indicate HC < ANI. Abbreviations: Dc, degree centrality; NCp, nodal clustering coefficient; NLe, nodal efficiency; Ne, nodal efficiency; NLp, nodal shortest path length; ORBinf.L, left orbitofrontal inferior gyrus; CAL.R, right periaqueductal fissure cortex; SOG.L, left supraoccipital gyrus; PCL.L, left paracentral lobule; PCL.R, right paracentral lobule; OLF.L, left olfactory cortex; PAL.L, left pallidum; PAL.R, right pallidum; CAL.L, left periaqueductal cortex; CAL.R, right periaqueductal cortex; LING.L, left lingual gyrus; LING.R, right lingual gyrus; SOG.L, left supraoccipital gyrus; MOG.L, left middle occipital gyrus; IOG.L, left inferior occipital gyrus; PCUN.L, left precuneus; PCUN.R, right precuneus; CRBL6.L, left cerebellar lobe VI; CAU.L, left caudate nucleus. |
Stable Structural Connectivity Metrics
Interestingly, no significant differences in structural topology were detected between the two groups across global metrics, including Cp, Lp, γ, λ, σ, Eg, and Eloc (all P > 0.05) (Figure S1 and Table S5). Similarly, modularity analysis revealed no significant differences in structural connectivity either within or between the seven subnetworks (all P > 0.05, Bonferroni correction). At the node level, persons with ANI exhibited no significant alterations in Dc, Bc, NCp, Ne, NLe, or NLp (all P > 0.05, Bonferroni correction).
Connectivity-Based Analysis
Analysis of the FCN differences between persons with ANI and HC revealed marked alterations in two subnetworks, encompassing significant increases and decreases in connectivity (all P < 0.05, NBS correction). The subnetworks exhibiting increased functional connectivity comprised 30 nodes and 39 edges, encompassing regions such as the bilateral precentral gyrus, olfactory cortex, and lingual gyrus; the right gyrus rectus and superior occipital gyrus; the bilateral fusiform gyrus, postcentral gyrus, and precuneus; the left superior parietal gyrus; the bilateral paracentral lobule and caudate nucleus; the left lenticular nucleus (putamen); the right thalamus; the left inferior temporal gyrus; and cerebellar regions including the right cerebellum crus II, right cerebellum III, bilateral cerebellum IV–V, left cerebellum VIIb, left cerebellum VIII, and vermis IX. Collectively, these regions were predominantly associated with the executive control network (eg, bilateral precentral gyrus, postcentral gyrus, left superior parietal gyrus, bilateral caudate nucleus, right thalamus, left lenticular nucleus [putamen], right cerebellum crus II, right cerebellum III, bilateral cerebellum IV–V, left cerebellum VIIb, left cerebellum VIII, and vermis IX) and the visual network (eg, bilateral lingual gyrus, right superior occipital gyrus, bilateral fusiform gyrus, and bilateral precuneus). In contrast, the subnetworks showing decreased functional connectivity included 19 nodes and 24 edges, involving regions such as the left superior frontal gyrus (orbital part), left anterior cingulate and paracingulate gyri, right parahippocampal gyrus, bilateral caudate nucleus, bilateral lenticular nucleus (putamen), right lenticular nucleus (pallidum), left cerebellum crus I, bilateral cerebellum crus II, right cerebellum III, left cerebellum IV–V, left cerebellum VIIb, bilateral cerebellum VIII, left cerebellum IX, vermis VIII, and vermis IX. These regions were primarily associated with the default mode network (DMN; eg, left superior frontal gyrus [orbital part], left anterior cingulate and paracingulate gyri, and right parahippocampal gyrus) and the executive control network (eg, bilateral caudate nucleus, bilateral lenticular nucleus [putamen], right lenticular nucleus [pallidum], and cerebellum). Furthermore, structural connectivity analysis revealed no significant differences between the two groups (P > 0.05, NBS correction), as illustrated in Figure 4.
 |
Figure 4 Functional network connectivity analysis between HC and ANI. Red lines represent negative T-scores, indicating reduced subnetwork connectivity in the ANI group, while green lines denote positive T-scores, reflecting enhanced subnetwork connectivity in ANI. (P < 0.05, NBS correction). |
Disrupted Functional Connectivity and Structural Connectivity Network Coupling
At the whole-brain connectivity level, no significant differences were observed in the correlation coefficients between the HC and ANI groups (P = 0.083). However, at the modular level, persons with ANI exhibited significantly enhanced functional-structural coupling within the prefrontal and occipital networks (P = 0.022 and P = 0.018, respectively). In contrast, no significant differences were detected between the two groups in the cerebellar network (P = 0.458). Refer to Figure S2 for details.
Network Metrics in Relation to Clinical Variables and Cognitive Performance
In the correlation analysis between network topological changes and clinical variables, the following significant results were identified at the node level after FDR correction: In persons with ANI, the Dc of the left superior occipital gyrus exhibited a significant negative correlation with the duration of infection (r = −0.289, P = 0.049). Ne of the left and right calcarine fissures and surrounding cortex, left and right lingual gyri, and left superior occipital gyrus showed significant negative correlations with both the duration of infection and treatment (r = −0.412, P = 0.004; r = −0.309, P = 0.035; r = −0.401, P = 0.005; r = −0.399, P = 0.005; r = −0.329, P = 0.024; r = −0.384, P = 0.008; r = −0.297, P = 0.043; r = −0.376, P = 0.009; r = −0.402, P = 0.005; r = −0.306, P = 0.036). Additionally, the NLp of the left and right lingual gyri was significantly positively correlated with both the duration of infection and treatment (r = 0.393, P = 0.006; r = 0.389, P = 0.007; r = 0.372, P = 0.01; r = 0.394, P = 0.006). Ne of the left cerebellum lobule VI was significantly positively correlated with CD4+ cell counts and their nadir values (r = 0.318, P = 0.029; r = 0.307, P = 0.036), while NLp of the same region demonstrated significant negative correlations with CD4+ cell counts and their nadir values (r = −0.321, P = 0.028; r = −0.293, P = 0.045). No significant correlations were observed between network metrics and clinical variables at the levels of small-world properties, global efficiency, or modular coupling. See Figure 5a for detailed visualizations.
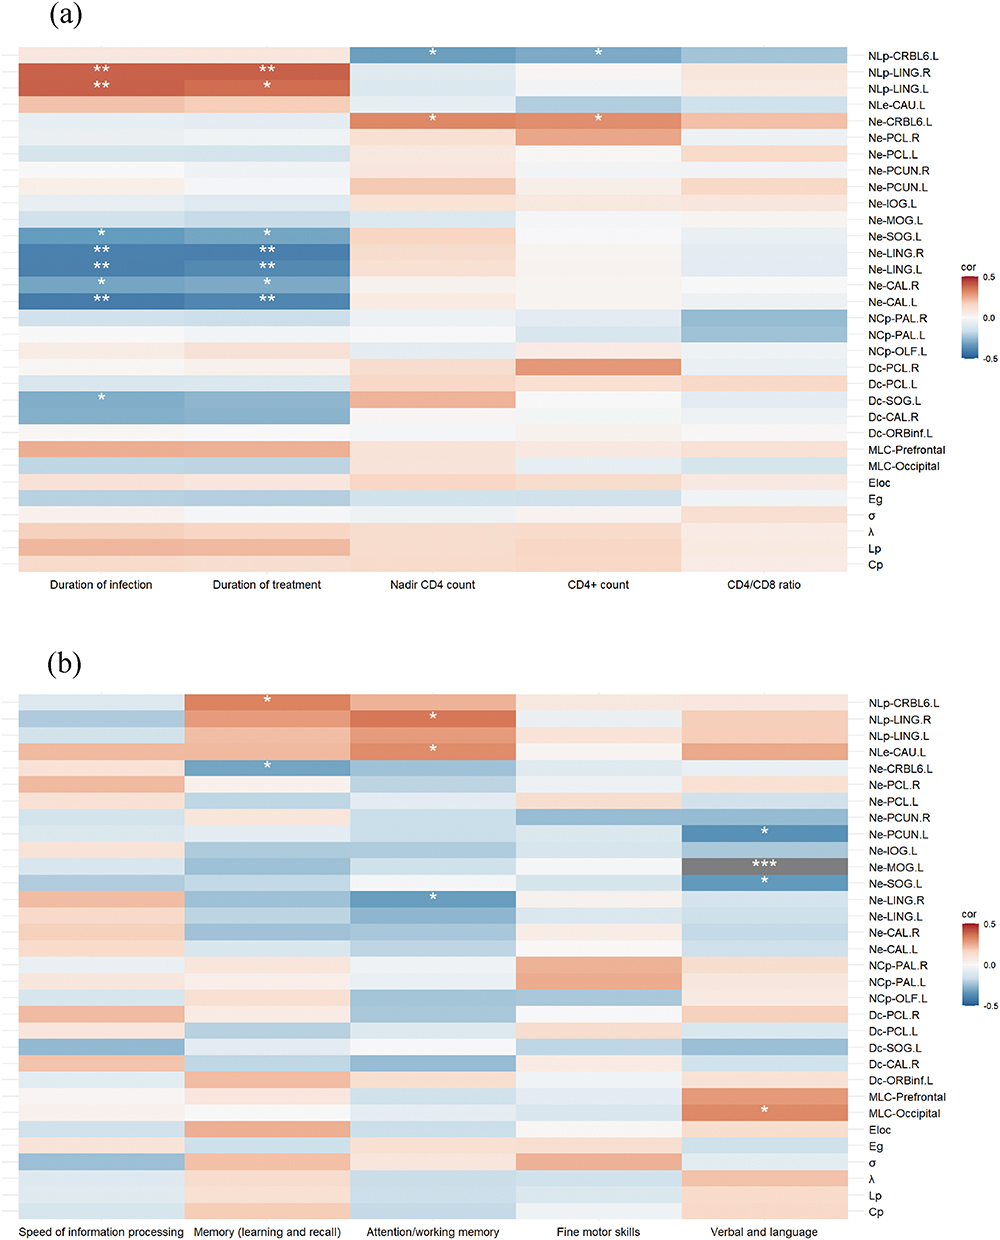 |
Figure 5 (a) Heatmap illustrating the correlation between changes in network topology and clinical variables. (b) Heatmap depicting the correlation between changes in network topology and cognitive performance. Statistical significance is denoted as follows: * 0.01 < P ≤ 0.05, ** 0.001 < P ≤ 0.01, *** P ≤ 0.001. Abbreviation: MLC, modular-level coupling. |
In the correlation analysis between network topological changes and cognitive performance, the following significant node-level results were identified after FDR correction: The Ne of the left cerebellum lobule VI was significantly negatively correlated with memory (learning and recall) (r = −0.309, P = 0.035), whereas the NLp of the same region was significantly positively correlated with it (r = 0.331, P = 0.023). The Ne of the right lingual gyrus exhibited a significant negative correlation with attention/working memory (r = −0.323, P = 0.027), while NLp was significantly positively correlated with this cognitive domain (r = 0.352, P = 0.015). Furthermore, the NLe of the left caudate nucleus demonstrated a significant positive correlation with attention/working memory (r = 0.312, P = 0.033). The Ne of the left superior occipital gyrus, left middle occipital gyrus, and left precuneus showed significant negative correlations with verbal and language abilities (r = −0.334, P = 0.022; r = −0.507, P < 0.001; r = −0.361, P = 0.013). At the modular level, functional-structural coupling within the occipital network was significantly positively correlated with verbal and language abilities (r = 0.32, P = 0.028). No significant correlations were observed between small-world properties, global efficiency, and cognitive performance. See Figure 5b for detailed visualizations.
Machine Learning Classification Performance
Machine learning results indicate that, based on the Youden index, the optimal number of selected features was 29 for the integrated model combining graph-theoretical and functional connectivity features (Graph+FC), 22 for the functional connectivity (FC) model, and 14 for the graph-theoretical (Graph) model. The LASSO model was constructed using the selected features and evaluated on the test set. The results showed that the graph-theoretical model achieved an AUC of 0.939, the functional connectivity model achieved an AUC of 0.847, and the integrated model (Graph+FC) achieved the highest classification performance with an AUC of 0.962 (Figure 6 and Table S6). Elastic Net regularization effectively selected the most discriminative features, reducing data dimensionality while improving classification performance. These findings further highlight that integrating functional connectivity and graph-theoretical features can enhance ANI classification accuracy.
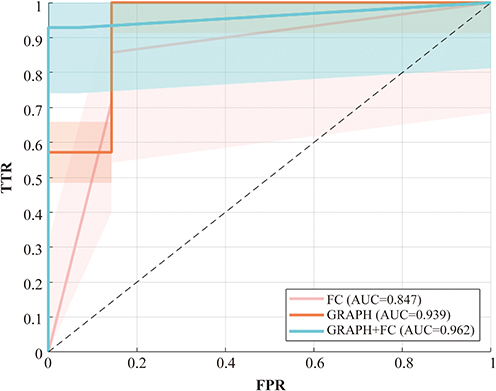 |
Figure 6 Receiver Operating Characteristic (ROC) Curves of Different Classification Models in the Training Cohort. The ROC curves illustrate the classification performance of three different models: the functional connectivity-based model (FC, red), the graph-theoretical model (GRAPH, Orange), and the combined model integrating both features (GRAPH+FC, cyan). Based on the area under the curve (AUC), the GRAPH+FC model (AUC = 0.962) achieved the highest classification accuracy, outperforming both the FC model (AUC = 0.847) and the graph-theoretical model (AUC = 0.939). The shaded regions in the figure represent the confidence intervals for each model. Abbreviations: FPR, false positive rate; TPR, true positive rate. |
Key Feature Importance Analysis
SHAP interpretability analysis revealed the impact of key features on classification decisions, providing essential insights into model transparency. Specifically, in the graph-theoretical model (Figure 7a), the Ne of left cerebellum VI contributed the most to model predictions. Additionally, the Cp and the Ne of the right precuneus also played significant roles in the classification task. In the functional connectivity model (Figure 7b), the functional connection between the right paracentral lobule and the left cerebellum VIII exhibited the highest classification importance. Moreover, the functional connections between the right olfactory cortex and the left paracentral lobule, as well as between the left fusiform gyrus and the right precuneus, also significantly contributed to classification predictions. In the combined model integrating graph-theoretical and functional connectivity features (Figure 7c), the Ne of left cerebellum VI remained the most important classification feature. Additionally, the functional connection between the right cerebellum III and the right postcentral gyrus, as well as the connection between the lenticular nucleus (putamen), and vermis VIII, also played crucial roles in model predictions. The remaining feature information is shown in Figure 7.
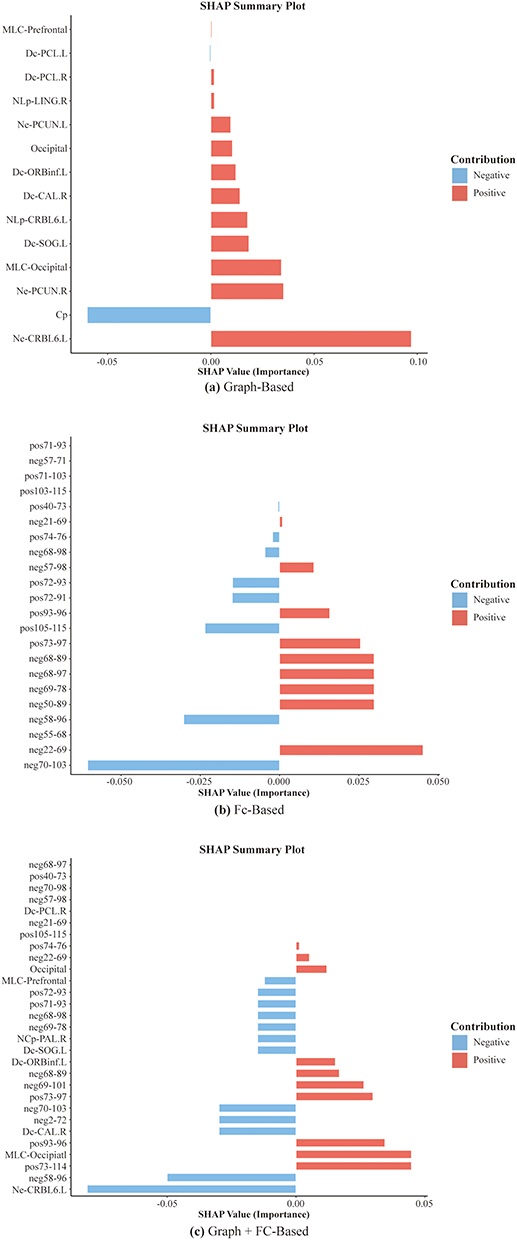 |
Figure 7 The SHAP feature importance results illustrate the key features contributing to classification predictions in (a) the graph-theoretical model, (b) the functional connectivity model, and (c) the combined model integrating both graph-theoretical and functional connectivity features. A positive SHAP value indicates an increased probability of ANI classification, whereas a negative SHAP value suggests a higher likelihood of being classified as a HC. |
Discussion
This study, employing a large-scale brain network perspective, concentrates on the early stage of HAND, specifically the ANI phase, to elucidate the characteristics of functional and structural networks and their alterations in functional-structural coupling. The findings demonstrate that while the structural network in persons with ANI remains relatively stable, the functional network exhibits profound reorganization across multiple domains, including the visual network, executive control network, and default mode network. These observations suggest that synaptic and dendritic impairments at the microscopic level may initially manifest within the functional network during the ANI phase, serving as an “early warning signal” in the progression of HAND. Moreover, functional-structural coupling is significantly heightened in the occipital and prefrontal networks, underscoring their pivotal role in early neural injury and highlighting these regions as potential targets for intervention during the ANI phase. From a clinical perspective, future strategies could investigate the application of non-invasive techniques, such as transcranial magnetic stimulation (TMS) and cognitive training, to enhance the local efficiency of functional networks. Simultaneously, the integration of these approaches with immunomodulatory therapies or neuroprotective interventions may optimize inter-modular connectivity, alleviate network burden, and mitigate the progression of HAND. Additionally, the topological properties and coupling dynamics of the functional network are closely linked to the patients’ immune status and cognitive performance, providing critical evidence for stratified management guided by immunological and imaging biomarkers. Meanwhile, functional connectivity and topological features provide complementary information from different dimensions, effectively enhancing classification performance. This further validates the potential value of multimodal neuroimaging features in the early stage of HAND. Consequently, the functional network alterations and coupling characteristics identified in this study furnish a robust scientific basis for the early diagnosis and personalized treatment of HAND, underscoring their substantial clinical relevance.
Stability of Structural Networks in the Early Stage of HAND
Evidence suggests that both global and local properties of the structural network in persons with ANI remain stable, indicating that anatomical connectivity in the early stage of HAND has not yet undergone significant damage. This observation aligns with the pathological characteristics of the ANI stage, including reduced synaptic density and dendritic simplification.52 Synaptic and dendritic damage in mild HAND (encompassing ANI and MND) primarily results from inflammatory responses, oxidative stress, and direct HIV-mediated neuronal damage.53,54 These pathological processes lead to imbalances in neurotransmitter release, such as glutamate accumulation and insufficient dopamine secretion.55–57 While glutamate excitotoxicity induces abnormal synaptic firing, thereby impairing neural activity,10,12 dysfunction of the dopamine system disrupts the connectivity of the fronto-striatal circuit.56,58,59 In this context, the observed reorganization of the functional network may represent an early compensatory response to synaptic and dendritic damage.60 Furthermore, the brain may mitigate structural network disruption by enhancing the efficiency of remaining connections. This compensatory mechanism has also been documented in other neurodegenerative diseases, including Alzheimer’s disease and Parkinson’s disease.61,62 However, this capacity for compensation is inherently limited. With disease progression, microscopic damage accumulates, ultimately resulting in the breakdown of macroscopic structural networks. At the HAD stage, pathological hallmarks include significant neuronal loss in cortical and subcortical regions,63–66 accompanied by gray matter atrophy and compromised white matter integrity.
Microscopic synaptic and dendritic damage during the ANI phase may first emerge within the functional network, acting as an “early warning signal” in the incipient stages of HAND. Future investigations should explore whether the dynamic alterations in functional network properties possess the potential to enhance diagnostic precision and establish a robust scientific basis for early intervention strategies. For example, targeted identification of high-risk individuals could enable more intensive imaging surveillance or cognitive training interventions. Nevertheless, this hypothesis warrants further validation through large-scale, longitudinal studies to substantiate its implications.
Reorganization of Functional Networks
Reorganization of the Visual Network (Occipital Lobe, Precuneus, Calcarine Fissure and Surrounding Cortex, Lingual Gyrus)
The small-world architecture and modular network organization are essential for the brain’s efficient information processing.13,67,68 This study revealed that functional networks in persons with ANI exhibited a significant enhancement of small-world properties (σ↑, Eg↑, Lp↓), but reduced local clustering (Cp↓) and local efficiency (Eloc↓). This suggests that while global network efficiency is enhanced, the local network’s information processing capacity may be limited. This could be related to early adaptive compensation triggered by synaptic and dendritic damage.60 At the modular level, persons with ANI demonstrated significantly enhanced intramodular connectivity within the occipital region. Furthermore, node-level analysis revealed increased Dc in the visual network (occipital lobe, precuneus, calcarine fissure and surrounding cortex, lingual gyrus), accompanied by decreased Ne. This pattern indicates impaired information transmission efficiency in the occipital region, which may be counterbalanced by an increased number of network connections in an attempt to compensate for the damage.
Previous studies have identified the occipital lobe as one of the brain regions most susceptible to HIV Tat protein infiltration.69 Damage to this region is reflected in metabolic abnormalities,52,70 disrupted blood flow perfusion,71 structural changes (eg, posterior cortical gray matter atrophy72–74 and white matter integrity disruption75), and functional impairments (eg, altered neural dynamics76,77 and functional connectivity78–81). These disruptions often commence during the asymptomatic phase of infection and persist even with cART treatment.82 In persons with ANI, the visual network appears to enhance global efficiency through increased intramodular connectivity within the occipital region. However, the observed decline in local information processing capacity underscores the limitations of this compensatory mechanism. This adaptive reorganization is closely aligned with metabolic and structural abnormalities in the occipital region, further emphasizing its pivotal role in the pathophysiology of HAND.
Functional Reorganization of the Executive Function Related Networks (Basal Ganglia, Prefrontal Cortex, Cerebellum)
This study identified pronounced functional reorganization across multiple regions of the executive control network in persons with ANI. Within the basal ganglia, the NCp of the bilateral pallidum and the NLe of the left caudate nucleus were markedly reduced in the ANI group. Functional edge analysis revealed patterns of activation and inhibition within the basal ganglia (caudate nucleus, putamen, and pallidum), indicating that local network connectivity in this region is fragile and its information processing capacity is impaired. As a region highly susceptible to HIV infection,83–87 the basal ganglia exhibit elevated viral loads84 and significant atrophy.88,89 The caudate nucleus, in particular, is vulnerable to invasion by HIV in cerebrospinal fluid due to its proximity to the lateral ventricles.87,90 Furthermore, the striatum’s dense dopaminergic terminals are especially sensitive to HIV,83 and dopamine is integral to higher-order cognitive functions, including memory, learning, and attentional shifts.91 This study found that the NLe of the left caudate nucleus in persons with ANI was significantly positively correlated with attention and working memory, suggesting that HIV-associated depletion of dopamine in the caudate nucleus may underlie these cognitive deficits.
In the cerebellum, functional edge analysis demonstrated both activation and suppression across multiple cerebellar subdivisions in persons with ANI, indicative of an effort by the cerebellum to compensate for neural damage through modulated local functional activity. However, the observed weakening of functional connectivity between prefrontal and cerebellar modules reflects diminished global network integration, which constrains the overall efficacy of cerebellar compensatory mechanisms and reduces its support for complex cognitive tasks. Prior studies have reported robust functional connectivity between the prefrontal cortex and the left cerebellar lobule VI,92 while abnormalities in the functional connectivity of frontal, parietal, and cerebellar networks have been repeatedly documented in HAND patients.93,94 In this study, the Ne of the left cerebellar lobule VI was positively correlated with CD4+ cell counts and their nadir values, whereas NLp exhibited a significant negative correlation. Moreover, the Ne of cerebellum VI was negatively correlated with memory (learning and recall), while NLp showed a significant positive correlation, suggesting that cerebellar functional states are modulated by immune status and play a critical role in cognitive performance.
Notably, the functional alterations of the prefrontal cortex within the executive control network will be further explored in the section on “ Abnormalities in Function-Structure Coupling”. In summary, the multi-regional functional abnormalities observed in the executive network during the ANI phase exhibit characteristics of adaptive reorganization. However, the compensatory capacity is limited and fails to fully counteract the impact of weakened inter-modular connectivity and diminished local information processing. This limitation, in turn, restricts the executive network’s ability to support higher cognitive functions. The close relationship between functional network alterations and both immune status and cognitive performance underscores a potential basis for stratified management in persons with ANI. Future research with larger cohorts could integrate imaging biomarkers and immune metrics to develop effective screening strategies for high-risk individuals and assess the feasibility of stratified intervention frameworks, ultimately enabling more precise and personalized treatment approaches.
Reorganization of the DMN (Bilateral Precuneus, Left Superior Frontal Gyrus [Orbital Part], Left Anterior Cingulate and Paracingulate Gyri, and Left Inferior Frontal Gyrus [Orbital Part])
In this study, the ANI group exhibited bidirectional changes in functional connectivity across multiple subdivisions of the DMN, accompanied by alterations in the nodal topological properties of the core DMN region, the precuneus. These regions belong to the DMN, a critical network intimately involved in higher-order cognitive functions, including self-reflection, emotional regulation, and memory retrieval.95 Emerging evidence suggests that the reorganization of the DMN in HAND may represent an adaptive mechanism in response to localized neural damage. However, this reorganization could also reflect underlying impairments in the network’s integrative capacity, potentially compromising its role in cognitive and emotional processing.81,96,97
Abnormalities in Functional-Structural Coupling
Enhanced Functional-Structural Coupling in the Prefrontal Network
This study identified a marked enhancement in functional-structural coupling within the prefrontal network of persons with ANI, potentially indicative of an adaptive compensatory mechanism designed to preserve higher-order cognitive functions by augmenting functional-structural synchrony in response to neural damage. The prefrontal cortex, as previously demonstrated, serves as a pivotal hub for complex cognitive processes and is highly vulnerable to HIV-related pathology, whether through the direct effects of viral proteins or the chronic immune activation and inflammatory cascades triggered by the infection.72,98,99 Autopsy studies further underscore this vulnerability, revealing pronounced synaptic structural alterations in the prefrontal cortex of HIV-infected individuals, which are strongly associated with the onset and progression of HAND.100 Despite the observed compensatory enhancements, this study also detected weakened functional connectivity between the prefrontal and cerebellar modules. Nodal-level analyses revealed a significant reduction in Dc in the left inferior frontal gyrus (orbital part) and a notable decrease in NLp in the left cerebellar lobule VI. These findings highlight compromised global network integration. Although the prefrontal network exhibits adaptive mechanisms through increased coupling and improved cerebellar connectivity, its compensatory capacity proves insufficient to fully maintain the stability and integration of overall network functions.
Enhanced Functional-Structural Coupling in the Occipital Network
Persons with ANI demonstrated significantly enhanced functional-structural coupling in the occipital network, potentially reflecting an adaptive response to early neural injury aimed at preserving functional stability through strengthened functional-structural synchrony. Nevertheless, disruptions in visual and spatial processing appear to influence language performance, as evidenced by the negative correlation between nodal efficiency in the left superior occipital gyrus, middle occipital gyrus, and precuneus and the verbal and language cognitive domain. In contrast, functional-structural coupling within the occipital network was positively correlated with verbal and language performance. The Ne of the right lingual gyrus exhibited a significant negative correlation with attention/working memory, whereas its NLp showed a positive correlation. This pattern suggests that the lingual gyrus may employ atypical compensatory mechanisms to sustain complex cognitive tasks. Furthermore, the Ne and NLp of the bilateral pericalcarine cortex, bilateral lingual gyrus, and left superior occipital gyrus within the occipital network were associated with the duration of infection and treatment, indicating that the occipital network’s functionality is modulated by these factors.
Alterations in functional-structural coupling observed during the ANI phase align with findings in other neurodegenerative diseases, including Alzheimer’s disease, Parkinson’s disease, and Autism Spectrum Disorder, underscoring the early compensatory adaptations to neural damage.61,101 However, this compensatory capacity is inherently limited, as concurrent impairments in inter-modular connectivity diminish global network integration and restrict support for complex cognitive tasks. This study highlights enhanced functional-structural coupling in the occipital and prefrontal networks, identifying these regions as potential targets for early interventions in HAND. Future clinical strategies could explore the integration of TMS, cognitive training, or pharmacological treatments to optimize functional-structural coupling, reduce network burden, and decelerate disease progression.
Machine Learning Evaluation of Neuroimaging Features in the ANI Phase
The machine learning model integrating graph-theoretical and functional connectivity features demonstrated outstanding classification performance, confirming the critical role of these neuroimaging features in identifying HIV-ANI. FC, as a high-dimensional feature, captures the synchronization patterns between brain regions, whereas graph-theoretical metrics, as low-dimensional features, characterize the topological organization of brain networks. The results indicate that low-dimensional topological features can, to some extent, compensate for the information loss in high-dimensional FC data, thereby improving classification performance.102 This finding underscores the significance of integrating functional connectivity and topological features for detecting early-stage neural network abnormalities in HAND and provides new insights into imaging-based precision screening.
This study is subject to several limitations. Firstly, the rigorous criteria applied for ANI selection posed challenges in expanding the sample size within the constraints of a single-center, short-term framework, potentially limiting the generalizability of findings to broader ANI populations. Moreover, a deeper investigation into the network reorganization process from ANI to HAD is imperative to establish more comprehensive imaging evidence for the longitudinal management of HAND. To address these gaps, future research should focus on large-scale, multicenter cohort studies encompassing diverse racial and ethnic groups to validate the relevance of functional-structural coupling changes as early biomarkers for HAND. Secondly, the inclusion of only male participants in this study may introduce gender bias. However, this limitation can also be considered a strength, as recent research has highlighted that variations in sex steroid hormones and hormonal environments contribute to differences in HAND incidence and progression patterns between male and female HIV-infected individuals.103 Furthermore, in China, the prevalence of HIV/AIDS among men who have sex with men (MSM) has surged dramatically, rising from 0% in 2001 to 22.91% in 2018,104 underscoring the critical importance of studying this high-risk population. Nevertheless, future investigations should also encompass individuals of different genders and age groups to achieve a more nuanced understanding of the dynamic progression of HAND, thereby enabling more personalized and effective management strategies.
Conclusions
This study, leveraging a multimodal brain network approach, delineates the critical neural network characteristics of the early ANI stage of HAND. While the structural network remained stable, the functional network underwent profound reorganization, accompanied by significantly enhanced functional-structural coupling within the occipital and prefrontal networks. These findings underscore the adaptive role of compensatory mechanisms in mitigating early neural damage, while simultaneously highlighting their inherent limitations, which may exacerbate the burden on the global network. Furthermore, the topological properties and coupling dynamics of the functional network were closely linked to patients’ immune status and cognitive performance. In addition, machine learning analysis further validated the diagnostic value of these neuroimaging features in ANI classification, providing a robust scientific basis for the early, precise diagnosis and targeted intervention of HAND. These results provide valuable guidance for the development of personalized intervention strategies grounded in functional network reorganization and emphasize the importance of stratified patient management through the integration of imaging biomarkers and immune parameters.
Data Sharing Statement
The data that support the findings of this study are available upon reasonable request.
Ethics Approval and Informed Consent
This study was approved by the Medical Ethics Committee of Beijing Youan Hospital, Capital Medical University (Ethics Approval No. LL-2020-047-K). All subject knew about this study and signed informed consent. All procedures carried out in studies conformed to the 1964 helsinki Declaration and its subsequent amendments or similar ethical standards.
Acknowledgments
This study acknowledges with deep gratitude the invaluable contributions of those who played a significant role in data collection, even though some of them are no longer actively engaged in the field of HIV-associated neurocognitive disorders. Their efforts have been instrumental to the project’s success. We particularly thank Dan Liu, Yu Qi, Yuxun Gao, Shuai Han, and Yuanyuan Wang for their dedication and commitment. We also extend our profound appreciation to Dr. Weiwei Wang from the State Key Laboratory of Cognitive Neuroscience and Learning at Beijing Normal University. A student of Professor Yong He, Dr. Wang possesses a strong command of graph theory methods and principles. She graciously devoted her personal time to assist the authors in completing this study, and her contributions have been indispensable.
Funding
This work was supported by the Beijing Youan Hospital Intramural Project for the Incubation of Young and Middle-aged Talent (No. BJYAYY-YN2023-04), the Open Project of the Henan Clinical Research Center for Infectious Diseases (No. KFKT202401), the National Natural Science Foundation of China (Nos. 61936013 and 82271963), the Beijing Natural Science Foundation (No. L222097), and the Beijing Hospital Authority Clinical Medicine Development Special Funding Support (No. ZLRK202333).
Disclosure
The authors report no conflicts of interest in this work.
This paper has been uploaded to medRxiv as a preprint: https://www.medrxiv.org/content/10.1101/2024.11.17.24317453v1.full.
References
1. van Sighem AI, Gras LA, Reiss P, Brinkman K, de Wolf F. Life expectancy of recently diagnosed asymptomatic HIV-infected patients approaches that of uninfected individuals. AIDS. 2010;24(10):1527–1535. doi:10.1097/QAD.0b013e32833a3946
2. Wallet C, De Rovere M, Van Assche J, et al. Microglial cells: the main HIV-1 reservoir in the brain. Front Cell Infect Microbiol. 2019;9:362. doi:10.3389/fcimb.2019.00362
3. Sacktor N, Skolasky RL, Seaberg E, et al. Prevalence of HIV-associated neurocognitive disorders in the multicenter AIDS cohort study. Neurology. 2016;86(4):334–340. doi:10.1212/WNL.0000000000002277
4. Eggers C, Arendt G, Hahn K, et al. HIV-1-associated neurocognitive disorder: epidemiology, pathogenesis, diagnosis, and treatment. J Neurol. 2017;264(8):1715–1727. doi:10.1007/s00415-017-8503-2
5. Abassi M, Morawski BM, Nakigozi G, et al. Cerebrospinal fluid biomarkers and HIV-associated neurocognitive disorders in HIV-infected individuals in Rakai, Uganda. J Neurovirol. 2017;23(3):369–375. doi:10.1007/s13365-016-0505-9
6. Woods SP, Iudicello JE, Morgan EE, Verduzco M, Smith TV, Cushman C. Household everyday functioning in the internet age: online shopping and banking skills are affected in HIV-associated neurocognitive disorders. J Int Neuropsychol Soc. 2017;23(7):605–615. doi:10.1017/S1355617717000431
7. Antinori A, Arendt G, Becker JT, et al. Updated research nosology for HIV-associated neurocognitive disorders. Neurology. 2007;69(18):1789–1799. doi:10.1212/01.WNL.0000287431.88658.8b
8. Heaton RK, Clifford DB, Franklin DR Jr, et al. HIV-associated neurocognitive disorders persist in the era of potent antiretroviral therapy: CHARTER study. Neurology. 2010;75(23):2087–2096. doi:10.1212/WNL.0b013e318200d727
9. Grant I, Franklin DR Jr, Deutsch R, et al. Asymptomatic HIV-associated neurocognitive impairment increases risk for symptomatic decline. Neurology. 2014;82(23):2055–2062. doi:10.1212/WNL.0000000000000492
10. Rourke SB, Bekele T, Rachlis A, et al. Asymptomatic neurocognitive impairment is a risk for symptomatic decline over a 3-year study period. AIDS. 2021;35(1):63–72. doi:10.1097/QAD.0000000000002709
11. Ellis R, Langford D, Masliah E. HIV and antiretroviral therapy in the brain: neuronal injury and repair. Nat Rev Neurosci. 2007;8(1):33–44. doi:10.1038/nrn2040
12. Cysique LA, Brew BJ. Prevalence of non-confounded HIV-associated neurocognitive impairment in the context of plasma HIV RNA suppression. J Neurovirol. 2011;17(2):176–183. doi:10.1007/s13365-011-0021-x
13. Craddock RC, Jbabdi S, Yan CG, et al. Imaging human connectomes at the macroscale. Nat Meth. 2013;10(6):524–539. doi:10.1038/nmeth.2482
14. Bullmore E, Sporns O. Complex brain networks: graph theoretical analysis of structural and functional systems. Nat Rev Neurosci. 2009;10(3):186–198. doi:10.1038/nrn2575
15. Gong G, He Y, Concha L, et al. Mapping anatomical connectivity patterns of human cerebral cortex using in vivo diffusion tensor imaging tractography. Cerebral Cortex. 2009;19(3):524–536.
16. Honey CJ, Sporns O, Cammoun L, et al. Predicting human resting-state functional connectivity from structural connectivity. Proc Nat Acad Sci United States Ame. 2009;106(6):2035–2040. doi:10.1073/pnas.0811168106
17. Hagmann P, Sporns O, Madan N, et al. White matter maturation reshapes structural connectivity in the late developing human brain. Proc Nat Acad Sci United States Ame. 2010;107(44):19067–19072. doi:10.1073/pnas.1009073107
18. Wang X, Wang J, He Y, et al. Apolipoprotein E ε4 modulates cognitive profiles, hippocampal volume, and resting-state functional connectivity in alzheimer’s disease. J Alzheimer’s Dis. 2015;45(3):781–795. doi:10.3233/JAD-142556
19. O’Connor EE, Zeffiro TA, Zeffiro TA. Brain structural changes following HIV Infection: meta-analysis. AJNR. 2018;39(1):54–62. doi:10.3174/ajnr.A5432
20. Sui J, Li X, Bell RP, et al. Structural and functional brain abnormalities in human immunodeficiency virus disease revealed by multimodal magnetic resonance imaging fusion: association with cognitive function. Clin Infect Dis. 2021;73(7):e2287–e2293. doi:10.1093/cid/ciaa1415
21. Abidin AZ, DSouza AM, Schifitto G, Wismüller A. Detecting cognitive impairment in HIV-infected individuals using mutual connectivity analysis of resting state functional MRI. J Neurovirol. 2020;26(2):188–200. doi:10.1007/s13365-019-00823-1
22. Baker LM, Cooley SA, Cabeen RP, et al. Topological organization of whole-brain white matter in hiv infection. Brain Connect. 2017;7(2):115–122. doi:10.1089/brain.2016.0457
23. Abidin AZ, AM DSouza, Nagarajan MB, Wismüller A. Investigating changes in brain network properties in Hiv-Associated Neurocognitive Disease (HAND) using mutual connectivity analysis (MCA). Proc SPIE. 2016;9788.
24. Han S, Aili X, Ma J, et al. Altered regional homogeneity and functional connectivity of brain activity in young HIV-infected patients with asymptomatic neurocognitive impairment. Front Neurol. 2022;13:982520. doi:10.3389/fneur.2022.982520
25. Xu F, Ma J, Wang W, Li H. A longitudinal study of the brain structure network changes in HIV patients with ANI: combined VBM with SCN. Front Neurol. 2024;15:1388616. doi:10.3389/fneur.2024.1388616
26. Fang Y, Wang W, Wang Q, Li HJ, Liu M. Attention-enhanced FUSION OF STRUCTURAL AND FUnctional MRI for analyzing HIV-associated asymptomatic neurocognitive impairment. Med Image Computing Computer-Assisted Intervention. 2024;15011:113–123. doi:10.1007/978-3-031-72120-5_11
27. Wang Q, Wang W, Fang Y, et al. Leveraging brain modularity prior for interpretable representation learning of fMRI. IEEE Transact Bio-Med Eng. 2024;71(8):2391–2401. doi:10.1109/TBME.2024.3370415
28. Gisslén M, Price RW, Nilsson S. The definition of HIV-associated neurocognitive disorders: are we overestimating the real prevalence? BMC Infect Dis. 2011;11:356. doi:10.1186/1471-2334-11-356
29. Shi C, Kang L, Yao S, et al. The MATRICS consensus cognitive battery (MCCB): co-norming and standardization in China. Schizophrenia Res. 2015;169(1–3):109–115. doi:10.1016/j.schres.2015.09.003
30. Bostan AC, Dum RP, Strick PL. Cerebellar networks with the cerebral cortex and basal ganglia. Trends in Cognitive Sci. 2013;17(5):241–254. doi:10.1016/j.tics.2013.03.003
31. Buckner RL, Krienen FM, Yeo BT. Opportunities and limitations of intrinsic functional connectivity MRI. Nature Neurosci. 2013;16(7):832–837. doi:10.1038/nn.3423
32. Kallianpur KJ, Shikuma C, Kirk GR, et al. Peripheral blood HIV DNA is associated with atrophy of cerebellar and subcortical gray matter. Neurology. 2013;80(19):1792–1799. doi:10.1212/WNL.0b013e318291903f
33. Tzourio-Mazoyer N, Landeau B, Papathanassiou D, et al. Automated anatomical labeling of activations in SPM using a macroscopic anatomical parcellation of the MNI MRI single-subject brain. NeuroImage. 2002;15(1):273–289. doi:10.1006/nimg.2001.0978
34. Jia XZ, Wang J, Sun HY, et al. RESTplus: an improved toolkit for resting-state functional magnetic resonance imaging data processing. Sci Bull. 2019;64(14):953–954. doi:10.1016/j.scib.2019.05.008
35. Ashburner J. A fast diffeomorphic image registration algorithm. NeuroImage. 2007;38(1):95–113. doi:10.1016/j.neuroimage.2007.07.007
36. Friston KJ, Williams S, Howard R, Frackowiak RS, Turner R. Movement-related effects in fMRI time-series. Mag Resonance Med. 1996;35(3):346–355. doi:10.1002/mrm.1910350312
37. Fox MD, Zhang D, Snyder AZ, Raichle ME. The global signal and observed anticorrelated resting state brain networks. J Neurophysiol. 2009;101(6):3270–3283. doi:10.1152/jn.90777.2008
38. Wang J, Wang X, Xia M, Liao X, Evans A, He Y. GRETNA: a graph theoretical network analysis toolbox for imaging connectomics. Front Human Neurosci. 2015;9:386. doi:10.3389/fnhum.2015.00386
39. Watts DJ, Strogatz SH. Collective dynamics of ‘small-world’ networks. Nature. 1998;393(6684):440–442. doi:10.1038/30918
40. Sporns O, Zwi JD. The small world of the cerebral cortex. Neuroinformatics. 2004;2(2):145–162. doi:10.1385/NI:2:2:145
41. He Y, Dagher A, Chen Z, et al. Impaired small-world efficiency in structural cortical networks in multiple sclerosis associated with white matter lesion load. Brain. 2009;132(Pt 12):3366–3379. doi:10.1093/brain/awp089
42. Latora V, Marchiori M. Efficient behavior of small-world networks. Physical Rev Lett. 2001;87(19):198701. doi:10.1103/PhysRevLett.87.198701
43. Newman ME. Finding community structure in networks using the eigenvectors of matrices. Phys Rev E Stat Nonlin Soft Matter Phys. 2006;74(3 Pt 2):036104. doi:10.1103/PhysRevE.74.036104
44. Wang K, Liang M, Wang L, et al. Altered functional connectivity in early Alzheimer’s disease: a resting-state fMRI study. Human Brain Mapp. 2007;28(10):967–978. doi:10.1002/hbm.20324
45. Bai F, Liao W, Watson DR, et al. Abnormal whole-brain functional connection in amnestic mild cognitive impairment patients. Behav Brain Res. 2011;216(2):666–672. doi:10.1016/j.bbr.2010.09.010
46. Freeman LC. Centrality in social networks conceptual clarification. Soc Networks. 1978;1(3):215–239. doi:10.1016/0378-8733(78)90021-7
47. Newman MEJ. The structure and function of complex networks. SIAM Review. 2003;45(2):167–256. doi:10.1137/S003614450342480
48. Freeman LC. A set of measures of centrality based on betweenness. Sociometry. 1977;40(1):35–41. doi:10.2307/3033543
49. Zalesky A, Fornito A, Bullmore ET. Network-based statistic: identifying differences in brain networks. NeuroImage. 2010;53(4):1197–1207. doi:10.1016/j.neuroimage.2010.06.041
50. Zhang Z, Liao W, Chen H, et al. Altered functional-structural coupling of large-scale brain networks in idiopathic generalized epilepsy. Brain. 2011;134(Pt 10):2912–2928. doi:10.1093/brain/awr223
51. Chahal R, Gotlib IH, Guyer AE. Research review: brain network connectivity and the heterogeneity of depression in adolescence - a precision mental health perspective. J Child Psychol Psychiatry Allied Discip. 2020;61(12):1282–1298. doi:10.1111/jcpp.13250
52. Sailasuta N, Ross W, Ananworanich J, et al. Change in brain magnetic resonance spectroscopy after treatment during acute HIV infection. PLoS One. 2012;7(11):e49272. doi:10.1371/journal.pone.0049272
53. Crews L, Patrick C, Achim CL, Everall IP, Masliah E. Molecular pathology of neuro-AIDS (CNS-HIV). Int J Mol Sci. 2009;10(3):1045–1063. doi:10.3390/ijms10031045
54. Harshithkumar R, Shah P, Jadaun P, Mukherjee A. ROS chronicles in HIV infection: genesis of oxidative stress, associated pathologies, and therapeutic strategies. Curr Issue Mol Biol. 2024;46(8):8852–8873. doi:10.3390/cimb46080523
55. Saylor D, Dickens AM, Sacktor N, et al. HIV-associated neurocognitive disorder--pathogenesis and prospects for treatment. Nat Rev Neurol. 2016;12(4):234–248. doi:10.1038/nrneurol.2016.27
56. Ferrarese C, Aliprandi A, Tremolizzo L, et al. Increased glutamate in CSF and plasma of patients with HIV dementia. Neurology. 2001;57(4):671–675. doi:10.1212/WNL.57.4.671
57. Plessis S, Vink M, Joska JA, et al. HIV infection results in ventral-striatal reward system hypo-activation during cue processing. AIDS. 2015;29(11):1335–1343. doi:10.1097/QAD.0000000000000680
58. Potter MC, Figuera-Losada M, Rojas C, Slusher BS. Targeting the glutamatergic system for the treatment of HIV-associated neurocognitive disorders. J Neuroimmune Pharmacol. 2013;8(3):594–607. doi:10.1007/s11481-013-9442-z
59. Illenberger JM, Harrod SB, Mactutus CF, McLaurin KA, Kallianpur A, Booze RM. HIV infection and neurocognitive disorders in the context of chronic drug abuse: evidence for divergent findings dependent upon prior drug history. J Neuroimmune Pharmacol. 2020;15(4):715–728. doi:10.1007/s11481-020-09928-5
60. Buckner RL. Human functional connectivity: new tools, unresolved questions. Proc Nat Acad Sci United States Am. 2010;107(24):10769–10770. doi:10.1073/pnas.1005987107
61. Vogel JW, Corriveau-Lecavalier N, Franzmeier N, et al. Connectome-based modelling of neurodegenerative diseases: towards precision medicine and mechanistic insight. Nat Rev Neurosci. 2023;24(10):620–639. doi:10.1038/s41583-023-00731-8
62. McGregor MM, Nelson AB. Circuit mechanisms of parkinson’s disease. Neuron. 2019;101(6):1042–1056. doi:10.1016/j.neuron.2019.03.004
63. Masliah E, Heaton RK, Marcotte TD, et al. Dendritic injury is a pathological substrate for human immunodeficiency virus-related cognitive disorders. Ann Neurol. 1997;42(6):963–972.
64. Fernandes JP, Branton WG, Cohen EA, et al. Caspase cleavage of gasdermin E causes neuronal pyroptosis in HIV-associated neurocognitive disorder. Brain. 2024;147(2):717–734. doi:10.1093/brain/awad375
65. Everall IP, Luthert PJ, Lantos PL. Neuronal loss in the frontal cortex in HIV infection. Lancet. 1991;337(8750):1119–1121. doi:10.1016/0140-6736(91)92786-2
66. Masliah E, Ge N, Mucke L. Pathogenesis of HIV-1 associated neurodegeneration. Crit Rev Neurobiol. 1996;10(1):57–67. doi:10.1615/CritRevNeurobiol.v10.i1.30
67. Meunier D, Achard S, Morcom A, Bullmore E. Age-related changes in modular organization of human brain functional networks. NeuroImage. 2009;44(3):715–723. doi:10.1016/j.neuroimage.2008.09.062
68. Bassett DS, Bullmore ET. Small-world brain networks revisited. Neuroscientist. 2017;23(5):499–516. doi:10.1177/1073858416667720
69. Banks WA, Robinson SM, Nath A. Permeability of the blood-brain barrier to HIV-1 Tat. Experiment Neurol. 2005;193(1):218–227. doi:10.1016/j.expneurol.2004.11.019
70. Rubin LH, Sacktor N, Creighton J, et al. Microglial activation is inversely associated with cognition in individuals living with HIV on effective antiretroviral therapy. AIDS. 2018;32(12):1661–1667. doi:10.1097/QAD.0000000000001858
71. Ances BM, Sisti D, Vaida F, et al. Resting cerebral blood flow: a potential biomarker of the effects of HIV in the brain. Neurology. 2009;73(9):702–708. doi:10.1212/WNL.0b013e3181b59a97
72. Shin NY, Hong J, Choi JY, Lee SK, Lim SM, Yoon U. Retrosplenial cortical thinning as a possible major contributor for cognitive impairment in HIV patients. Euro Radiol. 2017;27(11):4721–4729. doi:10.1007/s00330-017-4836-6
73. Aylward EH, Brettschneider PD, McArthur JC, et al. Magnetic resonance imaging measurement of gray matter volume reductions in HIV dementia. Am J Psychiatry. 1995;152(7):987–994.
74. Liu D, Zhao C, Wang W, et al. Altered gray matter volume and functional connectivity in human immunodeficiency virus-infected adults. Front Neurosci. 2020;14:601063. doi:10.3389/fnins.2020.601063
75. Filippi CG, Ulug AM, Ryan E, Ferrando SJ, van Gorp W. Diffusion tensor imaging of patients with HIV and normal-appearing white matter on MR images of the brain. AJNR Am J Neuroradiol. 2001;22(2):277–283.
76. Wiesman AI, O’Neill J, Mills MS, et al. Aberrant occipital dynamics differentiate HIV-infected patients with and without cognitive impairment. Brain. 2018;141(6):1678–1690. doi:10.1093/brain/awy097
77. Li R, Wang W, Wang Y, Peters S, Zhang X, Li H. Effects of early HIV infection and combination antiretroviral therapy on intrinsic brain activity: a cross-sectional resting-state fMRI study. Neuropsychiatric Disease Treat. 2019;15:883–894. doi:10.2147/NDT.S195562
78. Chang L, Speck O, Miller EN, et al. Neural correlates of attention and working memory deficits in HIV patients. Neurology. 2001;57(6):1001–1007. doi:10.1212/WNL.57.6.1001
79. Wang X, Foryt P, Ochs R, et al. Abnormalities in resting-state functional connectivity in early human immunodeficiency virus infection. Brain Connect. 2011;1(3):207–217. doi:10.1089/brain.2011.0016
80. Chang L, Tomasi D, Yakupov R, et al. Adaptation of the attention network in human immunodeficiency virus brain injury. Annals Neurol. 2004;56(2):259–272. doi:10.1002/ana.20190
81. Thomas JB, Brier MR, Snyder AZ, Vaida FF, Ances BM. Pathways to neurodegeneration: effects of HIV and aging on resting-state functional connectivity. Neurology. 2013;80(13):1186–1193. doi:10.1212/WNL.0b013e318288792b
82. Ances BM, Hammoud DA. Neuroimaging of HIV-associated neurocognitive disorders (HAND). Curr Opinion HIV AIDS. 2014;9(6):545–551. doi:10.1097/COH.0000000000000112
83. Berger JR, Arendt G. HIV dementia: the role of the basal ganglia and dopaminergic systems. J Psychopharmacol. 2000;14(3):214–221. doi:10.1177/026988110001400304
84. Wiley CA, Soontornniyomkij V, Radhakrishnan L, et al. Distribution of brain HIV load in AIDS. Brain Pathol. 1998;8(2):277–284. doi:10.1111/j.1750-3639.1998.tb00153.x
85. Kim DM, Tien R, Byrum C, Krishnan KR. Imaging in acquired immune deficiency syndrome dementia complex (AIDS dementia complex): a review. Prog Neuro-Psychopharmacol Biol Psychiatry. 1996;20(3):349–370.
86. Schouten J, Cinque P, Gisslen M, Reiss P, Portegies P. HIV-1 infection and cognitive impairment in the cART era: a review. AIDS. 2011;25(5):561–575. doi:10.1097/QAD.0b013e3283437f9a
87. Chaganti J, Marripudi K, Staub LP, et al. Imaging correlates of the blood-brain barrier disruption in HIV-associated neurocognitive disorder and therapeutic implications. AIDS. 2019;33(12):1843–1852. doi:10.1097/QAD.0000000000002300
88. Becker JT, Sanders J, Madsen SK, et al. Subcortical brain atrophy persists even in HAART-regulated HIV disease. Brain Imag Behav. 2011;5(2):77–85. doi:10.1007/s11682-011-9113-8
89. Ances BM, Ortega M, Vaida F, Heaps J, Paul R. Independent effects of HIV, aging, and HAART on brain volumetric measures. J Acquir Immune Defic Syndr. 2012;59(5):469–477. doi:10.1097/QAI.0b013e318249db17
90. O’Connor EE, Zeffiro TA, Lopez OL, Becker JT. Differential effects of aids and chronic human immunodeficiency virus infection on gray matter volume. Clin Infectious Dis. 2021;73(7):e2303–e2310. doi:10.1093/cid/ciaa1552
91. Cools R. Dopaminergic control of the striatum for high-level cognition. Curr Opinion Neurobiol. 2011;21(3):402–407. doi:10.1016/j.conb.2011.04.002
92. Kipping JA, Grodd W, Kumar V, Taubert M, Villringer A, Margulies DS. Overlapping and parallel cerebello-cerebral networks contributing to sensorimotor control: an intrinsic functional connectivity study. NeuroImage. 2013;83:837–848. doi:10.1016/j.neuroimage.2013.07.027
93. Ann HW, Jun S, Shin NY, et al. Characteristics of Resting-State Functional Connectivity in HIV-Associated Neurocognitive Disorder. PLoS One. 2016;11(4):e0153493. doi:10.1371/journal.pone.0153493
94. Wang H, Li R, Zhou Y, et al. Altered cerebro-cerebellum resting-state functional connectivity in HIV-infected male patients. J Neurovirol. 2018;24(5):587–596. doi:10.1007/s13365-018-0649-x
95. Smallwood J, Bernhardt BC, Leech R, Bzdok D, Jefferies E, Margulies DS. The default mode network in cognition: a topographical perspective. Nat Rev Neurosci. 2021;22(8):503–513. doi:10.1038/s41583-021-00474-4
96. Samboju V, Philippi CL, Chan P, et al. Structural and functional brain imaging in acute HIV. NeuroImage Clin. 2018;20:327–335. doi:10.1016/j.nicl.2018.07.024
97. Egbert AR, Biswal B, Karunakaran KD, et al. HIV infection across aging: synergistic effects on intrinsic functional connectivity of the brain. Progress Neuro-Psychopharmacol Biol Psych. 2019;88:19–30. doi:10.1016/j.pnpbp.2018.06.006
98. Ernst T, Chang L, Jovicich J, Ames N, Arnold S. Abnormal brain activation on functional MRI in cognitively asymptomatic HIV patients. Neurology. 2002;59(9):1343–1349. doi:10.1212/01.WNL.0000031811.45569.B0
99. Plessis SD, Vink M, Joska JA, Koutsilieri E, Stein DJ, Emsley R. HIV infection and the fronto-striatal system: a systematic review and meta-analysis of fMRI studies. AIDS. 2014;28(6):803–811. doi:10.1097/QAD.0000000000000151
100. Gelman BB, Lisinicchia JG, Chen T, et al. Prefrontal dopaminergic and enkephalinergic synaptic accommodation in HIV-associated neurocognitive disorders and encephalitis. J Neuroimmune Pharmacol. 2012;7(3):686–700. doi:10.1007/s11481-012-9345-4
101. Perovnik M, Rus T, Schindlbeck KA, Eidelberg D. Functional brain networks in the evaluation of patients with neurodegenerative disorders. Nat Rev Neurol. 2023;19(2):73–90. doi:10.1038/s41582-022-00753-3
102. Finn ES, Shen X, Scheinost D, et al. Functional connectome fingerprinting: identifying individuals using patterns of brain connectivity. Nature Neurosci. 2015;18(11):1664–1671. doi:10.1038/nn.4135
103. Rubin LH, Neigh GN, Sundermann EE, Xu Y, Scully EP, Maki PM. Sex differences in neurocognitive function in adults with hiv: patterns, predictors, and mechanisms. Curr Psychiatry Rep. 2019;21(10):94. doi:10.1007/s11920-019-1089-x
104. Dong MJ, Peng B, Liu ZF, et al. The prevalence of HIV among MSM in China: a large-scale systematic analysis. BMC Infect Dis. 2019;19(1):1000. doi:10.1186/s12879-019-4559-1
 © 2025 The Author(s). This work is published and licensed by Dove Medical Press Limited. The
full terms of this license are available at https://www.dovepress.com/terms.php
and incorporate the Creative Commons Attribution
- Non Commercial (unported, 4.0) License.
By accessing the work you hereby accept the Terms. Non-commercial uses of the work are permitted
without any further permission from Dove Medical Press Limited, provided the work is properly
attributed. For permission for commercial use of this work, please see paragraphs 4.2 and 5 of our Terms.
© 2025 The Author(s). This work is published and licensed by Dove Medical Press Limited. The
full terms of this license are available at https://www.dovepress.com/terms.php
and incorporate the Creative Commons Attribution
- Non Commercial (unported, 4.0) License.
By accessing the work you hereby accept the Terms. Non-commercial uses of the work are permitted
without any further permission from Dove Medical Press Limited, provided the work is properly
attributed. For permission for commercial use of this work, please see paragraphs 4.2 and 5 of our Terms.