")
Back to Journals » Nature and Science of Sleep » Volume 17
Functional Connectivity Alterations Associated with COVID-19-Related Sleep Problems: A Longitudinal Resting-State fMRI Study
Authors Chen HB , Li L, Sun YK, Liu Y, Chen W, Liu P, Liao YH, Xie A
Received 27 July 2024
Accepted for publication 30 December 2024
Published 15 January 2025 Volume 2025:17 Pages 97—113
DOI https://doi.org/10.2147/NSS.S488911
Checked for plagiarism Yes
Review by Single anonymous peer review
Peer reviewer comments 2
Editor who approved publication: Prof. Dr. Ahmed BaHammam
Hao-bo Chen,1,* Ling Li,2,* Yun-kai Sun,2 Yi Liu,2 Wei Chen,3 Peng Liu,1 Yan-Hui Liao,1,2 An Xie1
1Department of Radiology, The First Affiliated Hospital of Hunan Normal University (Hunan Provincial People’s Hospital), Changsha, Hunan, People’s Republic of China; 2Department of Psychiatry, Sir Run Run Shaw Hospital, Zhejiang University School of Medicine, Hangzhou, Zhejiang, People’s Republic of China; 3MR Research Collaboration Team, Siemens Healthineers Ltd., Guangzhou, People’s Republic of China
*These authors contributed equally to this work
Correspondence: An Xie, Department of Radiology, The First Affiliated Hospital of Hunan Normal University (Hunan Provincial People’s Hospital), 61 Jiefang West Road, Changsha, Hunan, 410005, People’s Republic of China, Tel/Fax +86-0731-81866132, Email [email protected] Yan-Hui Liao, Department of Psychiatry, Sir Run Run Shaw Hospital, Zhejiang University School of Medicine, 3 East Qingchun Road, Hangzhou, Zhejiang, 310016, People’s Republic of China, Email [email protected]
Background: COVID-19 has led to reports of fatigue and sleep problems. Brain function changes underlying sleep problems (SP) post-COVID-19 are unclear.
Purpose: This study investigated SP-related brain functional connectivity (FC) alterations.
Patients and methods: Fifty-five COVID-19 survivors with SP (COVID_SP) and 33 without SP (COVID_NSP), matched for demographics, completed PSQI and underwent rs-fMRI at baseline and 2-month follow-up. Correlations between FC and clinical data were analyzed by Pearson correlation analysis with Gaussian random field (GRF) correction. The repeated-measures analysis of variance (R-M ANOVA) was completed to explore the interaction with time.
Results: At baseline, COVID_SP exhibited elevated FC: right precentral gyrus (PrG) with left lateral occipital cortex (LOcC)/right PrG, left inferior parietal lobule (IPL) with right superior frontal gyrus (SFG), left hippocampus with right inferior frontal gyrus (IFG). Higher FC between left hippocampus and right SFG correlated with PSQI scores. At 2-month follow-up, decreased FC implicated in emotion regulation, executive function, and memory; increased FC in semantics, attention, and auditory-visual processing. The changes in these regions are correlated with the scores of PSQI, GAD, and PHQ. The Repeated-Measures Analysis of Variance (R-M ANOVA) revealed a significant time interaction effect between sleep and various emotion scales. Moreover, the analysis of the functional connectivity between the right PrG and the right PrG as well as that between the left IPL and the right SFG also discovered a significant time interaction effect.
Conclusion: This study provides insight into the changes in brain function associated with SP after COVID-19. These changes may partially explain the development of SP, and they also changed over time.
Keywords: COVID-19, SP, rs-fMRI, FC
Introduction
The global coronavirus disease 2019 (COVID-19) pandemic was a global public health problem that disrupted daily routines and had a lasting impact on many individuals’ sleep patterns. The neurological consequences of infection with severe acute respiratory syndrome coronavirus 2 (SARS-CoV-2) extended beyond the acute phase of infection. As a neurotropic virus capable of triggering cytokine storm syndrome,1,2 SARS-CoV-2 could cause a range of short-term neurological symptoms, including acute ischemic-hemorrhagic encephalopathy, autoimmune encephalitis, and Guillain-Barre syndrome.3,4 Autopsy findings from patients who died of COVID-19 had revealed the persistence of SARS-CoV-2 in the human body, raising concerns about long-term effects.5 Research conducted within the context of the pandemic had identified damage to vascular endothelial cells in COVID-19 patients during both the acute and recovery phases. This damage had been shown to result in neurological impairments, including damage to the blood–brain barrier, hypoxia-related neurological sequelae, and neuroinflammation,6 A subset of patients, due to ongoing endothelial dysfunction, were unable to make a full recovery, resulting in long COVID. Longitudinal neuroimaging studies related to COVID-19 had demonstrated a decrease in gray matter volume and damage to brain tissue, particularly in memory and olfactory regions,7 with the potential to impair complex cognitive functions.8
A substantial proportion of individuals with COVID-19 experienced long-term psychological problems, including depression, anxiety, and sleep problems, collectively known as post-COVID-19 syndrome.9 Sleep played a vital role in overall health throughout life, and previous research highlighted the prevalence of sleep problems among the general public and healthcare workers during the pandemic.10–12 Nightmares and other sleep problems13 might have been linked to increased stress and worse sleep quality14 associated with COVID-19. Several studies had indicated that these sleep disruptions could persist over time, affecting individuals’ lives to varying degrees.15,16 The bidirectional relationship between sleep quality and physical and mental health was well established;17,18 sleep problems often occurred in conjunction with mental health issues.19,20 Long-term follow-up studies had frequently identified post-COVID-19 syndrome in individuals experiencing these ongoing challenges.21 Once the novel coronavirus infiltrates the human body, a substantial release of inflammatory cytokines occurs. These inflammatory mediators play a disruptive role in multiple aspects. On one hand, they impede the normal metabolic processes of crucial neurotransmitters like serotonin and dopamine. This interference directly throws off the body’s mood regulation mechanisms, creating a conducive environment for the onset and escalation of anxiety symptoms. On the other hand, these mediators target the sleep-regulating center located in the hypothalamus, throwing the normal sleep rhythm into chaos and consequently giving rise to sleep disorders.22 The nexus between the enduring perturbations in sleep and affective states consequent to COVID-19 infection and the concomitant modifications in cerebral function and architecture remained to be elucidated.
Resting-state functional magnetic resonance imaging (rsfMRI) is a technique that studies brain functional networks through the spontaneous fluctuations of the blood oxygen level-dependent (BOLD) signal in the absence of external stimuli. Resting-state functional connectivity (rsFC) analysis focuses on the temporal correlations between different brain regions, revealing the synchrony among brain areas. rsFC research helps to understand the intrinsic functional organization of the brain at rest and provides insights into the dynamic characteristics of brain networks in both healthy and disease states.23
In recent research pertaining to resting-state brain function in individuals with sleep problems, a study had identified a bidirectional correlation between the severity of anxiety and depressive symptoms and alterations in the rsFC of the hypothalamus and insula in young male subjects,24,25 which was associated with diminished sleep quality. Moreover, in patients afflicted with hereditary dementia, a reduction in the volume of specific hypothalamic subregions had been observed, with the extent of this reduction demonstrating a positive correlation with the degree of sleep problems.26 Furthermore, within the cohort of individuals with chronic sleep problems, alterations in the functional connectivity of the amygdala and the supramarginal gyrus had been discerned. Previous research had linked mood and sleep problems to COVID-19,27 and recent studies had revealed alterations in gray matter volumes in specific brain regions, such as the nucleus and hippocampus, after COVID-19.28 Reetz et al’s investigation into the graph-theoretical aspects of sleep problems post-COVID-19 had revealed significant correlations between excessive daytime somnolence and brain areas including the thalamus, cingulate cortex, and olfactory cortex.29 Additionally, Liu et al’s longitudinal study on COVID-19 survivors had identified alterations in the amplitude of low-frequency fluctuations (ALFF) within the caudate nucleus and precentral gyrus, which were correlated with sleep problems.30 Recent findings from multimodal MRI research indicated that post-COVID-19 sleep problems are associated with an augmentation of cortical thickness in the perirolandic areas of the parietal cortex, alongside a reduction in cortical thickness within the frontal, occipital, and medial brain regions.31 Recent extensive research involving large cohorts of individuals following COVID-19 infection has revealed changes in both the functional and structural aspects of the temporal lobes, orbital frontal lobes, and cerebellum among those affected by the virus. A large number of studies have shown that COVID-19 infection is associated with changes in brain function and structure. However, most existing research had focused on severe COVID-19 cases, with limited investigation into the impact of mild and moderate disease. Although a few studies had examined functional brain changes associated with sleep problems (SP) in hospitalized COVID-19 patients,30,32 none had explored the functional brain changes related to SP symptoms after COVID-19.
Therefore, this study aimed to investigate changes in functional connectivity (FC) within the brains of individuals with SP after COVID-19 using resting-state functional magnetic resonance imaging (rs-fMRI). Additionally, the study explored relationships of sleep and mood changes with changes in brain function among individuals with SP.
Methods
Participants and Study Design
Through WeChat and flyers, information was gathered from individuals reporting sleep problems between January and March 2023. All participants had recently tested negative for SARS-CoV-2 antigen after a previous infection and reported no other health issues. A simple screening was conducted via WeChat to collect demographic information (educational level, age, ethnicity, handedness, contraindications to magnetic resonance imaging [eg, metal implants], psychoactive substance use, history of mental illness, and history of other physical diseases or brain trauma) and data concerning self-reported changes in mood or sleep after recovery from COVID-19 (including whether they thought that these changes were related to COVID-19). After eligible individuals had received an explanation of the study and provided informed consent to participate, they were scheduled for magnetic resonance imaging (MRI) scans and clinical evaluations at our hospital. Inclusion criteria were prior SARS-CoV-2 antigen or nucleic acid test positivity, combined with current negative antigen test results; secondary school education or higher; age 18–60 years; right-handed; Han ethnicity; no contraindications to MRI scanning; and informed consent. Exclusion criteria included use of psychoactive drugs (eg, antipsychotics, antidepressants) within 3 months before enrollment; personal or family history of mental illness meeting Diagnostic and Statistical Manual of Mental Disorders, Fifth Edition (DSM-5) diagnostic criteria; history of organic brain disease, brain injury, or coma; serious physical illness, endocrine disorders, or blood, heart, liver, or kidney problems; pregnancy or breastfeeding; and/or sleep problems caused by factors other than COVID-19, such as life or work-related stress.
All procedures were performed at The First Affiliated Hospital of Hunan Normal University in Changsha, Hunan province, China. The research protocol received approval from the ethics committees of Sir Run Run Shaw Hospital, Zhejiang University School of Medicine [2023-485-01] and The First Affiliated Hospital, Hunan Normal University [(2023)-22].
Measurements
Demographic Information
A customized questionnaire was used to collect demographic data, including sex, age, marital status, residence, and years of education. During the initial assessment, participants retrospectively assessed their sleep and emotional states in the 2 weeks before COVID-19 (pre-COVID). During the acute COVID-19 assessment, participants evaluated their sleep and emotional states in the 2 weeks after COVID-19 (post-COVID), concurrent with baseline MRI data collection. At the 2-month follow-up assessment, participants evaluated their sleep and emotional states in the preceding 2 weeks (2-month follow-up).
Anxiety Assessment
The 7-item Generalized Anxiety Disorder (GAD-7) scale, consisting of seven items rated on a 4-point scale (0–3),33 was used to assess anxiety levels. Total scores ranged from 0 to 21, with 0–4 classified as minimal anxiety, 5–9 as mild, 10–14 as moderate, and 15–21 as severe. Each participant independently completed this self-rated scale.
Depression Assessment
The Patient Health Questionnaire-9 (PHQ-9), comprising nine items rated on a 4-point scale (0–3),34 was used to assess depression levels. Total scores ranged from 0 to 27, with 0–4 classified as minimal depression, 5–9 as mild, 10–14 as moderate, 15–19 as moderately severe, and 20–27 as severe. Each participant independently completed this self-rated scale.
Sleep Problems Assessment
Participants’ sleep quality and patterns were assessed using the Pittsburgh Sleep Quality Index (PSQI),35 which consists of seven factors: subjective sleep quality, sleep latency, sleep duration, habitual sleep efficiency, sleep disturbances, use of sleep medication, and daytime dysfunction. Each factor is rated on a 0–3 scale, with higher scores indicating greater difficulty. Total scores ranged from 0 to 21, with higher scores indicating worse sleep quality. Each participant independently completed this self-rated scale.
The Chinese versions of the PSQI, GAD-7, and PHQ-9 scales all have good reliability and validity among the Chinese population.36–38
Group Definitions
Based on the varying degrees of sleep problems observed after the COVID-19 pandemic, we divided participants into two groups using a PSQI cutoff score of 7, in accordance with criteria established by Liu et al for the Chinese population.39 Participants with a pre-COVID-19 PSQI score ≤ 7 and a post-COVID-19 PSQI score >7 were assigned to the sleep problems (COVID_SP) group, representing the onset of more severe sleep issues after COVID-19.40,41 Participants with pre- and post-COVID-19 PSQI scores ≤7 were assigned to the non-sleep problems (COVID_NSP) group, representing the maintenance of good or average sleep quality. Quantitative magnetic resonance data were collected from both groups at baseline and again at the 2-month follow-up. After the initial assessments, 16 individuals from the COVID_SP group and 14 individuals from the COVID_NSP group dropped out; due to factors such as work, being in other places, or not wanting to continue participation, 58 participants were included in the follow-up analysis (see Figure 1).
 |
Figure 1 Flowchart of participant inclusion. |
MRI Acquisition Parameters
For individuals who met the inclusion criteria, MRI data were collected daily between 6:00 and 10:00 p.m. All participants underwent scanning in an awake state, and each MRI session lasted approximately 20 minutes. MRI data were acquired using a 3.0T scanner (Siemens Prisma) with a 64-channel head and neck coil. Participants were placed in a supine position with earplugs and foam pads around their heads to minimize motion artifacts. The MRI scanning protocol included three-dimensional magnetization-prepared rapid-acquisition gradient echo (3D-MPRAGE) and resting-state fMRI sequences to measure blood oxygen level-dependent (BOLD) signals. The 3D-MPRAGE scan parameters were 208 sagittal slices, repetition time = 2300 ms, echo time = 2.32 ms, voxel size = 0.9 mm3, slice thickness = 0.9 mm, and field of view = 240 mm2. The BOLD sequence parameters were 52 axial slices, repetition time = 1000 ms, echo time = 34 ms, flip angle = 90°, voxel size = 2.5 mm3, slice thickness = 2.5 mm, and field of view = 230 × 230 mm2.
MRI Data Processing
Data Processing Assistant for Resting-State fMRI (DPABI, 8.1, Advanced edition) software (http://rfmri.org/dpabi) based on MATLAB R2020b, SPM12 (http://www.fil.ion.ucl.ac.uk/spm/software/spm12/), and CAT12 were used for MRI data preprocessing. The specific resting-state fMRI processing steps were as follows: (1) Data transformation: Digital Imaging and Communications in Medicine (DICOM) images were converted to Neuroimaging Informatics Technology Initiative (NIfTI) format. (2) Removal of initial volumes: the first 10 scanning volumes were discarded to ensure stable magnetization. (3) Head motion exclusion: participants with average head motion exceeding 2 mm translation or 2° rotation were excluded. (4) Image alignment: resting-state images were aligned with their respective T1-structural images for each participant. (5) Nuisance covariate regression: 24 Friston head motion parameters,42 white matter signals, and cerebrospinal fluid signals were regressed out as nuisance covariates. (6) Spatial normalization: spatially normalized resting-state and T1-structural images were transformed into Montreal Neurological Institute (MNI) space using the DARTEL algorithm.43 (7) Power spectrum calculation: each voxel’s time series was transformed into the frequency domain using a fast Fourier transform to calculate the power spectrum. (8) Frequency band selection: the square root of each voxel’s signal within the 0.01–0.08 hz frequency band was calculated and mean-centered. (9) Smoothing: images were smoothed with a 5 mm full-width at half-maximum (FWHM) Gaussian kernel to enhance the signal-to-noise ratio. (10) FC calculation: FC was computed to examine temporal correlations of BOLD signal changes between brain regions. Overall, 246 brain regions from the Brainnetome 246 Atlas44 were selected as seed points. Correlation coefficients between each seed point and other voxels were calculated and then standardized using Fisher’s r-to-z transformation for further analysis.
Statistical Analysis
Statistical analyses were performed using MATLAB (version 2020b), DPABI (version 8.1), SPM 12, and SPSS (version 25.0). Continuous variables are presented as mean (± standard deviation, SD) and were analyzed using two-sample t-tests to assess group differences. Categorical variables are presented as numbers (percent, %) and were analyzed using the chi-square test. The threshold for statistical significance was regarded as p <0.05 (two-tailed). Voxel-wise comparisons of FC maps between COVID_SP and COVID_NSP groups were conducted using two-sample t-tests, with sex, age, and head motion included as covariates. Paired t-tests were used to compare baseline and follow-up FC maps. Gaussian random field (GRF)45 correction was applied to all results. At baseline, FC results from the COVID_SP group were examined for correlations with various psychological scales, controlling for sex, age, head motion, and other scales as nuisance covariates. Two months later, correlation analyses between changes in various scales (follow-up minus baseline) and FC were performed, controlling for other scale scores as covariates. All correlation analyses were subjected to GRF correction (voxel p < 0.001/0.005, cluster p < 0.05, two tail). Subsequently, with the aim of probing into the interaction between the scores of different scales and brain functional connectivity over time, we carried out a repeated measures analysis of variance (RM-ANOVA) for the final outcomes of the PSQI and its subgroups, GAD, and PHQ scores at three time points, along with the brain functional connectivity at two time points. In case the assumption of sphericity (Mauchly’s test) was breached, the Greenhouse–Geisser correction was implemented. Regarding post hoc comparisons, the Bonferroni test was employed, and P <0.05 served as the cutoff level for statistical significance.
Results
Participant Characteristics and Clinical Symptoms
Participant characteristics are shown in Tables 1 and 2. Initially, 115 individuals completed both baseline and follow-up scans. Of these individuals, 6 people were excluded due to their own organic brain diseases, and 1 person was excluded because they could not tolerate magnetic resonance scanning; ten people were excluded due to head movements (SP: 7 people, NSP: 3 people. There was no statistically significant difference in the exclusion rates between the two groups, p > 0.05). Ten others were excluded because their PSQI score exceeded 7 before COVID-19. The remaining 88 participants were divided into post-COVID-19 SP and NSP groups based on their PSQI scores. Behavioral assessments revealed significant increases in PSQI, GAD, and PHQ scores after COVID-19 (Figure 2A). No significant groupwise differences in these scores were observed before COVID-19 (Figure 2B). However, significant differences in all scores emerged after COVID-19 (Figure 2C); the SP group showed greater increases compared with the NSP group (Table S1 and Figure S1). Both groups showed improvements in sleep and mood at the 2-month follow-up (Figure 2D).
 |
Table 1 Demographic Characteristics and Clinical Scale Scores at Baseline |
 |
Table 2 Demographic Characteristics and Clinical Scale Scores at 2-Month Follow-Up |
 |
Figure 2 (A) Comparison of clinical scale scores before and after COVID-19 in all participants. (B) Comparison of clinical scales between both groups before COVID-19. (C) Comparison of clinical scales between both groups before and after COVID-19. (D) Comparison of clinical scale scores between follow-up and baseline in both groups (**p < 0.01, and ***p < 0.001). |
The RM-ANOVA Analysis of the Scale
For the two-way repeated measures analysis of variance of the three measurements of PSQI and its subgroups, as well as GAD and PHQ scores, the following results were obtained. There were significant time main effects between the two groups (PSQI: F = 24.451, p < 0.001; GAD: F = 7.847, p = 0.001; PHQ: F = 27.129, p < 0.001). Additionally, there were interaction effects between group and time (PSQI: F = 49.728, p < 0.001; GAD: F = 3.467, p < 0.035; PHQ: F = 10.235, p < 0.001), and group main effects (PSQI: F = 44.22, p < 0.001; for GAD: F = 3.859 p>0.05; PHQ: F = 4.974, p = 0.03).
Regarding the post hoc comparison of the simple time effect of the PSQI score, in the SP population after COVID-19 infection, when compared with the pre-COVID-19 infection period, the PSQI scores increased both post-COVID-19 infection and at the follow-up (p< 0.05, Table 3). Moreover, when compared with the level post-infection, the PSQI score at the follow-up period was significantly decreased (p < 0.05). For the post hoc comparison of the simple time effect of the GAD score, in the SP population after COVID-19 infection, compared with the pre-COVID-19 infection period, the GAD score increased significantly post-COVID-19 infection (p < 0.05, Table 4). When compared with the level post-infection, the GAD score at the follow-up period was significantly reduced (P < 0.05), while there was no significant difference between the pre-infection and follow-up periods. In terms of the post hoc comparison of the simple time effect of the PHQ score, in the SP population after COVID-19 infection, compared with the pre-COVID-19 infection period, the PHQ scores increased during the post-COVID-19 infection period and at the follow-up (p < 0.05, Table 5). And when compared with the level post-infection, the PHQ score at the follow-up period was significantly decreased (p < 0.05). In the control group, no significant simple time effect was detected at each time point.
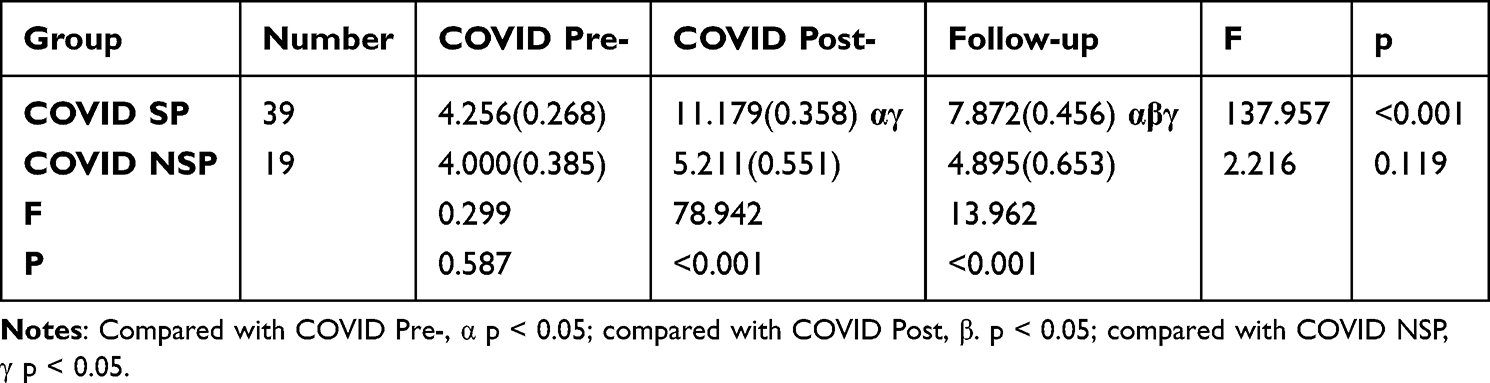 |
Table 3 The PSQI Scores in Group SP and NSP at 3 Time Points in Terms of Mean (Standard Error) |
 |
Table 4 The GAD Scores in Group SP and NSP at 3 Time Points in Terms of Mean (Standard Error) |
 |
Table 5 The PHQ Scores in Group SP and NSP at 3 Time Point in Terms of Mean (Standard Error) |
FC Analysis at Baseline
This study, which utilized the whole-brain voxels based on the Brainnetome Atlas with 246 seed points, revealed that the SP group exhibited significantly higher FC between several brain regions compared with the COVID_NSP group: right precentral gyrus (PrG) and left lateral occipital cortex (LOcC)/right PrG, left inferior parietal lobule (IPL) and right superior frontal gyrus (SFG), and left hippocampus and right inferior frontal gyrus (IFG) (Figure 3A). Additionally, a significant positive correlation was observed regarding the FC for the right hippocampus and right SFG (R2=0.2751, 95% confidence interval: [0.280, 0.699]; peak MNI coordinates: 24, 9, 60; peak intensity: 0.539286; cluster size: 69 voxels; GRF correction [voxel p < 0.005, cluster p < 0.05]) with PSQI score (Table 6 and Figure 3).
 |
Table 6 Cerebral Regions with Differences in FC Between the Two Groups at Baseline |
 |
Figure 3 (A) Schematic diagram of functional differences between the two groups at baseline. (B) PSQI scores showed a positive relationship with FC between the left hippocampus and right SFG (r represents the value of the correlation coefficient). |
FC Analysis at 2-Month Follow-Up
At the 2-month follow-up, FC analyses of whole-brain seed points in the SP group revealed significantly decreased FC between numerous brain regions compared with baseline: Left middle frontal gyrus (MFG) and left superior temporal sulcus (STS), the right orbital gyrus (OrG), right SFG, right middle temporal gyrus (MTG), the left IFG, right cingulate gyrus (CG); the bilateral MFG and contralateral POG; The right MFG and left LOcC; The bilateral IFG and bilateral LOcC; The left superior parietal lobule (SPL) and right fusiform gyrus; The left IPL and right LOcC; The left insula and left IFG; The left medio ventral occipital cortex (MVOcC) and right MFG; The left LOcC and right ORG; the left hippocampus and left IPL; The right BG and right ORG, as well as the right thalamus and right PrG, right IFG. Conversely, FC significantly increased between the left MTG and the right postcentral gyrus (PoG); The right MVOcC and left fusiform gyrus, the contralateral MVOcC; the right parahippocampal gyrus and left MVOcC, as well as the right basal ganglia (BG) and right MFG (Table S2 and Figure 4).
 |
Figure 4 Illustration of changes in FC within the SP group between baseline and the 2-month follow-up. |
Further correlation analysis of these brain regions and clinical scales showed that changes in FC between the right BG and right MFG (R2=0.3801, 95% confidence interval: [−0.779, −0.409]; peak MNI coordinates: 54, −9, −27; peak intensity: −0.5687; cluster size: 63 voxels, GRF correction [voxel p < 0.005, cluster p < 0.05]) were significantly negatively correlated with changes in PSQI scores (Figure 5). These findings indicated that as sleep quality improved, FC in these regions increased. Changes in GAD scores were significantly negatively correlated with changes in FC between the left IFG and right CG/right insula, the left SPL and right IPL or left LOcC, the left LOcC and right precuneus, and the right BG and OrG. These results suggested that increased FC in these regions was associated with improvements in anxiety symptoms. Conversely, the FC between the left LOcC and right MVOcC, the left MVOcC and right IFG, and the left LOcC and IPL showed positive correlations with GAD scores, indicating that decreased FC in these regions was related to anxiety improvement (Table S3 and Figure S2). Changes in PHQ scores were negatively correlated with changes in FC between the right MFG and left SFG/right PCun, the left MVOcC and right IFG, and the left LOcC and right SFG. Conversely, changes in FC between the left MTG and bilateral ITG were positively correlated with changes in PHQ scores (Table S4 and Figure S3).
 |
Figure 5 Relationship between changes in FC and PSQI scores at the 2-month follow-up. |
No significant differences were observed in the follow-up analysis of the NSP group compared with the SP group (GRFcorrection, Cluster p > 0.05). Additionally, no significant differences were observed between the baseline and 2-month follow-up assessments within the NSP group (GRFcorrection, Cluster p > 0.05).
The RM -ANOVA Analysis of Rs-FC
For the brain rs-FC, we extracted the FC value between the right PrG and PrG/LoCC, between the left hippocampus and the right IFG, and between the left IPL and the right SFG in the two groups of people at different time points. The repeated measures analysis of variance found that for the FC between the right PrG and PrG, there was a significant time main effect (F = 5.040, P = 0.029), an interaction effect (F = 5.103, P = 0.028), but the between-subjects effect was not significant. Moreover, for the functional connectivity directly between the right PrG and the left LoCC, no significant time main effect, interaction effect, and between-groups effect were found. For the functional connectivity between the left IPL and the right SFG, there was a significant time interaction effect (F = 6.460, p = 0.014) and a significant between-subjects effect (F = 12.052, p = 0.001), but there was no significant time main effect. For the functional connectivity between the left hippocampus and the right IFG, there was a significant time interaction effect (F = 10.804, p = 0.002), and there was no significant time main effect and group main effect (see Tables S5–S8 and Figure 6 for details).
 |
Figure 6 Repeated measures analysis of variance, the changes in the scores of each scale at different time points. |
Discussion
In the scale analysis across the three time points within this study, it was observed that the PSQI, GAD, and PHQ scores among the COVID_SP population exhibited varying degrees of elevation subsequent to COVID-19 infection and demonstrated a slight reduction following the two-month follow-up. Our findings align with those of prior research.46,47 This potentially implied that COVID-19 infection exerted a dynamic influence on the sleep, anxiety, and depressive states of individuals. As time progresses, these conditions underwent certain alterations. The interaction effect between the group and time indicated that the COVID_SP and COVID_NSP groups possess distinct recovery patterns in the aftermath of COVID-19 infection. Sleep issues might potentially impede the individual’s recovery trajectory, both from a psychological and physiological perspective. Moreover, disparities in the initial conditions or the susceptibility to COVID-19 infection between the two groups could potentially stem from sleep problems per se or other underlying factors. In this study, we investigated the neuroimaging characteristics of individuals with SP after COVID-19 using a data-driven approach. Seed-based FC analyses revealed abnormal FC patterns in these individuals at baseline, primarily concentrated in the PrG, IPL, and hippocampus. The PrG was involved in motor control and execution.48 Reduced FC within the PrG might cause disruptions in the coordination and executive control of these functions. The LOcC, as part of the visual cortex,49 also played a crucial role in motor execution.50 Increased FC in these areas might be associated with alterations in motor execution function among post-COVID-19 SP patients.51 The IPL was a functionally diverse brain region involved in various cognitive and perceptual functions, including spatial processing, attentional control, visual processing, mathematical processing, and language processing. It had also been linked to motor intention.52 FC between the IPL and SFG was associated with working memory, attentional control, and decision-making processes.53 The hippocampus was essential for memory and cognitive functions; the left hippocampus was particularly involved in verbal memory.54,55 We found that increased FC between the left hippocampus and right SFG was negatively correlated with sleep quality. The SFG was important for executive control and working memory. Altered FC within this circuit might indicate abnormal changes in episodic and working memory.56 Similar FC elevations had been observed in individuals with primary sleep problems.57 Abnormalities in the FC of these brain regions might indicate disturbances in executive function, decision-making, and memory processes during and after COVID-19, contributing to SP onset. These findings might be related to the effects of SARS-CoV-2, which could cause cerebral small vessel vasculitis and cerebellar encephalitis,58–61 along with abnormalities in cerebral metabolic function.62 These alterations can lead to changes in brain function and structure, ultimately resulting in corresponding clinical symptoms.
In the COVID-SP population, a two-month follow-up revealed that the functional connectivity changes of multiple brain networks were intertwined with sleep and emotions. At the 2-month follow-up, changes in FC primarily were evident in regions such as the frontal lobe, MTG, SPL and IPL, hippocampus, BG, thalamus, posterior cingulate cortex, MVOcC and LOcC. These regions were widely distributed across the central executive, default mode, sensorimotor, and visual networks; they were involved in emotion regulation, task decision-making, execution, visual processing, and memory.63 The BG and thalamus are multifunctional brain regions that participate in neural regulation related to sensations, movement, vision, attention, and emotions;64–66 These intra- and inter-network functional connectivity alterations were closely associated with sleep problems and emotional regulation. For instance, changes in the functional connectivity of frontal lobe-related regions within the central executive network (CEN) could have induced executive dysfunction, concentration difficulties, and task-switching impairments. Sleep problems could have disrupted the functions of these regions, leading to corresponding clinical manifestations.67,68 Alterations in the connectivity of areas like SPL and IPL in the sensorimotor network could have affected somatic sensory and motor functions,69,70 and abnormal functional connectivity in relevant regions had been identified in some sleep-related studies.71 Additionally, previous research had shown that sleep deprivation causes instability in the intra- and inter-network connectivity of the default mode network.72 These results indicated that the brain function of the COVID-SP group had changed over two months. Such regional brain function variations might have reflected alterations in motor control, spatial navigation, attention control, semantic processing, and spatial memory. The underlying causes could have been the excessive activation of the immune system in the early stage of COVID-19 infection, triggering a neuroinflammatory response, along with metabolic disorders, neurotransmitter imbalances, and potential hypoxic states, which damaged or weakened synaptic connections between neurons. Over time, the recovery of neuronal repair and immune system mechanisms had led to these brain function changes. However, this was merely a theoretical speculation, and further research and exploration were needed to clarify their relationship, offering a comprehensive and profound understanding of the long-term impacts and recovery mechanisms of COVID-19 infection on the brain.
Furthermore, this study showed that the FC between the right BG and right MTG had increased as SP symptoms had improved. This finding suggested that cognitive function and emotional processing had been involved in SP. We also observed that changes in anxiety and depression were associated with the frontal, occipital, and parietal lobes, as well as the BG. The FC in these regions was involved in recovery processes affecting anxiety, depression, and other emotions in individuals with SP after COVID-19. Previous studies had revealed changes in functional connections and structures between the prefrontal cortex, thalamus, and other brain regions, such as the precuneus, in patients with anxiety and depression.73–77 Additionally, dysfunctional brain activity between the parietal and occipital lobes could have contributed to anxiety.78 Our results indicated that improvements in anxiety levels in individuals with SP after COVID-19 had been associated with these changes in brain function in the corresponding regions. However, the deeper reasons behind these changes still awaited our further exploration.
The outcomes of the repeated measures analysis of variance demonstrated that, during the follow-up period, there was no significant time main effect, interaction effect, or between-group effect in the functional connectivity between the right PrG and the left LoCC. This finding implied that such a connection remains relatively stable throughout the recovery process subsequent to COVID-19 infection. It is possible that the connection between the right PrG and the left LoCC did not occupy a central role in modulating sleep issues and anxiety-depressive emotions. Alternatively, its function might predominantly be involved in other physiological or psychological processes that did not experience notable alterations within the short-term follow-up interval after COVID-19 infection. Nevertheless, this did not preclude the potential for changes to emerge in this connection or for its synergistic interactions with other brain regions to be uncovered during a more extended follow-up or more in-depth investigations. Future research could expand the sample size and lengthen the observation period to gain more insights and reveal the implications with advanced techniques for contributions to relevant fields.
Limitations
This study explored the changes in brain function of the population after COVID-19 infection and achieved certain results. However, it should be noted that there were several limitations.
First, there was a lack of magnetic resonance imaging data before COVID-19 infection. Since brain function and structure were in a state of dynamic change, without this crucial baseline reference, it was difficult to accurately attribute the observed changes in brain network functional connectivity and signal intensity abnormalities to COVID-19 infection. After all, some individuals might have had underlying undetected subtle brain lesions originally. Consequently, the interpretation of the causal relationship between COVID-19 and brain changes was full of uncertainties, which seriously undermined the accuracy and reliability of the research conclusions.
Second, the Pittsburgh Sleep Quality Index (PSQI) scores were collected retrospectively, which brought significant bias risks. Retrospective collection depended on the subjects’ memory recall, which was highly subjective. Problems such as memory bias and forgetting of key details occurred frequently. Moreover, there were significant differences in individuals’ subjective perception and description of sleep problems. The lack of real-time and objective records made it difficult for the collected data to accurately reflect the actual sleep state, thus interfering with the precise analysis of the correlation between COVID-19 infection and sleep problems and reducing the persuasiveness of the research results.
Third, no subgroup analysis was conducted for PSQI. PSQI covered multiple dimensions, and different dimension scores corresponded to different types of sleep problems. In the COVID-SP group, since no subgroups were divided, it was impossible to know the unique brain function change patterns corresponding to different sleep problems. This resulted in the loss of crucial information and kept the research on the relationship between sleep and brain function at a superficial level, hindering the formulation of refined diagnosis and treatment plans.
Fourth, ethnic and lifestyle differences were not fully considered throughout the study. Different ethnic groups had different genetic backgrounds, and their brain structures, neurotransmitter systems, and physiological mechanisms for dealing with diseases might be very different. The brain responses after COVID-19 infection might also be different. Lifestyle encompassed various aspects such as exercise, diet, work and rest, and social activities, which were closely related to brain health. Ignoring these factors made it impossible to clarify their regulatory roles in the relationship between COVID-19 infection and brain function changes, thus limiting the universality of the research results.
Fifth, the scanning time from 6:00 to 10:00 p.m. will inevitably have an impact on the study. As the participants have gone through a day’s activities, the fatigue in their bodies and brains gradually accumulates. They are prone to a decline in alertness and an increase in drowsiness. Such changes in physiological states will have a significant impact on the measurement of functional connectivity (FC) of the brain. In addition, physiological functions follow the circadian rhythm, and the body is in the stage of transitioning from an active state during the day to a resting state at night. Many physiological indicators, such as body temperature, blood pressure, and hormone levels, are all changing, and we still do not know for the time being how these changes will affect brain functions.
Finally, the sample size was relatively small, with limited statistical power and extrapolation ability. It was difficult to capture the full picture of brain function changes in the population after COVID-19 infection, and rare but crucial patterns might be missed. When extrapolated to a large population, the uncertainty was high, which limited the application of the research results in the clinical and public health fields.
In conclusion, given these limitations, the results of the study had to be treated with caution and used reasonably. Future research urgently needed to expand the sample size, collect data prospectively, conduct refined subgroup analysis, standardize the scanning time period, and comprehensively incorporate considerations such as ethnic and lifestyle factors, so as to strengthen the research foundation, enhance the robustness of the conclusions, and promote greater progress in COVID-19 brain science research.
Conclusion
This study used MRI data to explore the brain functional changes caused by COVID-19 after pandemic restrictions ended in China. Our main findings are as follows: First, individuals with SP after COVID-19 often experienced negative emotions. Second, altered brain function was evident in individuals with SP after COVID-19; this alteration was partially associated with sleep problems and anxiety. Finally, as time passed, the functional connections within and between multiple brain networks had changed. These changes in the functions of those brain regions were related to the alterations in various abilities like movement and cognition. The underlying mechanisms still needed to be further explored. This study provided a perspective for understanding the impact of COVID-19 on the brain and its recovery mechanisms, laying the foundation for subsequent research and interventions. However, more research was still required to expand the boundaries of our understanding.
Abbreviations
BG, basal ganglia; BOLD, blood oxygen level-dependent; CG, cingulate gyrus; FC, functional connectivity; FWHM, full-width at half-maximum; GAD, Generalized Anxiety Disorder-7; GRF, Gaussian random field; IPL, inferior parietal lobule; ITG, inferior temporal gyrus; LOcC, lateral occipital cortex; MNI, Montreal Neurological Institute; MVOcC, medioventral occipital cortex; OrG, orbital gyrus; PHQ, Patient Health Questionnaire-9; PoG, postcentral gyrus; PrG, precentral gyrus; PSQI, Pittsburgh Sleep Quality Index-9; RM-ANOVA, Repeated-measures analysis of variance; rs-fMRI, resting-state functional magnetic resonance imaging; SFG, superior frontal gyrus; SPM, Statistical Parametric Mapping; SPL, superior parietal lobule; SPSS, Statistical Package for the Social Sciences.
Data Sharing Statement
The datasets used and/or analyzed during the current study are available from the corresponding author upon reasonable request.
Ethics Approval and Consent to Participate
This study was approved by the medical ethics committee of Hunan Provincial People’s Hospital (The First Affiliated Hospital of Hunan Normal University). All methods were performed in accordance with the Declaration of Helsinki and relevant guidelines and regulations. All participants provided written informed consent.
Author Contributions
All authors made a significant contribution to the work reported, whether that is in the conception, study design, execution, acquisition of data, analysis and interpretation, or in all these areas; took part in drafting, revising or critically reviewing the article; gave final approval of the version to be published; have agreed on the journal to which the article has been submitted; and agree to be accountable for all aspects of the work.
Funding
This project was funded by the Hunan Provincial Department of Education (No. 21B0083) and a lateral research project (No. H2023-6).
Disclosure
Hao-bo Chen and Ling Li are co-first authors for this study. The authors declare no competing interests in this work.
References
1. Ye Q, Wang B, Mao J. The pathogenesis and treatment of the `Cytokine Storm’ in COVID-19. J Infect. 2020;80(6):607–613. doi:10.1016/j.jinf.2020.03.037
2. Hu B, Huang S, Yin L. The cytokine storm and COVID-19. J Med Virol. 2021;93(1):250–256. doi:10.1002/jmv.26232
3. Uginet M, Breville G, Assal F, et al. COVID-19 encephalopathy: clinical and neurobiological features. J Med Virol. 2021;93(7):4374–4381. doi:10.1002/jmv.26973
4. Uncini A, Vallat JM, Jacobs BC. Guillain-Barré syndrome in SARS-CoV-2 infection: an instant systematic review of the first six months of pandemic. J Neurol Neurosurg Psychiatry. 2020;91(10):1105–1110. doi:10.1136/jnnp-2020-324491
5. Stein SR, Ramelli SC, Grazioli A, et al. SARS-CoV-2 infection and persistence in the human body and brain at autopsy. Nature. 2022;612(7941):758–763. doi:10.1038/s41586-022-05542-y
6. Wu X, Xiang M, Jing H, Wang C, Novakovic VA, Shi J. Damage to endothelial barriers and its contribution to long COVID. Angiogenesis. 2023:1–18.
7. Capelli S, Caroli A, Barletta A, et al. MRI evidence of olfactory system alterations in patients with COVID-19 and neurological symptoms. J Neurol. 2023;270(3):1195–1206. doi:10.1007/s00415-023-11561-0
8. Douaud G, Lee S, Alfaro-Almagro F, et al. SARS-CoV-2 is associated with changes in brain structure in UK Biobank. Nature. 2022;604(7907):697–707. doi:10.1038/s41586-022-04569-5
9. Ceban F, Ling S, Lui LMW, et al. Fatigue and cognitive impairment in Post-COVID-19 Syndrome: a systematic review and meta-analysis. Brain Behav Immun. 2022;101:93–135. doi:10.1016/j.bbi.2021.12.020
10. Grandner MA. Sleep, health, and society. Sleep Med Clin. 2022;17(2):117–139. doi:10.1016/j.jsmc.2022.03.001
11. Mazza MG, De Lorenzo R, Conte C, et al. Anxiety and depression in COVID-19 survivors: role of inflammatory and clinical predictors. Brain Behav Immun. 2020;89:594–600. doi:10.1016/j.bbi.2020.07.037
12. Pappa S, Ntella V, Giannakas T, Giannakoulis VG, Papoutsi E, Katsaounou P. Prevalence of depression, anxiety, and insomnia among healthcare workers during the COVID-19 pandemic: a systematic review and meta-analysis. Brain Behav Immun. 2020;88:901–907. doi:10.1016/j.bbi.2020.05.026
13. Kennedy KER, Bastien CH, Ruby PM, Killgore WDS, Wills CCA, Grandner MA. Nightmare content during the COVID-19 pandemic: influence of COVID-related stress and sleep disruption in the United States. J Sleep Res. 2022;31(1):e13439. doi:10.1111/jsr.13439
14. Huang Y, Zhao N. Generalized anxiety disorder, depressive symptoms and sleep quality during COVID-19 outbreak in China: a web-based cross-sectional survey. Psychiatry Res. 2020;288:112954. doi:10.1016/j.psychres.2020.112954
15. Linh TTD, Ho DKN, Nguyen NN, Hu CJ, Yang CH, Wu D. Global prevalence of post-COVID-19 sleep disturbances in adults at different follow-up time points: a systematic review and meta-analysis. Sleep Med Rev. 2023;71:101833. doi:10.1016/j.smrv.2023.101833
16. Alkodaymi MS, Omrani OA, Fawzy NA, et al. Prevalence of post-acute COVID-19 syndrome symptoms at different follow-up periods: a systematic review and meta-analysis. Clin Microbiol Infect. 2022;28(5):657–666. doi:10.1016/j.cmi.2022.01.014
17. Stein MB, Belik SL, Jacobi F, Sareen J. Impairment associated with sleep problems in the community: relationship to physical and mental health comorbidity. Psychosom Med. 2008;70(8):913–919. doi:10.1097/PSY.0b013e3181871405
18. Štefan L, Sporiš G, Krističević T. The associations between sleep duration and sleep quality with self-rated health in young adults: a population-based study. Int J Adolesc Med Health. 2018;32(6).
19. Deng J, Zhou F, Hou W, et al. The prevalence of depressive symptoms, anxiety symptoms and sleep disturbance in higher education students during the COVID-19 pandemic: a systematic review and meta-analysis. Psychiatry Res. 2021;301:113863. doi:10.1016/j.psychres.2021.113863
20. Al Mamun F, Hosen I, Misti JM, Kaggwa MM, Mamun MA. Mental disorders of Bangladeshi students during the COVID-19 pandemic: a systematic review. Psychol Res Behav Manag. 2021;14:645–654. doi:10.2147/PRBM.S315961
21. Premraj L, Kannapadi NV, Briggs J, et al. Mid and long-term neurological and neuropsychiatric manifestations of post-COVID-19 syndrome: a meta-analysis. J Neurol Sci. 2022;434:120162. doi:10.1016/j.jns.2022.120162
22. Johansson A, Mohamed MS, Moulin TC, Schiöth HB. Neurological manifestations of COVID-19: a comprehensive literature review and discussion of mechanisms. J Neuroimmunol. 2021;358:577658. doi:10.1016/j.jneuroim.2021.577658
23. Greicius M. Resting-state functional connectivity in neuropsychiatric disorders. Curr Opin Neurol. 2008;21(4):424–430. doi:10.1097/WCO.0b013e328306f2c5
24. Li G, Chen Y, Chaudhary S, et al. Sleep dysfunction mediates the relationship between hypothalamic-insula connectivity and anxiety-depression symptom severity bidirectionally in young adults. Neuroimage. 2023;279:120340. doi:10.1016/j.neuroimage.2023.120340
25. Li G, Zhong D, Li B, Chen Y, Yang L, Li CSR. Sleep deficits inter-link lower basal forebrain-posterior cingulate connectivity and perceived stress and anxiety bidirectionally in young men. Int J Neuropsychopharmacol. 2023;26(12):879–889. doi:10.1093/ijnp/pyad062
26. Best PT, Van Swieten JC, Jiskoot LC, et al. Association of changes in cerebral and hypothalamic structure with sleep dysfunction in patients with genetic frontotemporal dementia. Neurology. 2024;103(11):e209829. doi:10.1212/WNL.0000000000209829
27. Marques DR, Gomes AA, Caetano G, Castelo-Branco M. Insomnia disorder and brain’s default-mode network. Curr Neurol Neurosci Rep. 2018;18(8):45. doi:10.1007/s11910-018-0861-3
28. Díez-Cirarda M, Yus M, Gómez-Ruiz N, et al. Multimodal neuroimaging in post-COVID syndrome and correlation with cognition. Brain. 2023;146(5):2142–2152. doi:10.1093/brain/awac384
29. Bungenberg J, Hohenfeld C, Costa AS, et al. Characteristic functional connectome related to Post-COVID-19 syndrome. Sci Rep. 2024;14(1):4997. doi:10.1038/s41598-024-54554-3
30. Du YY, Zhao W, Zhou XL, et al. Survivors of COVID-19 exhibit altered amplitudes of low frequency fluctuation in the brain: a resting-state functional magnetic resonance imaging study at 1-year follow-up. Neural Regen Res. 2022;17(7):1576–1581. doi:10.4103/1673-5374.327361
31. Du Y, Li C, Zhao W, et al. Multimodal neuroimaging exploration of the mechanisms of sleep quality deterioration after SARS-CoV-2 Omicron infection. BMC Med. 2024;22:271. doi:10.1186/s12916-024-03487-9
32. Qin H, Duan G, Zhou K, et al. Alteration of white matter microstructure in patients with sleep disorders after COVID-19 infection. Sleep Med. 2024;114:109–118. doi:10.1016/j.sleep.2023.12.024
33. Spitzer RL, Kroenke K, Williams JBW, Löwe B. A brief measure for assessing generalized anxiety disorder: the GAD-7. Arch Intern Med. 2006;166(10):1092–1097. doi:10.1001/archinte.166.10.1092
34. Kroenke K, Spitzer RL, Williams JB. The PHQ-9: validity of a brief depression severity measure. J Gen Intern Med. 2001;16(9):606–613. doi:10.1046/j.1525-1497.2001.016009606.x
35. Buysse DJ, Reynolds CF, Monk TH, Berman SR, Kupfer DJ. The Pittsburgh sleep quality index: a new instrument for psychiatric practice and research. Psychiatry Res. 1989;28(2):193–213. doi:10.1016/0165-1781(89)90047-4
36. Wang W, Bian Q, Zhao Y, et al. Reliability and validity of the Chinese version of the patient health questionnaire (PHQ-9) in the general population. Gen Hosp Psychiatry. 2014;36(5):539–544. doi:10.1016/j.genhosppsych.2014.05.021
37. Sun J, Liang K, Chi X, Chen S. Psychometric properties of the generalized anxiety disorder scale-7 item (GAD-7) in a large sample of Chinese adolescents. Healthcare. 2021;9(12):1709. doi:10.3390/healthcare9121709
38. Zheng B, Li M, Wang KL, Lv J. Analysis of the reliability and validity of the Chinese version of Pittsburgh sleep quality index among medical college students. Beijing Da Xue Xue Bao Yi Xue Ban. 2016;48(3):424–428.
39. Liu X. Reliability and validity of the Pittsburgh sleep quality index. Chin J Psychiatry. 1996;29:103.
40. Yin X, Li W, Liang T, et al. Effect of electroacupuncture on insomnia in patients with depression: a randomized clinical trial. JAMA Netw Open. 2022;5(7):e2220563.
41. Zhao J, Ji Y, Zuo Y, et al. Association of oxidative stress and proinflammation with insomnia in perimenopause. J Womens Health. 2024;33(3):379–387. doi:10.1089/jwh.2023.0316
42. Parkes L, Fulcher B, Yücel M, Fornito A. An evaluation of the efficacy, reliability, and sensitivity of motion correction strategies for resting-state functional MRI. Neuroimage. 2018;171:415–436. doi:10.1016/j.neuroimage.2017.12.073
43. Ashburner J. A fast diffeomorphic image registration algorithm. Neuroimage. 2007;38(1):95–113. doi:10.1016/j.neuroimage.2007.07.007
44. Fan L, Li H, Zhuo J, et al. The human brainnetome atlas: a new brain atlas based on connectional architecture. Cereb Cortex. 2016;26(8):3508–3526. doi:10.1093/cercor/bhw157
45. Worsley KJ, Marrett S, Neelin P, Vandal AC, Friston KJ, Evans AC. A unified statistical approach for determining significant signals in images of cerebral activation. Hum Brain Mapp. 1996;4(1):58–73. doi:10.1002/(SICI)1097-0193(1996)4:1<58::AID-HBM4>3.0.CO;2-O
46. Daly M, Sutin AR, Robinson E. Longitudinal changes in mental health and the COVID-19 pandemic: evidence from the UK household longitudinal study. Psychol Med. 2022;52(13):2549–2558. doi:10.1017/S0033291720004432
47. Cénat JM, Farahi SMMM, Dalexis RD, et al. The global evolution of mental health problems during the COVID-19 pandemic: a systematic review and meta-analysis of longitudinal studies. J Affect Disord. 2022;315:70–95. doi:10.1016/j.jad.2022.07.011
48. Chouinard PA, Paus T. The primary motor and premotor areas of the human cerebral cortex. Neuroscientist. 2006;12(2):143–152. doi:10.1177/1073858405284255
49. Berlucchi G. Visual interhemispheric communication and callosal connections of the occipital lobes. Cortex. 2014;56:1–13. doi:10.1016/j.cortex.2013.02.001
50. Lingnau A, Downing PE. The lateral occipitotemporal cortex in action. Trends Cognit Sci. 2015;19(5):268–277. doi:10.1016/j.tics.2015.03.006
51. Melton MS, Browndyke JN, Harshbarger TB, Madden DJ, Nielsen KC, Klein SM. Changes in brain resting-state functional connectivity associated with peripheral nerve block: a pilot study. Anesthesiology. 2016;125(2):368–377. doi:10.1097/ALN.0000000000001198
52. Desmurget M, Sirigu A. Conscious motor intention emerges in the inferior parietal lobule. Curr Opin Neurobiol. 2012;22(6):1004–1011. doi:10.1016/j.conb.2012.06.006
53. Wang Y, Bernanke J, Peterson BS, et al. The association between antidepressant treatment and brain connectivity in two double-blind, placebo-controlled clinical trials: a treatment mechanism study. Lancet Psychiatry. 2019;6(8):667–674. doi:10.1016/S2215-0366(19)30179-8
54. Knierim JJ. The hippocampus. Curr Biol. 2015;25(23):R1116–R1121. doi:10.1016/j.cub.2015.10.049
55. Robinson JL, Salibi N, Deshpande G. Functional connectivity of the left and right hippocampi: evidence for functional lateralization along the long-axis using meta-analytic approaches and ultra-high field functional neuroimaging. Neuroimage. 2016;135:64–78. doi:10.1016/j.neuroimage.2016.04.022
56. Eichenbaum H. Prefrontal-hippocampal interactions in episodic memory. Nat Rev Neurosci. 2017;18(9):547–558. doi:10.1038/nrn.2017.74
57. Cheng W, Rolls ET, Ruan H, Feng J. Functional connectivities in the brain that mediate the association between depressive problems and sleep quality. JAMA Psychiatry. 2018;75(10):1052–1061. doi:10.1001/jamapsychiatry.2018.1941
58. Owens CD, Pinto CB, Detwiler S, et al. Cerebral small vessel disease pathology in COVID-19 patients: a systematic review. Ageing Res Rev. 2023;88:101962. doi:10.1016/j.arr.2023.101962
59. Radke J, Meinhardt J, Aschman T, et al. Proteomic and transcriptomic profiling of brainstem, cerebellum and olfactory tissues in early- and late-phase COVID-19. Nat Neurosci. 2024;27(3):409–420. doi:10.1038/s41593-024-01573-y
60. Kirschenbaum D, Imbach LL, Rushing EJ, et al. Intracerebral endotheliitis and microbleeds are neuropathological features of COVID-19. Neuropathol Appl Neurobiol. 2021;47(3):454–459. doi:10.1111/nan.12677
61. Zhang PP, He ZC, Yao XH, et al. COVID-19-associated monocytic encephalitis (CAME): histological and proteomic evidence from autopsy. Signal Transduct Target Ther. 2023;8(1):24. doi:10.1038/s41392-022-01291-6
62. Martini AL, Carli G, Kiferle L, et al. Time-dependent recovery of brain hypometabolism in neuro-COVID-19 patients. Eur J Nucl Med Mol Imaging. 2022;50(1):90–102. doi:10.1007/s00259-022-05942-2
63. Bullmore E, Sporns O. Complex brain networks: graph theoretical analysis of structural and functional systems. Nat Rev Neurosci. 2009;10(3):186–198. doi:10.1038/nrn2575
64. Graybiel AM. The basal ganglia: learning new tricks and loving it. Curr Opin Neurobiol. 2005;15(6):638–644. doi:10.1016/j.conb.2005.10.006
65. Albin RL, Young AB, Penney JB. The functional anatomy of basal ganglia disorders. Trends Neurosci. 1989;12(10):366–375. doi:10.1016/0166-2236(89)90074-X
66. Halassa MM, Kastner S. Thalamic functions in distributed cognitive control. Nat Neurosci. 2017;20(12):1669–1679. doi:10.1038/s41593-017-0020-1
67. Pesoli M, Rucco R, Liparoti M, et al. A night of sleep deprivation alters brain connectivity and affects specific executive functions. Neurol Sci. 2022;43(2):1025–1034. doi:10.1007/s10072-021-05437-2
68. Krause AJ, Simon EB, Mander BA, et al. The sleep-deprived human brain. Nat Rev Neurosci. 2017;18(7):404–418. doi:10.1038/nrn.2017.55
69. Fogassi L, Luppino G. Motor functions of the parietal lobe. Curr Opin Neurobiol. 2005;15(6):626–631. doi:10.1016/j.conb.2005.10.015
70. Cheng L, Zhang Y, Li G, et al. Connectional asymmetry of the inferior parietal lobule shapes hemispheric specialization in humans, chimpanzees, and rhesus macaques. Elife. 2021;10:e67600.
71. Chen J, Gong X, Wang L, et al. Altered postcentral connectivity after sleep deprivation correlates to impaired risk perception: a resting-state functional magnetic resonance imaging study. Brain Sci. 2023;13(3):514. doi:10.3390/brainsci13030514
72. De Havas JA, Parimal S, Soon CS, Chee MWL. Sleep deprivation reduces default mode network connectivity and anti-correlation during rest and task performance. Neuroimage. 2012;59(2):1745–1751. doi:10.1016/j.neuroimage.2011.08.026
73. Wang T, Yan J, Li S, et al. Increased insular connectivity with emotional regions in primary insomnia patients: a resting-state fMRI study. Eur Radiol. 2017;27(9):3703–3709. doi:10.1007/s00330-016-4680-0
74. Meng Y, Lui S, Qiu C, et al. Neuroanatomical deficits in drug-naïve adult patients with generalized social anxiety disorder: a voxel-based morphometry study. Psychiatry Res. 2013;214(1):9–15. doi:10.1016/j.pscychresns.2013.06.002
75. Karim H, Tudorascu DL, Aizenstein H, Walker S, Good R, Andreescu C. Emotion reactivity and cerebrovascular burden in late-life GAD: a neuroimaging study. Am J Geriatr Psychiatry. 2016;24(11):1040–1050. doi:10.1016/j.jagp.2016.07.015
76. Alexopoulos GS. Depression in the elderly. Lancet. 2005;365(9475):1961–1970. doi:10.1016/S0140-6736(05)66665-2
77. Ding YD, Chen X, Chen ZB, et al. Reduced nucleus accumbens functional connectivity in reward network and default mode network in patients with recurrent major depressive disorder. Transl Psychiatry. 2022;12(1):236. doi:10.1038/s41398-022-01995-x
78. Picó-Pérez M, Radua J, Steward T, Menchón JM, Soriano-Mas C. Emotion regulation in mood and anxiety disorders: a meta-analysis of fMRI cognitive reappraisal studies. Prog Neuropsychopharmacol Biol Psychiatry. 2017;79(Pt B):96–104. doi:10.1016/j.pnpbp.2017.06.001
 © 2025 The Author(s). This work is published and licensed by Dove Medical Press Limited. The
full terms of this license are available at https://www.dovepress.com/terms.php
and incorporate the Creative Commons Attribution
- Non Commercial (unported, 3.0) License.
By accessing the work you hereby accept the Terms. Non-commercial uses of the work are permitted
without any further permission from Dove Medical Press Limited, provided the work is properly
attributed. For permission for commercial use of this work, please see paragraphs 4.2 and 5 of our Terms.
© 2025 The Author(s). This work is published and licensed by Dove Medical Press Limited. The
full terms of this license are available at https://www.dovepress.com/terms.php
and incorporate the Creative Commons Attribution
- Non Commercial (unported, 3.0) License.
By accessing the work you hereby accept the Terms. Non-commercial uses of the work are permitted
without any further permission from Dove Medical Press Limited, provided the work is properly
attributed. For permission for commercial use of this work, please see paragraphs 4.2 and 5 of our Terms.