")
Back to Journals » Patient Related Outcome Measures » Volume 16
Health-Related Quality of Life in Long COVID: Mapping the Condition-Specific C19-YRSm Measure Onto the EQ-5D-5L
Authors Smith AB , Greenwood DC , Williams P, Kwon J , Petrou S, Horton M , Osborne T, Milne R, Sivan M
Received 16 September 2024
Accepted for publication 3 January 2025
Published 25 January 2025 Volume 2025:16 Pages 55—66
DOI https://doi.org/10.2147/PROM.S490870
Checked for plagiarism Yes
Review by Single anonymous peer review
Peer reviewer comments 2
Editor who approved publication: Dr Robert Howland
Adam B Smith,1 Darren C Greenwood,1,2 Paul Williams,3 Joseph Kwon,4 Stavros Petrou,4 Mike Horton,5 Thomas Osborne,5 Ruairidh Milne,6 Manoj Sivan5,7,8 On behalf of LOCOMOTION Consortium
1Leeds Institute for Cardiovascular and Metabolic Medicine, School of Medicine, University of Leeds, Leeds, United Kingdom; 2Leeds Institute for Data Analytics, University of Leeds, Leeds, UK; 3COVID Assessment and Rehabilitation Service, Hertfordshire Community NHS Trust, Welwyn Garden City, UK; 4Nuffield Department of Primary Care Health Sciences, University of Oxford, Oxford, UK; 5Academic Department of Rehabilitation Medicine, Leeds Institute of Rheumatic and Musculoskeletal Medicine, University of Leeds, Leeds, UK; 6Person with Long COVID; Public Health, University of Southampton, Southampton, UK; 7COVID Rehabilitation Service, Leeds Community Healthcare NHS Trust, Leeds, UK; 8National Demonstration Centre of Rehabilitation Medicine, Leeds Teaching Hospitals NHS Trust, Leeds, UK
Correspondence: Adam B Smith, Leeds Institute for Cardiovascular and Metabolic Medicine, School of Medicine, University of Leeds, Leeds, United Kingdom, Email [email protected]
Background: Long COVID (LC) is a clinical syndrome with persistent, fluctuating symptoms subsequent to COVID-19 infection. LC has significant detrimental effects on health-related quality of life (HRQoL), activities of daily living (ADL), and work productivity. Condition-specific patient-reported outcome measures (PROMs), such as the modified COVID-19 Yorkshire Rehabilitation Scale (C19-YRSm) do not provide the health utility data required for cost-utility analyses of LC interventions. The aim of this study was to derive a mapping algorithm for the C19-YRSm to enable health utilities to be generated from this PROM.
Methods: Data were collected from a large study evaluating LC services in the UK. A total of 1434 people with LC had completed both the C19-YRSm and the EQ-5D. Correlation and linear regression analyses were applied to determine items from the C19-YRSm and covariates for inclusion in the algorithm. Model fit, mean differences across the range of EQ-5D-3L utility scores, and Bland-Altman plots were evaluated. Responsiveness (standardised response mean; SRM) of the mapped utilities was investigated on a subset of participants with repeat assessments.
Results: There was a strong level of association between 8 items and one domain on the C19-YRSm with the EQ-5D single-item dimensions. Model fit was good (R2 = 0.7). The mean difference between observed and mapped scores was < 0.10 for the range from 0 to 1 indicating good targeting for positive values of the EQ-5D-3L. The SRM for the mapped EQ-5D-3L was 0.37 compared to 0.17 for the observed utility scores, suggesting the mapped EQ-5D-3L is more responsive to change.
Conclusion: A simple, responsive, and robust mapping algorithm was developed to generate enable EQ-5D-3L health utilities from the C19-YRSm. This will facilitate economic evaluations of LC interventions, treatment, and management, as well as further helping to describe and characterise patients with LC irrespective of any treatment and interventions.
Keywords: Post-COVID Syndrome, mapping, EQ-5D-5L, C19-YRSm, health utilities
Background
Long COVID (LC) is a clinical syndrome with persistent symptoms beyond four weeks after a confirmed or possible COVID-19 infection.1 The term was coined by patients and encompasses the National Institute for Health and Care Excellence (NICE) defined terms, ‘ongoing symptomatic COVID-19’ (persistent symptoms 4–12 weeks after the infection) and “Post-COVID Syndrome (PCS)” (symptoms persisting beyond 12 weeks after infection).2,3 As per the last official survey, there are an estimated 2 million cases of LC in the UK alone and an estimated 200 million cases worldwide.4 LC is a multisystem syndrome with more than 200 symptoms reported across 10 organ systems with common symptoms being fatigue, pain, breathlessness, brain fog (cognitive problems), sleep problems, anxiety, and depression.5 It is a fluctuating condition with a protracted course in some individuals causing significant distress and disability to the individual.6 LC has detrimental effects on health-related quality of life (HRQoL) and activities of daily living, including individual’s work productivity and potentially their caregivers.7,8
A number of condition-specific patient-reported outcome measures (PROMs) have been developed to capture the multi-symptom nature of the condition and its impact on HRQoL.9–12 The COVID-19 Yorkshire Rehabilitation Scale (C19-YRS) was one of the first condition-specific HRQoL measures for LC reported in the literature and provides a symptom severity score, functional disability score, other symptoms score, and overall health score.13–15 Following a psychometric analysis of the C19-YRS, a modified version of the measure is now in use (C19-YRSm).9 The validity, reliability and responsiveness of the C19-YRSm have been demonstrated to be satisfactory in recent studies with excellent internal consistency (Appendix 2).16–20
Although PROMs such as the C19-YRSm provide measures of HRQoL in LC, health technology assessment (HTA) agencies that focus on the evaluation of interventions, as well as health service planners require preference-based HRQoL measures that generate health utilities21 for the purposes of cost-utility analyses. Health utilities describe HRQoL on a metric indexed at 0, representing death, and 1, representing perfect or full health, whereas utilities <0 reflect states deemed worse than dead. One of the most commonly employed preference-based HRQoL measures is the EQ-5D.22,23 The EQ-5D generates generic health utilities applicable to general and clinical populations. This enables the comparison of interventions targeting different diseases in terms of their relative impact on HRQoL, measured using the EQ-5D, and survival benefits. Although the EQ-5D has been used in LC,24,25 there may be instances necessitating health utilities, such as for health economic evaluations, where data have been collected with condition-specific PROMs, but not the EQ-5D. Furthermore, there is some recent evidence that has suggested that the EQ-5D may not be as sensitive or responsive to change in health status among LC patients as the condition-specific C19-YRSm.20 An expedient is therefore needed to translate scores from the LC-specific C19-YRSm to the EQ-5D to derive health utilities. Mapping or cross-walking is one such approach enabling26 health utilities to be obtained from condition-specific, non-preference-based HRQoL measures.27,28
There is, consequently, a need to evaluate the HRQoL of LC patients derived from generic and condition-specific measures, and explore the mechanism by which HRQoL outcomes derived from condition-specific measures may be transformed into health utilities for health economic evaluations. The aim of this study was therefore to compare EQ-5D with C19-YRSm and to develop a mapping algorithm for the C19-YRSm onto the EQ-5D to enable utility values to be generated from responses to the C19-YRSm.
Methods
The data for this study were collected from the LOng COvid Multidisciplinary consortium Optimising Treatments and servIces acrOss the NHS (LOCOMOTION) study.29 LOCOMOTION is a prospective mixed-methods study involving 10 Long COVID services across the United Kingdom. Ethics approval for the LOCOMOTION study was obtained from the Bradford and Leeds Research Ethics Committee on behalf of Health Research Authority and Health and Care Research Wales (reference: 21/YH/0276).
Participants with a diagnosis of LC receiving treatment and management of the condition from one of the 10 participating LC services were recruited and registered on a digital PROM (DPROM) platform developed by the digital health company ELAROS 24/7 Ltd (ELAROS) and the University of Leeds.30 Although different services offered a variety of different PROMs via the platform, the C19-YRSm and EQ-5D-5L were the minimum number of PROMs each participant had to complete at registration and every 3 months thereafter. Participants received reminders via the platform portal to complete the PROMs. The study complied with the Declaration of Helsinki.
Instruments
COVID-19 Yorkshire Rehabilitation Scale – Modified (C19-YRSm)
The C19-YRSm is a 17-item instrument9 designed to capture the key symptoms of LC and its impact on activities of daily living and overall health. The items comprise four subscales: Symptom Severity (SS, 10 scored items), Functional Disability (FD, 5 items), Overall Health (OH, a single item), and Other Symptoms (OS). Previous research has demonstrated the C19-YRSm to be a well-validated PROM with robust psychometric properties.16,20
The items in the SS subscale comprise the following domains: breathlessness (4 items), cough/throat sensitivity/voice change (2 items), fatigue (one item), smell/taste (2 items), pain/discomfort (five items), cognition (three items), palpitations/dizziness (two items), post-exertional malaise (one item), anxiety/mood (five items), and sleep (one item). FD consists of 5 single items: communication, walking/moving around, personal care, other activities of daily living, and social role. Although the SS subscale contains 26 items, these are scored as 10 ‘domain’ items, where the highest value within each of the domains is used (eg, breathlessness, pain/discomfort).
Responses on the SS and FD subscales are rated on a 0 (no symptom or dysfunction) to 3 (severe life-disturbing symptom or dysfunction) Likert scale. Higher scores on both these subscales indicate worse symptomatology and poorer functioning. Responses on the OH subscale are scored on a 0–10 Likert scale (0 being “worst health” and 10 being “best health”) with higher scores indicating better health. OS over the last 7 days are also captured from a list of 26 additional symptoms.9
The EuroQol 5D-5L (EQ-5D-5L)
The EuroQol EQ-5D-5L is a preference-based HRQoL instrument with five dimensions: Mobility, Usual Activities, Selfcare, Pain/Discomfort, and Anxiety/Depression.22 It has five response categories for each dimension, ranging from 1 (no problems) to 5 (severe problems). Responses to each dimension are collated into a profile score, which is converted into a health utility or index score using a country-specific algorithm (tariff or value set). Utilities reflect societal preferences for health states and are measured on a metric indexed at 0 (dead) to 1 (perfect health). Utility values less than 0, indicating states worse than dead, are also captured. The EQ-5D-5L also comprises a visual analogue scale (VAS) measuring self-reported current health on a scale from 0 (“worst health”) to 100 (“best health”). The EQ-VAS was not used in the mapping analysis.
The EQ-5D-5L scores were converted into EQ-5D-3L utilities23 using the crosswalk (CW) algorithm to derive UK utility values.31 The UK utility values were derived using the approach recommended by NICE, which currently consists of applying a validated mapping function onto the UK EQ-5D-3L tariff set that has been developed by the NICE Decision Support Unit.32
Data
Data for the current research were collated from the LOCOMOTION study. Two datasets were derived for the analysis. For the primary analysis, ie, derivation of the mapping algorithm, data were extracted for patients who had completed the C19-YRSm and EQ-5D-5L only once (at the same assessment point, ie, on the same day). This sample was then randomly split into two further, equally numbered, subsets to create estimation and validation subsets for the mapping algorithm.
A second sample was generated from patients with multiple, contemporaneous assessments on both the C19-YRSm and EQ-5D-5L. This sample was used to evaluate the responsiveness, or sensitivity to change, of the mapped health utility values derived from the C19-YRSm relative to those of the actual EQ-5D-5L utilities (see below).
Statistical Analysis
Basic clinical and sociodemographic details were extracted from the primary dataset (participants with a single set of assessments) and summarised in frequency counts and percentages. Scores on the C19-YRSm domains (SS, FD, and OH) and EQ-5D-3L were summarised for the first assessment (“baseline”) using means, standard deviations (SD) and 95% confidence intervals (CIs).
The development and reporting of the mapping algorithm was undertaken in accordance with the MAPS (MApping onto Preference-based measures reporting Standards) statement.33 Spearman rank correlation was used to evaluate the level of association between the individual C19-YRSm items and the EQ-5D-3L index (utility) scores. C19-YRSm items with moderate-to-high levels of association with the EQ-5D-3L utility scores (r > 0.5) were included in the mapping models (see below).
In addition to this, univariate linear (ordinary least squares, OLS) regression models (using the training data subset) were applied to potential predictors from the sociodemographic and clinical variables: age, sex, ethnicity, number of pre-COVID comorbid medical conditions, as well as OH from the C19-YRSm. OS was omitted from this analysis as this optional subscale – which lists a total of 26 symptoms potentially affecting individuals with LC – is not always implemented or utilised in clinical practice. The statistical significance for the included variables was evaluated at p <0.10 for inclusion in the regression models.
Two OLS regression models were evaluated: 1) the full model comprising all C19-YRSm items, OH, and the sociodemographic and clinical variables; 2) the parsimonious model based on items from the C19-YRSm (r > 0.5) and OH.
Model fit was evaluated with the following: R2 and adjusted R2, Akaike Information Criteria (AIC) and log-likelihood statistics. The log-likelihood ratio test was used to determine the relative fit between the two models. The test subset was then utilised to assess the final mapping algorithm. Model fit of the predicted EQ-5D-3L mapped utility values was evaluated using R2, mean absolute error (MAE), and the root mean squared error (RMSE) values. Bootstrapping (10000 replications) was applied to evaluate the RMSE.
The mean difference between predicted and actual EQ-5D-3L health utilities was derived for each of the following range of scores of the EQ-5D-3L utilities to determine how well the predicted values corresponded to actual values across the range of scores: less than −0.2; −0.2 to <0; ≥0 to <0.4; ≥0.4 to <0.6; ≥0.6 to <0.8; and ≥0.8.
The final mapping algorithm was further validated by Bland-Altman plots34 for the actual and predicted EQ-5D-3L health utilities (by plotting the difference between the two forms of health utilities against the mean health utilities). The 95% limits of agreement between the two utility scores were derived (+2SD) as well as the percentage of difference scores falling outside these limits.
Finally, the responsiveness of the mapped EQ-5D-3L health utilities was assessed relative to the actual values using the second dataset. Data were extracted from participants with a first assessment and follow-up assessment at 90 days + 10 days on both instruments. The mapping algorithm was applied to the C19-YRSm variables to derive mapped EQ-5D-3L utility values. Responsiveness was determined through the standardised response mean (SRM) by dividing the change from baseline by the SD of the change. The SRM was used to determine the relative responsiveness of the mapped to actual EQ-5D-3L utilities, with higher SRM values corresponding to greater levels of responsiveness.
Results
Participants
A total of 1434 participants had completed both the C19-YRSm and EQ-5D-3L at a single time point (“first assessment”). The majority of participants were of white ethnicity (87%) and female (68%), the mean age for the sample was 46 years (standard deviation, SD: 14.2 years) (Table 1), and most participants (75%) had no comorbidities prior to LC. The average length of time between the first COVID-19 infection and the first assessment was approximately 430 days (SD: 281 days). A small number of participants had been hospitalised (12%) and admitted to intensive care (3%) as a result of COVID-19 infection. Just over a fifth (22%) had been discharged from the LC services. The mean domain scores on the C19-YRSm and EQ-5D-3L indicated a high level of symptom burden and negative impact on HRQoL resulting from LC.
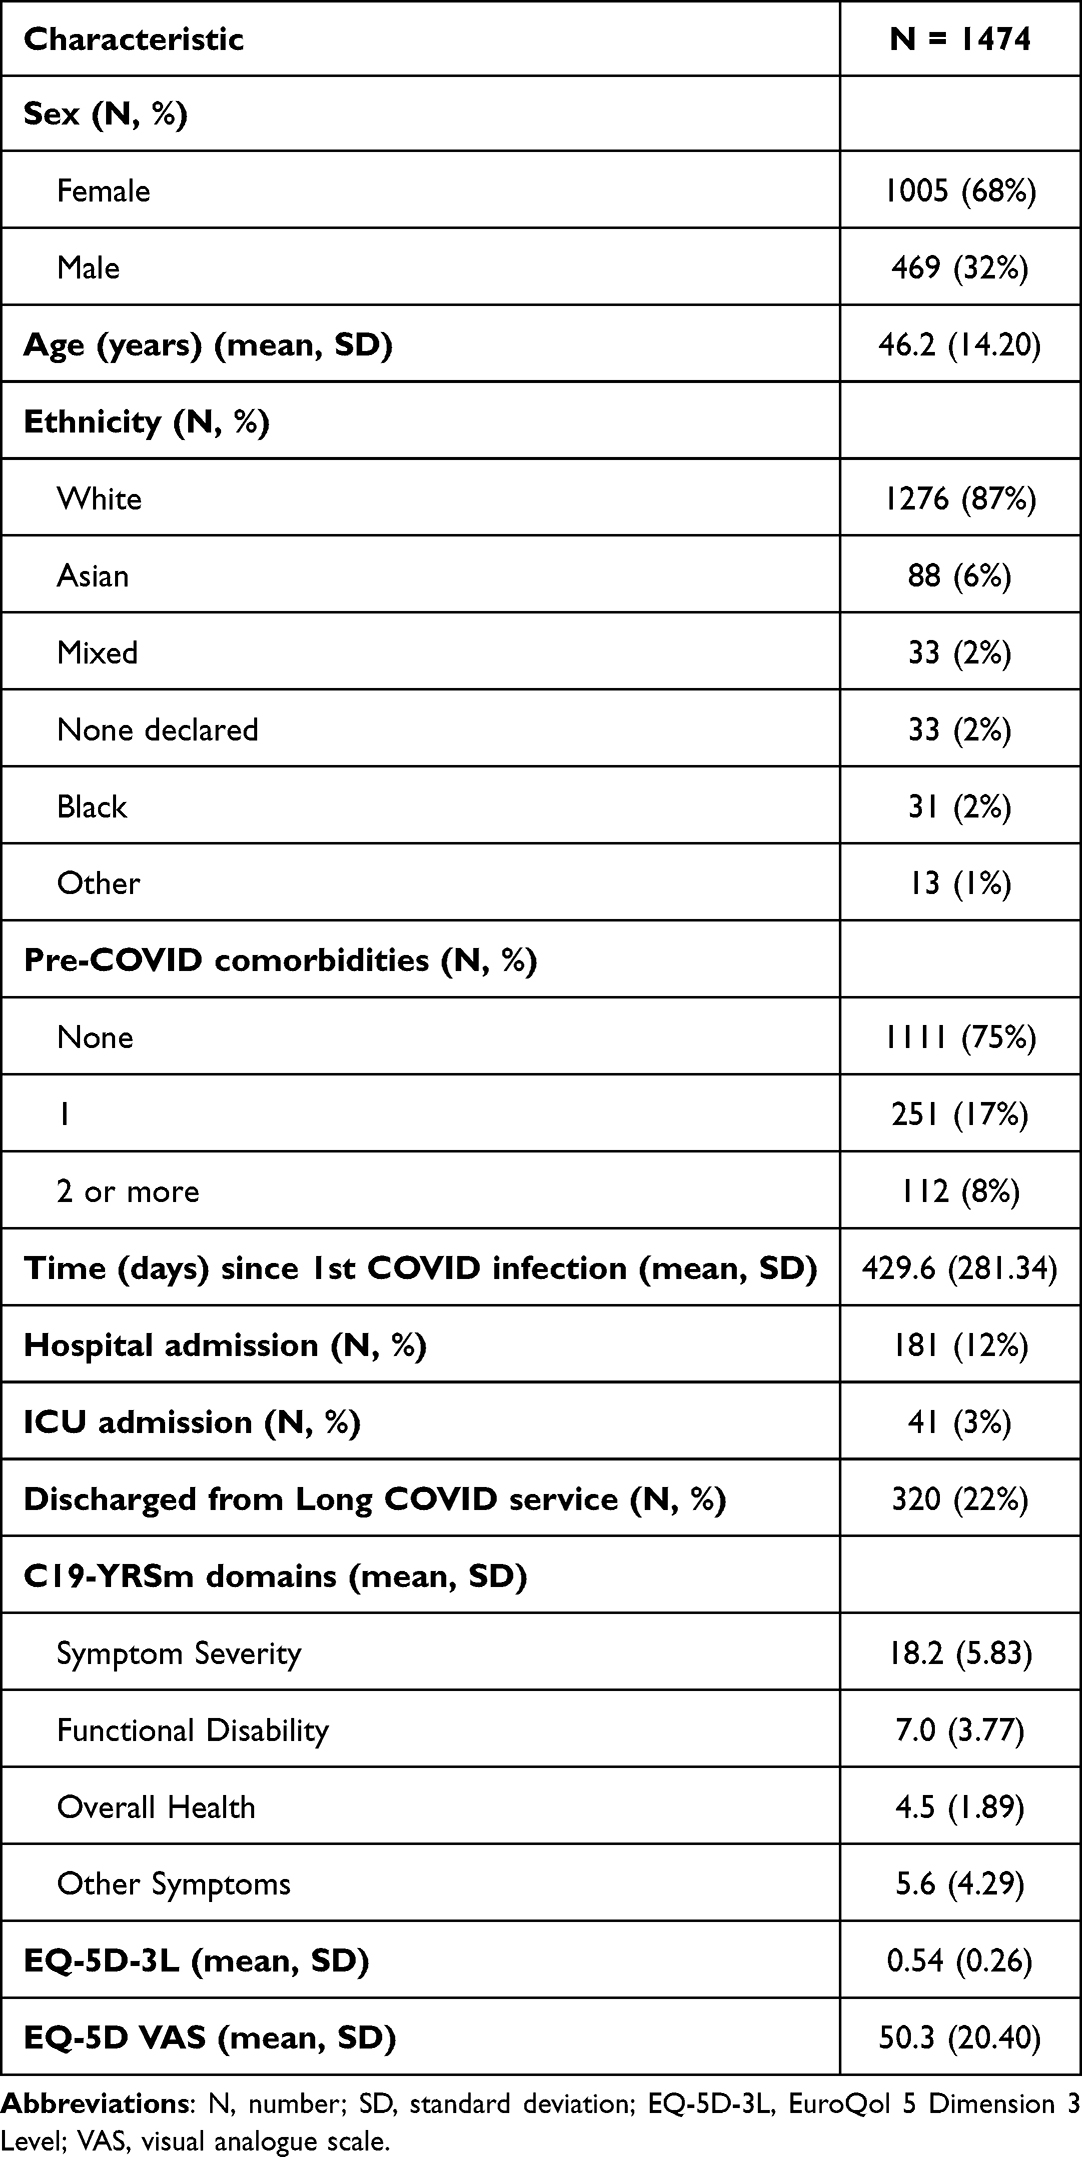 |
Table 1 Clinical and Sociodemographic Details |
Mapping-Potential Predictors
The results of the univariate linear regression analyses revealed the C19-YRSm OH (beta = 0.07, standard error (se) 0.004, p < 0.0001) subscale was a statistically significant predictor for the EQ-5D-3L utility values. Similarly, statistically significant results were also shown for Sex (beta = 0.023, se = 0.02, p = 0.01) and pre-LC comorbidities (beta = −0.069, se = 0.015, p = 0.0002). Neither Ethnicity nor Age was statistically significant (p = 0.31; p = 0.44, respectively). Nevertheless, as potentially important covariates, these were included in the full model alongside Sex, pre-LC comorbidities, and OH.
Mapping Algorithm
The training set for the mapping algorithm comprised 737 participants. The distribution of the EQ-5D-3L health utilities is shown in Figure 1. The mean EQ-5D-3L health utility value was 0.534 (SD: 0.266, minimum: −0.346, maximum: 1; 95% CI: 0.52; 0.56). The interquartile range (25th to 75th centiles) was 0.378 to 0.728.
 |
Figure 1 Distribution of the (Observed) EQ-5D-3L Utility Scores. |
The results of the correlation analysis Supplementary Table 1 showed moderate-to-high levels of association between the FD items and EQ-5D-3L utility scores: “Walking / Moving around” (item Q12, r −0.63), “Personal care” (Q13, r −0.66), “Other Activities of Daily Living” (Q14, r −0.55) and “Social role” (Q15, r −0.58). Similarly, “Muscle pain” (Q5C), “Feeling depressed” (Q9B), and “Breathlessness (on dressing yourself)” (Q1C) also showed good levels of association with the EQ-5D-3L utility scores. “Joint pain” (Q5B) and “Feeling anxious” (Q9A) fell just short of the 0.5 criterion, however, but were included in the model due to the conceptual overlap with the EQ-5D-3L dimensions (“Pain/discomfort” and “Anxiety/Depression”, respectively).
The results of the full and parsimonious models are shown in Supplementary Table 2 and Table 2, respectively. For the full model, R2 was 0.71 and the adjusted R2 0.67 for this model; for the parsimonious model these were R2 0.68 and adjusted R2 0.67, respectively. The (bootstrapped) RMSE was 0.15 (Supplementary Figure 1) and MAE 0.11. The log-likelihood ratio test showed no statistically significant differences in terms of goodness of fit between the two models (X2 82.2, p = 0.32). The parsimonious model was therefore selected as the most appropriate mapping model. The mapping algorithm has been provided in Appendix 1.
 |
Table 2 Regression Coefficients for the Final (Parsimonious) Model |
Predicted EQ-5D-3L
The test set for the mapping algorithm comprised 734 participants. The mean EQ-5D-3L health utility value was 0.54 (SD: 0.264, minimum: −0.346, maximum: 1; 95% CI: 0.52, 0.56). The mean predicted EQ-5D-3L health utility was 0.533 (SD: 0.222, minimum: −0.0571, maximum: 0.945; 95% CI: 0.52, 0.55). The R2 was 0.68 and RMSE 0.15 (Figure 2).
 |
Figure 2 Observed versus Predicted EQ-5D-3L Utility Scores. |
Table 3 shows the mean difference between the actual and predicted EQ-5D-3L health utilities across the range of (observed) EQ-5D-3L utility values. The mean difference between the two sets of scores was < 0.10 for the range from 0 to 1 suggesting a good degree of targeting for positive values of the EQ-5D-3L. The mean differences for values less than 0 were greater, suggesting poorer targeting, which may, however, have been impacted by the smaller number of participants with poor health utilities.
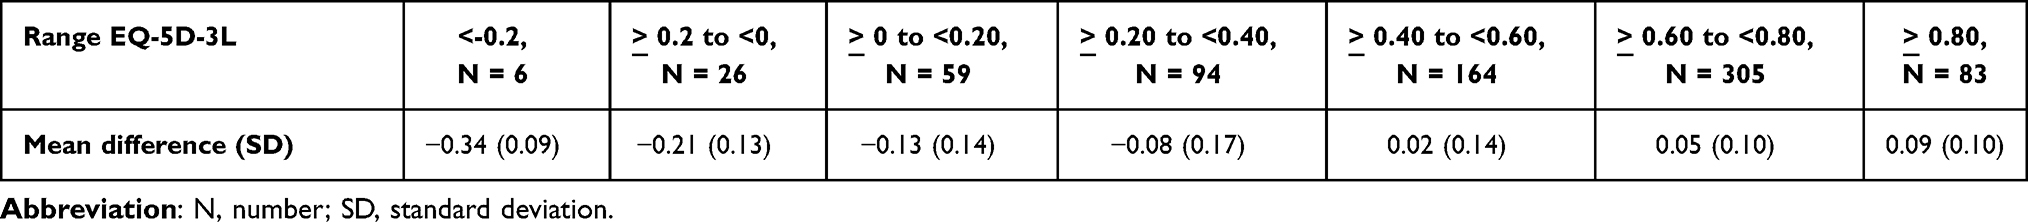 |
Table 3 Mean Difference Between Actual and Predicted EQ-5D-3L by Range of (Observed) EQ-5D-3L |
The Bland-Altman plot is shown in Figure 3. The mean difference between scores was 0.007 (SD: 0.15; 95% CI: −0.004, 0.012) and the limits of agreement were −0.293 and 0.307.
 |
Figure 3 Bland-Altman Plot Observed versus Predicted EQ-5D-3L. |
Finally, there were 85 participants who had completed both instruments at first assessment and 90 days later (± 10 days). The mapping algorithm (Appendix 1) was applied to the C19-YRSm variables. Table 4 shows the mean values for the mapped and observed EQ-5D-3L utility scores. It may be seen than at first assessment the mapped EQ-5D-3L utility values are equal to the observed EQ-5D-3L utility values. At follow-up, both sets demonstrated an improvement in mean health utilities over time with the mapped values showing slightly greater improvement (0.02). The SRM was 0.37 for the mapped EQ-5D-3L health utilities compared to 0.17 for the actual EQ-5D-3L utility scores, suggesting the mapped EQ-5D-3L (based on the C19-YRSm) is more responsive to change.
 |
Table 4 Mean EQ-5D-3L Utility Scores (Mapped and Observed) |
Discussion
The aim of this study was to derive a mapping algorithm to generate preference-based EQ-5D-3L health utilities from the condition-specific C19-YRSm in people with LC. The mapping algorithm demonstrated very good face validity in terms of the selected final items and domain from the C19-YRSm with a high degree of correspondence with the single-item dimensions on the EQ-5D-3L. The items from the C19-YRSm in the final model, such as walking or moving around (item 12A), personal care (13A), activities of daily living (14A) social role (15A), as well as anxiety, depression (9A, 9B), and (joint and muscle) pain (5B and C), strongly overlapped with the corresponding dimension items in the EQ-5D. The OH item in the C19-YRSm captured the more general HRQoL aspects of people experiencing LC.
The final mapping algorithm model showed good overall fit on the criterion indices (R2 and RMSE). There was furthermore a high degree of agreement (little bias) between the predicted and actual EQ-5D-3L health utilities with approximately only 5% of the differences between these estimates falling outside 2 standard deviations. The results of the final analysis revealed that the SRM of mapped utility values was greater than those for the observed EQ-5D-3L utility values, suggesting that the mapped measures were more responsive to change. Although the latter should perhaps be interpreted with a degree of caution given the relatively small sample size, greater responsiveness of the C19-YRSm to change relative to the EQ-5D has been previously demonstrated.20 Condition-specific PROMs such as the C19-YRSm have been designed to target the symptoms and functions most relevant to LC. Given the fluctuating nature of LC,5,6,35 it is more likely that LC-specific PROMS will be better able to detect change in LC symptom and functioning relative to generic PROMs. The results of this study therefore underline the fact that condition-specific PROMs are more sensitive and responsive to symptom and functional changes being experienced by people with LC than their generic counterparts, a particularly salient point given the widespread use of, for instance, the EQ-5D in LC.36
Some potential limitations should be highlighted, including the fact that both the estimation and validation data were drawn from the same sample with no external validation set. This may have introduced a degree of bias in the parameter estimates. A possible concomitant of this was that the targeting of the mapped EQ-5D health utilities was less optimal at the lower end of the observed EQ-5D utility range, particularly for utility values less than −0.20. However, this may also reflect the distribution of both the C19-YRSm scores, and particularly the EQ-5D-3L utility values with fewer people with LC experiencing health states as severe as “worse than dead” (ie, less than 0), as only 5% (N = 33) of the sample had observed EQ-5D-3L utility values <0. This is an area to be explored further in future research.
The use of an OLS regression may be considered a possible shortcoming, however it is unlikely that model fit would have been improved significantly beyond the high levels demonstrated in this study through the application of other regression models.26 Therefore, taken in the round, the large sample size, concordance between items from the C19-YRSm in the mapping algorithm and the EQ-5D single-item dimensions, the high level of variance explained (“fit”) by the mapping model, as well as the degree of agreement between utility estimates all underpin the robustness of the results.
These results have important implications for the use of C19-YRsm in clinical practice and service evaluation. LC is by its nature is a varying condition with daily fluctuations in both symptom and symptom severity.35 The results of this study emphasise the need for COVID-specific measures when evaluating HRQoL, particularly in the context of determining the cost-effectiveness of interventions and healthcare services aimed at LC.
Despite the evident correspondence between the EQ-5D-5L single-item dimensions and the C19-YRSm, the generic instrument may not fully capture the HRQoL of people experiencing LC, nor specifically be responsive to the variable nature of the condition. For instance, LC has been shown to be associated with a loss of independence,37 which in turn has a significant negative impact, on work ability and productivity.7,8 Randomised controlled trials evaluating interventions aimed at supporting and improving the ability of people with LC to return to work38 require specific instruments, such as the C19-YRSm, that are able to measure the benefits of these interventions and are both relevant and specific to patients by measuring what is important to them. Yet, at the same time, health policy, particularly in jurisdictions, such as the UK, where health care is funded from the public purse, requires evidence of the cost-effectiveness of interventions39–41 supported by an instrument sensitive and responsive to the fluctuating nature of LC. Although the EQ-5D is the most commonly employed instrument of choice for economic evaluations and, in some cases, is mandated by health technology assessment agencies (eg, the UK’s National Institute for Health and Care Excellence, NICE),38 where the EQ-5D is not available (or appropriate) mapping to other PROMs is recommended in order to generate health utilities for economic evaluations.39 The ability to derive health utilities, including the EQ-5D utility scores from the C19-YRSm could clearly, therefore, play an important role in the economic evaluation of LC interventions.
Conclusion
We have developed a simple, responsive, and robust mapping algorithm to enable EQ-5D-3L health utilities to be generated from 9 items of the C19-YRSm. This mapping algorithm will facilitate the health economic evaluation of interventions, treatment, and management of people with LC.
Abbreviations
AIC, Akaike Information Criteria; C19-YRSm, COVID 19 Yorkshire Rehabilitation Screening Tool (modified); CI, Confidence Interval; EQ-5D-3L, EuroQol 5-Dimension 3-Level; EQ-5D-5L, EuroQol 5-Dimension 5-Level; FD, Functional Disability (from the C19-YRSm); HRQoL, Health-related Quality of Life; HTA, Health Technology Assessment; LC, Long COVID; MAPS, MApping onto Preference-based measures reporting Standards; NHS, National Health Service; NICE, National Institute for Health and Care Excellence; OH, Overall Health (from the C19-YRSm); OLS, Ordinary Least Squares; OS, Other Symptoms (from the C19-YRSm); PCS, Post-COVID Syndrome; PROM, Patient-reported Outcome Measure; RMSE, Root Mean Squared Error; SD, Standard Deviation; SE, Standard Error; SRM, Standardised Response Mean; SS, Symptom Severity (from the C19-YRSm); VAS, Visual Analogue Scale.
Data Sharing Statement
All data generated or analysed during this study are included in this published article and its supplementary information files.
Ethics Approval and Consent to Participate
Ethics approval for the LOCOMOTION study was obtained from the Bradford and Leeds Research Ethics Committee on behalf of Health Research Authority and Health and Care Research Wales (reference: 21/YH/0276). Informed consent was obtained from the study participants prior to study commencement.
Acknowledgments
The authors would like to thank all people with Long COVID and the health care professionals who participated in the study. We thank members of the digital health company ELAROS 24/7 Ltd who designed and developed the DPROM platform. We also thank the University of Leeds and EuroQol commercial teams for licensing the C19-YRSm (Yorkshire Rehabilitation Scale) and EQ-5D-5L scales, respectively, to ELAROS. The LOCOMOTION consortium: Nawar Diar Bakerly, Mauricio Barahona, Alexander Casson, Jonathan Clarke, Vasa Curcin, Helen Davies, Helen Dawes, Brendan Delaney, Carlos Echevarria, Sarah Elkin, Rachael Evans, Zaccheus Falope, Darren Greenwood, Ben Glampson, Stephen Halpin, Mike Horton, Joseph Kwon, Simon de Lusignan, Gayathri Delanerolle, Erik Mayer, Harsha Master, Ruairidh Milne, Jacqui Morris, Amy Parkin, Anton Pick, Nick Preston, Amy Rebane, Emma Tucker, Ana Belen Espinosa Gonzalez, Sareeta Baley, Annette Rolls, Emily Bullock, Megan Ball, Shehnaz Bashir, Mae Mansoubi, Joanne Elwin, Denys Prociuk, Iram Qureshi, Samantha Jones.
This paper has been uploaded to MedRxiv as a preprint: https://eur03.safelinks.protection.outlook.com/?url=https%3A%2F%2Fwww.medrxiv.org%2Fcontent%2F10.1101%2F2024.08.11.24311809v2&data=05%7C02%7Ca.b.smith%40leeds.ac.uk%7C88013ecd101c4053ada008dcd5ebf49f%7Cbdeaeda8c81d45ce863e5232a535b7cb%7C0%7C0%7C638620456627283164%7CUnknown%7CTWFpbGZsb3d8eyJWIjoiMC4wLjAwMDAiLCJQIjoiV2luMzIiLCJBTiI6Ik1haWwiLCJXVCI6Mn0%3D%7C0%7C%7C%7C&sdata=WZdFhBS7hu1ZBlAve5vTmkTaB4e29FHJXRx%2FhZoOZ4Q%3D&reserved=0.
Author Contributions
All authors made a significant contribution to the work reported, whether that is in the conception, study design, execution, acquisition of data, analysis and interpretation, or in all these areas; took part in drafting, revising or critically reviewing the article; gave final approval of the version to be published; have agreed on the journal to which the article has been submitted; and agree to be accountable for all aspects of the work.
Funding
This work is independent research funded by the National Institute for Health and Care Research (NIHR) grant Ref COV-LT2-0016. SP receives support as a UK National Institute for Health Research (NIHR) Senior Investigator (NF-SI-0616-10103) and from the UK NIHR Applied Research Collaboration Oxford and Thames Valley. The views expressed in this publication are those of the author(s) and not necessarily those of NIHR or The Department of Health and Social Care.
Disclosure
Dr Greenwood reports grants from NHS England and NHS Improvement, NHS National Services Scotland, outside the submitted work. The authors declare no other conflicts of interest in this work.
References
1. Callard F, Perego E. How and why patients made Long Covid. Soc Sci Med. 2021;268:113426. doi:10.1016/j.socscimed.2020.113426
2. National Institute for Health and Care Excellence (NICE). COVID-19 rapid guideline: managing the long-term effects of COVID-19. 2024. Available from: https://www.nice.org.uk/guidance/ng188.
3. Soriano JB, Murthy S, Marshall JC, et al. A clinical case definition of post-COVID-19 condition by a Delphi consensus. Lancet Infect Dis. 2022;22(4):e102–e7. doi:10.1016/S1473-3099(21)00703-9
4. Office of National Statistics (ONS). Self-reported coronavirus (COVID-19) infections and associated symptoms, England and Scotland: 2024: Office for National Statistics; Available from: https://www.ons.gov.uk/peoplepopulationandcommunity/healthandsocialcare/conditionsanddiseases/articles/selfreportedcoronaviruscovid19infectionsandassociatedsymptomsenglandandscotland/november2023tomarch2024.
5. Davis HE, Assaf GS, McCorkell L, et al. Characterizing long COVID in an international cohort: 7 months of symptoms and their impact. EClinicalMedicine. 2021;38:101019. doi:10.1016/j.eclinm.2021.101019
6. Brown DA, O’Brien KK. Conceptualising Long COVID as an episodic health. BMJ Global Health. 2021;6:e007004. doi:10.1136/bmjgh-2021-007004
7. Di Fusco M, Cappelleri JC, Anatale-Tardiff L, et al. Impact of COVID-19 Infection on Health-Related Quality of Life, Work Productivity and Activity Impairment by Symptom-Based Long COVID Status and Age in the US. Healthcare. 2023;11(20):2790. doi:10.3390/healthcare11202790
8. Kwon J, Milne R, Rayner C, et al. Impact of Long COVID on productivity and informal caregiving. Eur J Health Econ. 2023;25:1095–1115. doi:10.1007/s10198-023-01653-z
9. Sivan M, Preston N, Parkin A, et al. The modified COVID-19 Yorkshire Rehabilitation Scale (C19-YRSm) patient-reported outcome measure for Long Covid or Post-COVID-19 syndrome. J Med Virol. 2022;94(9):4253–4264. doi:10.1002/jmv.27878
10. Hughes SE, Haroon S, Subramanian A, et al. Development and validation of the symptom burden questionnaire for long covid (SBQ-LC): rasch analysis. BMJ. 2022;377:e070230.
11. Romano C, Fehnel S, Stoddard J, et al. Development of a novel patient-reported outcome measure to assess signs and symptoms of COVID-19. J Patient Rep Outc. 2022;6(1):85. doi:10.1186/s41687-022-00471-w
12. Amdal CD, Taylor K, Kuliś D, et al. Health-related quality of life in patients with COVID-19; international development of a patient-reported outcome measure. J Patient Rep Outc. 2022;6(1):26. PMID: 35348945. doi:10.1186/s41687-022-00434-1
13. Sivan M, Halpin S, Gee J. Assessing long-term rehabilitation needs in COVID-19 survivors using a telephone screening tool (C19-YRS tool). Adv Clin Neurosciences Rehabil. 2020;19(4):14–17. doi:10.47795/NELE5960
14. Yilmaz Gokmen G, Durmaz D, Demir C, et al. Determining Post-COVID-19 Symptoms and Rehabilitation Needs in Hospitalized and Nonhospitalized COVID-19 Survivors with Tele-Assessment Methods. Telemed J E Health. 2023;29(9):1312–1323. doi:10.1089/tmj.2022.0349
15. Parkin A, Davison J, Tarrant R, et al. A Multidisciplinary NHS COVID-19 Service to Manage Post-COVID-19 Syndrome in the Community. J Prim Care Comm Health. 12: 21501327211010994. doi:10.1177/21501327211010994
16. O’Connor RJ, Preston N, Parkin A, et al. The COVID-19 Yorkshire Rehabilitation Scale (C19-YRS): application and psychometric analysis in a post-COVID-19 syndrome cohort. J Med Virol. 2022;94(3):1027–1034. doi:10.1002/jmv.27415
17. Straudi S, Manfredini F, Baroni A, et al. Construct Validity and Responsiveness of the COVID-19 Yorkshire Rehabilitation Scale (C19-YRS) in a Cohort of Italian Hospitalized COVID-19 Patients. Int J Environ Res Public Health. 2022;19(11):6696. doi:10.3390/ijerph19116696
18. Kustura L, Bobek D, Poljičanin A, et al. Psychometric properties and observational data for COVID-19 Yorkshire Rehabilitation Scale (C19-YRSm) for post-COVID-19 syndrome. QJM. 2024;117(1):38–47. doi:10.1093/qjmed/hcad224
19. Tamadoni N, Bakhtiari A, Nikbakht HA. Psychometric properties of the COVID-19 Yorkshire Rehabilitation Scale: post-Covid-19 syndrome in Iranian elderly population. BMC Infect Dis. 2024;24(1):77. doi:10.1186/s12879-024-08991-0
20. Smith A, Greenwood D, Horton M, et al. Psychometric analysis of the modified COVID-19 Yorkshire Rehabilitation Scale (C19-YRSm) in a prospective multicentre study. BMJ Open Respir Res. 2024;11(1):e002271. doi:10.1136/bmjresp-2023-002271
21. National Institute for Health and Care Excellence (NICE) [2019]. Available from: https://www.nice.org.uk/about/what-we-do/our-programmes/nice-guidance/technology-appraisal-guidance/eq-5d-5l.
22. Herdman M, Gudex C, Lloyd A, et al. Development and preliminary testing of the new five-level version of EQ-5D (EQ-5D-5L. Qual Life Res. 2011;20(10):1727–1736. doi:10.1007/s11136-011-9903-x
23. Dolan P. Modeling valuations for EuroQol health states. Med Care. 1997;35(11):1095–1108. doi:10.1097/00005650-199711000-00002
24. Soare IA, Ansari W, Nguyen JL, et al. Health-related quality of life in mild-to-moderate COVID-19 in the UK: a cross-sectional study from pre- to post-infection. Health Qual Life Outcomes. 2024;22(1):12. doi:10.1186/s12955-024-02230-5
25. Honda H, Takamatsu A, Miwa T, et al. Prolonged Symptoms after COVID-19 in Japan: a Nationwide Survey of the Symptoms and Their Impact on Patients’ Quality of Life. Am J Med. 2023;24:S0002–9343(23)00331–5.
26. Longworth L, Rowen D. NICE DSU Technical Support Document 10: The Use of Mapping Methods to Estimate Health State Utility Values. London: National Institute for Health and Care Excellence (NICE); 2011.
27. Dixon P, Dakin H, Wordsworth S. Generic and disease-specific estimates of quality of life in macular degeneration: mapping the MacDQoL onto the EQ-5D-3L. Qual Life Res. 2016;25(4):935–945. doi:10.1007/s11136-015-1145-x
28. Ernstsson O, Tinghög P, Alexanderson K, et al. The External Validity of Mapping MSIS-29 on EQ-5D Among Individuals With Multiple Sclerosis in Sweden. MDM Policy Pract. 2017;2(1):2381468317692806. doi:10.1177/2381468317692806
29. Sivan M, Greenhalgh T, Darbyshire JL, et al. LOng COvid Multidisciplinary consortium Optimising Treatments and servIces acrOss the NHS (LOCOMOTION): protocol for a mixed-methods study in the UK. BMJ Open. 2022;12(5):e063505. doi:10.1136/bmjopen-2022-063505
30. Sivan M, Rocha Lawrence R, O’Brien P. Digital Patient Reported Outcome Measures Platform for Post-COVID-19 Condition and Other Long-Term Conditions: user-Centered Development and Technical Description. JMIR Hum Factors. 2023; 10:e48632.
31. van Hout B, Janssen MF, Feng YS, et al. Interim scoring for the EQ-5D-5L: mapping the EQ-5D-5L to EQ-5D-3L value sets. Value Health. 2012;15(5):708–715. doi:10.1016/j.jval.2012.02.008
32. Hernandez Alava M, Pudney S, Wailoo A Estimating the relationship between EQ-5D-5L and EQ-5D-3L: results from an English Population Study. 2020. Available from: https://nicedsu.sites.sheffield.ac.uk/methods-development/mapping-eq-5d-5l-to-3l.
33. Petrou S, Rivero-Arias O, Dakin H, et al. Preferred reporting items for studies mapping onto preference-based outcome measures: the MAPS statement. J Med Econ. 2015;18(11):851–857. doi:10.3111/13696998.2015.1070554
34. Bland JM, Altman DG. Statistical methods for assessing agreement between two methods of clinical measurement. Lancet. 1986;327(8476):307–310. doi:10.1016/S0140-6736(86)90837-8
35. National Institute for Health and Care Research (NIHR). Themed Review: living with COVID19; 2020. Available from: https://evidence.nihr.ac.uk/collection/living-with-covid19.
36. Barilaite E, Watson H, Hocaoglu MB. Understanding Patient-Reported Outcome Measures Used in Adult Survivors Experiencing Long-Term Effects After COVID-19 Infection: a Rapid Review. J Patient Cent Res Rev. 2024;11:36–50. doi:10.17294/2330-0698.2041
37. León-Herrera S, Samper-Pardo M, Oliván-Blázquez B, et al. Loss of socioemotional and occupational roles in individuals with Long COVID according to sociodemographic and clinical factors: secondary data from a randomized clinical trial. PLoS One. 2024;19(2):e0296041. doi:10.1371/journal.pone.0296041
38. Krotz A, Sosnowsky-Waschek N, Bechtel S, et al. Reducing sick leave, improving work ability, and quality of life in patients with mild to moderate Long COVID through psychosocial, physiotherapeutic, and nutritive supportive digital intervention (MiLoCoDaS): study protocol for a randomized controlled trial. Trials. 2023;24(1):798. doi:10.1186/s13063-023-07819-7
39. National Institute for Health and Care Excellence. NICE health technology evaluations: the manual; October 2023; Available from: https://www.nice.org.uk/process/pmg36/chapter/economic-evaluation-2#measuring-and-valuing-health-effects-in-cost-utility-analyses.
40. Potter C, Leggat F, Lowe R, et al. Effectiveness and cost-effectiveness of a personalised self-management intervention for living with long COVID: protocol for the LISTEN randomised controlled trial. Trials. 2023;24(1):75. doi:10.1186/s13063-023-07090-w
41. Samper-Pardo M, León-Herrera S, Oliván-Blázquez B, et al. Development and Validation of a Mobile Application as an Adjuvant Treatment for People Diagnosed with Long COVID-19: protocol for a Co-Creation Study of a Health Asset and an Analysis of Its Effectiveness and Cost-Effectiveness. Int J Environ Res Public Health. 2022;20(1):462. doi:10.3390/ijerph20010462
 © 2025 The Author(s). This work is published and licensed by Dove Medical Press Limited. The
full terms of this license are available at https://www.dovepress.com/terms.php
and incorporate the Creative Commons Attribution
- Non Commercial (unported, 3.0) License.
By accessing the work you hereby accept the Terms. Non-commercial uses of the work are permitted
without any further permission from Dove Medical Press Limited, provided the work is properly
attributed. For permission for commercial use of this work, please see paragraphs 4.2 and 5 of our Terms.
© 2025 The Author(s). This work is published and licensed by Dove Medical Press Limited. The
full terms of this license are available at https://www.dovepress.com/terms.php
and incorporate the Creative Commons Attribution
- Non Commercial (unported, 3.0) License.
By accessing the work you hereby accept the Terms. Non-commercial uses of the work are permitted
without any further permission from Dove Medical Press Limited, provided the work is properly
attributed. For permission for commercial use of this work, please see paragraphs 4.2 and 5 of our Terms.