")
Back to Journals » International Journal of Nanomedicine » Volume 19
Hepatoma-Targeting and ROS-Responsive Polymeric Micelle-Based Chemotherapy Combined with Photodynamic Therapy for Hepatoma Treatment
Authors Xu X , Lu W , Zhang H, Wang X , Huang C, Huang Q, Xu W, Xu W
Received 1 May 2024
Accepted for publication 4 September 2024
Published 16 September 2024 Volume 2024:19 Pages 9613—9635
DOI https://doi.org/10.2147/IJN.S475531
Checked for plagiarism Yes
Review by Single anonymous peer review
Peer reviewer comments 2
Editor who approved publication: Dr Krishna Nune
Xueya Xu,* Weili Lu,* Hua Zhang, Xiaoying Wang, Caixia Huang, Qiuping Huang, Wen Xu, Wei Xu
Pharmacy College, Fujian University of Traditional Chinese Medicine, Fuzhou, 350122, People’s Republic of China
*These authors contributed equally to this work
Correspondence: Xiaoying Wang; Wei Xu, Pharmacy College, Fujian University of Traditional Chinese Medicine, 1 Qiuyang Road, Fuzhou, 350122, People’s Republic of China, Email [email protected]; [email protected]
Background: The combination of nanoplatform-based chemotherapy and photodynamic therapy (PDT) is a promising way to treat cancer. Celastrol (Cela) exhibits highly effective anti-hepatoma activity with low water solubility, poor bioavailability, non-tumor targeting, and toxic side effects. The combination of Cela-based chemotherapy and PDT via hepatoma-targeting and reactive oxygen species (ROS)-responsive polymeric micelles (PMs) could solve the application problem of Cela and further enhance antitumor efficacy.
Methods: In this study, Cela and photosensitizer chlorin e6 (Ce6) co-loaded glycyrrhetinic acid-modified carboxymethyl chitosan-thioketal-rhein (GCTR) PMs (Cela/Ce6/GCTR PMs) were prepared and characterized. The safety, ROS-sensitive drug release, and intracellular ROS production were evaluated. Furthermore, the in vitro anti-hepatoma effect and cellular uptaken in HepG2 and BEL-7402 cells, and in vivo pharmacokinetic, tissue distribution, and antitumor efficacy of Cela/Ce6/GCTR PMs in H22 tumor-bearing mice were then investigated.
Results: Cela/Ce6/GCTR PMs were successfully prepared with nanometer-scale particle size, favorable drug loading capacity, and encapsulation efficiency. Cela/Ce6/GCTR PMs exhibited a strong safety profile and better hemocompatibility, exhibiting less damage to normal tissues. Compared with Cela-loaded GCTR PMs, the ROS-responsiveness of Cela/Ce6/GCTR PMs was increased, and the release of Cela was accelerated after combination with PDT. Cela/Ce6/GCTR PMs can efficiently target liver tumor cells by uptake and have a high cell-killing effect in response to ROS. The combination of GCTR PM-based chemotherapy and PDT resulted in increased bioavailability of Cela and Ce6, improved liver tumor targeting, and better anti-hepatoma effects in vivo.
Conclusion: Hepatoma-targeting and ROS-responsive GCTR PMs co-loaded with Cela and Ce6 combined with PDT exhibited improved primary hepatic carcinoma therapeutic effects with lower toxicity to normal tissues, overcoming the limitations of monotherapy and providing new strategies for tumor treatment.
Keywords: ROS-responsive polymeric micelles, photodynamic therapy, hepatoma-targeting, celastrol, combination anti-hepatoma therapy
Graphical Abstract:

Introduction
Primary hepatic carcinoma (PHC) was the sixth most frequently diagnosed cancer and the third leading cause of cancer deaths worldwide in 2020, with serious implications for human life and health.1,2 Although chemotherapy is an effective post-operative treatment for most patients with PHC and is associated with improved short-term survival, chemotherapy-related damage still occurs, and patients remain at high risk of long-term recurrence and metastasis.3,4
In recent years, anti-hepatoma drugs derived from plants have been widely studied. Celastrol (Cela) is a pentacyclic triterpenoid compound extracted from Tripterygium wilfordii Hook. f.5–7 Studies have shown that Cela exhibits highly effective anti-hepatoma activity by inducing autophagy, cell cycle arrest, apoptosis, anti-inflammation, anti-angiogenesis, and anti-metastasis.8–10 Despite its unique advantages in the treatment of PHC, its low water solubility, poor bioavailability, narrow dose window, and tendency to cause toxic side effects such as hepatotoxicity, nephrotoxicity, hematopoietic system toxicity, cardiotoxicity, and teratogenicity have limited its clinical application.11–13 Therefore, the development of appropriate technology to ameliorate these administration defects is urgently required.
Polymeric micelles (PMs) self-assembled by amphiphilic polymers in water can effectively improve the solubility of poorly water-soluble drugs, enhance their stability, reduce toxic side effects, and improve drug bioavailability due to their nano-scale size, excellent drug loading capacity, the possibility of functional modification and good stability,14–17 which can effectively solve the application problem of Cela. However, the therapeutic efficiency of PMs is influenced by drug-release characteristics: premature release leads to insufficient drug accumulation in the target tissue, resulting in weak therapeutic effects.18–20 In contrast, by exploiting the ability of PMs to respond to specific conditions, such as reactive oxygen species (ROS), pH, thermal, light, or oxidative stress, a tumor microenvironment-responsive intelligent PM delivery system with targeting characteristics can be designed, allowing the drug to accumulate and be released selectively at the tumor site to maximize the anti-tumor effect.21–23
Due to the defective ROS depletion system and the disruption of ROS homeostasis, high levels of ROS accumulate in tumor tissues.24 Tumor tissues contain hydrogen peroxide (H2O2), hydroxyl radicals (•OH), superoxide (O2−), and persulfate (ONOO−) at ROS levels up to 1×10⁻⁴ M, 1000-fold higher than those in normal tissues (2 × 10⁻⁸ M).25,26 In previous research, based on the high ROS microenvironment of tumor tissue and abundant glycyrrhetinic acid (GA) receptors on hepatoma cells, we have successfully synthesized a GA-modified carboxymethyl chitosan-thioketal-rhein (GCTR) conjugate, which exhibits satisfactory hepatoma-targeting properties and ROS responsiveness.23
To break through the restriction by ROS levels at the tumor sites for ROS-responsive PMs and enhance the response of ROS-responsive PMs, ROS levels in tumor cells must be increased. Therefore, ROS-responsive PM-based chemotherapy combined with photodynamic therapy (PDT), which stimulates ROS production, is expected to be an effective tumor treatment.27 PDT is a new approach to tumor therapy using a photodynamic response, which uses photosensitizers enriched in tumor tissue to absorb light of a specific intensity and wavelength and undergo a type I or type II reaction to produce ROS, creating a specific ROS-rich microenvironment and inducing apoptosis and necrosis in cancer cells.28,29
In this study, based on our previous research on GCTR PMs,23 ROS-responsive GCTR PMs targeted delivery of Cela and chlorin e6 (Ce6) in combination with PDT were designed and prepared for the treatment of PHC. Ce6, one of the most widely used second-generation photosensitizer molecules in PDT, shows high-efficiency single-linear oxygen generation and a strong safety profile.30–32 GCTR PMs co-loaded with Cela and Ce6 (Cela/Ce6/GCTR PMs) can be actively and passively targeted to the liver tumor site. Ce6 in GCTR PMs generates ROS in response to 660-nm near-infrared (NIR) irradiation, increasing the ROS level at the tumor site, killing tumor cells, and rapidly rupturing the ROS-responsive material (thioketal, TK) in GCTR PMs, accelerating the destruction of the micelle structure to release Cela rapidly, and playing an efficacious synergy between chemotherapy and PDT. This synergistic effect of hepatoma-targeting and ROS-responsive PM-based chemotherapy and PDT, as a promising combination therapy, will provide an effective treatment for liver cancer.
Materials and Methods
Materials
Cela (purity >98%) was purchased from Chengdu Pufei De Biotech (Chengdu China). Ce6 (purity >94%), 1,3-diphenylisobenzofuran (purity >97%), and N-Acetyl-L-cysteine (NAC) (purity >99%) were purchased from Shanghai Macklin Bioreagent (Shanghai, China). Oxaliplatin for injection was obtained from Sanofi (Hangzhou) Pharmaceuticals (Hangzhou, China). All other reagents were of analytical and HPLC grade and were obtained from Sinopharm Chemical Reagents (Shanghai, China), and can be used without further purification.
HepG2 cells were purchased from the Institute for Stem Cell and Regeneration, Chinese Academy of Sciences (Beijing, China), and were cultured in DMEM containing 1% penicillin-streptomycin and 10% fetal bovine serum (FBS). L-02 and BEL-7402 cells were purchased from iCell Bioscience (Shanghai, China). Bel-7402 cells were cultured in RPMI 1640 medium containing 1% penicillin-streptomycin and 10% FBS. L-02 cells were cultured in RPMI 1640 medium containing 1% penicillin-streptomycin and 20% FBS. H22 cells were purchased from the Cell Bank of the Chinese Academy of Sciences (Shanghai, China) and cultured in DMEM containing 1% penicillin-streptomycin and 10% FBS. Cells were incubated at 37 °C in 5% CO2.
Institute of Cancer Research (ICR) mice and New Zealand rabbits (equal male-to-female ratios) were obtained from Wu’s Experimental Animal Trading (Fuzhou, China). They were fed and acclimatized before the experiments. All animal experiments in this work complied with EU Directive 2010/63/EU for animal experiments and were approved by Animal Care and Use Committee of Fujian University of Traditional Chinese Medicine (No. 3W2023038).
Preparation and Characterization of Cela/Ce6/GCTR PMs
GCTR conjugates were synthesized by our research team with molar substitution degrees of 2.36% and 7.24% for GA and rhein, respectively.23 Cela/Ce6/GCTR PMs were prepared using the dialysis method.16,23 The effects of different Cela and Ce6 feed ratios on Cela/Ce6/GCTR PMs are shown in Table S1. The final preparation method was as follows: Cela and Ce6, 9 mg each, were co-dissolved in DMSO (0.45 mL). GCTR conjugate (12 mg) was dissolved in 2.4 mL ultrapure H2O and dispersed by probe sonication in an ice-water bath. The DMSO solution of Cela and Ce6 was dripped into the GCTR conjugate solution slowly with high-speed stirring. After continued high-speed stirring and probe sonication in an ice-water bath, the mixture was added to a dialysis bag (MWCO=3500 Da) and immersed in 2 L of ultrapure H2O for dialysis to remove the organic solvent. The dialyzed mixture was filtered using a microfiltration membrane (0.8 µm) to remove unencapsulated drugs and freeze-dried to obtain Cela/Ce6/GCTR PMs.
Cela-loaded GCTR PMs without Ce6 (Cela/GCTR PMs), which were used as a control, were prepared as reported.23
Freeze-dried Cela/Ce6/GCTR PMs (2 mg) were dissolved in 4 mL of ultrapure H2O. The Cela/Ce6/GCTR PMs solution (0.5 mL) was added to a volumetric flask containing methanol (5 mL) to disrupt the structure of the PMs and dissolve Cela and Ce6. The Cela and Ce6 concentrations were detected using HPLC, and the drug-loading capacity (DL) and encapsulation efficiency (EE) for Cela and Ce6 were calculated. The HPLC methods are described in the Supplementary Materials. The equations for DL and EE calculation are as follows:
W1, W and W2 represent the weight of Cela or Ce6 loaded in the PMs, Cela/Ce6/GCTR PMs, and Cela or Ce6 added, respectively.
The particle size (nm), polydispersity index (PDI), and potential (Zeta) of Cela/Ce6/GCTR PMs were measured using the dynamic light scattering (DLS) method. The morphology of the PMs was observed using transmission electron microscopy (TEM). The Cela/Ce6/GCTR PMs solution was diluted with 0.1 mmol/L H2O2 and was treated with 660-nm irradiation (100 mW/cm2, MRL-III-FS-660-1W, Changchun New Industry Optoelectronics Technology, Changchun, China). The morphological changes of these PMs before and after irradiation were observed using TEM.
The thermodynamic characterization of the drug-loaded PMs was performed using differential scanning calorimetry (DSC). Briefly, samples were heated from 40 °C to 500 °C in an argon atmosphere at a heating rate of 10 K/min, and the scanning curve was recorded.
Cela/Ce6/GCTR PMs were photodynamically characterized using 1,3-diphenylisobenzofuran (DPBF). DPBF (2 mg) was dissolved in 10 mL of dimethylformamide. Cela/Ce6/GCTR PMs (0.05 mg/mL) were dissolved in ultrapure H2O, and H2O2 solution was added to the Cela/Ce6/GCTR PMs solution to a final H2O2 concentration of 0.1 mmol/L. DPBF solution (160 μL) was added to the Cela/Ce6/GCTR PMs solution (the total volume=3.5 mL). The solution was placed in a constant temperature water bath at 37 °C with shaking and was then subjected to 660-nm irradiation (0.3 W/cm2). The absorbance of DPBF in the solution at 415 nm was determined by an UV-vis spectrophotometer (UV-9600, Beijing Rayleigh Analytical Instrument, Beijing, China) after different irradiation periods.
In vitro Drug Release
One milliliter of Cela, Cela/GCTR PMs, and Cela/Ce6/GCTR PMs solution (Cela concentration=250 µg/mL) was added to a dialysis bag (MWCO=3500 Da), respectively, which was immersed in 100 mL of release medium (pH 7.4 PBS, pH 5.0 PBS with 0.1 mmol/L H2O2) shaken at 100 r/min in a water bath shaker at 37 °C. At 0.25, 0.5, 1, 2, 4, 6, 8, 12, 24, 36, 48, 60, and 72 h, 4 mL of the release solution was moved to a centrifuge tube containing 10 µL of the internal standard emodin (pre-evaporated solvent) and supplemented with 4 mL of the corresponding fresh release medium. At each time point, the Cela/Ce6/GCTR PMs combined with the PDT group were treated with the 660-nm NIR light for 5 min after sampling. The samples were extracted with dichloromethane and evaporated, and the Cela and Ce6 concentrations were determined using HPLC after redissolution in methanol and calculated. The cumulative release of Cela and Ce6 were calculated separately and the release curves of the two drugs were plotted.
Hemolysis Test
Cela/Ce6/GCTR PMs solutions containing Cela at final concentrations of 0.02, 0.04, 0.06, 0.08, 0.1, 0.5, 1.0, 1.5, or 2.0 mg/mL were prepared with 0.9% NaCl solution. A negative control group without sample solution and a positive control group with 0.1 mL of distilled H2O instead of Cela/Ce6/GCTR PMs solution were used for comparison. To each tube, 0.1 mL of 2% rabbit erythrocyte suspension was added, and tubes were incubated for 2 h at 37 °C in a constant temperature water bath and centrifuged at 3500 r/min for 10 min. The absorbance of the supernatant at 540 nm was detected using a multimode reader (Infinite M200 PRO, Tecan, Männedorf, Switzerland). The hemolysis rate of each sample was calculated. The bottom substance of the maximum dosing group and the negative and positive control tubes were used to observe the state of erythrocytes using a light microscope.
Vascular Irritation Test
New Zealand rabbits were injected intravenously at 1 mL/min with 0.9% NaCl injection in the left marginal ear vein and Cela/Ce6/GCTR PMs solution (equivalent Cela dose=2 mg/kg) in the right marginal ear vein for three consecutive days, once daily (n=3). Twenty-four hours after the last dose, the rabbits were sacrificed. Vessels and surrounding tissues were taken from the intravenous injection site to the centripetal direction, and three consecutive sections of 1 cm each were sampled. After fixation, dehydration, paraffin embedding, sectioning (5 μm), and hematoxylin and eosin (H&E) staining were performed, and tissue changes were observed using a light microscope.
Cytotoxicity Assay
The ROS responsivity of the drug-loaded PMs was investigated by comparing the cytotoxicity of the formulations with or without pretreatment with the antioxidant NAC on HepG2 cells. HepG2 cells were treated with NAC (20 mmol/L) 2 h in advance to inhibit the intracellular ROS production. Then, Cela/GCTR PMs, Ce6, or Cela/Ce6/GCTR PMs solution was added, and cells were incubated for 24 h. The cell viability was determined using the MTT assay.
The inhibition of L-02, BEL-7402, and HepG2 cell proliferation by free Cela, Ce6 and its solvent DMSO, GCTR conjugate, Cela/GCTR PMs, and Cela/Ce6/GCTR PMs was investigated via the MTT method. A Ce6 concentration of 1 μg/mL was used, and the concentrations of other samples were calculated according to the DL of Ce6 and Cela in Cela/Ce6/GCTR PMs, respectively. The Cela/Ce6/GCTR PMs combined with PDT (Cela/Ce6/GCTR PMs + NIR) group underwent 660-nm irradiation (100 mW/cm2, 30 s) 6 h after drug administration. The cells were incubated for 24, 48, or 72 h. Then, the cell viability of the three cell lines was determined.
Cellular Uptake
HepG2 cells were incubated at 2×10⁵ cells/mL in laser confocal culture dishes. After cell attachment, Ce6 and Cela/Ce6/GCTR PMs were incubated with the cells for 6 h, respectively. Cells were washed three times with PBS, fixed with 4% paraformaldehyde for 20 min, and stained with Hoechst 33258 for 15 min. Confocal laser scanning microscopy (CLSM, LSM710, Zeiss, Jena, Germany) was used to observe cellular uptake.
Detection of Intracellular ROS Production
HepG2 cells (2 × 10⁵ cells/mL) were cultured in laser confocal dishes. After attachment, the cells were incubated with Cela, Cela/GCTR PMs, Ce6, or Cela/Ce6/GCTR PMs solution. Six hours later, the culture medium with drugs was discarded, and the Cela/Ce6/GCTR PMs + NIR group underwent 660-nm irradiation at 100 mW/cm2 for 30 s. 2,7-Dichlorofluorescein diacetate (DCFH-DA) from the ROS assay kit was added as the fluorescent probe. After incubation for 20 min, the cells were washed with PBS to remove the unloaded probe solution. The fluorescence of DCFH-DA destroyed by ROS was observed using CLSM to indicate the amount of ROS produced.
HepG2 cells (4 × 10⁵ cells/mL) were cultured in six-well plates. The formulation solution as above were added, and the Cela/Ce6/GCTR PMs combined with PDT group underwent 660-nm irradiation (100 mW/cm2) for 30 s after 6 h. After washing with PBS three times, the DCFH-DA probe was added to the cells. The cells were then incubated for 20 min, and collected and dispersed in PBS to detect intracellular ROS using flow cytometry.
In vivo Imaging Analysis
H22 cells were diluted to a concentration of 2×10⁷ cells/mL using sterilized saline. ICR mice (weight 22–25 g) were subcutaneously injected in the axilla of the right forelimb with 0.1 mL H22 cells. After the tumor volume reached 100–150 mm3, the mice were used in the following experiments.
Sixty H22 tumor-xenografted ICR mice were divided randomly into two groups (n=3) and injected with Ce6 (Ce6=1.7 mg/kg) or Cela/Ce6/GCTR PMs (Ce6=1.7 mg/kg, Cela=2 mg/kg) in the tail vein. Fluorescence whole-body imaging and imaging of the heart, liver, spleen, lung, kidney, and tumor after dissection was performed before injection (0 h) and at 0.5, 1, 2, 4, 6, 12, 24, and 48 h after injection using an in vivo imaging system to observe and analyze the distribution of fluorescent substances in the mice and each tissue.
Pharmacokinetics and Tissue Distribution Studies
The H22 tumor-bearing ICR mice were randomly divided into four groups (n=6): (1) free Cela, (2) Cela/GCTR PMs, (3) free Ce6, and (4) Cela/Ce6/GCTR PMs + NIR. The Cela equivalent dose was 2 mg/kg. The dose of Ce6 was calculated using the DL of the PMs, respectively. The mice were subjected to fasting without water before the experiment. The different formulations were injected into the tail vein of the mice. The Cela/Ce6/GCTR PMs + NIR group underwent 660-nm irradiation (0.5 W/cm2 for 5 min) 4 h after administration for PDT.
After injecting different formulations, blood samples were obtained from the eyes at 0.083, 0.25, 0.5, 1, 2, 4, 6, 12, 24, and 48 h. To each plasma sample (200 μL), 10 μL of Tanshinone IIA (Tan IIA) solution (internal standard, 5 μg/mL) was added followed by ethyl acetate (3 mL) extraction and evaporation. After redissolution in 100 μL of methanol, the plasma concentrations of Cela and Ce6 were determined using ultra-performance liquid chromatography–tandem mass spectrometry (UPLC-MS/MS) to plot the drug plasma concentration–time curves, and the pharmacokinetic parameters were calculated. The UPLC-MS/MS detection method for the plasma samples is described in the Supplementary Materials.
The organs of mice, including the heart, liver, spleen, lung, and kidney, and tumors were dissected at 0.083, 0.25, 0.5, 1, 2, 4, 6, 12, 24, and 48 h after drug administration. The tissue homogenate (200 μL) was added to 10 μL of Tan IIA solution (internal standard substance, 5 μg/mL) followed by extraction with ethyl acetate (3 mL) and evaporation. The residue was redissolved in methanol (100 μL) for UPLC-MS/MS analysis to measure the concentration of Cela and Ce6 in each organ and tumor.
The targeting abilities of the formulations were evaluated in terms of targeting efficiency (Te), relative targeting efficiency (Re), and peak concentration ratio (Ce), which were calculated using the area under the drug plasma concentration–time curve (AUC) and the peak drug concentration (Cmax) for organ or tissue, respectively. Te, Re, and Ce were calculated according to the following equations.

In vivo Anti-Tumor Efficacy
The in vivo anti-tumor efficacies of the formulations were assessed in H22 tumor-xenografted ICR mice. The mice bearing tumors were grouped randomly into six groups (n=8): (1) control (0.9% NaCl injection), (2) positive control (Oxaliplatin, 2.5 mg/kg), (3) free Cela, (4) Cela/GCTR PMs, (5) Cela/Ce6/GCTR PMs, and (6) Cela/Ce6/GCTR PMs + NIR, which was treated with a 660-nm NIR irradiation (0.5 W/cm2 for 5 min) 4 h after each injection. The Cela equivalent dose in each Cela formulation group was 2 mg/kg. Each formulation was injected into the tail vein and administered once every two days for five doses. Tumor volumes and body weights were recorded daily, and the curves of change in tumor volume and body weight were plotted. Tumor volume was calculated as (a2 × b)/2, where a and b are the short and long diameter of the tumors, respectively. Two days after the last injection, blood samples were collected, and then the mice were sacrificed. The tumors and organs were dissected and weighed. The tumor inhibition rates and organ indexes were calculated using the tumor weight (Wtumor), organ weight (Worgan), and body weight (Wbody) of mice. The formulas are as follows:
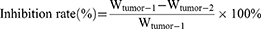
Wtumor-1 and Wtumor-2 represent Wtumor of the saline group and the formulation group, respectively.
The concentrations of Glutamic Pyruvic Transaminase (ALT), Glutamic Oxaloacetic Transaminase (AST), γ-Glutamyltransferase (GGT), Alpha-Fetoprotein (αFP), and vascular endothelial growth factor (VEGF) in mouse serum were measured according to the protocol of the manufacturer of Mouse ALT, AST, GGT, αFP and VEGF kits (Elabscience Biotechnology, Wuhan, China).
After fixation, embedding, and sectioning, the tumor tissues were processed using the Mouse CD34 Molecular Assay Kit (Elabscience Biotechnology, Wuhan, China) and observed microscopically (×200 magnification). The stained microvessels were measured, and microvessel density (MVD) was calculated. Tumor and organ tissue sectioning was performed, sections were stained with H&E, and the tissue structure and cell morphology were observed using a light microscope. Tumor Bax, Bcl-2, and VEGF protein expression were detected using Western blotting to preliminarily investigate the mechanism.
Statistical Analysis
All data are presented as mean ± standard deviation (SD). The statistical significance of the data was analyzed using a one-way analysis of variance (ANOVA). Statistical significance was set at p < 0.05, 0.01, and 0.001, respectively.
Results
Preparation and Characterization of Cela/Ce6/GCTR PMs
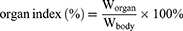
The particle size of Cela/Ce6/GCTR PMs detected by DLS was 163.63 ± 4.46 nm with a PDI of 0.15 ± 0.01 (Figure 1A). The Zeta potential was −23.63 ± 0.25 mV. The DL and EE were 34.33 ± 3.51% and 95.93 ± 8.21% for Cela and 26.43 ± 2.29% and 73.94 ± 5.21% for Ce6, respectively. The Cela/Ce6/GCTR PMs were observed as round spheres via TEM (Figure 1B–a). After 0.1 mmol/L H2O2 treatment, the Cela/Ce6/GCTR PMs boundary was blurred and disrupted, and the particle size increased (Figure 1B–b). After NIR irradiation, almost no round spherical PMs were observed (Figure 1B–c).
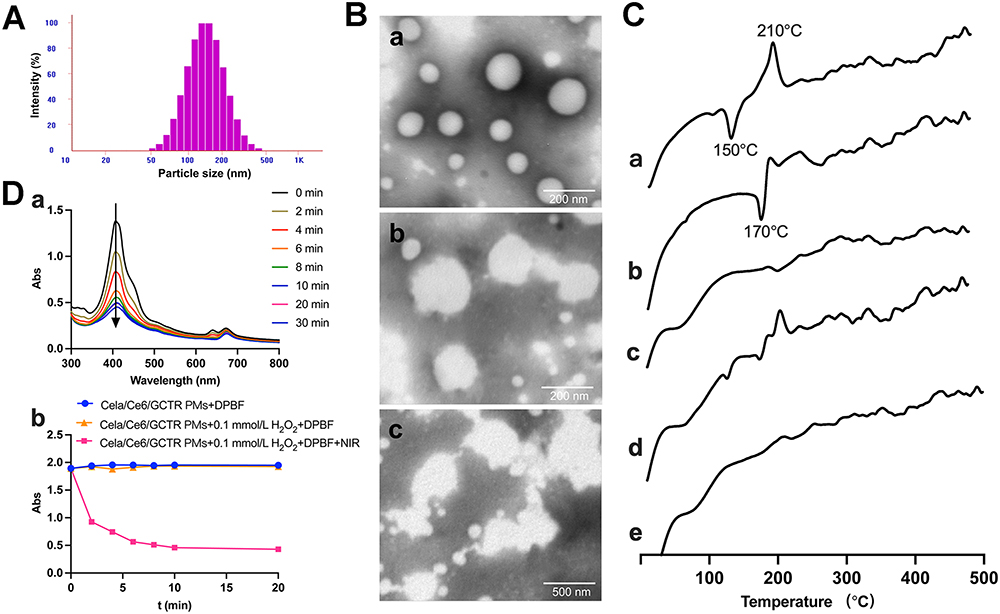 |
Figure 1 Characterization of Cela/Ce6/GCTR PMs. (A) Particle size determined by DLS. (B) TEM images of Cela/Ce6/GCTR PMs a without or b with 0.1 mmol/L H2O2 treatment, and c treated with 0.1 mmol/L H2O2 and 660-nm NIR; (C) DSC profiles of a Cela, b Ce6, c GCTR conjugate, d the physical mixture of Cela, Ce6 and GCTR conjugate, and e Cela/Ce6/GCTR PMs. (D) The absorbance of DPBF at 415 nm in Cela/Ce6/GCTR PMs solution a after 660-nm irradiation for different periods, and b with or without 0.1 mmol/L H2O2 and 660-nm irradiation. |
The DSC results (Figure 1C) showed an obvious exothermic peak at approximately 150 °C with an endothermic peak at approximately 210 °C for Cela (Figure 1C–a). The exothermic peak of Ce6 appeared at approximately 170 °C (Figure 1C–b). No exothermic or endothermic peak was observed at 25 °C to 500 °C for GCTR conjugate (Figure 1C–c). The exothermic and endothermic peaks of Cela and Ce6 were still present in the physical mixture of the three (Figure 1C–d). The absence of significant endothermic and exothermic peaks in the Cela/Ce6/GCTR PMs indicated that Cela and Ce6 were successfully encapsulated in the GCTR PMs (Figure 1C–e).
The in vitro ROS production of Cela/Ce6/GCTR PMs was demonstrated by examining changes of absorption at 415 nm of the ROS trapping agent DPBF. As shown in Figure 1D, after treatment with 660-nm NIR in a 0.1 mmol/L H2O2 solution, the absorption intensity at 415 nm in the Cela/Ce6/GCTR PMs solution decreased and the absorbance value decreased with increasing irradiation time (Figure 1D–a). In the absence of irradiation in 0.1 mmol/L H2O2 solution or an environment without H2O2, the absorbance value of DPBF remained nearly unchanged (Figure 1D–b). This suggests that Ce6 in Cela/Ce6/GCTR PMs can produce ROS under 660-nm light irradiation, which increases the ROS level in the system and thus allows the Cela/Ce6/GCTR PMs to be used for PDT therapy and acceleration of depolymerization of the PMs.
In vitro drug release
The in vitro release results are shown in Figure 2. As shown in Figure 2A, free Cela was released rapidly, with the cumulative release exceeding 80% in pH 7.4 PBS or pH 5.0 PBS + 0.1 mmol/L H2O2 at 12 h.
 |
Figure 2 In vitro release of (A) Cela and (B) Ce6 from Cela/Ce6/GCTR PMs in different release mediums with or without NIR (n=3). |
In pH 7.4 PBS, the cumulative release rate of Cela from Cela/Ce6/GCTR PMs was less than 10% at 12 h, 14.97% at 24 h, and 33.22% at 72 h, presenting a more prominent sustained-release characteristic. Cela/Ce6/GCTR PMs showed a slower drug release rate than Cela/GCTR PMs. As Ce6 coexisted with Cela in the hydrophobic core of the PMs, the interaction between the different hydrophobic components resulted in a slower release of the drug from the PMs.
In pH 5.0 PBS + 0.1 mmol/L H2O2, the simulated tumor environment release medium, the cumulative release rates of Cela from Cela/GCTR PMs were 34.63%, 44.81% and 68.71% within 12, 24, and 72 h, respectively, with a faster release rate and more release of Cela compared with the release at pH 7.4. In pH 5.0 PBS + 0.1 mmol/L H2O2 combined with PDT, the release of Cela was further increased and the cumulative release rates were 48.67%, 65.41%, and 88.08% at 12, 24, and 72 h, respectively. The result suggests that Ce6 in Cela/Ce6/GCTR PMs absorbed NIR light to generate a high level of ROS, increasing the concentration of ROS and promoting the destruction of the PM structure, resulting in rapid Cela release.
As shown in Figure 2B, at pH 7.4, the cumulative release rate of Ce6 from Cela/Ce6/GCTR PMs was 11.20% at 12 h and almost no longer increased at 24 h. The release curves of Ce6 from the PMs at pH 7.4 PBS or pH 5.0 PBS + 0.1 mmol/L H2O2 combined with PDT were similar after 660-nm NIR irradiation, and the cumulative release rates at 72 h were 44.95% and 44.70%, respectively.
These results suggested that NIR irradiation can induce ROS generation by Ce6 in the PMs, promote the destruction of the PM structure, and accelerate the release of Cela and Ce6 from the PMs, improving the tumor-killing effect, and facilitating the synergistic anti-cancer effect of PDT and chemotherapy.
To further investigate the in vitro release characteristics and mechanisms of Cela and Ce6, the in vitro release kinetics were analyzed using zero-order kinetic, Higuchi, and first-order kinetics equations. The fitting results are shown in Tables S2 and S3. Cela releases from Cela/GCTR PMs in pH 5.0 PBS + 0.1mmol/L H2O2 and pH 5.0 PBS + 0.1mmol/L H2O2 + NIR, and Ce6 releases from Cela/Ce6/GCTR PMs in pH 7.4 PBS + NIR and pH 5.0 PBS + 0.1mmol/L H2O2 + NIR fitted the Higuchi kinetic model best, and others fitted the first-order kinetic model best.
Hemolysis Test
Hemolysis is an essential indicator for assessing the safety of intravenous drug formulations. Hemocompatibility is generally considered to be better when the hemolysis rate is less than 5%.33
The in vitro hemolysis test results are presented in Figure 3A. Within the experimental concentration range, erythrocyte sedimentation was observed after 2-h incubation of Cela/Ce6/GCTR PMs with 2% red blood cell suspension and centrifugation. The color of the supernatant was the same as the Cela/Ce6/GCTR PMs solution. The positive group showed no erythrocyte sedimentation and the solution was red. The in vitro hemolysis rate at Cela/Ce6/GCTR PMs concentrations of 0.02, 0.04, 0.06, 0.08, 0.1, 0.5, 1.0, 1.5, and 2.0 mg/mL was 0.22 ± 0.07, 0.20 ± 0.07, 0.46 ± 0.05, 1.20 ± 0.07, 1.12 ± 0.06, 1.86 ± 0.13, 2.00 ± 0.14, 2.64 ± 0.07, and 2.46 ± 0.06%, respectively, all lower than 5%.
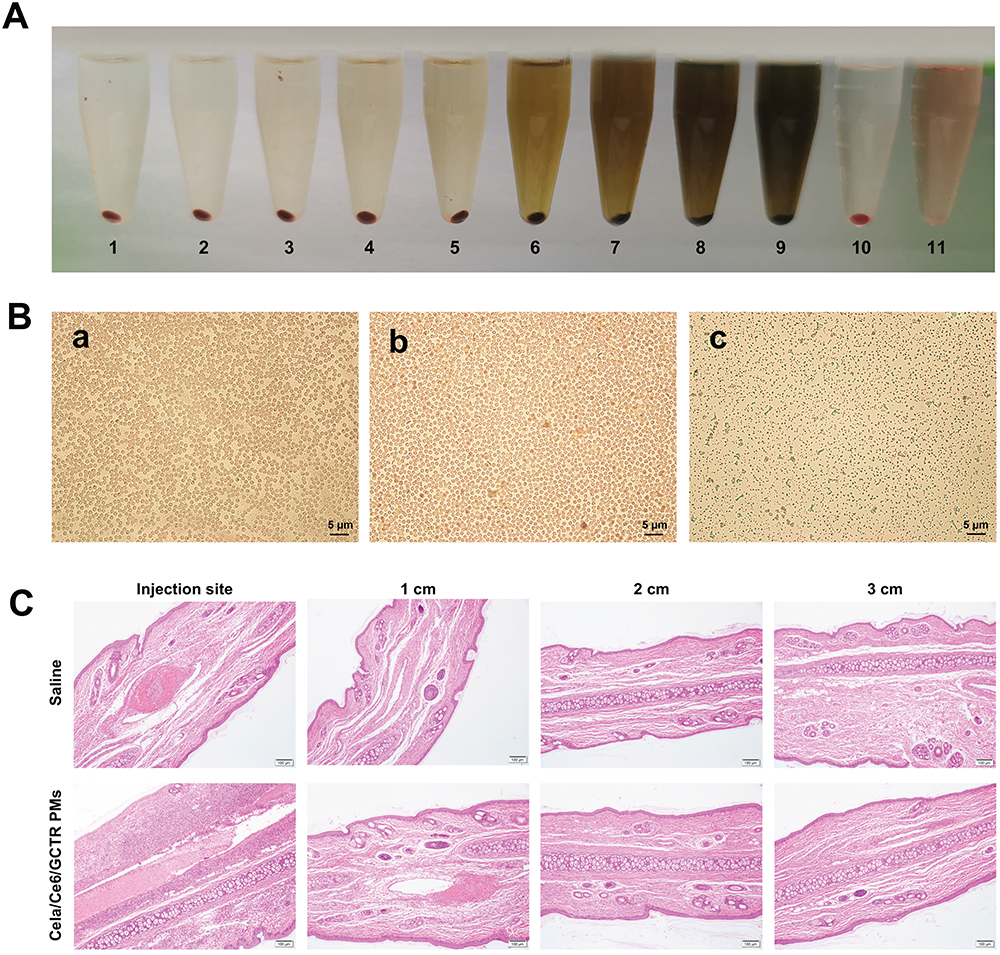 |
Figure 3 (A) Hemolysis caused by different concentrations of Cela/Ce6/GCTR PMs (n=3). NO.1–9 were Cela/Ce6/GCTR PMs group of 0.02, 0.04, 0.06, 0.08, 0.1, 0.5, 1.0, 1.5, and 2.0 mg/mL concentrations; NO.10 was negative (normal saline) group, NO.11 was positive (distilled water) group. (B) Morphology of red blood cells in a the maximum dose, b normal saline, and c positive distilled H2O groups observed using an electron microscope. (C) Histopathological observation of the rabbit marginal ear vein using H&E staining after injection with saline and Cela/Ce6/GCTR PMs solution, respectively (×100 magnification). |
As shown in Figure 3B, after the hemolysis rate test, erythrocytes could be observed clearly via electron microscopy in both the maximal Cela/Ce6/GCTR PMs concentration group and the negative group, with intact and dispersed rounded erythrocyte morphology, while in the positive group, the erythrocytes were disrupted and no intact erythrocytes were observed.
The results indicated that Cela/Ce6/GCTR PMs do not cause hemolysis and erythrocyte agglutination, have good hemocompatibility, and can therefore be used as an intravenous preparation.
Vascular Irritation Test
After continuous injection of 0.9% sodium chloride injection and Cela/Ce6/GCTR PMs solution into the ear vein of New Zealand rabbits for three days, normal vasodilation was observed at the injection site. The remaining tissue showed no obvious redness, congestion, or sagging. As shown in Figure 3C, slight thrombosis of the blood vessels was observed at the site of injection and 1 cm from the site in the sections of the PMs group, which was normal physical damage caused by the injection. At 2 cm and 3 cm from the site of injection, no obvious pathological damage to the vessels, intravascular thrombosis, or obvious inflammatory reaction was observed. Therefore, Cela/Ce6/GCTR PMs did not irritate the blood vessels and had a good safety profile for intravenous injection.
Cytotoxicity Assay
The ROS responsiveness of the PMs was verified using a cytotoxicity test involving the addition of NAC. NAC is commonly used as a specific ROS inhibitor. Pretreatment of cells with NAC can effectively inhibit intracellular ROS. The sensitivity of Cela/Ce6/GCTR PMs to ROS can be evaluated by comparing the cytotoxicity with and without ROS. The results of the ROS sensitivity determination of formulations are presented in Figure 4A. The survival rate of HepG2 cells after NAC pretreatment was 99.27 ± 0.53%, and the cell viability was not affected by the addition of NAC. Without NAC pretreatment, the survival rates of the Cela/GCTR PMs, Ce6, Cela/Ce6/GCTR PMs, Ce6 with NIR, and Cela/Ce6/GCTR PMs with NIR groups were 74.22 ± 2.15, 84.65 ± 3.87, 71.21 ± 3.75, 64.02 ± 4.05, and 52.02 ± 8.11%, respectively. After NAC pretreatment, the survival rate of cells significantly improved, which was 1.26-, 1.14-, 1.35-, 1.35-, or 1.79-fold higher than that in the group without NAC pretreatment, respectively (p < 0.01). These data suggested that the ROS environment affects the killing effect of the PMs and Ce6 on tumor cells and that the ROS-rich environment in tumor cells is conducive to the rapid release of drugs from the PMs to produce cytotoxicity.
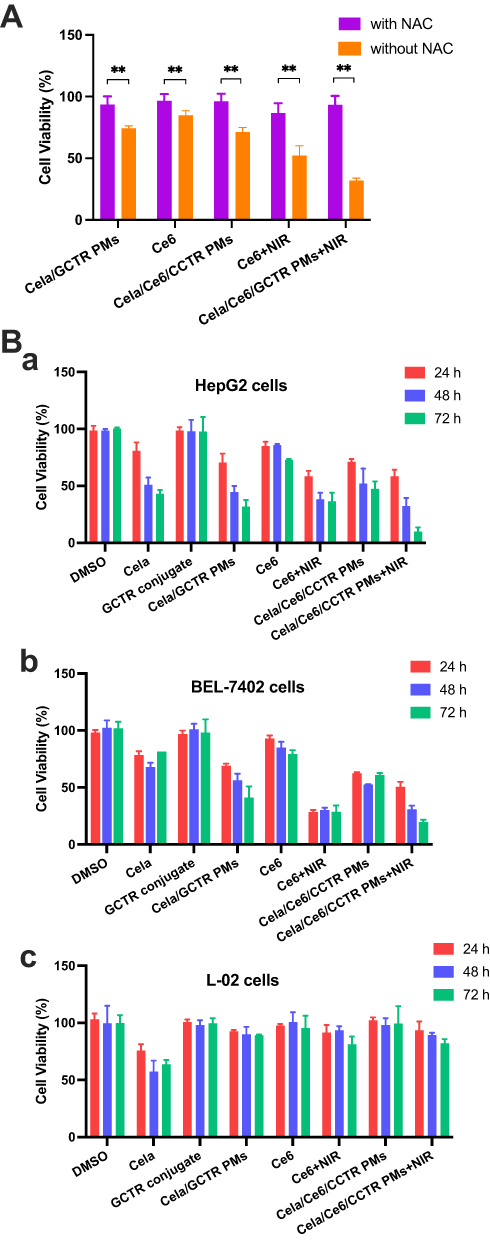 |
Figure 4 (A) Cytotoxic effect of Cela/Ce6/GCTR PMs on HepG2 cells with or without NAC pretreatment at 24 h (n=6). NAC (20 mmol/L) was added 2 h before the addition of Cela/GCTR PMs, Ce6, or Cela/Ce6/GCTR PMs. ** p < 0.01. (B) Cytotoxic effect of DMSO (Cela solvent), Cela, GCTR conjugate, Cela/GCTR PMs, Ce6, and Cela/Ce6/GCTR PMs with or without NIR treatment on a HepG2, b BEL-7402, and c L-02 cells at 24, 48, and 72 h (n=6). |
The cytotoxicity results (Figure 4B) showed that DMSO (the solvent of Cela) and GCTR conjugate did not affect the cell viability of hepatoma cells (HepG2 cells or BEL-7402 cells) and normal hepatocytes (L-02 cells) at the experimental concentrations and exhibited a good safety profile.
One μg/mL of free Ce6 had a weak cytotoxic effect on HepG2, similar to that on BEL-7402 cells. The cell survival rates at 24, 48, and 72 h after Ce6 exposure to NIR were 1.45-, 2.24-, and 2.00-fold lower than those in the group without NIR in HepG2 cells, and 3.28-, 2.82-, and 2.76-fold lower than those in the group without NIR in BEL-7402 cells, indicating that ROS produced by Ce6 exposed to NIR has a strong cytotoxic effect on hepatoma cells. Ce6 did not significantly affect the cell viability of L-02 cells.
Free Cela had no specific selective effect on hepatoma cells or normal hepatocytes and significantly inhibited the proliferation of all three cell lines.
Similar to Cela/GCTR PMs, Cela/Ce6/GCTR PMs inhibited BEL-7402 and HepG2 cell proliferation while L-02 cells remained unaffected, indicating that Cela can target liver cancer cells after being encapsulated in GCTR PMs, which can effectively reduce its damage to normal hepatocytes. Inhibition of cell proliferation by Cela/Ce6/GCTR PMs on hepatoma cells was noticeable. After NIR irradiation, the cell viability rate significantly decreased in a time-dependent characteristic. The survival rates of HepG2 cells in the Cela/Ce6/GCTR PMs with NIR group at 24, 48, and 72 h were 1.22-, 1.62-, and 4.80-fold lower than those in the group without NIR, and 1.21-, 1.39-, and 3.22-fold lower than those of the Cela/GCTR PMs group, showing better cell proliferation inhibition. A similar effect on BEL-7402 cells was observed. The cytotoxicity results suggest that the administration of Cela/Ce6/GCTR PMs combined with PDT exhibited a strong cytotoxic effect on hepatoma cells.
The high cytotoxicity of Cela/Ce6/GCTR PMs combined with PDT is related to the killing effect of ROS produced by Ce6 in GCTR PMs on tumor cells irradiated by NIR and the cytotoxicity resulting from the rapid release of drugs due to the ROS-induced destruction of PMs. Cela/Ce6/GCTR PMs are sensitive to ROS and display significant cytotoxicity in the high ROS environment, and PDT produces ROS to kill tumor cells. Therefore, Cela/Ce6/GCTR PMs combined with PDT act in synergy to enable ROS-responsive PM-based chemotherapy and PDT combination.
Cellular Uptake
The results of uptake by hepatoma cells (BEL-7402 and HepG2 cells) and normal hepatocytes (L-02 cells) are shown in Figure 5A. Ce6 dissolved in DMSO was taken up by HepG2 cells; the same happened with BEL-7402 cells. Ce6 was distributed mainly in the cytoplasm, as indicated by green fluorescence. Additionally, HepG2 and BEL-7402 cells showed uptake of Cela/Ce6/GCTR PMs, as indicated by the observation of blue (nuclei) and green fluorescence (Ce6 in the PMs). In L-02 cells, only blue nuclei and minimal green fluorescence were observed, indicating that normal liver cells do not take up Ce6 and Cela/Ce6/GCTR PMs, suggesting that Ce6 and Cela/Ce6/GCTR PMs target liver cancer cells and have a weak toxic effect on normal liver cells.
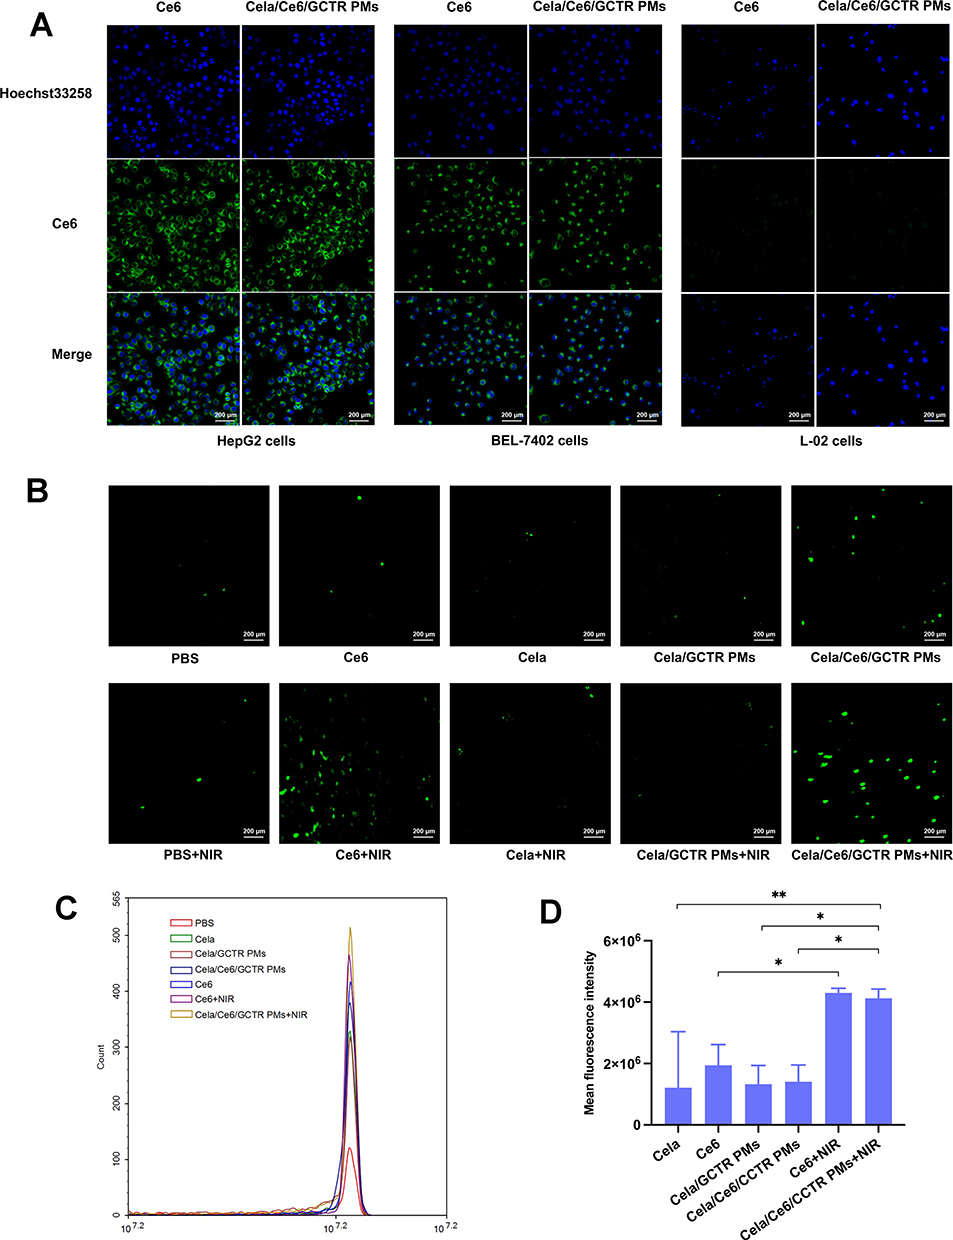 |
Figure 5 (A) Images of in vitro cellular uptake of Cela and Cela/Ce6/GCTR PMs by HepG2, BEL-7402, and L-02 cells by CLSM (×200). Blue: nucleus stained by Hoechst 33258, green: Ce6. (B) CLSM images (×200) of intracellular ROS production in different treatment groups. Green: ROS. (C) Histogram and (D) mean fluorescence intensity of ROS produced in HepG2 cells analyzed by flow cytometry (mean ± SD, n=3). * p < 0.05, ** p < 0.01. |
Detection of Intracellular ROS Production
ROS produced by NIR-treated Ce6 and Cela/Ce6/GCTR PMs in HepG2 cells was analyzed qualitatively by CLSM and quantitatively by flow cytometry. The results are presented in Figure 5B–D. Weak green fluorescence (ROS detected by DCFH-DA) was observed in blank cells in PBS, indicating that ROS were present in HepG2 cells. No significant changes in the ROS level were observed in Cela or Cela/GCTR PMs before and after irradiation. After NIR treatment, the fluorescence intensities of Ce6 and Cela/Ce6/GCTR PMs were significantly enhanced; 2.22- and 2.93-fold higher intensities than those without NIR treatment were observed, respectively (p < 0.05), indicating a high level of ROS production. Compared to that in the free Cela and Cela/GCTR PMs groups, the fluorescence intensity in the Cela/Ce6/GCTR PMs + NIR group was 3.41- and 3.11-fold higher, respectively, showing significant differences (p < 0.05 or 0.01), proving that Ce6 in Cela/Ce6/GCTR PMs can produce high levels of ROS in response to NIR irradiation. The Cela/Ce6/GCTR PMs system can therefore produce strong PDT effects.
In vivo Imaging Analysis
The distribution of Cela/Ce6/GCTR PMs in vivo was visualized by an in vivo imaging system. Images and data are presented in Figure 6. As shown in Figure 6A–D, free Ce6 was distributed mainly in the liver, lung, and tumor sites of H22 tumor-xenografted mice. Accumulation of Ce6 in tumors is advantageous for PDT. Ce6 metabolizes rapidly and is cleared quickly from the body. After 2 h, Ce6 is hardly observable in the organs, which is consistent with literature reports.34–36 Cela/Ce6/GCTR PMs can be targeted to liver tumor sites upon entry into mice bodies, with a higher fluorescence intensity in the liver and tumor tissue and a lower intensity in non-target organs (Figure 6B). Cela/Ce6/GCTR PMs showed a long duration of fluorescence intensity in vivo, and the intensity was stronger than that of free Ce6, indicating that Cela/Ce6/GCTR PMs can deliver more Ce6 to the tumor site via its active and passive targeting behaviors, which is conducive to the PDT for tumors. However, this also means that patients need to avoid light for a longer period during PDT. At the same dose, the PMs can deliver more Ce6 to the tumor site, which can produce a better PDT effect, and also allows rapid drug release from ROS-responsive PMs to enhance the synergistic anti-tumor effects of Cela and PDT. The organs and the whole-body fluorescence intensity in the Cela/Ce6/GCTR PMs group tended to increase and then decrease, with the strongest intensity observed in the tumor at 4 h (Figure 6E). PDT should therefore be performed at the tumor site 4 h post administration to maximize the combined anti-tumor therapeutic effect. These results will guide subsequent animal experiments and provide a data basis for clinical studies.
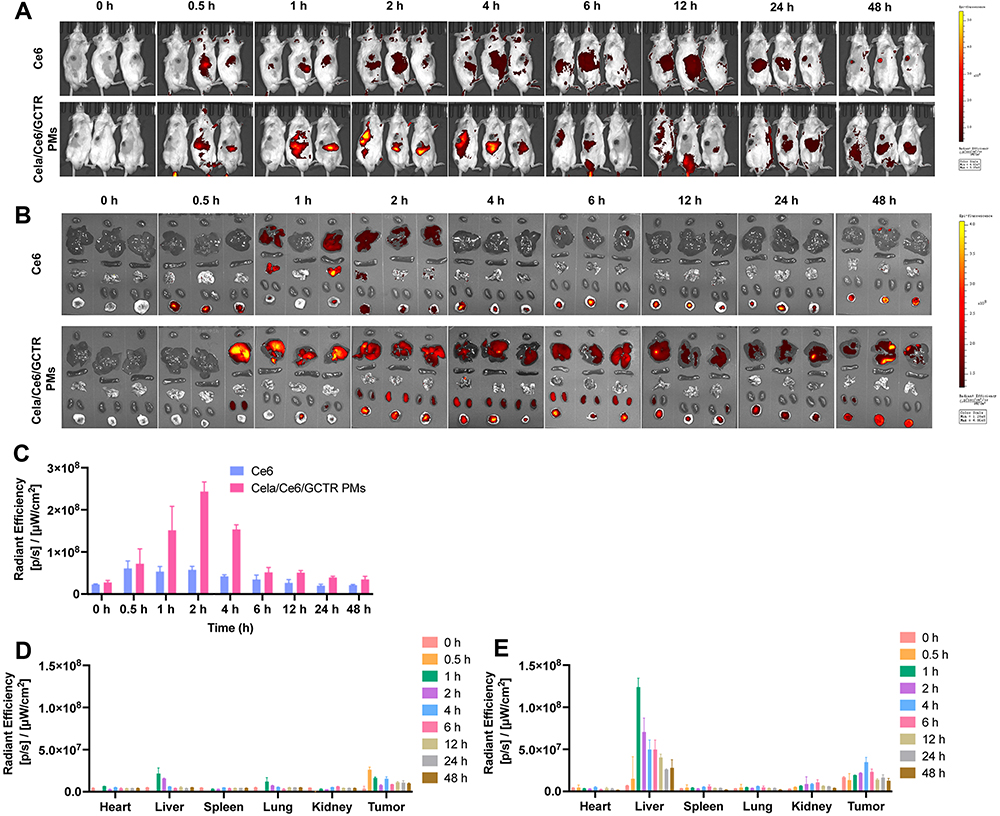 |
Figure 6 Images of (A) in vivo whole-body and (B) ex vivo organs and tumors of H22 tumor-xenografted ICR mice intravenously injected with Ce6 or Cela/Ce6/GCTR PMs. The organs and tumors shown are (from top to bottom) the heart, liver, spleen, lung, kidney, and tumor; (C) whole-body fluorescence intensity; fluorescence intensity of ex vivo organs and tumors after mice were tail intravenously injected with (D) Ce6 or (E) Cela/Ce6/GCTR PMs (n=3). |
Pharmacokinetics and Tissue Distribution Studies
The concentrations of Cela and Ce6 in plasma samples at each time point were determined by UPLC-MS/MS, and the Cela and Ce6 plasma concentration–time curves were plotted. As shown in Figure 7A, a major metabolic elimination phase occurred in vivo after administration of each Cela formulation, with similar Cela concentrations at the initial time point, after which the plasma Cela concentration decreased substantially. In the free Cela group, the blood concentration was 64.96 ± 22.74 ng/mL at 24 h. At 48 h, Cela was almost eliminated from the blood, with a blood concentration of 46.31 ± 8.63 ng/mL. Cela blood concentrations in Cela-loaded PMs groups began to slowly decrease after 2 h and remained stable until 48 h, with consistently higher Cela concentrations in plasma. Cela concentration administrated with Cela/Ce6/GCTR PMs at 48 h (675.87 ± 44.35 ng/mL) was slightly higher than that in the Cela/GCTR PMs group (554.59 ± 36.47 ng/mL) and was always higher than that of free Cela.
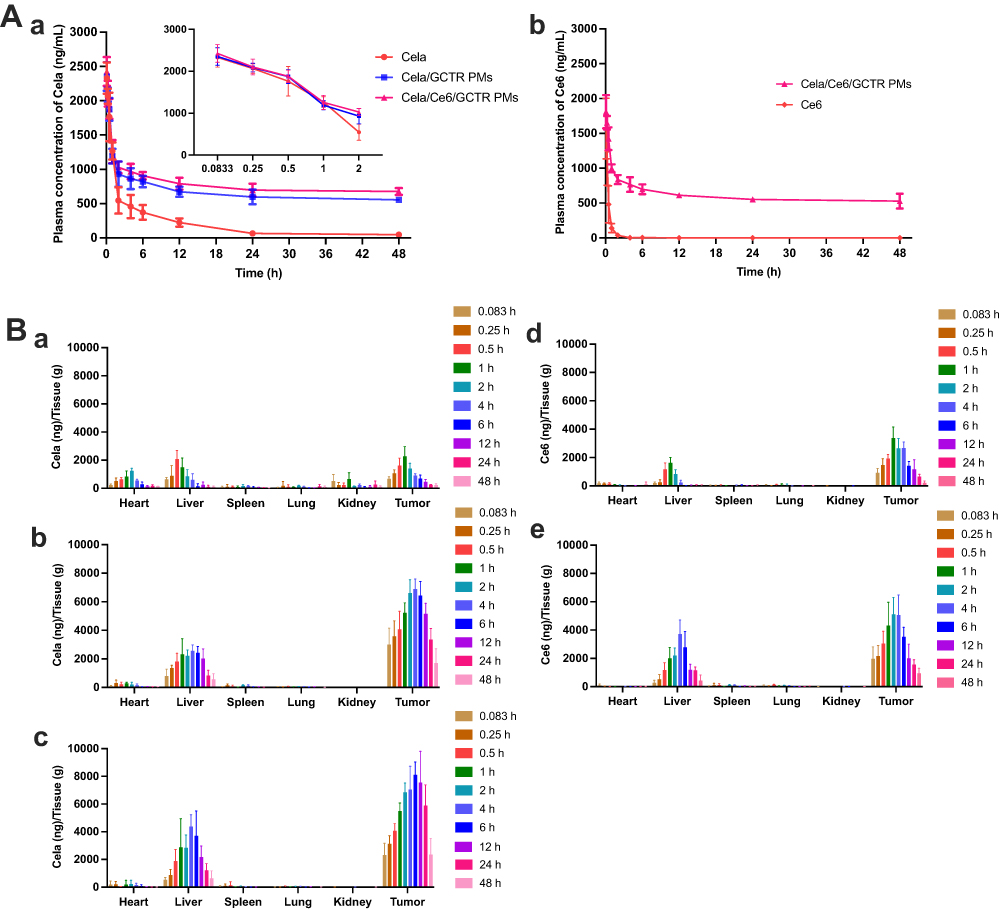 |
Figure 7 (A) Plasma concentration–time curves of a Cela and b Ce6 after tail intravenous injection of different formulations into H22 tumor-xenografted mice (n=6). (B) Cela concentration in each organ or tumor of tumor-xenografted mice after injection of a Cela, b Cela/GCTR PMs, and c Cela/Ce6/GCTR PMs, and Ce6 concentration in each organ or tumor after injection of d Ce6 and e Cela/Ce6/GCTR PMs (n=6). |
Ce6 plasma concentration administrated with Cela/Ce6/GCTR PMs showed the same trend, with a concentration of 1811.05 ± 206.58 ng/mL at 5 min. After 2 h, the blood concentration decreased slowly and maintained at a higher concentration. At 48 h, the blood concentration was 527.51 ± 97.92 ng/mL. Free Ce6 was metabolized and eliminated quickly and the concentration of Ce6 was almost undetectable in the blood at 1 h.
The results of the pharmacokinetic parameters analysis by DAS 2.0 software are shown in Table 1. In the Cela/Ce6/GCTR PMs group, the AUC(0-t) and MRT(0-∞) of Cela were 4.19- and 5.52-fold higher respectively than these parameters in the free Cela group in vivo; T1/2 was prolonged from 8.95 ± 3.55 h of free Cela to 43.87 ± 2.80 h; CL was reduced to 0.03 ± 0.01 L/h/kg; the AUC(0-t) and Cmax values for Ce6 were 33.08- and 1.79-fold higher than those of free Ce6, indicating that the PMs improved the bioavailability of Ce6 as well as Cela.
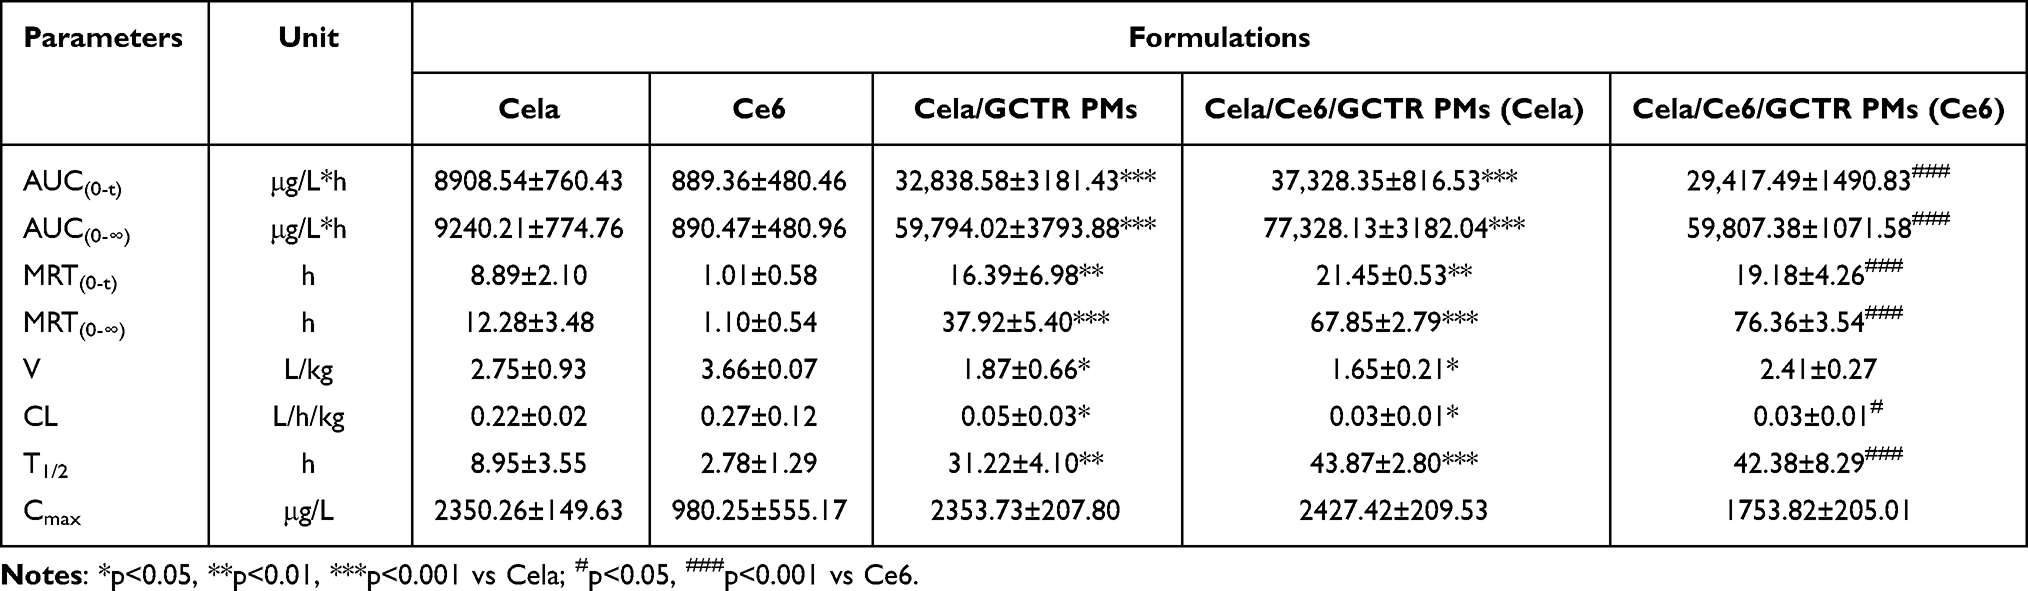 |
Table 1 Pharmacokinetic Parameters of Different Formulations After Intravenous Administration to H22 Tumor-Xenografted ICR Mice (Mean ± SD, n=6) |
The above results indicate that Cela and Ce6 encapsulated by GCTR PMs could bypass direct contact with the complex physiological environment of blood to avoid rapid elimination. This resulted in a prolonged half-life and time in the blood circulation that enabled sustained and long-term anti-tumor effects and an improved therapeutic effect. Although the PMs extend the persistence of Ce6 in the body, which necessitates a longer period of light avoidance for patients, it also allows patients more time to undergo PDT. The prolongation of MRT of Ce6 in the blood and the reduction of CL increased the probability of Ce6 actively and passively targeting tumors via PMs. Ultimately, Ce6 accumulation in the tumor tissues was higher than free Ce6 accumulation, resulting in high PDT efficacy.
The Cela and Ce6 concentrations in each organ and tumor tissue of tumor-bearing mice after administration as determined using UPLC-MS/MS are presented in Figure 7B. The drug-loaded PMs did not significantly accumulate in the heart, effectively reducing the cardiotoxicity of Cela. Compared with free Cela, Cela administered via the two PMs was almost undetectable in the lung, spleen, and kidney, effectively reducing the toxicity to these nontarget organs. The two PM groups maintained higher Cela concentrations and longer retention times in the liver and tumor within the detection time, with significantly more Cela accumulation than that in the free Cela group (p < 0.05, 0.01, or 0.001). In the Cela/Ce6/GCTR PMs group, the Cela concentration in the tumor increased gradually from the time of administration and continued to increase after NIR irradiation at the tumor site at 4 h. Cela reached a maximum concentration of 8108.80 ± 805.75 ng/g at 6 h. Thereafter, the Cela concentration slowly decreased, and a high concentration of Cela remained in the tumors at 48 h. Between 6 and 24 h, Cela concentrations in the two PM groups were significantly different (p < 0.01), indicating that NIR irradiation promotes Ce6-mediated ROS production, which causes GCTR PM rupture and the subsequent rapid release and accumulation of Cela in the tumor tissues. These results also demonstrate the synergistic effect of PDT and ROS-responsive PM-based chemotherapy.
Additionally, in the combination therapy group, the Ce6 concentrations in tumors at all time points were significantly higher than the Ce6 concentrations in the free Ce6 group. This result indicates that the targeting of Ce6 to tumors is also enhanced by the PMs, which enhances the efficacy of PDT.
To better illustrate the targeting behavior of Cela/Ce6/GCTR PMs, three targeting evaluation parameters (Te, Re, and Ce) were calculated using AUC or Cmax of Cela and Ce6 in the tissues and plasma, and the results are shown in Table 2. Liver and tumor Te values of Cela in the Cela/Ce6/GCTR PMs with NIR group were 1.96- and 3.27-fold higher than the values of free Cela, and 1.13- and 1.25-fold higher than the values in the Cela/GCTR PMs group; Re values were 1.31- and 1.45-fold higher than the values in the Cela/GCTR PMs group, and Ce values were 1.70- and 1.18-fold higher than the values in the Cela/GCTR PMs group. These results suggest that Cela/Ce6/GCTR PMs combined with NIR irradiation exhibit good liver- and tumor-targeting abilities, which are superior to Cela or Cela/GCTR PMs. For Ce6 in the PMs with NIR group, the liver and tumor Te values were respectively 1.32- and 1.88-fold higher than the values of free Ce6, indicating that Cela/Ce6/GCTR PMs combined with NIR irradiation can also enhance the targeting and accumulation of Ce6 in the livers and tumors.
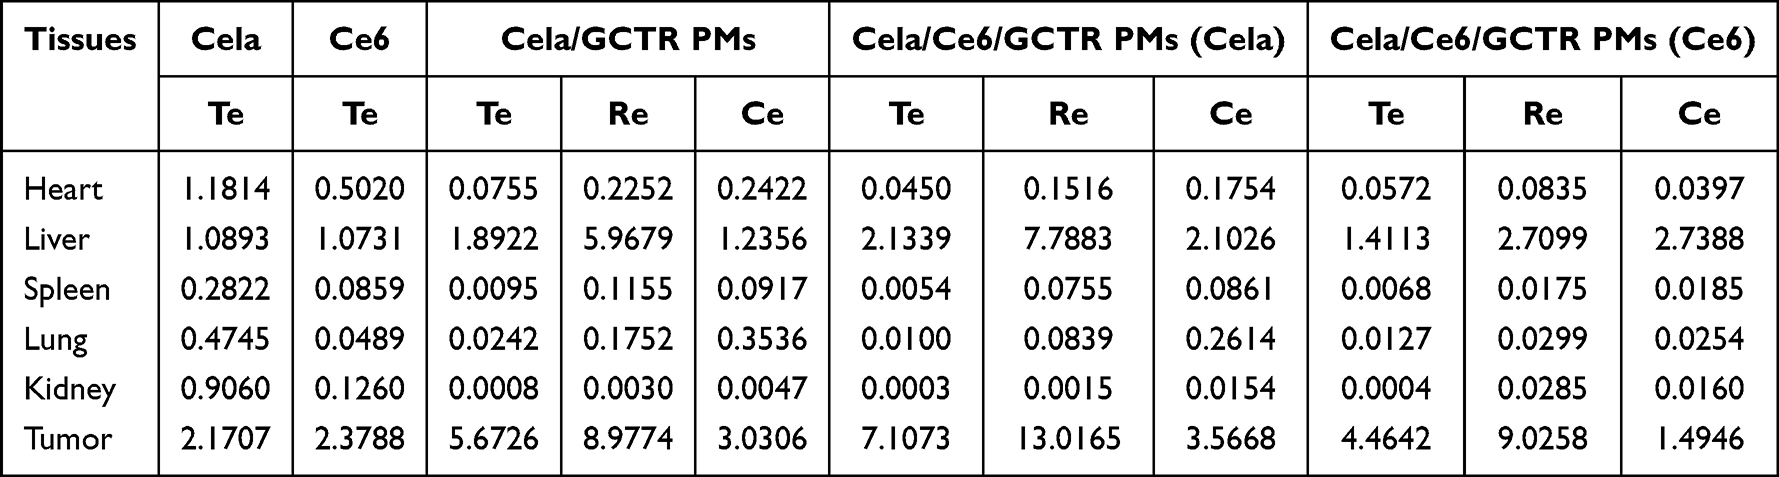 |
Table 2 Te, Re, and Ce Values of Cela and Ce6 in Organs and Tumors of Tumor-Xenografted Mice After Injection of Different Formulations |
The Te, Re, and Ce values showed that Cela/Ce6/GCTR PMs in combination with NIR significantly reduced the accumulation of Cela and Ce6 in organs other than the liver and tumor, thereby reducing the damage to these organs. Notably, the Te value of Cela for the kidney in the Cela/Ce6/GCTR PMs with NIR group is three ten thousandth of that of free Cela, and the Te value of Ce6 in the same group is three thousandth of that of free Ce6, which greatly reduces the accumulation in the kidney.
Due to the high affinity of GCTR PMs for GA receptors on the surface of liver tumors, the active targeting of drug-loaded PMs to liver and hepatoma cells altered the distribution of Cela and Ce6 in the tissues, with reduced concentrations in organs other than the liver, and further improved the drug’s retention in hepatoma cells when combined with PDT.
In vivo anti-tumor efficacy
To assess the in vivo antineoplastic efficacy of Cela/Ce6/GCTR PMs combined with PDT, tumor volumes were recorded daily. As shown in Figure 8A, the tumor growth in the control group was rapid from the first administration, with a final tumor volume 6.75-fold higher than that before administration. The final tumor volumes in the oxaliplatin, free Cela, Cela/GCTR PMs, Cela/Ce6/GCTR PMs groups, and the group combined with NIR were respectively 3.69-, 4.50-, 4.11-, 3.06-, and 2.22-fold higher than those before administration, with significant differences compared to those in the control group (p < 0.001). After NIR irradiation for Cela/Ce6/GCTR PMs therapy, the tumor growth was relatively slow, and the tumor inhibition effect was significantly different from that of free Cela at the same dose (p < 0.001), and more effective than that of Cela/GCTR PMs (p < 0.05). Tumor growth volume monitoring results demonstrated that Cela and Ce6 co-loaded in GCTR PMs, combined with PDT, exhibit superior anti-tumor effects.
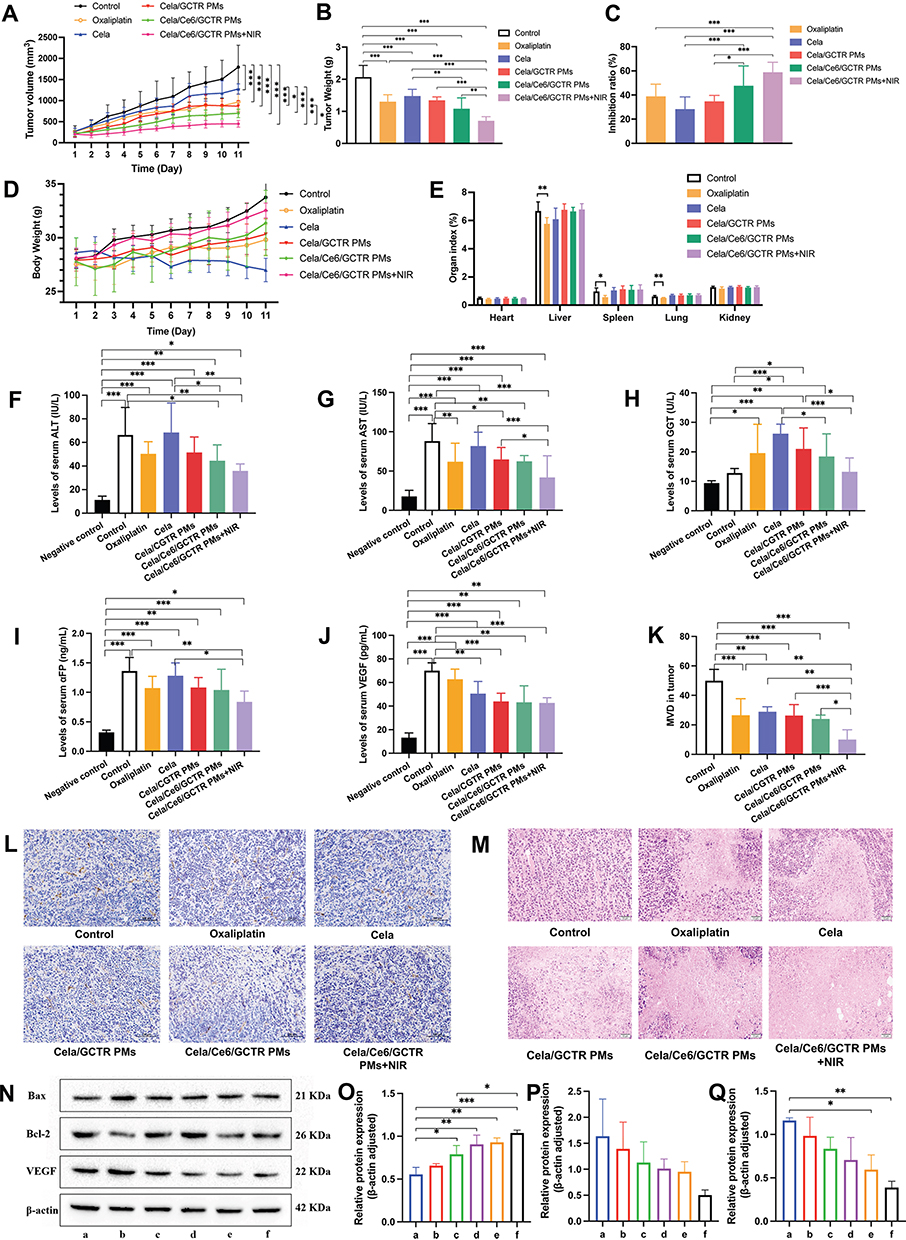 |
Figure 8 Anti-tumor efficacy in tumor-xenografted mice of different formulations. (A) Tumor volume change curves during treatment (10 days); (B) tumor weight; (C) tumor inhibition rate; (D) body weight change curves during treatment (10 days); (E) organ indexes; (F) serum ALT, (G) AST, (H) GGT, (I) αFP, and (J) VEGF concentrations; (K) tumor MVD; (L) immunohistochemical staining for CD34 in tumor sections (×200); (M) H&E strained tumor sections (×400); (N) Western blotting detection of (O) Bax, (P) Bcl-2, and (Q) VEGF in tumor tissues of a control, b oxaliplatin, c Cela, d Cela/CGTR PMs, e Cela/Ce6/GCTR PMs, f Cela/Ce6/GCTR PMs + NIR. n=8, * p < 0.05, ** p < 0.01, and *** p < 0.001. |
Two days after the last injection, tumor-bearing mice were sacrificed. The tumors in each group were dissected and weighed. The tumor inhibition rate, an important indicator of efficacy, was calculated. The results are presented in Figure 8B and C. Compared with the control group (2.07 ± 0.34 g), Wtumor in all formulation groups decreased, and significantly higher tumor inhibition rates were observed (p < 0.05). Wtumor and inhibition rate in the oxaliplatin group were comparable to that in the Cela/GCTR PMs group, indicating that these two formulations had similar anti-tumor effects. Compared with that in the Cela/GCTR PMs group, Wtumor in the Cela/Ce6/GCTR PMs group was lower. After NIR irradiation, Wtumor was significantly lower (0.71 ± 0.12 g), and the tumor inhibition rate was higher (66.95 ± 4.84%), indicating that PM-based chemotherapy combined with PDT improves the anti-tumor effects.
Weight change is an easily observable indicator for assessing the toxicity and side effects of drugs. As shown in Figure 8D, the mice in the free Cela group lost weight, with a 6% decrease in body weight compared to before administration. This result is likely due to the toxicity and side effects of Cela, which led to a decrease in body function and weight loss. In the control group, the weights of mice increased daily, and the final weights were increased by 20% higher than before administration. This may be due to the mice not receiving treatment and the tumor gradually spreading and growing. The weights of mice in the other groups increased in varying degrees. The final weights of the mice in the oxaliplatin, Cela/GCTR PMs, Cela/Ce6/GCTR PMs groups, and the group that underwent NIR irradiation increased by 8%, 9%, 13%, and 16%, respectively. Therefore, these formulations exerted a therapeutic effect, and the body condition of the mice improved, as evidenced by the gradual weight gain observed.
The organ indexes of the different formulations are shown in Figure 8E. No significant effects on organs were observed in the drug-loaded PMs group. In the positive drug oxaliplatin group, damage to the liver, spleen, and lung was observed, as reflected by the significant decrease in liver and spleen indexes and the slight decrease in lung index. Free Cela administration significantly damaged the liver, and the liver index was significantly reduced. The tissue distribution and in vivo imaging experiments proved that Cela/Ce6/GCTR PMs efficiently target the liver without producing toxic side effects, as suggested by the organ index data. The two PM formulations can reduce the toxicity and side effects of Cela, and protect nontarget organs.
As sensitive markers of liver cell damage, ALT and AST concentrations in serum increase abnormally when the liver is damaged.37,38 When the liver becomes inflamed or cancerous, GGT levels in serum increase.39 ALT, AST, and GGT concentrations after treatment in each group are shown in Figure 8F–H. The negative control group reflects ALT, AST, and GGT levels in normal mice. The tumor-bearing mice control group exhibited more severe liver damage, as shown by higher levels of ALT, AST, and GGT. In the free Cela group, AST, ALT, and GGT concentrations were high, suggesting that the liver function of mice was severely damaged and that Cela may exhibit hepatotoxic effects. In contrast, significant hepatoprotective effects were observed in the Cela/Ce6/GCTR PMs group, with lower ALT, AST, and GGT values (p < 0.01 or 0.001) after NIR irradiation, which significantly reduced Cela-induced liver damage (p < 0.01).
αFP is the most widely used tumor marker for diagnosing PHC.40,41 VEGF is an essential factor in developing liver cancer that is highly expressed in the sera of patients with malignant tumors.42,43 In this study, the serum αFP and VEGF levels in different groups of tumor-bearing mice were detected to determine the therapeutic effect of formulations, as shown in Figure 8I and J. The serum concentrations of αFP and VEGF were lower in normal mice and significantly higher than those in the control group (p < 0.001). After Cela/Ce6/GCTR PMs treatment combined with PDT, the serum αFP concentration in the tumor-xenografted mice decreased to 0.84 ± 0.18 ng/mL, which was significantly lower than that in the free Cela group (p < 0.01), and the VEGF concentration decreased to 42.69 ± 4.46 pg/mL, indicating improved liver cancer treatment efficacy compared with other treatments.
MVD is the main marker of tumor angiogenesis, which can be used to evaluate tumor angiogenesis and has important significance in differentiating liver cancer.44 CD34 is a hepatoma-specific antibody that can be visualized in hepatoma tissues by microvascular endothelial cell staining and better reflects the tumor microangiogenesis.45,46 The immunohistochemical CD34 staining results of tumor tissues from tumor-bearing mice in each group are shown in Figure 8K and L. Tumor cells display brownish granules in the cytoplasm, and the microvessels were fissured or branched and were distributed diffusely and uniformly in the tumor tissues. In the control, oxaliplatin, free Cela, Cela/CGTR PMs, Cela/Ce6/GCTR PMs, and Cela/Ce6/GCTR PMs with NIR groups, the MVD of the tumor tissues were 49.94 ± 7.68, 26.50 ± 11.28, 28.89 ± 3.42, 26.25 ± 7.46, 24.00 ± 2.65, and 10.00 ± 6.73, respectively. After combination with PDT, CD34 was expressed weakly in the Cela/Ce6/GCTR PMs group, with the lowest MVD value. Compared with the other treatment groups, the Cela/Ce6/GCTR PMs combined with PDT group showed superior anti-tumor angiogenesis ability and the most effective inhibition of tumor growth, with significant differences (p < 0.05, 0.01, or 0.001).
The safety and efficacy of each formulation group were evaluated by morphological observation after H&E staining of each organ and tumor tissue section of tumor-bearing mice. As presented in Figure S1, in the free Cela group, vacuoles were observed in the heart tissue sections, indicating that Cela had some cardiotoxic effects. In the liver tissue section, liver cell arrangement was loose and disordered, the boundary of the outer membrane was unclear, and vacuolar degeneration and inflammatory cell infiltration accompanied by necrosis and edema were observed, indicating severe liver injury. Loose cell arrangement was also displayed in the Cela/GCTR PMs and oxaliplatin groups, but the degrees of hepatocyte inflammation and necrosis were less than those in the Cela group, and a lesser degree of vacuolation was observed, which alleviated liver injury.
Cela/Ce6/GCTR PMs administration combined with or without PDT did not result in damage to the heart, spleen, lung, or kidney, with no obvious lesions observed in tissue sections. The liver membrane boundary was clear, and the nucleus staining was obvious. No obvious vacuoles were observed in liver tissue, and the degree of cell degeneration and necrosis was notably lower than that in the Cela group, suggesting that the damage to the liver was decreased.
As shown in Figure 8M, in the control group, tumor cells of tumor-bearing mice were stained purple and were attached to the matrix composed of collagen and reticular fibers and closely arranged. Binucleate and multinucleate cells were observed, indicating the vigorous growth of tumor cells. In other groups, the tumor tissues were loosely arranged, with diffuse neutrophil infiltration, and large portions of necrotic tissue in the section center, and higher levels of tumor cell death were observed. Notably, after the Cela/Ce6/GCTR PMs administration combined with PDT, the largest necrotic tumor area in the field of view and the increased level of tumor cell death indicated the most obvious tumor growth inhibition effect.
Bcl-2 and Bax are key factors in the process of apoptosis.47,48 VEGF in tumors enhances angiogenesis and increases tumor cell migration and invasion.49,50 Bax, Bcl-2, and VEGF in tumor tissues in each group of tumor-bearing mice were detected via Western blotting as presented in Figure 8N–Q. The Bax protein expression in the control group was the lowest, while Bcl-2 and VEGF protein expression were the highest, indicating strong tumor growth ability. After the mice in the Cela/Ce6/GCTR PMs group were exposed to NIR irradiation, Bax expression was higher than that in the free Cela group (p < 0.05), and Bcl-2 and VEGF expression decreased. The results suggested that the combination therapy exerted anti-tumor effects by promoting the apoptosis of cancer cells and inhibiting tumor angiogenesis.
Discussion
Cela, a natural compound with multiple pharmacological activities, presents a significant anti-hepatoma efficacy. However, its clinical application is limited due to its physical and chemical properties, non-tumor targeting, and toxic side effects on the heart, liver, and kidney.6,12,51,52 In recent years, some research, such as structural modification of Cela, preparation of nanoparticles, micelles, and nano-suspensions, are investigated to solve its application defects.10,12,53 We designed and synthesized GCTR PMs with hepatoma-targeting and ROS-responsive properties in our previous work to solve the application problem of Cela.23 GCTR PMs can encapsulate Cela and deliver Cela to liver tumors in vivo. However, due to the fluctuation of the endogenous ROS level in tumor cells, differences in different regions of tumor tissues and different stages of tumor cells,54 it is not enough to rely solely on tumor’ ROS for the rapid release of Cela from the PMs. Therefore, this drug delivery system is further improved by combining photodynamic therapy. After laser irradiation at the tumor site, Ce6 in Cela/Ce6/GCTR PMs accumulated at the tumor site produced a large number of ROS, which combined with the endogenous ROS at the tumor site, accelerated the release of Cela from the GCTR PMs, and promoted the anti-tumor effect. We developed Cela/Ce6/GCTR PMs which amplify ROS-mediated drug release through photodynamic therapy, thereby synergistically enhancing the efficacy of Cela and photodynamic therapy for treating tumors.
PDT is a minimally invasive technique that uses specific wavelengths of light to irradiate photosensitizers in tumors to generate ROS and induce tumor cell death.28 ROS produced by photodynamic therapy can directly kill tumor cells by inducing apoptosis, necrosis, or autophagy, and can also destroy the tumor vascular system, causing tumor ischemia or inducing immune response to indirectly kill tumor cells.29 As one of the most used second-generation photosensitizers in PDT, Ce6 produces ROS with high singlet oxygen generation efficiency under a laser, which can effectively destroy the structure and function of tumor cells. While Ce6 is hydrophobic which leads to its poor biodistribution and rapid clearance from the body.30 GCTR PMs enhanced Ce6 solubility, bioavailability, and hepatoma-targeting behavior, thereby improving tumor accumulation of Ce6 through passive and active targeting, resulting in enhanced PDT. In addition, Ce6 is a near-infrared fluorescence imaging dye that works in the spectral range of 650-900 nm, which avoids the absorption and scattering of light by endogenous tissue chromophores in deep tissues.55 The advantages of Ce6, such as low dark toxicity, easy processing, high activation capacity, and high single-line oxygen production, make it an excellent photosensitizer for PDT, and it has been introduced into the diagnosis and treatment of most cancers.30 Therefore, in this study, Ce6 was used as a photosensitizer and was co-loaded with Cela into GCTR PMs to implement the chemo-photodynamic combination therapy.
Cela/Ce6/GCTR PMs administration combined with PDT effectively inhibits tumor growth, results in a high tumor inhibition rate, reduces the serum αFP and VEGF concentrations in tumor-bearing mice, reduces the MVD of tumor tissue, increases the necrosis of tumor tissue, increases Bax expression in tumors, reduces Bcl-2 and VEGF expression in the tumor, thus showing higher anti-tumor efficacy than free Cela and the two PMs in the study. Additionally, organ index, weight change curve, serum ALT, AST and GGT concentrations, and organ tissue section analysis indicate that Cela/Ce6/GCTR PMs administration combined with PDT effectively reduces the toxicity and side effects of Cela. The main reasons for the good anti-tumor efficacy and low toxicity of the PMs combined with PDT can be summarized as follows. First, due to GA on the PMs and the small particle size of PMs, Cela/Ce6/GCTR PMs effectively reach tumor tissues via active targeting of GA and passive targeting via enhanced permeability and retention effect after administration, accumulate in tumor tissues, and reduce the distribution in other normal tissues. And Cela/Ce6/GCTR PMs increase MRT and decrease CL of Cela in vivo, increasing the likelihood of drugs reaching tumor tissue. Second, due to the encapsulation of the PMs with a shell-core structure and sustained release in blood, the direct contact between Cela and normal tissues during circulation is avoided, and the toxicity is reduced by delivering Cela to the tumor tissues. Third, due to the presence of ROS-sensitive TK bonds in the structure of GCTR PMs, these structures rapidly rupture in the high ROS level environment of tumors and generate more ROS in response to NIR irradiation to accelerate structural destruction and drug release. Combined with the killing effect of PDT-induced ROS in the tumor tissue, Cela-loaded hepatoma-targeting and ROS-responsive PM-based chemotherapy combined with PDT produces more efficacious anti-tumor effects. Therefore, Cela/Ce6/GCTR PMs administration combined with PDT is advantageous as a tumor therapy.
Conclusion
The antineoplastic drug Cela and the photosensitizer Ce6 were co-encapsulated in ROS-responsive liver-targeting GCTR PMs with small particle sizes and high drug-loading capacity. The Cela/Ce6/GCTR PM delivery system exhibited good biosafety and ROS-responsive drug release characteristics. Cela/Ce6/GCTR PMs prolonged the MRT of Cela in vivo, enhanced the targeting to liver tumors, and improved the bioavailability of Cela. Combined with PDT, Cela/Ce6/GCTR PMs enhanced the anti-tumor efficacy of Cela and reduced the toxicity and side effects on normal tissues and organs. This combination therapy reduces the dependence of ROS-responsive PMs on the concentration of ROS at the tumor site and overcomes the limitations of traditional monotherapy by means of intelligent responsive drug release. Based on these advantages, hepatoma-targeting and ROS-responsive PMs combined with PDT provide new strategies for novel tumor treatment approaches.
Acknowledgments
This work was financially supported by the Project of Fujian Provincial Department of Science and Technology (No. 2020Y0050, 2021J01922, 2024Y0026), the Project of Fujian University of Traditional Chinese Medicine (No. X2023020), Fujian Provincial Chinese Medicine Preparations and Quality Control Engineering Technology Research Center, and Fujian Key Laboratory of Chinese Materia Medica.
Disclosure
The authors report no conflicts of interest in this work.
References
1. Llovet JM, Kelley RK, Villanueva A, et al. Hepatocellular carcinoma. Nat Rev Dis Primers. 2021;7(1):6. doi:10.1038/s41572-020-00240-3
2. Rumgay H, Arnold M, Ferlay J, et al. Global burden of primary liver cancer in 2020 and predictions to 2040. J Hepatol. 2022;77(6):1598–1606. doi:10.1016/j.jhep.2022.08.021
3. N.H. CGOo. Standard for diagnosis and treatment of primary liver cancer (2022 edition). J Clin Hepatol. 2022;38(2):288–303. doi:10.3969/j.issn.1001-5256.2022.02.009.
4. Ronnebaum S, Aly A, Patel D, Benavente F, Rueda JD. Systematic literature review of trials assessing recommended systemic treatments in hepatocellular carcinoma. Hepatol Oncol. 2022;9(1):HEP41. doi:10.2217/hep-2021-0003
5. Chen SR, Dai Y, Zhao J, Lin L, Wang Y, Wang Y. A mechanistic overview of triptolide and celastrol, natural products from tripterygium wilfordii Hook F. Front Pharmacol. 2018;9:104. doi:10.3389/fphar.2018.00104
6. Wang C, Dai S, Zhao X, et al. Celastrol as an emerging anticancer agent: current status, challenges and therapeutic strategies. Biomed Pharmacother. 2023;163:114882. doi:10.1016/j.biopha.2023.114882
7. Zhang CJ, Zhu N, Long J, et al. Celastrol induces lipophagy via the LXRalpha/ABCA1 pathway in clear cell renal cell carcinoma. Acta Pharmacol Sin. 2021;42(9):1472–1485. doi:10.1038/s41401-020-00572-6
8. Li M, Xie F, Wang L, Zhu G, Qi LW, Jiang S. Celastrol: an update on its hepatoprotective properties and the linked molecular mechanisms. Front Pharmacol. 2022;13:857956. doi:10.3389/fphar.2022.857956
9. Lim HY, Ong PS, Wang L, et al. Celastrol in cancer therapy: recent developments, challenges and prospects. Cancer Lett. 2021;521:252–267. doi:10.1016/j.canlet.2021.08.030
10. Lu Y, Liu Y, Zhou J, Li D, Gao W. Biosynthesis, total synthesis, structural modifications, bioactivity, and mechanism of action of the quinone-methide triterpenoid celastrol. Med Res Rev. 2021;41(2):1022–1060. doi:10.1002/med.21751
11. Shi J, Li J, Xu Z, et al. Celastrol: a review of useful strategies overcoming its limitation in anticancer application. Front Pharmacol. 2020;11:558741. doi:10.3389/fphar.2020.558741
12. Song J, He GN, Dai L. A comprehensive review on celastrol, triptolide and triptonide: insights on their pharmacological activity, toxicity, combination therapy, new dosage form and novel drug delivery routes. Biomed Pharmacother. 2023;162:114705. doi:10.1016/j.biopha.2023.114705
13. Zhou M, Liao J, Lai W, et al. A celastrol-based nanodrug with reduced hepatotoxicity for primary and metastatic cancer treatment. EBioMedicine. 2023;94:104724. doi:10.1016/j.ebiom.2023.104724
14. Cai Y, Qi J, Lu Y, He H, Wu W. The in vivo fate of polymeric micelles. Adv Drug Deliv Rev. 2022;188:114463. doi:10.1016/j.addr.2022.114463
15. Ghezzi M, Pescina S, Padula C, et al. Polymeric micelles in drug delivery: an insight of the techniques for their characterization and assessment in biorelevant conditions. J Control Release. 2021;332:312–336. doi:10.1016/j.jconrel.2021.02.031
16. Wang X, Zheng Y, Qiu L, et al. Evaluation and antitumor mechanism of functionalized chitosan-based polymeric micelles for oral delivery of paclitaxel. Int J Pharm. 2022;625:122138. doi:10.1016/j.ijpharm.2022.122138
17. Wang X, Guo Y, Qiu L, et al. Preparation and evaluation of carboxymethyl chitosan-rhein polymeric micelles with synergistic antitumor effect for oral delivery of paclitaxel. Carbohydr Polym. 2019;206:121–131. doi:10.1016/j.carbpol.2018.10.096
18. Moradi Kashkooli F, Soltani M, Souri M. Controlled anti-cancer drug release through advanced nano-drug delivery systems: static and dynamic targeting strategies. J Control Release. 2020;327:316–349. doi:10.1016/j.jconrel.2020.08.012
19. Mu W, Chu Q, Liu Y, Zhang N. A review on nano-based drug delivery system for cancer chemoimmunotherapy. Nanomicro Lett. 2020;12(1):142. doi:10.1007/s40820-020-00482-6
20. Scicluna MC, Vella-Zarb L. Evolution of nanocarrier drug-delivery systems and recent advancements in covalent organic framework–drug systems. Acs Appl Nano Mater. 2020;3(4):3097–3115. doi:10.1021/acsanm.9b02603
21. Fan XX, Xu MZ, Leung EL, Jun C, Yuan Z, Liu L. ROS-responsive berberine polymeric micelles effectively suppressed the inflammation of rheumatoid arthritis by targeting mitochondria. Nanomicro Lett. 2020;12(1):76. doi:10.1007/s40820-020-0410-x
22. Ghosh B, Biswas S. Polymeric micelles in cancer therapy: state of the art. J Control Release. 2021;332:127–147. doi:10.1016/j.jconrel.2021.02.016
23. Zhang X, Xu X, Wang X, et al. Hepatoma-targeting and reactive oxygen species-responsive chitosan-based polymeric micelles for delivery of celastrol. Carbohydr Polym. 2023;303:120439. doi:10.1016/j.carbpol.2022.120439
24. Kalyane D, Choudhary D, Polaka S, et al. Reactive oxygen nano-generators for cancer therapy. Prog Mater Sci. 2022;130(100974):100974. doi:10.1016/j.pmatsci.2022.100974
25. Tang Z, Liu Y, He M, Bu W. Chemodynamic therapy: tumour microenvironment-mediated Fenton and Fenton-like reactions. Angew Chem. 2019;58(4):946–956. doi:10.1002/anie.201805664
26. Zhou W, Jia Y, Liu Y, Chen Y, Zhao P. Tumor microenvironment-based stimuli-responsive nanoparticles for controlled release of drugs in cancer therapy. Pharmaceutics. 2022;14(11):11. doi:10.3390/pharmaceutics14112346
27. Wu W, Pu Y, Shi J. Nanomedicine-enabled chemotherapy-based synergetic cancer treatments. J Nanobiotechnology. 2022;20(1):4. doi:10.1186/s12951-021-01181-z
28. Chen J, Fan T, Xie Z, et al. Advances in nanomaterials for photodynamic therapy applications: status and challenges. Biomaterials. 2020;237:119827. doi:10.1016/j.biomaterials.2020.119827
29. Gunaydin G, Gedik ME, Ayan S. Photodynamic therapy-current limitations and novel approaches. Front Chem. 2021;9:691697. doi:10.3389/fchem.2021.691697
30. Hak A, Ali MS, Sankaranarayanan SA, Shinde VR, Rengan AK. Chlorin e6: a promising photosensitizer in photo-based cancer nanomedicine. ACS Appl Bio Mater. 2023;6(2):349–364. doi:10.1021/acsabm.2c00891
31. Jo YU, Sim H, Lee CS, Kim KS, Na K. Solubilized chlorin e6-layered double hydroxide complex for anticancer photodynamic therapy. Biomater Res. 2022;26(1):23. doi:10.1186/s40824-022-00272-8
32. Li L, Chen Y, Chen W, Tan Y, Chen H, Yin J. Photodynamic therapy based on organic small molecular fluorescent dyes. Chinese Chem Lett. 2019;30(10):1689–1703. doi:10.1016/j.cclet.2019.04.017
33. Guo S, Shi Y, Liang Y, Liu L, Sun K, Li Y. Relationship and improvement strategies between drug nanocarrier characteristics and hemocompatibility: what can we learn from the literature. Asian J Pharm Sci. 2021;16(5):551–576. doi:10.1016/j.ajps.2020.12.002
34. Wang Q, Gao Z, Zhao K, et al. Co-delivery of enzymes and photosensitizers via metal-phenolic network capsules for enhanced photodynamic therapy. Chinese Chem Lett. 2022;33(4):1917–1922. doi:10.1016/j.cclet.2021.11.040
35. Zhao LP, Zheng RR, Chen HQ, et al. Self-delivery nanomedicine for O(2)-economized photodynamic tumor therapy. Nano Lett. 2020;20(3):2062–2071. doi:10.1021/acs.nanolett.0c00047
36. Zhu T, Shi L, Yu C, et al. Ferroptosis promotes photodynamic therapy: supramolecular photosensitizer-inducer nanodrug for enhanced cancer treatment. Theranostics. 2019;9(11):3293–3307. doi:10.7150/thno.32867
37. Giannini EG, Testa R, Savarino V. Liver enzyme alteration: a guide for clinicians. CMAJ. 2005;172(3):367–379. doi:10.1503/cmaj.1040752
38. Niu A, Qi T. Diagnostic significance of serum type IV collagen (IVC) combined with aspartate aminotransferase (AST)/alanine aminotransferase (ALT) ratio in liver fibrosis. Ann Transl Med. 2022;10(24):1310. doi:10.21037/atm-22-5010
39. Corti A, Belcastro E, Dominici S, Maellaro E, Pompella A. The dark side of gamma-glutamyltransferase (GGT): pathogenic effects of an ‘antioxidant’ enzyme. Free Radic Biol Med. 2020;160:807–819. doi:10.1016/j.freeradbiomed.2020.09.005
40. Ahn JC, Teng PC, Chen PJ, et al. Detection of circulating tumor cells and their implications as a biomarker for diagnosis, prognostication, and therapeutic monitoring in hepatocellular carcinoma. Hepatology. 2021;73(1):422–436. doi:10.1002/hep.31165
41. Wang W, Wei C. Advances in the early diagnosis of hepatocellular carcinoma. Genes Dis. 2020;7(3):308–319. doi:10.1016/j.gendis.2020.01.014
42. Poon RT, Ng IO, Lau C, et al. Serum vascular endothelial growth factor predicts venous invasion in hepatocellular carcinoma: a prospective study. Ann Surg. 2001;233(2):227–235. doi:10.1097/00000658-200102000-00012
43. Xie S, Zhong J, Zhang Z, et al. Novel risk model based on angiogenesis-related lncRNAs for prognosis prediction of hepatocellular carcinoma. Cancer Cell Int. 2023;23(1):159. doi:10.1186/s12935-023-02975-x
44. Zhu J, Wu Y, Yu Y, Li Y, Shen J, Zhang R. MYBL1 induces transcriptional activation of ANGPT2 to promote tumor angiogenesis and confer sorafenib resistance in human hepatocellular carcinoma. Cell Death Dis. 2022;13(8):727. doi:10.1038/s41419-022-05180-2
45. Meng YM, Jiang X, Zhao X, et al. Hexokinase 2-driven glycolysis in pericytes activates their contractility leading to tumor blood vessel abnormalities. Nat Commun. 2021;12(1):6011. doi:10.1038/s41467-021-26259-y
46. Xue X, Zhao X, Wang J, et al. Carthami flos extract against carbon tetrachloride-induced liver fibrosis via alleviating angiogenesis in mice. Phytomedicine. 2023;108:154517. doi:10.1016/j.phymed.2022.154517
47. Czabotar PE, Garcia-Saez AJ. Mechanisms of BCL-2 family proteins in mitochondrial apoptosis. Nat Rev Mol Cell Biol. 2023;24(10):732–748. doi:10.1038/s41580-023-00629-4
48. Walensky LD. Targeting BAX to drug death directly. Nat Chem Biol. 2019;15(7):657–665. doi:10.1038/s41589-019-0306-6
49. Jiang X, Wang J, Deng X, et al. The role of microenvironment in tumor angiogenesis. J Exp Clin Cancer Res. 2020;39(1):204. doi:10.1186/s13046-020-01709-5
50. Winkler J, Abisoye-Ogunniyan A, Metcalf KJ, Werb Z. Concepts of extracellular matrix remodelling in tumour progression and metastasis. Nat Commun. 2020;11(1):5120. doi:10.1038/s41467-020-18794-x
51. Liu C, Zhang C, Wang W, et al. Integrated metabolomics and network toxicology to reveal molecular mechanism of celastrol induced cardiotoxicity. Toxicol Appl Pharmacol. 2019;383:114785. doi:10.1016/j.taap.2019.114785
52. Jin C, Wu Z, Wang L, Kanai Y, He X. CYP450s-activity relations of celastrol to interact with triptolide reveal the reasons of hepatotoxicity of tripterygium wilfordii. Molecules. 2019;24(11):2162. doi:10.3390/molecules24112162
53. Xiao Y, Li X, Mao J, et al. Reverse anti-breast cancer drug resistance effects by a novel two-step assembled nano-celastrol medicine. Nanoscale. 2022;14(21):7856–7863. doi:10.1039/d2nr02064e
54. Huang Y, Wu S, Li J, et al. Self-amplified pH/ROS dual-responsive co-delivery nano-system with chemo-photodynamic combination therapy in hepatic carcinoma treatment. Int J Nanomed. 2024;19:3737–3751. doi:10.2147/IJN.S453199
55. Liao S, Cai M, Zhu R, et al. Antitumor effect of photodynamic therapy/sonodynamic therapy/sono-photodynamic therapy of chlorin e6 and other applications. Mol Pharm. 2023;20(2):875–885. doi:10.1021/acs.molpharmaceut.2c00824
 © 2024 The Author(s). This work is published and licensed by Dove Medical Press Limited. The
full terms of this license are available at https://www.dovepress.com/terms.php
and incorporate the Creative Commons Attribution
- Non Commercial (unported, 3.0) License.
By accessing the work you hereby accept the Terms. Non-commercial uses of the work are permitted
without any further permission from Dove Medical Press Limited, provided the work is properly
attributed. For permission for commercial use of this work, please see paragraphs 4.2 and 5 of our Terms.
© 2024 The Author(s). This work is published and licensed by Dove Medical Press Limited. The
full terms of this license are available at https://www.dovepress.com/terms.php
and incorporate the Creative Commons Attribution
- Non Commercial (unported, 3.0) License.
By accessing the work you hereby accept the Terms. Non-commercial uses of the work are permitted
without any further permission from Dove Medical Press Limited, provided the work is properly
attributed. For permission for commercial use of this work, please see paragraphs 4.2 and 5 of our Terms.