")
Back to Journals » International Journal of Nanomedicine » Volume 20
Human Mesenchymal Stem Cell-Derived Exosomes as Engineering Vehicles of Daunorubicin for Targeted c-Mpl+ AML Therapy
Authors Li C , Wen Y, Wang J, Li L, He Y, Cheng Y, Chen J, Huang J, Ouyang C, Liu Y, Zhou R , Chen H, Li F, Guo Q, Chen Y, Chen C, Zhang Q
Received 27 December 2024
Accepted for publication 16 April 2025
Published 24 April 2025 Volume 2025:20 Pages 5267—5289
DOI https://doi.org/10.2147/IJN.S511713
Checked for plagiarism Yes
Review by Single anonymous peer review
Peer reviewer comments 2
Editor who approved publication: Professor Lijie Grace Zhang
Chunmou Li,1,* Yuchen Wen,1,* Jiasheng Wang,2 Lindi Li,1 Yue He,2 Yucai Cheng,1 Junru Chen,2 Junbin Huang,1 Cheng Ouyang,1 Yong Liu,1 Ruizhi Zhou,1 Haisheng Chen,2 Fei Li,2 Qiqi Guo,2 Yun Chen,3 Chun Chen,1 Qing Zhang2
1Pediatric Hematology Laboratory, Division of Hematology/Oncology, Department of Pediatrics, The Seventh Affiliated Hospital of Sun Yat-Sen University, Shenzhen, Guangdong, 518107, People’s Republic of China; 2State Key Laboratory of Biocontrol, School of Life Sciences, Sun Yat-sen University, Guangzhou, Guangdong, 510275, People’s Republic of China; 3Department of Pediatrics, Edmond H. Fischer Translational Medical Research Laboratory, Scientific Research Center, The Seventh Affiliated Hospital, Sun Yat-Sen University, Shenzhen, Guangdong, 518107, People’s Republic of China
*These authors contributed equally to this work
Correspondence: Chun Chen, Pediatric Hematology Laboratory, Division of Hematology/Oncology, Department of Pediatrics, The Seventh Affiliated Hospital of Sun Yat-Sen University, Shenzhen, Guangdong, 518107, People’s Republic of China, Email [email protected] Qing Zhang, State Key Laboratory of Biocontrol, School of Life Sciences, Sun Yat-Sen University, Guangzhou, Guangdong, 510275, People’s Republic of China, Email [email protected]
Background: Acute myeloid leukemia (AML) is a highly heterogeneous disease with poor therapeutic outcomes and overall prognosis, particularly in c-Mpl+ AML. c-Mpl, a proto-oncogene, is expressed at significantly higher levels in AML compared to normal human tissue cells. This study aimed to develop a type of targeted exosomes (Exos) capable of delivering anticancer drugs directly to c-Mpl+ AML cells.
Methods: Human umbilical cord mesenchymal stem cells (hUCMSCs) were isolated as the source of Exos. Fusion CD63 proteins with varying numbers of thrombopoietin (TPO)-mimic peptides, designed to target c-Mpl, were bioengineered to be expressed on the membranes of hUCMSCs and their derived Exos. The targeting capability of the fusion proteins was assessed using the DUAL membrane system, fluorescence resonance energy transfer efficiency, and endocytosis assays. After encapsulating the anticancer drug daunorubicin (DNR), these targeted Exos were evaluated for their ability to eliminate c-Mpl+ AML cells. Safety and efficacy were further tested in a mouse AML model.
Results: Our findings showed that the engineered hUCMSCs-derived Exos demonstrated excellent targeting ability to c-Mpl and a strong propensity for endocytic uptake by c-Mpl+ AML cells. Among the engineered Exos, those with the fusion protein containing three TPO-mimic peptides (CD63-mTPO3), named as m3Exos, exhibited the highest binding affinity for c-Mpl. When loaded with DNR, these engineered Exos (m3Exos@DNR) effectively eliminated c-Mpl+ AML cells in both in vitro and in vivo experiments. Furthermore, safety assessments revealed that therapy-related toxicities were within acceptable limits and associated with manageable side effects.
Conclusion: In summary, our results suggest engineered Exos as a highly effective targeted drug delivery vehicle for eliminating c-Mpl+ AML cells while maintaining a favorable safety profile. These findings also provide valuable insights for developing therapeutic strategies for AML and other tumors characterized by specific membrane protein expression.
Keywords: c-Mpl, AML, exosome, engineering, targeted therapy
Introduction
Acute myeloid leukemia (AML) is an aggressive and highly heterogeneous hematopoietic malignancy resulting from the malignant transformation of hematopoietic stem or progenitor cells.1 Despite significant advancements in chemotherapy, targeted therapies, and hematopoietic stem cell transplantation (HSCT), the overall therapeutic efficacy and long-term prognosis for AML patients remain poor. Reports indicate that the cure rate for AML patients aged 60 years or younger ranges from 35% to 40%, while only 5% to 15% of older patients achieve a cure.1 Similarly, the 5-year survival rate for pediatric AML patients globally has been reported to be only around 42.9%.2 Furthermore, across all age groups, overexpression of c-Mpl is frequently associated with persistent chemotherapy resistance, shorter complete remission periods, higher recurrence rates,3 and a worse overall prognosis.4
c-Mpl, encoded by the proto-oncogene c-mpl, is well-known as the specific receptor for thrombopoietin (TPO). Under physiological conditions, c-Mpl is primarily expressed in platelets, megakaryocytes (MKs), and CD34+ hematopoietic progenitor cells5 and participates in the regulation of MK progenitor cell proliferation, MK differentiation, maturation, and platelet release.6–8 Under pathological conditions, c-Mpl is expressed in all AML subtypes, with an overall positivity rate of about 50% to 65%.9–11 Compared to treated patients or healthy individuals, the expression level of c-Mpl is higher in bone marrow mononuclear cells from newly diagnosed or relapsed AML patients.12 Previous studies indicated that c-Mpl could promote the initiation and maintenance of RUNX1-ETO AML via PI3K/AKT/mTOR signaling pathway.13 In AML mouse models, c-Mpl+ AML demonstrated stronger homing and engraftment capabilities than c-Mpl- AML and exhibited significant chemoresistance to Ara-C, resulting in shorter survival times, and these effects could be attenuated by c-Mpl inhibitor AMM2.14 In addition, c-Mpl was found to enhance the self-renewal and quiescence of leukemia stem cells (LSCs), thereby driving the initiation, progression, and relapse of AML.14 The overactivation of the TPO/c-Mpl signaling pathway also conferred protection to LSCs against the cytotoxic effects of the anthracycline daunorubicin (DNR).12 Taken together, these findings suggest that targeting c-Mpl could represent a promising therapeutic strategy for treating c-Mpl+ AML.
Exosomes (Exos) are cell-secreted vesicles with a lipid bilayer and a size range of 30 to 150 nm that facilitate intercellular communication by transporting cargo such as DNA, RNA, lipids, and proteins.15 In recent years, Exos have garnered attention as potential drug delivery vehicles. By modifying conserved transmembrane proteins (for example, CD81, CD63, CD9, and Lamp2B), Exos can achieve specific tissue targeting, including tumor cells.16–18 Among human normal cells, mesenchymal stem cells (MSCs) are notable for their ability to produce large quantities of Exos, making them an ideal source for such applications.19–21
In this study, we isolated MSCs from human umbilical cords (hUCMSCs) to serve as the source for Exos production. Using bioengineering techniques, we expressed a c-Mpl-targeting CD63 fusion protein containing the TPO-mimic peptide22 AF12505 on the membranes of engineered Exos (mExos). DNR, a widely recognized chemotherapeutic agent for AML23 was selected as the encapsulated drug cargo based on evidence indicating a positive correlation between DNR dosage and clinical efficacy.24–28 By employing CD63 fusion proteins to target c-Mpl, mExos loaded with DNR (mExos@DNR) were designed to deliver the drug directly to c-Mpl+ AML cells, enhancing its cytotoxic effects. This approach is anticipated to improve therapeutic outcomes and prognosis for c-Mpl+ AML patients and advance the development of targeted therapies for AML and other malignancies.
Materials and Methods
Cell Lines and Culture
The human megakaryocyte leukemia cell line UT-7 and the human embryonic kidney cell line HEK293T were obtained from ATCC. The acute monocytic leukemia cell line THP-1 and the acute erythroleukemia cell line HEL were obtained from Servicebio (Wuhan, China). All cell lines used in this study were commercially available and were validated accordingly. AML cell lines were cultured in RPMI 1640 medium (HyClone, USA) supplemented with 10% fetal bovine serum (FBS; NEWZERUM, New Zealand) and 1% penicillin-streptomycin (P/S) solution (Huayun, China). For THP-1 cells, the medium was additionally supplemented with 0.05 mm 2-mercaptoethanol. HEK293T cells were cultured in DMEM (HyClone) supplemented with 10% FBS and 1% P/S solution. All cells were maintained under standard incubator conditions of 37°C, saturated humidity, and 5% CO2.
Extraction, Culture and Identification of hUCMSCs
Samples of umbilical cords were obtained with informed donor consent following healthy births. All processes were approved and supervised by the Ethics Committee of the Seventh Affiliated Hospital of Sun Yat-Sen University and followed the Declaration of Helsinki. The umbilical cords were washed with PBS to remove blood, after which the outer membranes and vessels were isolated and removed. The mesenchymal tissue in Wharton’s jelly was diced into pieces (~1 mm3) and cultured in phenol red-free MEM-α (Servicebio) containing 10% FBS and 1% P/S solution. The culture medium was replaced with a fresh medium every four days, and visible MSC colonies were observed about two weeks of incubation. Tissue blocks were removed when cell confluence reached approximately 60%-70%, and when confluence reached 90%, the cells were digested with trypsin and passed through a 100 µm nylon mesh to remove remaining tissue clumps before the first passage. For this study, hUCMSCs at passages 3–6 were used.
The identification of hUCMSCs was performed by evaluating their adipogenic and osteogenic differentiation potential29 and by analyzing the expression of surface antigens CD90, CD73, CD105, CD34, CD45, CD14, CD19, and HLA-DR (TBDscience, Tianjin, China) using flow cytometry.
Construction of Fusion Protein Expression Plasmid
The full-length sequence of the human CD63 gene was retrieved from the NCBI database (http://www.ncbi.nlm.nih.gov). The amino acid sequence of the TPO mimetic peptide AF12505 (IEGPTLRQWLAARA) was obtained from a previous study.22 To achieve optimal binding capacity to c-Mpl, the extracellular large loop of CD6317 was selected as the insertion site for the TPO mimetic peptide. All components were connected using a GGGGS linker to create the fusion protein CD63-mTPO1. The structure of the fusion protein was predicted using the SWISS-MODEL server (http://swissmodel.expasy.org). To further evaluate the binding affinity of the fusion proteins for c-Mpl, additional constructs were created, including a reverse-sequence mimetic peptide (CD63-mTPOr) and constructs containing two to four replicates of the mimetic peptide (CD63-mTPO2, CD63-mTPO3 and CD63-mTPO4). Codon optimization was performed using the codon optimization tool on the IDT website (https://www.idtdna.com). Primers were designed using the NCBI Primer Designing Tool and SnapGene software (version 5.3.1) and synthesized by Tsingke (Tsingke, China). The insert fragments were obtained by PCR amplification, separated by agarose gel electrophoresis and recovered by agarose gel extraction (Omega Bio-tek, China). The plasmid backbones were obtained via enzymatic digestion, and all components were assembled using a homologous recombination kit (Vazyme, China) or T4 DNA ligase (Thermo Fisher, USA). The recombinant plasmids were transformed into E. coli DH5α, and the plasmid identities were confirmed by colony PCR followed by Sanger sequencing (Tsingke, China) of the appropriate regions. Endotoxin-free plasmids were extracted using an endotoxin-free plasmid extraction kit (OMEGA, China).
Determination of Fusion Protein Affinity for c-Mpl
In this study, we utilized the DUAL membrane system and fluorescence resonance energy transfer (FRET) to determine the affinity of the fusion proteins for c-Mpl.
The DUAL membrane system30 was employed to assess the interaction between an integral membrane protein and its binding partners based on the split-ubiquitin mechanism. The bait plasmid pBT3-SUC, containing a LEU selectable marker, served as a vector for c-Mpl, while the prey plasmid pPR3-C, containing a TRP selectable marker, was used as a vector for fusion proteins (CD63-mTPOr and CD63-mTPO1), and CD63 fusion protein alone was used as a negative control. The yeast strain NYM51 (HonorGene, China) had TRP1 and LEU2-3 auxotrophy markers for plasmid transformation screening, while had HIS3 and ADE2 auxotrophy markers and lacZ as reporter genes. NYM51 cells were co-transfected with both bait and prey plasmids using the lithium acetate method. The interaction between bait and prey proteins activated the expression of the reporter genes HIS3, ADE2 and lacZ, which facilitated the growth of NYM51 on a nutritionally selective medium and produced blue spots when supplemented with IPTG (Biosharp, China) and X-gal (Biosharp, China).
FRET, a non-invasive imaging technique, was employed to measure the interaction between fluorescently labeled molecules, such as the interaction between c-Mpl and fusion proteins. In this approach, the receptor yellow fluorescent protein (YFP) was fused to the C-terminus of c-Mpl, while the donor cyan fluorescent protein (CFP) was attached to the C-terminus of the fusion proteins (CD63-mTPOr and CD63-mTPO1). CD63 fusion protein alone was used as a negative control. Various combinations of plasmids were co-transfected into HEK293T cells, and FRET signals were observed using a Zeiss 880 confocal microscope (Zeiss, Germany). For each field, three images were captured: CFP excitation and CFP emission, YFP excitation and YFP emission, and CFP excitation and YFP emission. To further evaluate the affinity of different replicates of the mimetic peptide for c-Mpl, additional constructs were created, including CD63-mTPO2, CD63-mTPO3, and CD63-mTPO4, each fused to a CFP at the C-terminus. Before YFP bleaching, CFP (CFPbefore) image was captured to establish baseline values. Immediately after YFP bleaching (using a 514 nm laser line), post-bleaching CFP (CFPafter) image was captured under the same detector settings as the pre-bleach images. FRET efficiency was calculated according to the equation: FRET efficiency = (CFPafter - CFPbefore) /CFPafter.31 The inter-fluorophore radius (r) was converted from the FRET efficiency using the equation:32

Where Ro, the Foerster radius for CFP and YFP, is 4.95 nm, and “E” represents the FRET efficiency.
Stable Cell Line Construction
Lentivirus was produced in HEK293T cells by transfecting lentiviral plasmids along with packaging plasmids using LipoFiter 3.0 (Hanbio, China). Fusion protein overexpression plasmids were constructed using the pCDH-CMV-MCS-EF1-copGFP vector (abbreviated as pCDH). For c-Mpl knockdown and overexpression, c-Mpl-specific shRNAs and the c-Mpl cDNA sequence were cloned into the pLKO.1-CMV-copGFP-PURO vector (abbreviated as pLKO.1) and pCDH, respectively. After 48 hours of lentivirus infection, stably transfected cells were selected using puromycin or sorted by fluorescence-activated cell sorting (FACS).
Based on previous studies, among the three AML cell lines tested, HEL exhibited the highest c-Mpl expression, followed by THP-1, while c-Mpl was not expressed in UT-7. In this study, we established stable cell lines with c-Mpl overexpression (THP-1-Mpl and UT-7-Mpl) and stable cell lines with c-Mpl knockdown (HEL-shMpl and THP-1-shMpl). The empty vector plasmid and scramble plasmid were used as a control. The shRNA target sequences for c-Mpl were listed in Supplementary Table 1. To ensure specificity, all shRNA sequences were analyzed with BLAST. For hUCMSCs, we generated five stable cell lines expressing different fusion proteins: hUCMSCs-CD63-HA (abbreviated as MSCs-CD63), hUCMSCs-CD63-mTPO1-HA (abbreviated as MSCs-mTPO1), hUCMSCs-CD63-mTPO2-HA (abbreviated as MSCs-mTPO2), hUCMSCs-CD63-mTPO3-HA (abbreviated as MSCs-mTPO3), and hUCMSCs-CD63-mTPO4-HA (abbreviated as MSCs-mTPO4).
Exos Isolation and Identification
When the MSCs reached 70% confluence during the logarithmic growth phase, the medium containing FBS was replaced with a medium containing 10% Exo-depleted FBS, which was prepared via ultracentrifugation. After 48 hours, the supernatant was collected, and Exos were isolated using a multistep centrifugation protocol. Supernatants were first centrifuged at 500 × g for 10 minutes, 2000 × g for 20 minutes, and 12,000 × g for 30 minutes. The cleared supernatants were filtered through a 0.22 µm Millipore membrane filter, followed by ultracentrifugation at 120,000 × g for 90 minutes. The pellet was washed with PBS and centrifuged again at 120,000 × g for 90 minutes. The isolated Exos were then resuspended in PBS and stored at −80°C.
For protein quantification, the Exos were lysed in RIPA buffer and analyzed using the BCA Protein Assay Kit (Thermo Fisher Scientific, USA). Exo markers (Alix, TSG101, CD81, and GAPDH) were detected by Western blot (WB), and an HA-tag monoclonal antibody was used to confirm the presence of fusion proteins. The morphology of the Exos was examined using a JEOL JEM-1400 transmission electron microscope (TEM) at 120 kV, while their Exo size distribution was analyzed using a Nanosight NS300 particle size analyzer (Malvern Panalytical, UK).
Evaluation of the Targeting Ability of Engineered Exos in vitro
As described above, Exos derived from normal hUCMSCs (nMSCs), MSCs-CD63, MSCs-mTPO1, MSCs-mTPO2, MSCs-mTPO3, and MSCs-mTPO4 were extracted and named as nExos, cExos, m1Exos, m2Exos, m3Exos and m4Exos, respectively. A stable HEK293T cell line (HEK293T-Mpl) expressing c-Mpl was constructed via lentiviral infection. HEK293T and HEK293T-Mpl cells were seeded in 24-well plates and cultured for 24 hours. Subsequently, six types of Exos (20 µg/mL, pre-stained with DiD) were added to the wells and incubated with the cells for 3 hours. After counterstaining with DAPI for 15 minutes, Exo uptake was visualized using a confocal microscope.
Based on the combined results of FRET efficiency and Exo uptake assays in HEK293T and HEK293T-Mpl cells, the engineered Exos (m3Exos) with the highest binding affinity to c-Mpl were identified. To further evaluate the targeting ability of m3Exos in AML cells, the uptake of m3Exos was compared with nExos (used as a control) using both confocal microscopy and flow cytometric analysis (CytoFLEX LX, Beckman Coulter). For simplicity, two types of Exos (20 µg/mL, pre-stained with DiD) were incubated with HEL-shCtrl, HEL-shMpl, THP-1-shCtrl, THP-1-Mpl, THP-1-shMpl, UT-7-Vector, and UT-7-Mpl cells for 5 hours. After incubation, AML cells were collected, washed with PBS, and directly analyzed for DiD fluorescence intensity using flow cytometry. The results were processed using FlowJo software. Exo uptake was also observed under a confocal microscope after Hoechst staining.
Preparation and Identification of DNR‐loaded Exos
The optimum absorption wavelength of DNR was determined through full-wavelength scanning using UV-Vis spectroscopy (GENESYS 150, Thermo Fisher Scientific), and an absorbance curve was generated using a series of standard DNR solutions. To prepare DNR-loaded Exos (Exos@DNR), 1 mg of Exos was mixed with 1 mg of DNR solution in a final volume of 1 mL. The mixture was sonicated (30% amplitude, 3s on/3s off cycle, 12 cycles) on ice, followed by incubation at 37°C for 1 hour to restore the complete Exo membrane structure. The Exos@DNR were then collected by centrifugation at 12,000 × g for 90 minutes, resuspended in PBS, and stored at −80°C. Exos@DNR were characterized using BCA protein assay, WB, TEM, and nanoparticle tracking analysis (NTA) as described previously. To quantify DNR loading, Exos@DNR were incubated with 0.1% Triton X-100 in PBS for 10 minutes on ice to ensure complete release of DNR. The absorbance of the solution was then measured, and DNR concentrations were calculated using the previously established absorbance curve. The drug loading capacity was calculated using the formula:
Drug loading capacity (%) = (The loaded drug mass)/(The loaded drug mass + The total mass of Exos) × 100%
Meanwhile, the encapsulation efficiency was calculated using the formula:
Encapsulation efficiency (%) = (The loaded drug mass)/(The total drug mass) × 100%.
Cell Proliferation and Cytotoxicity Assay
Cell proliferation was assessed using the CCK-8 assay (Dojindo, Japan). AML cell lines were treated with various concentrations of nExos and m3Exos (0, 5, 10, 20, 40, 80, and 100 µg/mL) for 24 hours. After adding the CCK-8 reagent, cells were incubated for 3 hours, and the absorbance at 450 nm was measured using an Infinite M200 Pro instrument (Tecan, Switzerland). The percentage of cell proliferation was calculated using the equation:

For cytotoxicity assay, AML cell lines were treated with different concentrations of DNR, nExos@DNR and mExos@DNR for 24 hours. The concentration gradient of DNR (ug/mL) was 0, 0.1, 0.2, 0.4, 0.8, 1.6. 3.2, 6.4 and 12.8 for HEL, HEL-shMpl, UT-7 and UT-7-Mpl. The concentration gradient of DNR (ug/mL) was 0, 0.05, 0.1, 0.2, 0.4, 0.8, 1.6. 3.2 and 6.4 for THP-1, THP-1-shMpl and THP-1-Mpl. The quantities of nExos@DNR and m3Exos@DNR were adjusted based on their respective drug-loading capacities. After adding the CCK-8 reagent and incubating for 3 hours, absorbance at 450 nm was measured, and the cell inhibition rate was calculated as follows:
Inhibition rate (%) = (ODcontrol - ODexperiment)/(ODcontrol – ODblank) ×100%.
Lastly, the IC50 values were calculated using GraphPad Prism software.
Apoptosis Assay
AML cell lines were treated with DNR and m3Exos@DNR for 24h. The concentration of the DNR solution was 0.7 µg/mL (the IC50 of DNR for HEL-shMpl) in groups of HEL and HEL-shMpl. The concentration of the DNR solution was 0.35 µg/mL (the IC50 of DNR for THP-1-shMpl) in groups of THP-1, THP-1-shMpl, and THP-1-Mpl. The concentration of the DNR solution was 1 µg/mL (the IC50 of DNR for UT-7) in groups of UT-7 and UT-7-Mpl. The amount of m3Exos@DNR was determined as described above. After collecting and washing, the cells were stained with Annexin V-APC and 7-AAD using the Annexin V-APC/7-AAD Apoptosis Detection Kit (BD Biosciences) according to the manufacturer’s instructions. Flow cytometry data were acquired using a flow cytometer and analyzed by CytExpert software. Apoptosis rates were calculated by GraphPad Prism software.
Western Blotting
Whole-cell lysates were prepared in RIPA lysis buffer (moderate strength, Beyotime, China). After centrifugation at 12,000 × g for 20 min, the protein supernatant was collected, and protein concentration was measured using the BCA protein assay. Protein samples were boiled in 5× loading buffer (FDbio, China) for 10 min. For multi-pass membrane proteins, such as CD81 and CD63 fusion proteins, protein samples were mixed with 5× loading buffer without heat treatment. For Exos, samples were mixed with 5× loading buffer without RIPA treatment. Protein samples (10 µg) were separated by SDS-PAGE (10%) and transferred onto 0.45 μm PVDF membranes (Millipore). After blocking in 5% skim milk in TBST at room temperature for 1 hour, the membranes were incubated with primary antibodies at 4°C overnight. After washing 3 times with TBST, the membranes were incubated with secondary antibodies at room temperature for 1 h. The blots were washed thoroughly to remove the secondary antibody before incubation with chemiluminescence detection fluid (FDbio, China) and imaged using the Tanon 5200 system (Tanon, China).
The antibodies used in WB were diluted with 5% skim milk in TBST, and dilution ratios are as follows: Alix (Abcam, 1:1000), TSG101 (Abcam, 1:1000), CD81 (Servicebio, 1:1000), c-Mpl (Abcam, 1:1000), anti-HA (Proteintec, 1:1000), GAPDH (Proteintec, 1:10,000), anti-rabbit immunoglobulin G (Proteintec, 1:5000), anti-mouse immunoglobulin G (Proteintec, 1:5000).
Polymerase Chain Reaction (PCR) and Real-Time Quantitative PCR (qPCR)
PCR amplifications were conducted using KOD Plus High Fidelity DNA Polymerase (TOYOBO), with DMSO added as necessary for challenging reactions. PCR products were verified by agarose gel electrophoresis. qPCR was performed using SYBR Green qPCR Mix (Dongsheng Biotech, China) on a StepOne Plus (ABI). GAPDH was used for normalization, and relative expression levels were calculated using the 2−ΔΔCT method. Primer information is available in Supplementary Table 2.
Animal Models
Seven-week-old Swiss mice (commonly referred to as Kunming mice) were obtained from the Animal Center of Sun Yat-sen University. Seven-week-old NOD/SCID mice were purchased from GemPharmatech (Guangdong, China). All mice were housed at the Laboratory Animal Center of the College of Life Science, Sun Yat-sen University. The animal studies were approved by the Institutional Animal Care and Use Committee of the College of Life Science, Sun Yat-sen University (Approval number: SYSU-LS-IACUC-2024-0092). Guidelines for the ethical review of laboratory animal welfare (China, GB/T 35892–2018) and ARRIVE guidelines were also followed.33
Twenty Kunming (KM) mice were randomly divided into four experimental groups to evaluate drug safety. Mice were treated via intraperitoneal (i.p.) injection for three consecutive days as follows: Group K1 (control) received normal saline, Group K2 received m3Exos (25 mg/kg/day), Group K3 received DNR (5 mg/kg/day), and Group K4 received m3Exos@DNR (25 mg/kg/day, containing approximately 5 mg/kg/day of DNR). Body weight was measured every two days. Routine blood tests were conducted on days 7 and 21 after treatment. Cardiac and liver function were assessed on day 21 using a CX4Pro automatic biochemical analyzer (Beckman). At the endpoint of the experiment (21 days after treatment), mice were euthanized by CO2 inhalation. Heart, liver, spleen, and kidney tissues were collected and stained with hematoxylin and eosin (HE) to observe potential tissue lesions.
Stable cell line construction of HEL-GFP-FLuc was performed using the pCDH-CMV-FLuc-EF1a-copGFP-T2A-Puro vector as previously described. Briefly, 20 NOD/SCID mice were randomly divided into 4 groups (N1, N2, N3, and N4) to evaluate drug efficacy. CTX was administered via a 100 mg/kg i.p. injection, and 24 hours later, the animals were transplanted with 3×10⁶ HEL-GFP-FLuc cells via tail vein injection. After an additional 24 hours, treatments were administered to groups N1, N2, N3 and N4 in the same manner as for groups K1, K2, K3 and K4, respectively. Body weight was measured every two days, and bioluminescent imaging was performed on days 7, 14, and 21 using a vivo imaging system (Tanon ABL X6, China) to quantify tumor burden after administration of 10 μL/g D-Luciferin potassium salt (15 mg/mL) via i.p. injection. At the endpoint (21 days post-treatment), the mice were euthanized by CO2 inhalation. GFP signals in the heart, liver, kidney, spleen, and lungs were detected using the vivo imaging system. Spleen and liver tissues were collected and stained with HE, GFP, and anti-Ki67. Additionally, the cells harvested from spleens and bone marrow were analyzed via flow cytometry to determine the proportion of GFP-positive cells.
Statistical Analysis
All in vitro experiments were independently repeated three times, with at least three parallel samples per test. The data are presented as the mean ± SD. For normally distributed data, comparisons between two groups were performed using a two-tailed Student’s t-test, while one-way ANOVA was used for comparisons among multiple groups. For data not conforming to a normal distribution, the Mann–Whitney U-test was applied. A p-value < 0.05 was considered statistically significant.
Results
Detection of c-Mpl on AML Cells
Comparison of c-Mpl expression between cancerous and corresponding normal tissues using the GEPIA34 database (http://gepia.cancer-pku.cn/index.html) revealed that c-Mpl exhibited the highest expression in AML (Figure 1A). In childhood leukemia, c-Mpl expression (Figure 1B) was higher in AML (n=346) compared to ALL (n=1041), based on data from the St. Jude Children’s Research Hospital Pediatric Cancer (PeCan) database (https://pecan.stjude.cloud). Based on data from the Human Protein Atlas (https://www.proteinatlas.org/), we could also find that c-Mpl expression (Figure 1C) was higher in AML cell lines (n=39) compared to ALL cell lines (n=34). In this study, using data from the Human Protein Atlas (Figure 1D) and findings from a previous study,35 we selected the high-expressing HEL cell line, the low-expressing THP-1 cell line, and the non-expressing UT-7 cell line for subsequent experiments.
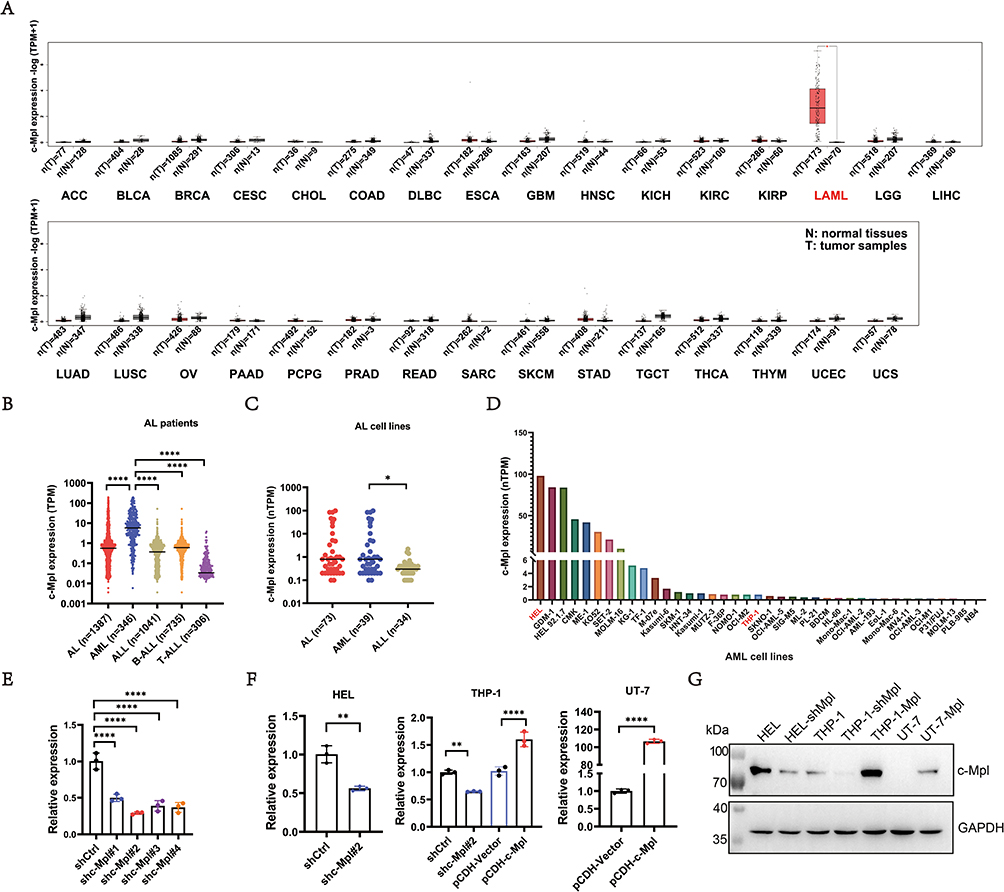 |
Figure 1 Expression of c-Mpl in AML patients and cells. (A) The c-Mpl expression level was highest in AML patients compared to that in other kind of cancers and corresponding normal tissues using the GEPIA database. (B) c-Mpl expression was higher in AML (n=346) compared to ALL (n=1041) in childhood leukemia based on data from the PeCan database. (C and D) Based on data from the Human Protein Atlas, the c-Mpl expression level was higher in AML cell lines compared to ALL cell lines and high-expressing HEL cell line and the low-expressing THP-1 cell line were selected for our study. (E) For c-Mpl knockdown, qPCR examination showed that shc-Mpl#2 achieved the greatest knockdown efficiency among four groups. (F) After overexpression or knockdown of c-Mpl, we constructed four stable cell lines, THP-1-shMpl, THP-1-Mpl, UT-7-Mpl, and HEL-shMpl. Meanwhile, the HEL-shCtrl, THP-1-shCtrl and UT-7-Vector were used as a control. qPCR examination showed the expression levels of c-Mpl in these cell lines. (G) c-Mpl expression was examined by WB. GAPDH served as an internal reference protein. *P < 0.05; **P < 0.01; ****P < 0.0001. Abbreviations: ACC, adrenocortical carcinoma; BLCA, bladder urothelial carcinoma; BRCA, breast invasive carcinoma; CESC, cervical squamous cell carcinoma and endocervical adenocarcinoma; CHOL, cholangio carcinoma; COAD, colon adenocarcinoma; DLBC, lymphoid neoplasm diffuse large B-cell lymphoma; ESCA, esophageal carcinoma; GBM, glioblastoma multiforme; HNSC, head and neck squamous cell carcinoma; KICH, kidney chromophobe; KIRC, kidney renal clear cell carcinoma; KIRP, kidney renal papillary cell carcinoma; LAML, acute myeloid leukemia; LGG, brain lower grade glioma; LIHC, liver hepatocellular carcinoma; LUAD, lung adenocarcinoma; LUSC, lung squamous cell carcinoma; OV, ovarian serous cystadenocarcinoma; PAAD, pancreatic adenocarcinoma; PCPG, pheochromocytoma and paraganglioma; PRAD, prostate adenocarcinoma; READ, rectum adenocarcinoma; SARC, sarcoma; SKCM, skin cutaneous melanoma; STAD, stomach adenocarcinoma; TGCT, testicular germ cell tumors; THCA, thyroid carcinoma; THYM, thymoma; UCEC, uterine corpus endometrial carcinoma; UCS, uterine carcinosarcoma. |
For c-Mpl knockdown, four sets of shRNA sequences were designed, synthesized, and ligated into the pLKO.1 plasmid vector to construct recombinant plasmids, termed shc-Mpl#1, shc-Mpl#2, shc-Mpl#3, and shc-Mpl#4. These plasmids were transiently transfected into HEL cells, and knockdown efficiency was determined by qPCR (Figure 1E and Supplementary Figure 1A). Among the groups, shc-Mpl#2 achieved the greatest knockdown efficiency, reducing c-Mpl expression to 29.05% ± 1.722% compared to controls. Thus, shc-Mpl#2 was selected for c-Mpl knockdown experiments, while the pCDH-c-Mpl plasmid was used for c-Mpl overexpression. As described above, stable cell lines (THP-1-shMpl, THP-1-Mpl, UT-7-Mpl, and HEL-shMpl) were generated using lentiviral transduction. Meanwhile, the HEL-shCtrl, THP-1-shCtrl (transferred with scramble‐plasmid) and UT-7-Vector (transferred with empty vector plasmid) were used as a control. The expression levels of c-Mpl in these cell lines were analyzed by qPCR (Figure 1F) and WB (Figure 1G). GFP expression in these stable cell lines was visualized via fluorescence microscopy (Supplementary Figure 2).
The Excellent Targeting Ability of the Fusion Protein to c-Mpl
The fusion protein targeting c-Mpl was designed (Figure 2A) and structurally predicted using the SWISS-MODEL tool (Figure 2B). The results indicated that the insertion of the TPO-mimic peptide did not disrupt the normal structure of the CD63 protein. In summary, we inserted TPO-Mimic peptide into the extracellular large loop of CD63 and used GGGGS linkers to connect all components. So that, with the expression of fusion protein, TPO-Mimic would expose to the outside of the membrane to execute specific targeting functions.
Figure 2 Continued. Figure 2 Design of the CD63 fusion proteins and determination of the affinities of fusion proteins for c-Mpl by DUAL membrane system and FRRT. (A) TPO mimetic peptide was inserted into the extracellular large loop of CD63 and all components were connected using GGGGS linkers. Images were processed with Adobe Illustrator. (B) By the Swiss-MODEL, the structure of the fusion protein was predicted which showed that the insertion did not disrupt the normal structure of the CD63 protein. (C) Schematic diagram of DUAL membrane system was drawn by Figdraw. DUAL membrane system can assess the interaction between two integral membrane proteins based on the split-ubiquitin mechanism in the yeast strain NMY51. The bait protein contains C-terminal part of ubiquitin (Cub) and transcription factor (LexA-VP16), while the prey protein contains N-terminal part of ubiquitin (NubG). If the two proteins interact, the two fragments of ubiquitin complement each other which can be recognized by ubiquitin-binding proteins (UBPs). Thus, LexA-VP16 can be separated and enter the nucleus and activate HIS3, ADE2 and LacZ, which facilitates the growth of NYM51 on a nutritionally selective medium and produces blue spots when supplemented with IPTG and X-gal. (D) We constructed pPR3-C-CD63-mTPOr (CD63 with a reverse-sequence mimetic peptide) and pPR3-C-CD63-mTPO1 (CD63 with single TPO mimetic peptide) as prey plasmids, while pPR3-C-CD63 and pPR3-C severed as control. The pBT3-SUC-c-Mpl was constructed as bait plasmid and pBT3-SUC was used as control. Finally, all groups could survive in 10 cm dishes with DDO/-Trp-Leu medium. But, only after co-transfection with pPR3-C-CD63-mTPO1 and pBT3-SUC-c-Mpl, NYM51 yeast cells could survive on QDO/-Trp-Leu-His-Ade medium and have appearance of blue spots after IPTG and X-gal supplementation. (E) Schematic diagram of fluorescence resonance energy transfer (FRET) was drawn by Figdraw. FRET is a non-invasive imaging technique. In our study, two proteins carried CFP and YFP respectively and were transfected into the same HEK293T cell by plasmids. If the two proteins interacted, the distance between CFP and YFP became smaller. Because the overlap between CFP emission and YFP absorption, upon excitation of CFP, the light emitted by CFP could be absorbed by YFP and YFP was excited and fluoresces. (F) We constructed pECFP-N1-CD63-mTPOr and pECFP-N1-CD63-mTPO1 as the fluorescence donor and pECFP-N1-CD63 severed as control. pEYFP-N1-Mpl was constructed as the fluorescence acceptor. After exciting of CFP, YFP fluorescence was observed in HEK293T cells only after co-transfection with pECFP-N1-CD63-mTPO1 and pYFP-N1-c-Mpl. Dem–Dexc, donor emission when exciting donor; Aem–Aexc, acceptor emission when exciting acceptor; Aem–Dexc, acceptor emission when exciting donor. Scale bar, 5 μm (CD63-CFP and mTPO1-CFP) and 10 μm (mTPOr-CFP). (G) We constructed pECFP-N1-CD63-mTPO2 (CD63 with two TPO mimetic peptides), pECFP-N1-CD63-mTPO3 (CD63 with three TPO mimetic peptides) and pECFP-N1-CD63-mTPO4 (CD63 with four TPO mimetic peptides) to evaluate the affinity for c-Mpl in HEK293T cells. Immediately after YFP bleaching (using a 514 nm laser line), post-bleaching CFP and YFP images were captured under the same detector settings as the pre-bleach images. Red box: bleached region. Scale bar, 5 μm. (H) FRET efficiency and the inter-fluorophore radius were calculated. According to the above results, CD63-mTPO3 exhibited the highest FRET efficiency (21.59% ± 8.465%), with a corresponding inter-fluorophore radius of 6.205 ± 0.54 nm. *P < 0.05; **P < 0.01.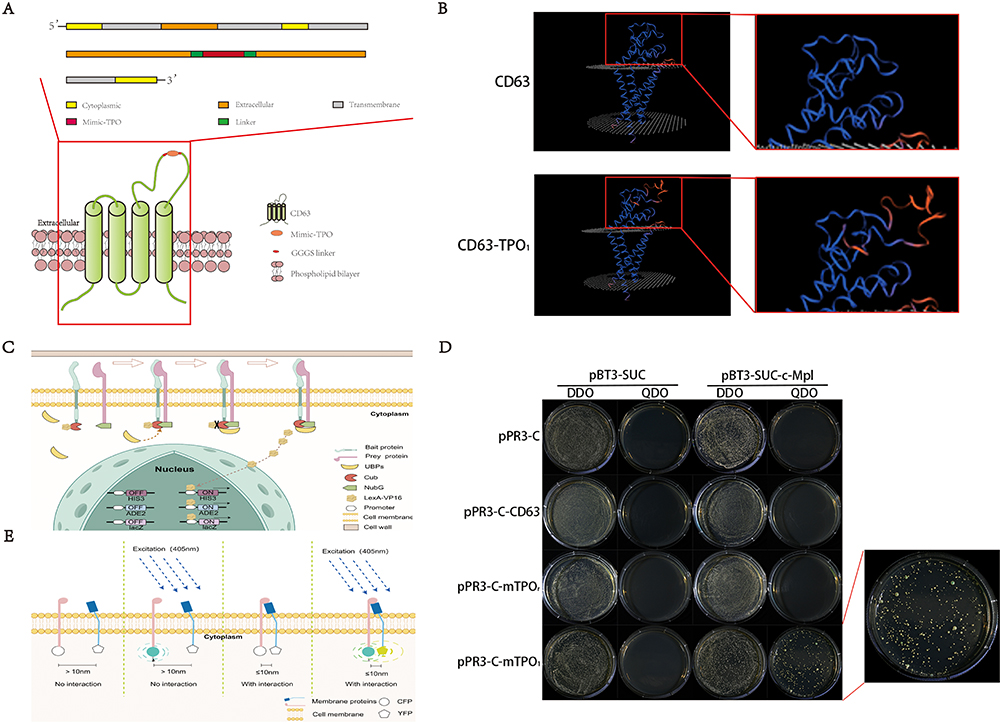

Using the DUAL membrane system (Figure 2C), we observed that all NYM51 yeast cells could survive on DDO/-Trp-Leu medium, which indicated that prey and bait plasmids were successfully transferred into cells. But, NYM51 yeast cells could survive on QDO/-Trp-Leu-His-Ade medium only when co-transfected with pPR3-C-CD63-mTPO1 and pBT3-SUC-c-Mpl, as evidenced by the appearance of blue spots after IPTG and X-gal supplementation (Figure 2D). Similarly, the FRET phenomenon (Figure 2E) was detected in HEK293T cells only after co-transfection with pECFP-N1-CD63-mTPO1 and pYFP-N1-c-Mpl (Figure 2F). These results confirmed that the fusion protein containing the correct amino acid sequence of the TPO-mimic peptide could specifically target c-Mpl.
To further evaluate the targeting ability of four different fusion proteins (CD63-mTPO1, CD63-mTPO2, CD63-mTPO3, and CD63-mTPO4), HEK293T cells were co-transfected with pYFP-N1-c-Mpl and either pECFP-N1-CD63-mTPO1, pECFP-N1-CD63-mTPO2, pECFP-N1-CD63-mTPO3, or pECFP-N1-CD63-mTPO4. After bleaching YFP, changes in CFP fluorescence intensity were measured using a fluorescence microscope (Figure 2G), and the FRET efficiency and inter-fluorophore radius were calculated and analyzed with GraphPad Prism software (Figure 2H). Moreover, among the tested fusion proteins, CD63-mTPO3 exhibited the highest FRET efficiency (21.59% ± 8.465%), with a corresponding inter-fluorophore radius of 6.205 nm ± 0.54 nm. These findings demonstrate that the fusion proteins possess targeting ability toward c-Mpl, with CD63-mTPO3 showing the strongest binding affinity.
The Fusion Protein Can Be Successfully Expressed in hUCMSCs and Their Exos
Wharton’s jelly tissue blocks attached to the culture dish walls within 1–2 days, with some cells migrating from the edges of the tissue blocks. Primary cells were passaged and cryopreserved after 10–14 days of culture when the cells reached 80% confluence. Under a light microscope (Figure 3A), hUCMSCs exhibited a fusiform (spindle-shaped) morphology and were arranged in a spiral pattern without overlapping. After ten days of adipogenic differentiation (Figure 3B), Oil Red O staining confirmed the presence of red-stained fat deposits in the cells. Similarly, after two weeks of osteogenic differentiation (Figure 3C), the hUCMSCs were examined by Alizarin red staining and deposition of orange-red calcium nodules was observed. In addition, hUCMSCs were confirmed by flow cytometry analysis (Figure 3D). The results showed that cells were positive for CD90, CD105 and CD73 expression and were negative for CD45, CD34, CD19, CD14 and HLA-DR. Overall, these results indicated that the obtained hUCMSCs were uniformly expressed and had high cell purities, which met the basic characteristics of MSCs.
 |
Figure 3 Identification of human umbilical cord mesenchymal stem cells (hUCMSCs). (A) hUCMSCs were harvested from Wharton’s jelly of umbilical cord and cultured in phenol red-free MEM-α containing 10% FBS and 1% P/S. At large cell density, hUCMSCs exhibited a fusiform (spindle-shaped) morphology and were arranged in a spiral pattern without overlapping. Scale bar, 200 μm. (B) After adipogenic differentiation, Oil Red O staining confirmed the presence of red-stained fat deposits (indicated by black arrows) in the cells. Scale bar, 50 μm. (C) After osteogenic differentiation, the hUCMSCs were examined by Alizarin red staining and deposition of Orange-red calcium nodules (indicated by black arrows) was observed. Scale bar, 500 μm. (D) By flow cytometry analysis, we found that cells were positive for CD90, CD105 and CD73 expression and negative for CD45, CD34, CD19, CD14 and HLA-DR. |
In this study, we constructed pCDH-CD63, pCDH-CD63-mTPO1, pCDH-CD63-mTPO2, pCDH-CD63-mTPO3 and pCDH-CD63-mTPO4 plasmids, and their identities were confirmed by Xba I and Not I dual digestion (Supplementary Figure 3A). Lentiviral particles were then generated by transfecting HEK293T cells. Subsequently, five stable cell lines (MSCs-CD63, MSCs-mTPO1, MSCs-mTPO2, MSCs-mTPO3 and MSCs-mTPO4) were successfully established, with hUCMSCs serving as the control. The transfection efficiency was assessed and cells were sorted by FACS depending on the GFP fluorescence channel (Supplementary Figure 3B) and fluorescent cells were observed using fluorescence microscopy (Supplementary Figure 3C). The fusion proteins were successfully overexpressed in the cells, as confirmed by qPCR (Figure 4A, Supplementary Figure 1A and B) and WB (Figure 4B). Exos (cExos, m1Exos, m2Exos, m3Exos, m4Exos, and nExos) were extracted from these cell lines, and exosomal markers CD9, TSG101, and Alix were detected in the samples by WB (Figure 4B). Fusion proteins were also identified in cExos, m1Exos, m2Exos, m3Exos, and m4Exos using an anti-HA antibody (Figure 4B). The results showed that all Exos displayed the typical saucer-like, double-concave disc morphology with a distinct membrane structure under TEM (Figure 4C). After engineering, the size distribution of Exos increased compared to nExos. The diameters of cExos, m1Exos, m2Exos, m3Exos, m4Exos, and nExos were 145.6 ± 34.5 nm, 114.5 ± 42.3 nm, 134.7 ± 40.7 nm, 145.6 ± 39.9 nm, 125.5 ± 33.9 nm, and 108.5 ± 31.6 nm, respectively.
 |
Figure 4 Identification of engineered MSCs and Exos. (A) qPCR examination showed the fusion proteins could be successfully expressed in engineered MSCs. (B) Exosomal positive markers (Alix, TSG101, CD81) and negative marker GAPDH were detected by WB. The expressed fusion proteins were detected by an antibody against the HA tag and normal MSCs served as control. MSCs-CD63, hUCMSCs-CD63-HA; MSCs-mTPO1, hUCMSCs-CD63-mTPO1-HA; MSCs-mTPO2, hUCMSCs-CD63-mTPO2-HA; MSCs-mTPO3, hUCMSCs-CD63-mTPO3-HA; MSCs-mTPO4, hUCMSCs-CD63-mTPO4-HA; nExos, Exos of normal MSCs; cExos, Exos of MSCs-CD63; m1Exos, Exos of MSCs-mTPO1; m2Exos, Exos of MSCs-mTPO2; m3Exos, Exos of MSCs-mTPO3; m4Exos, Exos of MSCs-mTPO4. (C) NTA showed that the diameters of cExos, m1Exos, m2Exos, m3Exos, m4Exos, and nExos were 145.6 ± 34.5 nm, 114.5 ± 42.3 nm, 134.7 ± 40.7 nm, 145.6 ± 39.9 nm, 125.5 ± 33.9 nm, and 108.5 ± 31.6 nm, respectively. All Exos displayed the typical saucer-like, double-concave disc morphology with a distinct membrane structure under TEM. Scale bar, 500 nm. **P < 0.01; ***P < 0.001; ****P < 0.0001. |
m3Exos Have the Highest Binding Affinity to c-Mpl+ AML
The c-Mpl overexpression cell line, HEK293T-Mpl, was successfully constructed (Supplementary Figure 4A), and c-Mpl protein expression was confirmed by WB analysis (Supplementary Figure 4B). Exos endocytosis (cExos, m1Exos, m2Exos, m3Exos, m4Exos, and nExos) was visualized using a confocal microscope (Figure 5A), and Exos uptake was quantified by measuring the mean fluorescence intensity (MFI) of DiD. The results showed that all types of Exos were endocytosed by HEK293T-Vector cells with similar MFI values (Figure 5B). However, Exos containing fusion proteins, particularly m3Exos, were more efficiently endocytosed by HEK293T-Mpl cells. Combined with FRET efficiency and inter-fluorophore radius data, m3Exos demonstrated the best targetability to c-Mpl+ AML cells and a large amount of m3Exos was prepared for the follow-up experiments.
 |
Figure 5 Evaluation of the targeting ability of engineered Exos by uptake assays. (A) Six types of Exos (20 µg/mL, pre-stained with DiD) were added to the wells and incubated with the HEK293T-Vector or HEK293T-Mpl cells for 3 hours. After counterstaining with DAPI, Exos uptake was visualized using a confocal microscope. Scale bar, 10 μm. (B) Mean fluorescence intensity (MFI) of DiD was calculated by GraphPad Prism software, which showed that m3Exos were more efficiently endocytosed by HEK293T-Mpl cells. (C) m3Exos and nExos (20 µg/mL, pre-stained with DiD) were added to the wells and incubated with the AML cells with different c-Mpl expression levels (HEL-shMpl, HEL-shCtrl, THP-1-shMpl, THP-1-shCtrl, THP-1-Mpl, UT-7-Vector and UT-7-Mpl). After counterstaining with Hoechst, Exos uptake was visualized using a confocal microscope (Scale bar, 20 μm) and (D) flow cytometric analysis, and the results were processed using FlowJo and GraphPad Prism software. The results indicated that higher c-Mpl expression levels correlated with greater m3Exos uptake. *P < 0.05; **P < 0.01; ****P < 0.0001. Abbreviation: ns, not significant. |
To assess whether c-Mpl expression levels in AML cells (HEL-shMpl, HEL-shCtrl, THP-1-shMpl, THP-1-shCtrl, THP-1-Mpl, UT-7-Vector and UT-7-Mpl) influenced the targeting ability of m3Exos (nExos were used as control), additional endocytosis experiments were performed using confocal microscopy (Figure 5C) and flow cytometric analysis (Figure 5D). The results indicated that higher c-Mpl expression levels correlated with greater m3Exos uptake. Overall, various engineered Exos were constructed, and m3Exos exhibited excellent binding affinity to c-Mpl+ AML cells.
m3Exos@DNR Can Specifically Kill c-Mpl+ AML Cells in vitro
After sonication and centrifugation, DNR-loaded m3Exos (m3Exos@DNR) and nExos (nExos@DNR) were collected (Figure 6A). Next, nExos@DNR and m3Exos@DNR were identified using WB (Figure 6B), TEM and NTA (Figure 6C). After drug loading, Exos marker proteins remained unchanged, but the size and homogeneity of Exos were significantly affected. The size ranges of nExos@DNR and m3Exos@DNR were 195 ± 63.8 nm and 214.6 ± 73.9 nm, respectively. Based on the UV-Vis curves of DNR (Figure 6D), Exos-containing DNR was calculated using absorption at 480 nm. The encapsulation efficiency was 26.06% ± 2.261% for nExos@DNR and 26.36% ± 1.445% for m3Exos@DNR, while the drug loading capacity was 20.65% ± 1.422% and 20.86% ± 0.9111%, respectively (Figure 6E).
 |
Figure 6 Identification of DNR‐loaded Exos. (A) After sonication and centrifugation, DNR-loaded Exos were collected and red substance precipitated could be observed in the bottom of the tube. (B) Exosomal positive markers (Alix, TSG101, CD81) and negative marker GAPDH of DNR-loaded m3Exos (m3Exos@DNR) and nExos (nExos@DNR) were detected by WB. The expressed fusion proteins were detected by an antibody against the HA tag. (C) The morphology and size of m3Exos@DNR and nExos@DNR were identified by TEM and NTA. The size of nExos@DNR and m3Exos@DNR were larger than before and ranges were 195 ± 63.8 nm and 214.6 ± 73.9 nm, respectively. Scale bar, 200 nm (m3Exos@DNR) and 500 nm (nExos@DNR). (D) The optimum absorption wavelength of DNR was determined through full-wavelength scanning using UV-Vis spectroscopy and showed the maximum absorption peak at 480 nm. An absorbance curve was generated using a series of standard DNR solutions and the result was Y (absorbance)=0.01531*X (concentration of DNR, ug/mL) + 0.1586, R2 = 0.9937. (E) The drug loading capacity and encapsulation efficiency were calculated based on the absorbance curve. The encapsulation efficiency was 26.06% ± 2.261% for nExos@DNR and 26.36% ± 1.445% for m3Exos@DNR, while the drug loading capacity was 20.65% ± 1.422% and 20.86% ± 0.9111%, respectively. Abbreviation: ns, not significant. |
Next, AML cells were incubated with nExos and m3Exos and we found that empty vesicles did not affect cell proliferation and survival (Figure 7A). In addition, overexpression of c-Mpl rendered AML cells resistant to DNR, while knockdown of c-Mpl increased drug sensitivity (Figure 7B). After DNR loading, m3Exos@DNR demonstrated a significantly stronger killing effect on c-Mpl+ AML cells compared to direct DNR treatment or nExos@DNR (Figure 7C). The corresponding IC50 values are presented in Supplementary Table 3. Flow cytometric analysis further revealed that m3Exos@DNR markedly enhanced c-Mpl+ AML cells apoptosis in the same concentration of DNR (Figure 7D). These results indicate that m3Exos@DNR can specifically and effectively kill c-Mpl+ AML cells in vitro.
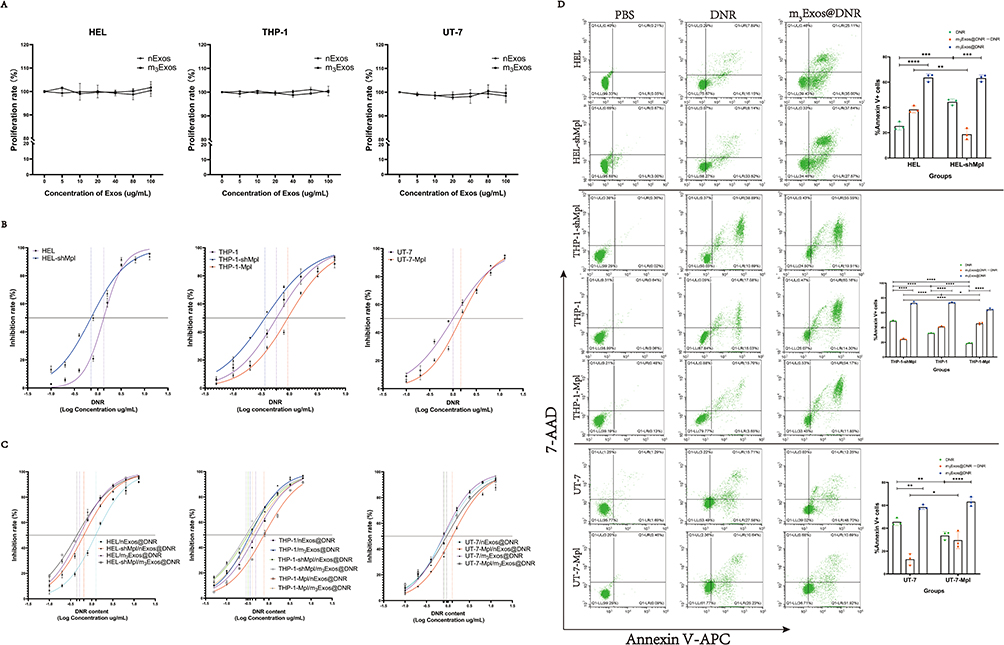 |
Figure 7 m3Exos@DNR can specifically and effectively kill c-Mpl+ AML cells in vitro. (A) After treated with nExos and m3Exos (0, 5, 10, 20, 40, 80, and 100 µg/mL) for 24 hours, HEL, THP-1 and UT-7 cells were not affected according to the results of CCK-8 assay. (B) The concentration gradient of DNR (ug/mL) was 0, 0.1, 0.2, 0.4, 0.8, 1.6. 3.2, 6.4 and 12.8 for HEL, HEL-shMpl, UT-7 and UT-7-Mpl. The concentration gradient of DNR (ug/mL) was 0, 0.05, 0.1, 0.2, 0.4, 0.8, 1.6. 3.2 and 6.4 for THP-1, THP-1-shMpl and THP-1-Mpl. After 24 hours of treatment, IC50 value of each group was determined by CCK8 assay and calculated using GraphPad Prism software. The results showed that IC50 values/95% CI (ug/mL) of DNR in HEL, HEL-shMpl, THP-1, THP-1-shMpl, THP-1-Mpl, UT-7 and UT-7-Mpl were 1.340/1.265–1.420, 0.7156/0.6562–0.7801, 0.5874/0.5305–0.6509, 0.3671/0.3378–0.3991, 0.9360/0.8721–1.005, 1.003/0.9211–1.091 and 1.467/1.372–1.569, respectively. (C) The quantities of nExos@DNR and m3Exos@DNR were adjusted based on their respective drug-loading capacities and we guaranteed the concentration gradient of DNR (ug/mL) in nExos@DNR and m3Exos@DNR groups were as the same as the DNR groups. With nExos@DNR treatment, IC50 values/95% CI (ug/mL) of DNR in HEL, HEL-shMpl, THP-1, THP-1-shMpl, THP-1-Mpl, UT-7 and UT-7-Mpl were 1.234/1.167–1.304, 0.6484/0.5935–0.7084, 0.4853/0.4433–0.5309, 0.3217/0.3007–0.3441, 0.7665/0.7153–0.8213, 0.8075/0.7548–0.8636 and 1.259/1.153–1.374, respectively. With m3Exos@DNR treatment, IC50 values/95% CI (ug/mL) of DNR in HEL, HEL-shMpl, THP-1, THP-1-shMpl, THP-1-Mpl, UT-7 and UT-7-Mpl were 0.5150/0.4626–0.5727, 0.4430/0.4207–0.4664, 0.3592/0.3263–0.3950, 0.2899/0.2768–0.3036, 0.4090/0.3856–0.4337, 0.7750/0.7377–0.8142 and 0.9251/0.8286–1.032, respectively. (D) The concentrations of the DNR solution were 0.7 µg/mL (the IC50 of DNR for HEL-shMpl) for groups of HEL and HEL-shMpl, 0.35 µg/mL (the IC50 of DNR for THP-1-shMpl) for groups of THP-1, THP-1-shMpl, and THP-1-Mpl, and 1 µg/mL (the IC50 of DNR for UT-7) for groups of UT-7 and UT-7-Mpl. After 24 hours of treatment, collecting and washing, the cells were stained with Annexin V-APC and 7-AAD. Flow cytometry data were acquired using a flow cytometer and analyzed by CytExpert software. Apoptosis rates were calculated by GraphPad Prism software and graphs were put on the right of the flow plots depict. *P < 0.05; **P < 0.01; ***P < 0.001; ****P < 0.0001. |
The Toxicity of m3Exos@DNR is Similar to DNR in vivo
After treatment administration (Figure 8A), we found that the body weights in the K3 (DNR) and K4 groups (m3Exos@DNR) decreased due to reduced appetite but began to recover around day 10 (Figure 8B). No significant abnormalities in blood routine (days 7 and 21), liver function (day 21), or cardiac function (day 21) were observed in the K2 group (m3Exos) compared to K1 group (PBS). On day 7 and 21, signs of hematopoietic (white blood cells, red blood cells, platelet and hemoglobin), liver (AST and ALT) and cardiac (LDH, CK-MB and cTnT) function injury were detected in K3 and K4 groups (Figure 8C and D). Compared to the K3 group, the K4 group exhibited potentially worse liver function and hematopoiesis but better cardiac function (Figure 8C and D). These findings might have resulted from m3Exos@DNR being partially cleared by the liver, releasing DNR into the local liver tissue, leading to higher concentrations of DNR in the liver. Additionally, HSCs, which express c-Mpl (albeit at lower levels than HEL cells), may be targeted by m3Exos@DNR. Conversely, cardiac cells likely internalized fewer m3Exos@DNR due to the lack of membrane targeting. By day 21, hematological markers started to recover over the 14-day observation period both in K3 and K4 groups. Histopathological analysis (HE staining) of the heart, liver, kidney, and spleen tissues in each group is presented in Figure 8E. In addition, toxicities observed in the m3Exos@DNR-treated mice were manageable, with lower cardiac toxicity compared to mice treated with DNR alone.
 |
Figure 8 Evaluation of the toxicity of m3Exos@DNR. (A) The flowchart was drawn with Figdraw. KM mice were treated via intraperitoneal (i.p.) injection for three consecutive days as follows and each group had five mice: Group K1 (control) received normal saline, Group K2 received m3Exos (25 mg/kg/day), Group K3 received DNR (5 mg/kg/day), and Group K4 received m3Exos@DNR (25 mg/kg/day, approximately 5 mg/kg/day of DNR). (B) Body weight was measured every two days. After treatment administration, the body weights in the K3 and K4 groups decreased due to reduced appetite but began to recover around day 10. (C) Routine blood tests were conducted on days 7 and 21 after treatment. Compared to the K3 group, the K4 group exhibited potentially worse hematopoiesis on the seventh day, but mice recovered well both in K3 and K4 groups after two weeks recovery. (D) Liver and cardiac function tests were conducted on days 21. Compared to the K3 group, the K4 group exhibited potentially worse liver function but better cardiac function. (E) HE staining of heart, liver, spleen and kidney sections from four groups on day 21 were presented. Scale bar: 100 μm. *P < 0.05; **P < 0.01; ***P < 0.001; ****P < 0.0001. Abbreviation: ns, not significant. |
m3Exos@DNR Reduces the AML Burden of Cell-Derived Tumor Xenograft (CDX) Model Mice in vivo
Stable cell line HEL-GFP-FLuc was identified by fluorescence microscope and vivo imaging system (Supplementary Figure 5A–C). No mortalities were observed during the experimental period, and the animals were sacrificed 21 days after drug injection (Figure 9A). In the N1 (PBS) and N2 (m3Exos) groups, the mice began to lose body weight around day 12 following AML cell induction (Figure 9B). Similarly, in the N3 (DNR) and N4 (m3Exos@DNR) groups, their body weight exhibited a short-term decrease in the initial days, comparable to those in the K3 and K4 groups. Bioluminescent luciferase imaging (Figure 9C) and GFP signal detection in organs (Figure 9D) revealed that tumor burden levels were highest in the N1 and N2 groups and lowest in the N4 group. The spleens were significantly enlarged in the N1 group (0.151 ± 0.039 g) and the N2 group (0.1468 ± 0.02 g) compared to the N3 group (0.056 ± 0.005 g) and the N4 group (0.048 ± 0.006 g) (Figure 9E). Similar trends were observed for liver weights, which were 1.917 ± 0.125 g, 1.823 ± 0.093 g, 1.252 ± 0.066 g, and 1.2 ± 0.141 g for the N1, N2, N3, and N4 groups, respectively.
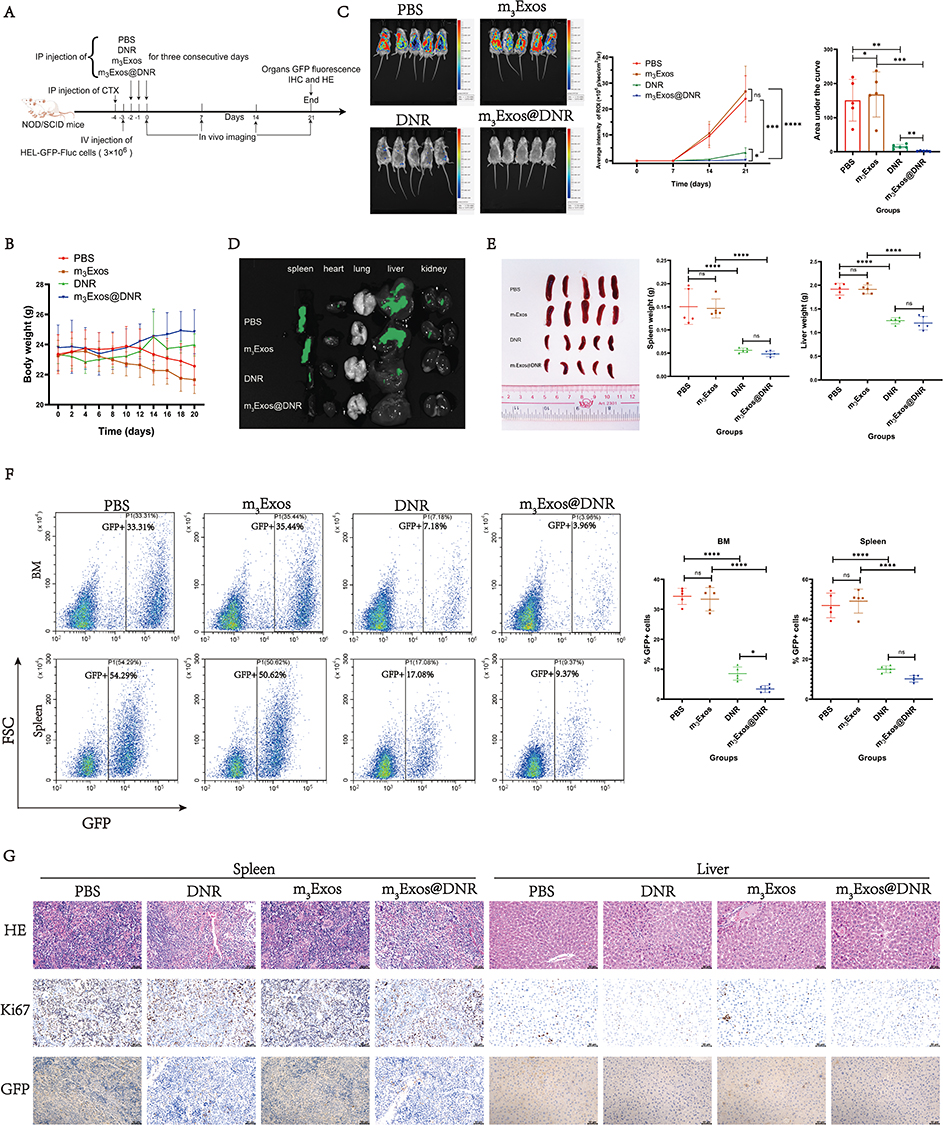 |
Figure 9 Evaluation of the in vivo effect of m3Exos@DNR. (A) The flowchart was drawn with Figdraw. CTX was administered via a 100mg/kg i.p. injection, and 24 hours later, the animals were transplanted with HEL-GFP-FLuc cells (3×10⁶) via tail vein injection. After an additional 24 hours, NOD/SCID mice were treated via i.p. injection for three consecutive days and each group had five mice: Group N1 (control) received normal saline, Group N2 received m3Exos (25 mg/kg/day), Group N3 received DNR (5 mg/kg/day), and Group N4 received m3Exos@DNR (25 mg/kg/day, approximately 5 mg/kg/day of DNR). (B) Body weight was measured every two days. (C) Bioluminescent imaging was performed on days 7, 14, and 21. After injection of HEL-GFP-Fluc cells, the progression of the tumor load in mice was tracked using bioluminescence imaging, revealing that tumor burden levels were highest in the N1 and N2 groups and lowest in the N4 group. (D) GFP signal detection in the heart, liver, kidney, spleen, and lungs also showed the same results as bioluminescent imaging. (E) Image of spleens dissected from the four group were illustrated, and the spleens and livers of the NOD/SCID mice were weighted and compared on day 21. (F) The cells harvested from spleens and bone marrow were analyzed via flow cytometry to determine the proportion of GFP-positive cells and quantitative analysis was performed on the right of the flow plots. (G) HE and IHC staining of spleen and liver sections with anti-Ki67, anti-GFP from NOD/SCID mice of the respective group on day 21 were presented. Scale bar: 50 μm. *P < 0.05; **P < 0.01; ***P < 0.001; ****P < 0.0001. Abbreviation: ns, not significant. |
Spleens and bone marrow samples were harvested and homogenized in PBS using nylon meshes following erythrolysis. Flow cytometry was performed to measure GFP fluorescence and determine the proportion of AML cells, and the results (Figure 9F) demonstrated higher proportions of HEL cells in the spleens and bone marrow of the N1 and N2 groups, while the N4 group exhibited the lowest proportion of HEL cells. Histopathological sections (HE, GFP, and Ki67 staining) of liver and spleen tissues are shown in Figure 9G, which also indicated the lowest tumor burden in the group with m3Exos@DNR treatment. These findings indicated that m3Exos@DNR possesses a stronger killing ability against c-Mpl+ AML cells compared to DNR alone in vivo.
Discussion
Over the past decades, systemic chemotherapy has remained the cornerstone of AML treatment. However, unlike ALL patients, AML patients often fail to achieve the desired clinical outcomes. Among various treatment regimens, the “7+3” protocol, combining cytarabine and DNR, continues to be the most commonly used intensive induction therapy.23 Studies have suggested that higher doses of DNR could yield improved therapeutic outcomes in AML patients.24–28 However, its clinical application is limited by severe side effects, particularly myocardial injury.36,37 Furthermore, the emergence of chemotherapy resistance remains a significant challenge, reducing the overall efficacy of treatment.
With continued research into AML, increasingly detailed mechanisms underlying its pathogenesis are being uncovered, providing valuable insights for disease classification and subtyping,38 which in turn enable personalized therapeutic approaches. Targeted therapies are currently advancing rapidly,39–41 focusing on treating specific subsets of AML patients characterized by the overexpression or mutation of particular molecules. Based on public databases, we identified c-Mpl as the most highly expressed molecule in AML compared to other tumors and normal tissues. Moreover, AML patients with elevated c-Mpl expression tend to exhibit persistent chemoresistance and shorter remission durations, ultimately leading to relapse.3 A previous study demonstrated that high c-Mpl expression drives resistance to multiple chemotherapeutic drugs in AML cells,14 a conclusion further supported by our findings using c-Mpl knockdown and overexpression models in AML cell lines (HEL, THP-1, and UT-7). AML cells with high c-Mpl expression displayed higher IC50 values for DNR and reduced apoptosis rates. These findings underscore the necessity of developing new treatment strategies specifically targeting c-Mpl+ AML patients.
Numerous studies indicate that cancer treatment worldwide has now moved into an era of personalized precision therapy. At present, targeted drug delivery through nanotechnology, including Exos, is considered an excellent therapeutic modality. Exos, derived from multivesicular bodies, are secreted into the extracellular space by most cell types. The bi-lipid layer of Exos acts as a natural shield, protecting the functional molecules within the vesicle.42 This unique feature enables Exos to function as effective drug carriers, capable of being loaded with both hydrophilic and lipophilic drugs using methods such as co-incubation, ultrasound, and extrusion. Previous studies have demonstrated that Exos carry various membrane proteins (CD9,43 CD63,44 and Lamp2b16), which can be utilized for surface engineering to incorporate targeting moieties. Liang17 inserted albumin-binding domains (ABDs) into the first or second loop of CD63 and engineered EVs containing these fusion proteins. Their findings revealed that ABD in the second loop of CD63 exhibited the best binding capacity to albumin, while ABD in the first loop showed the lowest binding ability when assessed using FITC-labeled human serum albumin. These results highlighted that the second tetraspanin loop is preferable for engineering purposes. In our study, we similarly selected the second loop of CD63 as the preferred site for insertion. To minimize the impact of the inserted component on CD63’s structure, we used a TPO mimetic peptide (14AA) to target c-Mpl. A previous study22 demonstrated that while a single TPO mimetic peptide had excellent binding activity, while it was significantly less potent than recombinant human TPO (rhTPO) in activating c-Mpl. This suggested that the fusion protein containing this mimetic peptide could bind to c-Mpl+ AML cells without the function of stimulation. Initially, we confirmed that the fusion protein could bind to c-Mpl using FRET and the DUAL membrane system. Subsequently, we observed that the binding ability increased with the number of mimetic peptides up to a certain threshold. Beyond this threshold, further increases in peptide numbers resulted in decreased binding affinity. We hypothesize that the addition of mimetic peptides creates more binding sites, enhancing opportunities for interaction with c-Mpl. However, excessive duplication likely causes steric hindrance, leading to occlusion of binding sites. Ultimately, by calculating FRET efficiency and performing endocytosis experiments, we determined that the fusion protein containing three mimetic peptides (CD63-mTPO3) exhibited the strongest binding affinity to c-Mpl+ AML cells.
Currently, MSCs are the only type of normal human cells with excellent potential for massive expansion and large-scale Exos production, such as three-dimensional culture.19,20 In addition, MSCs possess immune privilege and exhibit low immune rejection when transplanted for allogenic use.45–47 Thus, Exos derived from MSCs have been reported to possess lower immunogenicity and offer a much safer option.20 MSCs can be isolated from bone marrow, fetal appendages, adipose tissue, and other tissues.48 However, MSCs are more easily isolated from fetal appendages, reducing ethical constraints. A previous study49 showed that, compared to hUCMSCs, amniotic fluid-derived MSCs had higher immunogenicity, while MSCs derived from the amniotic membrane were more challenging to isolate. In our study, hUCMSCs were successfully isolated for obtaining Exos and engineered Exos containing fusion proteins were produced via lentivirus transfection. For Exos collection, we performed differential centrifugation, the most widely used method for Exos isolation,50 which offers advantages in preserving Exos ultrastructure and minimizing impurities.51 However, this method is time-consuming, labor-intensive, and requires significant resources. Previous study suggested52 that sequential filtration combined with affinity chromatography targeting Exos-specific surface markers might offer the optimal strategy for clinical-scale Exos isolation. This approach could effectively remove non-Exos contaminants, including residual DNA and culture medium proteins. Ultimately, buffer exchange facilitated product purification and concentration preceding formulation and downstream processing.
After collecting and identifying Exos through WB, NTA and TEM, we confirmed that all types of engineered Exos met the MISEV2023 criteria.53 Fusion proteins were also successfully detected in the engineered MSCs and their corresponding Exos. Following ultrasound treatment, DNR was successfully loaded into the Exos, although the size of the Exos increased compared to their original dimensions. Usually, Exos are stored at −80 °C, but this temperature is not suitable for their handling or transportation and several studies have shown that Exos are not stable in long-term storage under such conditions.54,55 Lyophilization is a promising storage method which could be also used for Exos. With addition of trehalose, lyophilization had little effect on the pharmacokinetics and lyophilized Exos retained the activity of loaded Gaussia luciferase and immunostimulatory CpG DNA for approximately 4 weeks even when stored at 25 °C.56
In this present study, we found that m3Exos could effectively target c-Mpl+ AML cells in vitro, leading to higher cellular uptake without stimulation. Compared to DNR alone, m3Exos@DNR exhibited significantly enhanced cytotoxicity against c-Mpl+ AML cells in vitro. Similarly, in vivo, m3Exos@DNR demonstrated superior c-Mpl+ AML elimination compared to DNR. These findings confirmed that the engineered Exos constructed in our study could accurately target and deliver DNR to c-Mpl+ AML cells. Similar to DNR treatment, organ toxicity was observed after m3Exos@DNR treatment in KM mice, but with some differences. Specifically, m3Exos@DNR treatment resulted in more severe liver and hematological toxicity but milder cardiac toxicity compared to DNR treatment. In addition, we hypothesized that m3Exos@DNR effectively targeted c-Mpl+ cells, such as hematopoietic stem cells and megakaryocyte progenitors, which, despite their significantly lower c-Mpl expression compared to AML cells, may have contributed to slightly increased hematological toxicity. Previous studies have shown that the liver serves as a major clearance site for circulating Exos, predominantly mediated by hepatic macrophages.57,58 In our study, part of the m3Exos@DNR in mice was likely cleared by the liver, resulting in higher local concentrations of DNR in liver tissue. However, the observed toxicities remained within an acceptable range. Studies have also demonstrated that pre-injection with siRNA against Cltc could significantly inhibit the endocytic function of the mononuclear phagocyte system in the spleen and liver, thereby increasing the therapeutic concentration of Exos in other targeted organs.59 This approach could potentially enhance the therapeutic effect of m3Exos@DNR while reducing hepatic toxicity. Interestingly, we observed lower cardiotoxicity in the m3Exos@DNR group compared to the DNR group. This finding might be attributed to the poor targeting capability of m3Exos@DNR for cardiac cells.
As mentioned above, we constructed several fusion proteins capable of binding to c-Mpl, with CD63-mTPO3 exhibiting the strongest binding ability. Using lentiviral transfection, we successfully engineered MSCs to express CD63-mTPO3 and produce m3Exos with the highest targeting capability for c-Mpl. After loading m3Exos with DNR, we obtained m3Exos@DNR, which effectively targeted and eliminated c-Mpl + AML cells both in vitro and in vivo while demonstrating a favorable safety profile.
Conclusion
In this study, we successfully created engineered Exos with targeting capability for c-Mpl, which demonstrated a manageable safety profile. Although in vitro and in vivo experiments confirmed the efficiency of m3Exos@DNR in targeting and eliminating c-Mpl+ AML cells, larger-scale animal studies and clinical samples are required to further validate its effectiveness. For safety assessment, only KM mice were used, and the sample size was quite limited, necessitating additional research for more robust results. Overall, our study provides a foundation for the use of engineered Exos as drug delivery systems in targeted cancer therapy in the future.
Ethics Approval and Consent to Participate
The animal studies were approved by the Institutional Animal Care and Use Committee of the College of Life Science, Sun Yat-sen University (Approval number: SYSU-LS-IACUC-2024-0092). Guidelines for the ethical review of laboratory animal welfare (China, GB/T 35892-2018) and ARRIVE guidelines were also followed. Samples of umbilical cords were obtained with informed donor consent following healthy births. All processes were approved and supervised by the Ethics Committee of the Seventh Affiliated Hospital of Sun Yat-Sen University and followed the Declaration of Helsinki.
Acknowledgments
We thank Figdraw for help with illustrations in Graphical Abstract, Figures 2C, E, 8 A and 9A. We would like to thank “Home for Researchers” website (https://www.home-for-researchers.com/) for its linguistic assistance.
Funding
This study was supported by Shenzhen Medical Research Funds (A2302003), National Natural Science Foundation of China (NSFC, Grant No. 82372312) and Shenzhen Science and Technology Innovation Commission (JCYJ20220530144814032 and JCYJ20240813150301002).
Disclosure
The authors declare that the research was conducted in the absence of any commercial or financial relationships that could be construed as a potential conflict of interest.
References
1. Döhner H, Weisdorf DJ, Bloomfield CD. Acute myeloid leukemia. N Engl J Med. 2015;373:1136–1152. doi:10.1056/NEJMra1406184
2. Ward ZJ, Yeh JM, Bhakta N, et al. Global childhood cancer survival estimates and priority-setting: a simulation-based analysis. Lancet Oncol. 2019;20:972–983. doi:10.1016/S1470-2045(19)30273-6
3. Albitar M, Manshouri T, Kantarjian H, et al. Correlation between lower c-mpl protein expression and favorable cytogenetic groups in acute myeloid leukemia. Leuk Res. 1999;23:63–69. doi:10.1016/S0145-2126(98)00132-5
4. Yu P, Qiu SW, Rao Q, et al. Expression of c-MPL in leukemic stem cells from acute myeloid leukemia patients. Zhongguo Shi Yan Xue Ye Xue Za Zhi. 2012;20:1052–1055.
5. Hitchcock IS, Kaushansky K. Thrombopoietin from beginning to end. Br J Haematol. 2014;165:259–268. doi:10.1111/bjh.12772
6. Miyakawa Y, Oda A, Druker B, et al. Thrombopoietin induces tyrosine phosphorylation of Stat3 and Stat5 in human blood platelets. Blood. 1996;87:439–446. doi:10.1182/blood.V87.2.439.bloodjournal872439
7. Drachman JG, Millett KM, Kaushansky K. Thrombopoietin signal transduction requires functional JAK2, not TYK2. J Biol Chem. 1999;274:13480–13484. doi:10.1074/jbc.274.19.13480
8. Rojnuckarin P, Drachman JG, Kaushansky K. Thrombopoietin-induced activation of the mitogen-activated protein kinase (MAPK) pathway in normal megakaryocytes: role in endomitosis. Blood. 1999;94:1273–1282. doi:10.1182/blood.V94.4.1273
9. Matsumura I, Kanakura Y, Kato T, et al. Growth response of acute myeloblastic leukemia cells to recombinant human thrombopoietin. Blood. 1995;86:703–709. doi:10.1182/blood.V86.2.703.bloodjournal862703
10. Ayala RM, Martínez-López J, Albízua E, et al. Clinical significance of Gata-1, Gata-2, EKLF, and c-MPL expression in acute myeloid leukemia. Am J Hematol. 2009;84:79–86. doi:10.1002/ajh.21332
11. Rauch PJ, Ellegast JM, Widmer CC, et al. MPL expression on AML blasts predicts peripheral blood neutropenia and thrombocytopenia. Blood. 2016;128:2253–2257. doi:10.1182/blood-2016-04-711986
12. Dong-Feng Z, Ting L, Yong Z, et al. The TPO/c-MPL pathway in the bone marrow may protect leukemia cells from chemotherapy in AML patients. Pathol Oncol Res. 2014;20:309–317. doi:10.1007/s12253-013-9696-z
13. Pulikkan JA, Madera D, Xue L, et al. Thrombopoietin/MPL participates in initiating and maintaining RUNX1-ETO acute myeloid leukemia via PI3K/AKT signaling. Blood. 2012;120:868–879. doi:10.1182/blood-2012-03-414649
14. Li H, Zhao N, Li Y, et al. c-MPL is a candidate surface marker and confers self-renewal, quiescence, chemotherapy resistance, and leukemia initiation potential in leukemia stem cells. Stem Cells. 2018;36:1685–1696. doi:10.1002/stem.2897
15. Hannafon BN, Gin AL, Xu YF, et al. Metastasis-associated protein 1 (MTA1) is transferred by exosomes and contributes to the regulation of hypoxia and estrogen signaling in breast cancer cells. Cell Commun Signal. 2019;17:13. doi:10.1186/s12964-019-0325-7
16. Alvarez-Erviti L, Seow Y, Yin H, et al. Delivery of siRNA to the mouse brain by systemic injection of targeted exosomes. Nat Biotechnol. 2011;29:341–345. doi:10.1038/nbt.1807
17. Liang X, Niu Z, Galli V, et al. Extracellular vesicles engineered to bind albumin demonstrate extended circulation time and lymph node accumulation in mouse models. J Extracell Vesicles. 2022;11:e12248. doi:10.1002/jev2.12248
18. Rahimian S, Najafi H, Afzali B, Doroudian M. Extracellular vesicles and exosomes: novel insights and perspectives on lung cancer from early detection to targeted treatment. Biomedicines. 2024;12:123. doi:10.3390/biomedicines12010123
19. Cao J, Wang B, Tang T, et al. Three-dimensional culture of MSCs produces exosomes with improved yield and enhanced therapeutic efficacy for cisplatin-induced acute kidney injury. Stem Cell Res Ther. 2020;11:206. doi:10.1186/s13287-020-01719-2
20. Yeo RWY, Lai RC, Zhang B, et al. Mesenchymal stem cell: an efficient mass producer of exosomes for drug delivery. Adv Drug Deliv Rev. 2013;65:336–341. doi:10.1016/j.addr.2012.07.001
21. Rahimian S, Mirkazemi K, Kamalinejad A, et al. Exosome-based advances in pancreatic cancer: the potential of mesenchymal stem cells. Crit Rev Oncol Hematol. 2025;207:104594. doi:10.1016/j.critrevonc.2024.104594
22. Cwirla SE, Balasubramanian P, Duffin DJ, et al. Peptide agonist of the thrombopoietin receptor as potent as the natural cytokine. Science. 1997;276:1696–1699. doi:10.1126/science.276.5319.1696
23. Luskin MR, Lee JW, Fernandez HF, et al. Benefit of high-dose daunorubicin in AML induction extends across cytogenetic and molecular groups. Blood. 2016;127:1551–1558. doi:10.1182/blood-2015-07-657403
24. Preisler H, Davis RB, Kirshner J, et al. Comparison of three remission induction regimens and two postinduction strategies for the treatment of acute nonlymphocytic leukemia: a cancer and leukemia group B study. Blood. 1987;69:1441–1449.
25. Dillman RO, Davis RB, Green MR, et al. A comparative study of two different doses of cytarabine for acute myeloid leukemia: a Phase III trial of cancer and leukemia group B. Blood. 1991;78:2520–2526. doi:10.1182/blood.V78.10.2520.2520
26. Schiller G, Gajewski J, Nimer S, et al. A randomized study of intermediate versus conventional-dose cytarabine as intensive induction for acute myelogenous leukaemia. Br J Haematol. 1992;81:170–177. doi:10.1111/j.1365-2141.1992.tb08203.x
27. Weick JK, Kopecky KJ, Appelbaum FR, et al. A randomized investigation of high-dose versus standard-dose cytosine arabinoside with daunorubicin in patients with previously untreated acute myeloid leukemia: a Southwest oncology group study. Blood. 1996;88:2841–2851. doi:10.1182/blood.V88.8.2841.bloodjournal8882841
28. Li EQ, Xu L, Zhang ZQ, et al. Retrospective analysis of 119 cases of pediatric acute promyelocytic leukemia: comparisons of four treatment regimes. Exp Ther Med. 2012;4:93–98. doi:10.3892/etm.2012.546
29. Sun L, Wang J, Wang Q, et al. Pretreatment of umbilical cord derived MSCs with IFN-γ and TNF-α enhances the tumor-suppressive effect on acute myeloid leukemia. Biochem Pharmacol. 2022;199:115007. doi:10.1016/j.bcp.2022.115007
30. Thaminy S, Auerbach D, Arnoldo A, et al. Identification of novel ErbB3-interacting factors using the split-ubiquitin membrane yeast two-hybrid system. Genome Res. 2003;13:1744–1753. doi:10.1101/gr.1276503
31. Kaneider NC, Leger AJ, Agarwal A, et al. “Role reversal” for the receptor PAR1 in sepsis-induced vascular damage. Nat Immunol. 2007;8:1303–1312. doi:10.1038/ni1525
32. Menon RP, Soong D, de Chiara C, et al. The importance of serine 776 in Ataxin-1 partner selection: a FRET analysis. Sci Rep. 2012;2:919. doi:10.1038/srep00919
33. N PDS, Hurst V, Ahluwalia A, et al. The ARRIVE guidelines 2.0: updated guidelines for reporting animal research. J Physiol. 2020;598:3793–3801. doi:10.1113/JP280389
34. Tang Z, Li C, Kang B, et al. GEPIA: a web server for cancer and normal gene expression profiling and interactive analyses. Nucleic Acids Res. 2017;45:W98–W102. doi:10.1093/nar/gkx247
35. Komatsu N, Kunitama M, Yamada M, et al. Establishment and characterization of the thrombopoietin-dependent megakaryocytic cell line, UT-7/TPO. Blood. 1996;87:4552–4560. doi:10.1182/blood.V87.11.4552.bloodjournal87114552
36. Deprez-DeCampeneere D, Jaenke R, Trouet A. Comparative cardiac and renal toxicity of daunorubicin in the rat and rabbit. Cancer Treat Rep. 1982;66:395–397.
37. Van vleet JF, Ferrans VJ. Clinical and pathologic features of chronic Adriamycin toxicosis in rabbits. Am J Vet Res. 1980;41:1462–1469. doi:10.2460/ajvr.1980.41.09.1462
38. Khoury JD, Solary E, Abla O, et al. The 5th edition of the World Health Organization Classification of haematolymphoid tumours: myeloid and histiocytic/dendritic neoplasms. Leukemia. 2022;36:1703–1719. doi:10.1038/s41375-022-01613-1
39. Hou JZ, Ye JC, Pu JJ, et al. Novel agents and regimens for hematological malignancies: recent updates from 2020 ASH annual meeting. J Hematol Oncol. 2021;14:66. doi:10.1186/s13045-021-01077-3
40. Pei HZ, Guo Y, Zhao Y, et al. FLT3 inhibitors induce p53 instability, driven by STAT5/MDM2/p53 competitive interactions in acute myeloid leukemia. Cancer Lett. 2025;611:217446. doi:10.1016/j.canlet.2025.217446
41. Sami SA, Darwish NHE, Barile ANM, et al. Current and future molecular targets for acute myeloid leukemia therapy. Curr Treat Options Oncol. 2020;21:3. doi:10.1007/s11864-019-0694-6
42. Van Dongen HM, Masoumi N, Witwer KW, et al. Extracellular vesicles exploit viral entry routes for cargo delivery. Microbiol Mol Biol Rev. 2016;80:369–386. doi:10.1128/MMBR.00063-15
43. Yim N, Ryu SW, Choi K, et al. Exosome engineering for efficient intracellular delivery of soluble proteins using optically reversible protein–protein interaction module. Nat Commun. 2016;7:12277. doi:10.1038/ncomms12277
44. Stickney Z, Losacco J, McDevitt S, et al. Development of exosome surface display technology in living human cells. Biochem Biophys Res Commun. 2016;472:53–59. doi:10.1016/j.bbrc.2016.02.058
45. Jacobs SA, Roobrouck VD, Verfaillie CM, et al. Immunological characteristics of human mesenchymal stem cells and multipotent adult progenitor cells. Immunol Cell Biol. 2013;91:32–39. doi:10.1038/icb.2012.64
46. Sareen N, Sequiera GL, Chaudhary R, et al. Early passaging of mesenchymal stem cells does not instigate significant modifications in their immunological behavior. Stem Cell Res Ther. 2018;9:121. doi:10.1186/s13287-018-0867-4
47. Majka M, Sułkowski M, Badyra B, et al. Concise review: mesenchymal stem cells in cardiovascular regeneration: emerging research directions and clinical applications. Stem Cells Transl Med. 2017;6:1859–1867. doi:10.1002/sctm.16-0484
48. Wang Y, Chen X, Cao W, et al. Plasticity of mesenchymal stem cells in immunomodulation: pathological and therapeutic implications. Nat Immunol. 2014;15:1009–1016. doi:10.1038/ni.3002
49. Yi X, Chen F, Liu F, et al. Comparative separation methods and biological characteristics of human placental and umbilical cord mesenchymal stem cells in serum-free culture conditions. Stem Cell Res Ther. 2020;11:183. doi:10.1186/s13287-020-01690-y
50. Yu LL, Zhu J, Liu JX, et al. A comparison of traditional and novel methods for the separation of exosomes from human samples. BioMed Res Int. 2018;2018:1–9. doi:10.1155/2018/6057348
51. Patel GK, Khan MA, Zubair H, et al. Comparative analysis of exosome isolation methods using culture supernatant for optimum yield, purity and downstream applications. Sci Rep. 2019;9:5335. doi:10.1038/s41598-019-41800-2
52. Colao IL, Corteling R, Bracewell D, et al. Manufacturing exosomes: a promising therapeutic platform. Trends Mol Med. 2018;24(3):242–256. doi:10.1016/j.molmed.2018.01.006
53. Welsh JA, Goberdhan DCI, O’Driscoll L, et al. Minimal information for studies of extracellular vesicles (MISEV2023): from basic to advanced approaches. J Extracell Vesicles. 2024;13:e12404. doi:10.1002/jev2.12404
54. Wu Y, Deng W, Ii DJK. Exosomes: improved methods to characterize their morphology, RNA content, and surface protein biomarkers. Analyst. 2015;140:6631–6642. doi:10.1039/C5AN00688K
55. Lőrincz ÁM, Timár CI, Marosvári KA, et al. Effect of storage on physical and functional properties of extracellular vesicles derived from neutrophilic granulocytes. J Extracell Vesicles. 2014;3:25465. doi:10.3402/jev.v3.25465
56. Charoenviriyakul C, Takahashi Y, Nishikawa M, et al. Preservation of exosomes at room temperature using lyophilization. Int J Pharm. 2018;553:1–7. doi:10.1016/j.ijpharm.2018.10.032
57. Imai T, Takahashi Y, Nishikawa M, et al. Macrophage‐dependent clearance of systemically administered B16BL6‐derived exosomes from the blood circulation in mice. J Extracell Vesicles. 2015;4:26238. doi:10.3402/jev.v4.26238
58. Zhang G, Huang X, Xiu H, et al. Extracellular vesicles: natural liver‐accumulating drug delivery vehicles for the treatment of liver diseases. J Extracell Vesicles. 2020;10:e12030. doi:10.1002/jev2.12030
59. Wan Z, Zhao L, Lu F, et al. Mononuclear phagocyte system blockade improves therapeutic exosome delivery to the myocardium. Theranostics. 2020;10:218–230. doi:10.7150/thno.38198
 © 2025 The Author(s). This work is published and licensed by Dove Medical Press Limited. The
full terms of this license are available at https://www.dovepress.com/terms.php
and incorporate the Creative Commons Attribution
- Non Commercial (unported, 4.0) License.
By accessing the work you hereby accept the Terms. Non-commercial uses of the work are permitted
without any further permission from Dove Medical Press Limited, provided the work is properly
attributed. For permission for commercial use of this work, please see paragraphs 4.2 and 5 of our Terms.
© 2025 The Author(s). This work is published and licensed by Dove Medical Press Limited. The
full terms of this license are available at https://www.dovepress.com/terms.php
and incorporate the Creative Commons Attribution
- Non Commercial (unported, 4.0) License.
By accessing the work you hereby accept the Terms. Non-commercial uses of the work are permitted
without any further permission from Dove Medical Press Limited, provided the work is properly
attributed. For permission for commercial use of this work, please see paragraphs 4.2 and 5 of our Terms.