")
Back to Journals » International Journal of Nanomedicine » Volume 19
Hybrid Liposome-MSN System with Co-Delivering Potential Effective Against Multidrug-Resistant Tumor Targets in Mice Model
Authors Yang Y, Yang S, Zhang B, Wang J, Meng D, Cui L, Zhang L
Received 4 April 2024
Accepted for publication 22 August 2024
Published 2 September 2024 Volume 2024:19 Pages 8949—8970
DOI https://doi.org/10.2147/IJN.S472276
Checked for plagiarism Yes
Review by Single anonymous peer review
Peer reviewer comments 4
Editor who approved publication: Professor Farooq A. Shiekh
Yanan Yang,1,* Shuoye Yang,1,2,* Beibei Zhang,1 Jinpeng Wang,1 Di Meng,1 Lan Cui,1,2 Lu Zhang1,2
1School of Biological Engineering, Henan University of Technology, Zhengzhou, People’s Republic of China; 2Key Laboratory of Functional Molecules for Biomedical Research, Zhengzhou, People’s Republic of China
*These authors contributed equally to this work
Correspondence: Shuoye Yang, School of Biological Engineering, Henan University of Technology, Lianhua Street, Gaoxin District, Zhengzhou, 450001, People’s Republic of China, Tel/Fax: +86-371-67756513, Email [email protected]
Introduction: RNA interference (RNAi) stands as a widely employed gene interference technology, with small interfering RNA (siRNA) emerging as a promising tool for cancer treatment. However, the inherent limitations of siRNA, such as easy degradation and low bioavailability, hamper its efficacy in cancer therapy. To address these challenges, this study focused on the development of a nanocarrier system (HLM-N@DOX/R) capable of delivering both siRNA and doxorubicin for the treatment of breast cancer.
Methods: The study involved a comprehensive investigation into various characteristics of the nanocarrier, including shape, diameter, Fourier transform infrared (FT-IR) spectroscopy, X-ray photoelectron spectroscopy (XPS), encapsulation efficiency, and drug loading. Subsequently, in vitro and in vivo studies were conducted on cytotoxicity, cellular uptake, cellular immunofluorescence, lysosome escape, and mouse tumor models to evaluate the efficacy of the nanocarrier in reversing tumor multidrug resistance and anti-tumor effects.
Results: The results showed that HLM-N@DOX/R had a high encapsulation efficiency and drug loading capacity, and exhibited pH/redox dual responsive drug release characteristics. In vitro and in vivo studies showed that HLM-N@DOX/R inhibited the expression of P-gp by 80%, inhibited MDR tumor growth by 71% and eliminated P protein mediated multidrug resistance.
Conclusion: In summary, HLM-N holds tremendous potential as an effective and targeted co-delivery system for DOX and P-gp siRNA, offering a promising strategy for overcoming MDR in breast cancer.
Keywords: mesoporous silica nanoparticles, multidrug resistance, small interfering RNA, doxorubicin, hybrid nanoparticles
Introduction
Multidrug resistance (MDR) stands as a major limitation to the successful treatment of many cancers, including breast cancer.1,2 Currently, an innovative approach in cancer therapy involves the development of a co-delivery system for small interfering RNA (siRNA) and chemotherapeutic drugs.3 This strategy leverages the ability of siRNA to selectively inhibit the expression of specific genes,4,5 reversing MDR and increasing the efficacy of chemotherapeutic agents.6,7
RNA interference (RNAi) is a sequence-specific post-transcriptional gene silencing process involving the introduction of endogenous or exogenous double-stranded RNA into target cells.8,9 This event triggers the degradation of homologous messenger RNA (mRNA) and effectively blocks the expression of specific genes, inducing a targeted downregulation of proteins.10–12 The interaction between siRNA and the cytosolic RNA-induced silencing complex (RISC), which recognizes complementary mRNA with high specificity,13 leads to the inhibition of gene expression through either mRNA degradation or interference with ribosome activity.14,15 By inhibiting the expression of specific genes,16,17 siRNA emerges as a promising therapeutic approach for treating various pathologies, including cancer and genetic disorders.18–20 Despite its considerable advantages, encompassing a high degree of safety, efficacy, a broad spectrum of targets, and target specificity,21,22 practical applications of siRNA often encounter limitations. Challenges such as a short plasma half-life, poor membrane permeability, and low bioavailability contribute to a diminished therapeutic effect.23,24 To overcome these obstacles, an effective siRNA delivery tool is required, ensuring the protection of siRNA enzymatic degradation within the body and enabling efficient delivery to cancer cells, thereby facilitating its accumulation within these cells.25,26
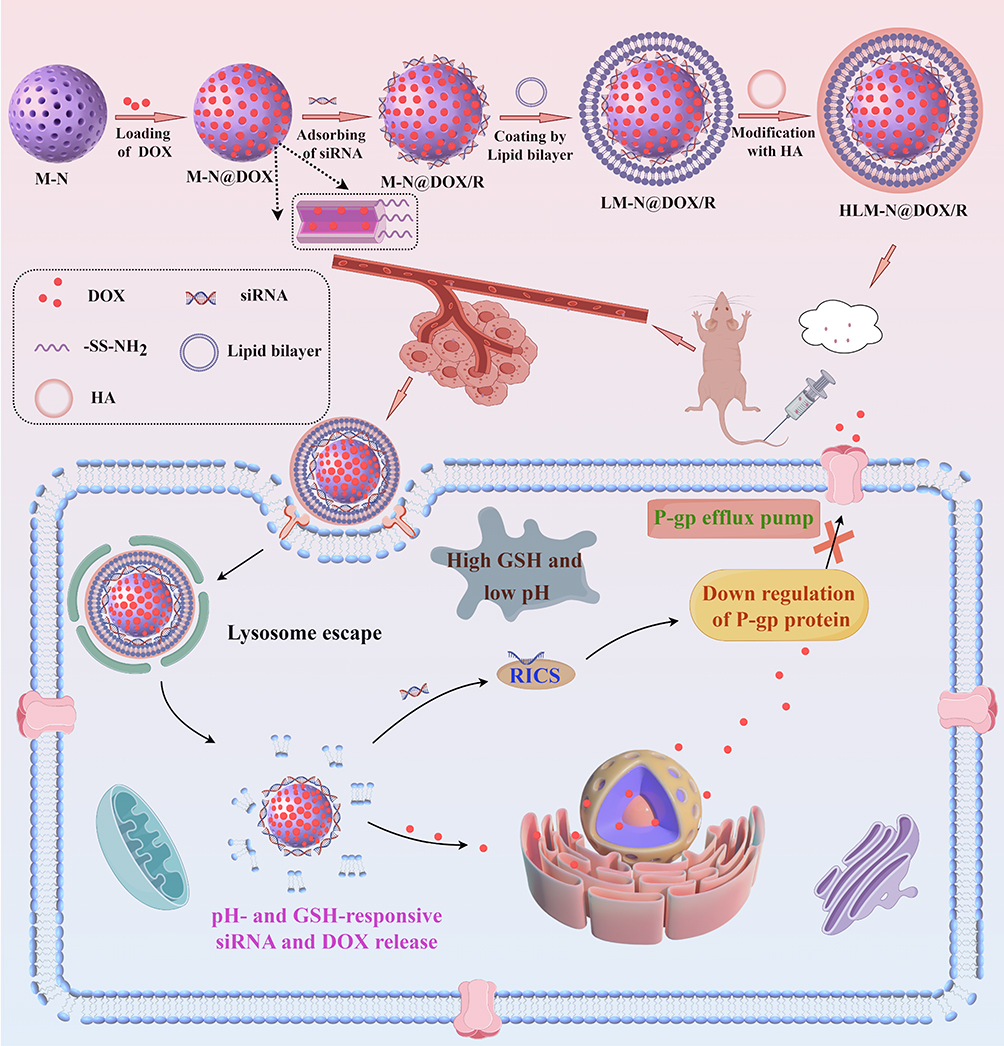 |
Scheme 1 Schematic illustration of the preparation procedure and antitumor mechanism of HLM-N@DOX/R (By Figdraw). |
In recent years, substantial progress has been made in the development of siRNA nanovectors, marked by advancements in strategies and in vitro and in vivo studies. Particularly, inorganic nanomaterials have been used as carriers for delivering chemically synthesized siRNA to cancer cells,27,28 with mesoporous silica nanoparticles (MSNs) standing out as prominent candidates. MSNs have gained widespread application as delivery systems for diverse drug molecules owing to their adjustable pore size, unique mesoporous structure, large drug loading capacity, and easily controllable release.29–31 Moreover, recent studies have demonstrated that MSNs exhibit negligible cytotoxicity and exceptional biocompatibility when applied to mammalian cells.32 In contrast to other siRNA delivery vectors, the porous structure of MSNs enables the binding of nucleic acid molecules to the surface and the encapsulation of a substantial quantity of small molecule drugs within the pores.
The MSNs were modified with a zeolitic imidazole framework-8 (ZIF-8) film to allow siRNA binding using a method reported by Pan’s group.33 The ZIF-8 film could convert the charge of MSN-COOH from negative to positive through electrostatic interaction, thus efficiently loading the siRNA and protecting the siRNA from nuclease degradation. The combined drug/siRNA delivery resulted in a substantially enhanced activity against multidrug resistant cancer cells. Additionally, several research groups have introduced a specific class of MSNs-based siRNA delivery vectors, characterized by a surface coating of cationic polyethylenimine (PEI) on the MSNs (siRNA/MSN-PEI).34–36 The PEI modification induces a positive surface charge on the silica microspheres, thereby facilitating siRNA loading through electrostatic adsorption. In vitro studies involving tumor cells have demonstrated the efficient delivery of these vectors, initiating RNAi and effectively suppressing tumor cell activity. PEI-coated siRNA/MSN complexes serve a dual purpose, providing capping of the pore entrances for improved cargo retention through “molecular gate-keeping”37,38 and facilitating the internalization of loaded particles into cells by endocytosis.39
Liposomes are spherical vesicles with an internal nucleus surrounded by a single or multiple concentric lipid bilayers.40 Liposomes have good biocompatibility due to their similar composition to biological membranes, and can fuse with biological membranes in vivo, making them a good carrier for membrane impermeable molecules to enter cells.41 PH sensitive liposomes are a type of actively targeted formulation that can release drugs in response to the microenvironment of the disease, thereby increasing drug targeting, reducing drug dosage, and lowering adverse reactions.42 Due to the lower pH value in tumor cells compared to normal cells, the lipid bilayer membrane ruptures in an acidic environment, releasing drugs.43 Hyaluronic acid (HA) is a viscous polysaccharide substance with excellent biocompatibility and degradability. As the main ligand for differentiation cluster 44 (CD44), it is widely used in the construction of drug nanocarriers.44
In the present study, a composite nanocarrier with a core/shell structure, designed to reverse tumor multidrug resistance, was synthesized and functionalized with HA to serve as a delivery vector for DOX. The nanocarrier, known as LM-N/R, incorporates HA to enhance its recognition by various receptors on the cell surface, enabling targeted drug delivery to tumor cells.45 LM-N/R features a pH-sensitive lipid-mesoporous drug delivery system that promotes DOX release in a weakly acidic microenvironment, showing a pH-responsive drug release characteristic. Additionally, the -SS- linkage within the nanocarrier is disrupted by the high concentration of glutathione (GSH) in the tumor microenvironment, triggering the release of both DOX and siRNA at the tumor site. The incorporated siRNA inhibits the expression of P-glycoprotein (P-gp) in MDR cells, consequently impeding the efflux function of P-gp. This inhibition promotes the accumulation of DOX within tumor cells, effectively reversing the effect of multi-drug resistance. The preparation procedure and antitumor mechanism of HLM-N@DOX/R were depicted in Scheme 1. The study involved a comprehensive investigation into various characteristics of these nanoparticles, including shape, zeta potential, diameter, FT-IR spectroscopy, encapsulation efficiency, and drug loading. Subsequent in vitro and in vivo studies were conducted to evaluate the efficacy and potential of these nanocarriers in reversing tumor multidrug resistance.
Materials and Methods
The following materials were obtained from Aladdin (Shanghai, China): cetyltrimethylammonium bromide (CTAB), sodium hydroxide (NaOH), tetraethoxysilane (TEOS), (3-Mercaptopropyl) trimethoxysilane (MPTMS), 2.2’-Dithiodipyridine, cysteamine hydrochloride, phosphatidylethanolamine (PE), cholesteryl hemisuccinate (CHEMS) and cholesterol (CHOL). Dimethyl sulfoxide (DMSO), methyl thiazolyl tetrazolium (MTT), glutathione (GSH) and Hoechst 33342 were purchased from Solarbio (Beijing, China). Doxorubicin (DOX) was purchased from meilunbio (Dalian, China). siRNA was custom-synthesized by Sangon Biotech (Shanghai, China). The sequence of the siRNA was: 5′-GAA ACC AAC UGU CAG UGU AdTdT-3′(sense) and 5′-UAC ACU GAC AGU UGG UUU CdTdT-3′(antisense).
The Synthesis of (MSNs-SS-NH2 (M-N)) Nanoparticles
Briefly, 1 g of CTAB was dissolved in 200 mL of H2O at 80°C, followed by the addition of 2 mL of NaOH solution (2 M). After stirring for 10 min, 5 mL of TEOS was added to the mixture and stirred for 2h. The resulting product was then centrifuged at 11,000 rpm for 15 min and washed with ethanol absolute and water. CTAB was subsequently removed with 100 mL of ethanol absolute containing ammonium nitrate (1 g), followed by centrifugation at 11,000 rpm for 10 min and three washes with ethanol absolute. The MSNs(M) were dried with a vacuum dryer at 37°C for 24 h.
For the production of MSNs-SH, 500 mg of MSNs, 0.8 mL of MPTMS, and 100 mL of ethanol absolute were stirred at 75°C for 12 h. The product was centrifuged at 11,000 rpm for 10 min and washed three times with ethanol absolute. The MSNs-SH (M-S) were dried with a vacuum dryer at 37°C for 24 h.
In the synthesis of MSNs-SS-NH2, a solution of 3.68 g of 2.2’-Dithiodipyridine in 20 mL of methanol was carefully added dropwise to a solution containing 1.06 g of cysteamine hydrochloride in 10 mL of methanol. After allowing the reaction to proceed for 48 h at room temperature, the mixture was rotated to evaporate the methanol. The resulting product was washed and recrystallized three times with diethyl ether to obtain Py-SS-NH2. Subsequently, 500 mg of M-S was dispersed in 30 mL of ethanol absolute, and 200 mg of Py-SS-NH2 was added to the solution, being stirred for 24 h at room temperature. The product was centrifuged and washed three times with ethanol absolute. Finally, the product MSNs-SS-NH2 (M-N) was dried with a vacuum dryer at 37°C for 24 h.
The Preparation of (HA-LMSNs-SS-NH2 (HLM-N)) Nanoparticles
In this synthesis, 60 mg of PE, 40mg of CHEMS, and 26 mg of CHOL were dissolved in 10 mL of chloroform. The mixture was then rotated to vaporize the chloroform and was followed by the addition of 10 mL H2O for ultrasonic hydration to obtain liposome suspension. Then, the previously prepared M-N suspension was added to the liposomes, and ultrasonic hydration was performed to obtain LMSNs-SS-NH2 (LM-N).
Initially, 50 mg of HA was dissolved in 20 mL of H2O and stirred at room temperature for 12 h. Subsequently, 75 mg of EDC.HCl and NHS were added, and the mixture was stirred for 2 h at room temperature. The prepared LM-N suspension was then added to the product and HA-LMSNs-SS-NH2 (HLM-N) was obtained through ultrasonic hydration.
Loading of DOX and siRNA
For the loading of DOX on the nanocarriers, 50 mg of DOX dissolved in 0.5 mL of DMSO was added dropwise to a solution containing 100 mg of M-N in 9.5 mL of H2O. After a 24-hour reaction at 37°C in the dark, the product was centrifuged at 11,000 rpm for 15 min and dried with a vacuum dryer at 37°C for 24 h to obtain M-N@DOX. The prepared M-N@DOX suspension was added to the liposomes, and ultrasonic hydration was performed to obtain LMSNs-SS-NH2@DOX (LM-N@DOX). Then the prepared LM-N@DOX suspension was added to the HA solution, and ultrasonic hydration was performed to obtain HLMSNs-SS-NH2@DOX (HLM-N@DOX).
M-N@DOX/siRNA was formulated through the electrostatic assembly of siRNA and M-N@DOX. The positive charges of M-N’s amine groups attract the negative charges of siRNA’s phosphate groups. Specifically, the 2.36 nM dry powdered siRNA was centrifuged at 2000 rpm for 10 min and then dissolved in 118 μL of DEPC water. The resulting solution was mixed with M-N to obtain M-N@DOX/siRNA (M-N@DOX/R). The prepared M-N@DOX/R suspension was added to the liposomes, and ultrasonic hydration was performed to obtain LMSNs-SS-NH2@DOX/siRNA (LM-N@DOX/R). Then the prepared LM-N@DOX/R suspension was added to the HA solution, and ultrasonic hydration was performed to obtain HLMSNs-SS-NH2@DOX/siRNA (HLM-N@DOX/R).
Characterization
The mean hydrodynamic diameter, polydispersity index, and zeta potential of the nanovectors in suspension were determined using a Malvern Nanosizer ZS (Malvern Instruments, UK). All the measurements were performed at room temperature with pH 7.4 in triplicate and are presented as mean values ± standard deviation (SD).
TEM imaging of MSNs was performed using a Libra 120 TEM (Carl Zeiss, NY). A carbon-coated 200-mesh copper grid was pre-rinsed with 5 µL of ethanol absolute and subsequently coated with 5 µL of nanoparticle suspension. After 3 min, the excess sample was removed with filter paper and further dried with a flow of N2 gas. The sample was then visualized using an electron microscope, and photographs were captured using a camera attached to the microscope.
The surface areas, pore volumes, and pore size distributions of as-synthesized nanomaterials were analyzed by nitrogen adsorption/desorption techniques using the accelerated surface area and porosimetry analyzer ASAP 2020 (Micromeritics, Norcross, GA). The thermal stability of the samples was assessed through differential scanning calorimetry (DSC) (METTLER Toledo, USA).
FT-IR spectra of nanoparticles were measured on an FT-IR spectrometer (Bruker IFS 55, Switzerland), scanning a region from 500 to 4000 cm−1 on a thin KBr slice. Identification of the elemental composition was carried out via XPS (Thermo Fisher Scientific, UK). The structural changes in the various modified nanomaterials were analyzed by X-ray diffraction (XRD) (D8 ADVANCE, Germany). The molecular structure of the nanomaterials was analyzed by a RamanScope III FT-Raman spectrometer (Bruker, USA).
siRNA Adsorption Capacity of Nanoparticles
In investigating the siRNA adsorption capacity of nanoparticles, gel electrophoresis was employed at various siRNA/M-N mass ratios. Composite samples of M-N and siRNA with varying mass ratios were prepared and mixed with 2 µL loading buffer (agarose gel loading dye 5×). After being loaded onto a 1% agarose gel, samples were subjected to electrophoresis in TAE buffer under an applied electric field of 100 V for about 20 min. The free siRNA was visualized by an ultraviolet gel imager (BIO-RAD, USA).
In Vitro Drug Release of Nanoparticles
Prior to conducting the in vitro drug release studies, the drug loading capacity (LC) and the drug entrapment efficiency (EE) of M@DOX, M-S@DOX, M-N@DOX, LM-N@DOX, and HLM-N@DOX were measured. After loading DOX onto M, M-S, M-N, LM-N, and HLM-N, centrifuged and measured the absorbance of the supernatant at 480 nm using a UV-vis spectrophotometer (Shimadzu, Japan). The LC and EE were calculated from the standard curve of DOX in phosphate buffered saline (PBS) solution, following the equations:
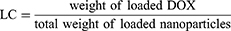
A calibration curve was established using standard solutions of DOX concentrations in the range of 5–200 μg/mL.
The in vitro DOX release was operated using the dialysis method. In brief, M@DOX, M-S@DOX, M-N@DOX, LM-N@D0X, and HLM-N@DOX were dispersed in PBS (pH 7.4) to obtain a final concentration of 1 mg/mL. Subsequently, 2 mL of the solution was loaded into a dialysis bag and immersed in PBS with pH 7.4 or 5.0, along with different concentrations (0, 2, 5, and, 10 mM) of GSH. The release characteristics of the nanoparticles were detected by constant-temperature vibration dialysis at 37°C and 100 rpm. Samples were collected at different time points, and the in vitro release rate of drugs was determined through a UV−vis spectrophotometer quantitative analysis. The drug release rate in vitro over time was plotted. To ensure that free nanoparticles (M@DOX) do not affect the results of DOX detection accuracy during the test, the specificity of the selected methodology should be investigated, including a UV-vis full-wavelength scanning of DOX and M@DOX.
Hemolysis Assay
The hemolysis assay was conducted to evaluate the potential impact of nanoparticles on red blood cells (RBC). Briefly, 2 mL of blood (obtained from female BALB/cA nude mice) was collected into a tube with heparin sodium and RBC were centrifuged at 2500 rpm for 5 min, washed three times with normal saline, and diluted up to 50 times with normal saline. Nanoparticle suspensions (M, M-S, M-N, LM-N, and HLM-N) at different concentrations (20, 40, 100, 200, and, 400 µg/mL) were prepared. For each assay, 200 µL of RBC and 200 µL of nanoparticle suspensions were combined to achieve final concentrations of 10, 20,50,100, and 200 µg/mL. For positive control tubes, 200 µL of 1% Triton X-100 was added to 200 µL of RBC. For negative control tubes, 200 µL of normal saline was added instead. The tubes were incubated at 37°C for 1 h, followed by centrifugation for 5 min at 2500 rpm to pellet intact erythrocytes. The supernatant was removed and placed into a 96-well plate to measure the absorbance (A) at 540 nm with a microplate reader (Tecan, Switzerland). The results were expressed as a percentage (%) of hemolysis and calculated through the following formula:

Cell Culture and Cell Viability Assessment
MCF-7, MCF-7/ADR, and LO2 cells were purchased from Shanghai Bogoo Biotechnology Company (Shanghai, China). Cell viability was assessed using the MTT assay. The cells were seeded at a density of 1×10⁴ cells per well on 96-well plates and cultured until reaching 80% confluence. Following the removal of the culture medium, the fresh medium was supplemented with 10% FBS, and various concentrations of nanoparticles were added. A negative control group was treated with an equivalent volume of culture medium. The cells were co-incubated with the nanoparticles (the empty MSNs (M, M-S, M-N, LM-N, and HLM-N), the DOX-loaded MSNs (M@DOX, M-S@DOX, M-N@DOX, LM-N@DOX, and HLM-N@DOX) and dual loaded nanocarriers (M@DOX, M-S@DOX, M-N@DOX/R, LM-N@DOX/R, and HLM-N@DOX/R)) for 24 and 48 hours. Subsequently, 100 μL of MTT solution (500 μg/mL in culture medium) was added to each well and further cultured for 4 hours. After the assay, the medium was removed and 100μL of DMSO was added to dissolve the blue formazan crystal produced by the proliferating cells. Finally, the plate was incubated at 37°C for 10 min, and the optical density (OD) at 490 nm was measured using a microplate reader (Tecan, Switzerland). The percentage (%) of cell viability was calculated using the formula:

Cellular Uptake
Fluorescence detection was employed to evaluate the cellular uptake of DOX and siRNA by MCF-7/ADR cells. Green fluorescence from fluorescein amidite (FAM)-labeled siRNA and intrinsic red fluorescence from DOX were used to track drug uptake into the cancer cells. To visualize the cellular internalization of M loaded with either siRNA or DOX, several different formulations (DOX, M-N@DOX/R, and HLM-N@DOX/R, each with a DOX concentration of 10 µg/mL) were prepared. MCF-7/ADR cells were plated (1×10⁴ cells/well) in 6-well tissue culture plates, with three different sets of total incubation times (4 h, 16 h, and 24 h). Before imaging, cells were fixed with 4% paraformaldehyde, and the cell nuclei were stained using Hoechst 33342. The cell-associated fluorescence was then assessed by a fluorescence microscope (Carl ZEISS, Axio Vision).
To investigate whether siRNA and DOX could escape from the endosomal barrier, a similar strategy was employed to confirm the engulfment of HLM-N@DOX/R vehicles by MCF-7/ADR cells. After incubation for 4 h,16 h, and 24 h, cells were treated with Lyso-tracker Red (Beyotime, China) to stain the endolysomes. Then, the distribution of siRNA and endolysomes in the cytoplasm was determined under the live cell imaging module by the Leica TCS SP5 confocal laser scanning microscopy (CLSM) (Leica Microsystems, Wetzlar, Germany).
Cellular Immunofluorescence Imaging and Western Blotting Assay
MCF-7 and MCF-7/ADR cells were plated (1×10⁴ cells/well) in a 12-well tissue culture plate and allowed to adhere completely to the wall. After removing the culture medium, cells were washed three times with PBS and fixed with 500 μL of 4% paraformaldehyde for 10 min. The fixed cells were then permeated with 0.3% Triton-X 100 for 10 min, blocked with 3% BSA at room temperature for 1 h, and incubated overnight at 4°C with the primary antibody against P-gp (anti-rabbit, 1:1000, Proteintech). Subsequently, the cells were washed four times with TBS-T and further incubated for 1 h at room temperature with Alexa Fluor 594-labeled goat anti-rabbit IgG secondary antibody (Proteintech, China). Additionally, cell nuclei were stained with Hoechst 33342 for 10 min. Observations were conducted utilizing a fluorescent microscope (Carl ZEISS, Axio Vision).
The expression of P-gp was measured by Western blot analysis, using glyceraldehyde-3-phosphate dehydrogenase (GAPDH) as an internal control. Additionally, the apoptosis-related protein BAX was also assessed. Following a 24-hour co-incubation with nanoparticles (M@DOX, M-S@DOX, M-N@DOX/R, LM-N@DOX/R, and HLM-N@DOX/R, each with a DOX concentration of 10 µg/mL), the cells were washed with PBS, and proteins were extracted on ice using 1 mL RIPA buffer supplemented with 10 μL protease inhibitor (PMSF). The cell lysates (20 µL proteins for each sample) were boiled at 37°C for 5 min in loading buffer and separated by 10% gradient SDS-PAGE (Solarbio, China). Subsequently, the proteins were transferred to a polyvinylidene fluoride (PVDF) membrane. Following a blocking step with 5% nonfat milk at room temperature for 1 h, the membrane was incubated with the primary antibody against P-gp (anti-rabbit, 1:1000, Proteintech, China), BAX (anti-rabbit, 1:5000, Proteintech, China) or GAPDH (anti-rabbit, 1:10000, Proteintech, China) at 4°C overnight. Following four washes with tris-buffered saline with 0.1% Tween-20 (TBST), the membranes were incubated for 1 h with near-infrared fluorescent dye-labeled goat anti-rabbit IgG secondary antibody (IRDye®, Proteintech, China) at room temperature. The protein bands were detected with Odyssey® DLx (LI-COR, USA).
Cell Migration Assessment
MCF-7/ADR cells were seeded at 2×10⁶ cells per well in a 6-well plate. Following cellular adhesion, the cell layer was scraped with a pipette gun and rinsed twice with PBS. The resulting scratches were then photographed using a microscope. Subsequently, the cells were incubated with several different formulations (DOX, M-N@DOX/R, and HLM-N@DOX/R, each with a DOX concentration of 10 µg/mL) for 24 h before being photographed again with a microscope (Nikon, Japan). The migration of cells in the scratches was observed and the migration rate was calculated.
Detection of Reactive Oxygen Species (ROS)
When programmed cell death is triggered, a large number of reactive oxygen species (ROS) clusters are produced in the mitochondria.46 MCF-7/ADR cells were plated (1×10⁴ cells/well) in a 12-well tissue culture plate. After cellular adhesion, the cells were treated with several formulations (DOX, M-N@DOX/R, and HLM-N@DOX/R, each with a DOX concentration of 10 µg/mL) for 24 h. The Reactive Oxygen Species Assay Kit (Beyotime, China) was then used to detect the effects of each drug delivery system on the intracellular ROS levels. The results were detected by a fluorescent microscope and analyzed using ImageJ software.
Flow Cytometry
MCF-7 and MCF-7/ADR cells were seeded at 2×10⁶ cells per well in a 6-well plate. Following cellular adhesion, cells were incubated with several formulations (DOX, M-N@DOX/R, and HLM-N@DOX/R, each with a DOX concentration of 10 µg/mL) for 24 h and subsequently detached through enzymatic digestion with trypsin. The Annexin V-FITC Apoptosis Detection Kit (Beyotime, China) was then used to detect the effects of each drug delivery system on cell apoptosis. Simultaneously, the Cell Cycle and Apoptosis Analysis Kit (Beyotime, China) was utilized to evaluate the effects of each drug delivery system on the cell cycle. The results were assessed by flow cytometry (Thermo Fisher, USA), and calculations were performed using CytExpert software.
In Vivo Antitumor Effect
Four-week-old female BALB/cA nude mice were purchased from Beijing Vital River Laboratory Animal Technology. A total of 5×10⁶ MCF-7/ADR cells mixed with normal saline were injected into a flank region of the mice. The mice were housed in sterile isolated cages at constant temperatures (25°C) and with free access to food and water. When the average volume of tumors reached 80 mm3, intravenous (i.v.) injections were administered on days 0 (first dose), 3, 6, 9, 12, and 15. The formulations included DOX, M-N@DOX/R, LM-N@DOX/R, and HLM-N@DOX/R, each with a DOX equivalent concentration of 10 mg/kg, and a control group receiving normal saline (5 mice in each group). Tumor volume and mouse weight were measured before each dose. Tumor diameter was measured with a digital vernier caliper, and tumor volume was calculated through the formula: volume = (major axis) × (minor axis)2/2. At the end of the experiment, the tumors and other organs were collected from the tumor-bearing mice and fixed in 4% paraformaldehyde for histological analysis (H&E). The tumor tissue sections were TUNNEL stained and the images were captured under a fluorescence microscope. The experiment was approved by the Laboratory Animal Center of Zhengzhou University.
The name of the guideline followed for the welfare of laboratory animals is “Laboratory animals—General code of animal welfare”.
Statistical Analysis
Statistical analysis was conducted based on three independent experiments, and the results are expressed as the mean values ± SD. Descriptive statistics and single-factor analysis of variance (ANOVA) were employed for data analysis. Group means were compared using the Duncan multiple-range test. All statistical analyses were performed using IBM SPSS Statistics 27, GraphPad Prism 9.5, and Origin 2018 software. A significance level of P value (p) <0.05 was considered indicative of a significant difference. Different letters denote the statistical difference between treatments following analysis using Duncan’s test.
Results and Discussion
siRNA Adsorption Capacity of Nanoparticles
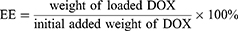
The gel electrophoresis was employed at various siRNA/M-N mass ratios, as illustrated in Figure 1A. A clear and bright band was observed at a mass ratio of siRNA/M-N (w/w) = 1/10, while the band brightness gradually weakened as the w/w ratio increased, nearly disappearing at w/w = 1/150. These findings indicate complete siRNA absorption by M-N.17 For consistency, subsequent experiments utilized a ratio of w/w = 1/150, ensuring full siRNA absorption by M-N.
 |
Figure 1 (A) Agarose gel electrophoretic analysis for evaluating the siRNA adsorption capacity of M-N nanocarriers. (B) Particle size and zeta potential of nanoparticles. (C) Particle size distribution of M, M-N/R, and HLM-N/R. (D) Zeta potential of M, M-N/R, and HLM-N/R. (E) TEM images of M, M-N/R, and HLM-N/R. |
Characterization of Nanoparticles
The average diameter and zeta potential of nanoparticles were shown in Figure 1B–D.
MSNs was about 120 nm. The average diameter of M-N/R or HLM-N/R was about 170 and 210 nm, respectively. The zeta potential values for M, M-S, M-N/R, LM-N, and HLM-N/R were approximately −15, −25, +34, −41, and −45 mV, respectively. Due to the negative charge of siRNA, the zeta potential of M-N decreased from +37 to +34 after siRNA adsorption. The results show that the synthesis of HLM-N/R was successful.
The size and features of the nanoparticles were characterized by TEM images (Figure 1E). The shape of M was uniform mesoporous spheroids with an average diameter of approximately 100 nm, which was smaller than the average diameter. This discrepancy can be attributed to TEM measuring the size of dried nanoparticles, while Malvern measures the size of the hydrated nanoparticles, causing the surface to form a hydrolyzed layer and amplifying the size.47 HLM-N@DOX/R presents a slightly increased particle size and a layer of film-like material covering the surface.
For M, the BET surface area was 984.2 m2/g, pore volume was 0.91 cm3/g, and BJH pore size distribution was 2.52 nm (Figure 2A–C). Following the addition of the disulfide bond and amino group, the BET surface area, BJH pore size distribution and pore volume of M were reduced slightly. The BET surface area reduced from 984.2 m2/g of M to 1.47 m2/g of HLM-N, with pore volume reduced from 0.91 cm3/g to 0.0014 cm3/g step by step. The result confirms the successful surface modification of M. After DOX loading, the pore size distribution curve of M was a straight line and the pore volume was almost 0 cm3/g, which proves the efficient loading of DOX.
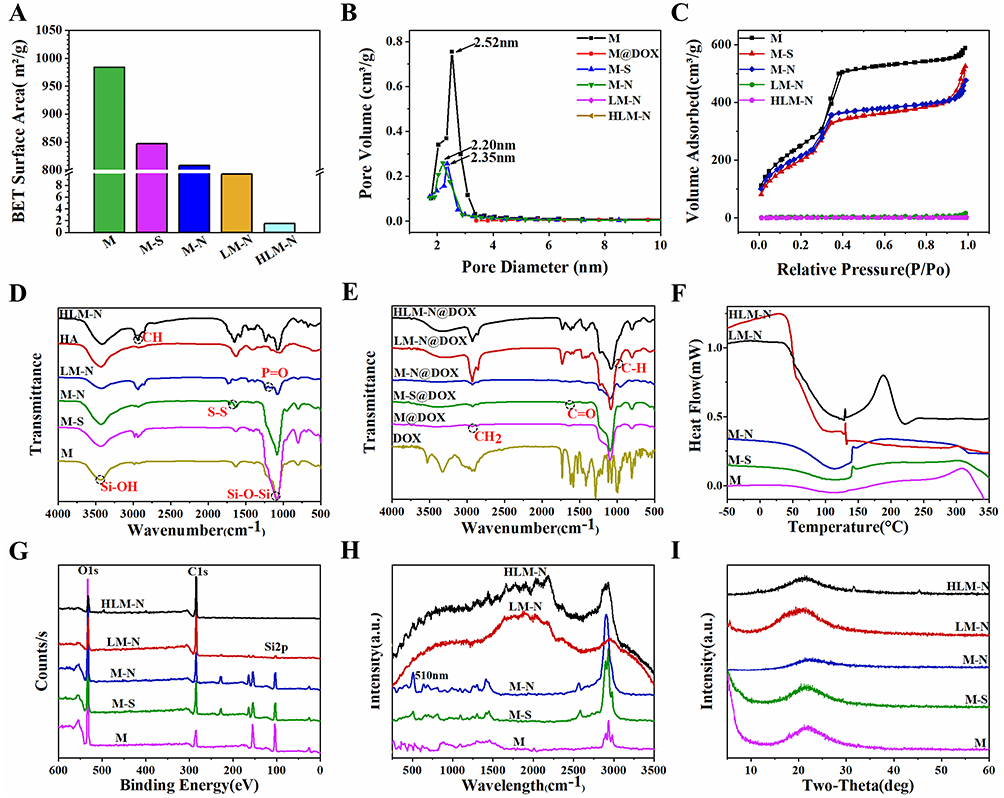 |
Figure 2 M, M-S, M-N, LM-N, and HLM-N BET surface area (A) and BJH pore size distribution (B). (C) The nitrogen adsorption/desorption isotherms of M, M-S, M-N, LM-N, and HLM-N. (D) FT-IR spectra of M, M-S, M-N, LM-N, HA, and HLM-N. (E) FT-IR spectra of DOX, M@DOX, M-S@DOX, M-N@DOX, LM-N@DOX, and HLM-N@DOX. DSC spectra (F), XPS spectra (G), Raman spectra (H), and XRD spectra (I) for M, M-S, M-N, LM-N, and HLM-N conditions. |
The FT-IR spectra of the nanoparticles are presented in Figure 2D. All samples exhibited peaks at 1120 cm−1, corresponding to the Si−O−Si stretching vibration, with the silicon hydroxyl group flexural vibration appearing near 3400 cm−1. In M-N, a peak at around 1710 cm−1 was observed, attributed to the stretching vibration of the disulfide linkage. For LM-N, the P=O expansion band at 1220 cm−1 was widened after liposome coating, and the silicon hydroxyl group characteristic peak at 3400 cm−1 was also weakened to some extent. In HLM-N, the hydroxyl characteristic peak at 3500 cm−1 was enhanced, suggesting successful HA modification. Additionally, the FT-IR spectra of DOX-carrying nanoparticles are shown in Figure 2E. DOX showed a methylene stretching vibration peak at 2940 cm−1, a C=O absorption band at 1710 cm−1, and a C-H vibration peak at 987 cm−1. Following loading DOX, each nanoparticle displayed robust characteristic absorption peaks at 2940 cm−1, 1710 cm−1, and 987 cm−1, confirming the effective loading of DOX by the constructed vector.
The DSC spectra of each sample, depicted in Figure 2F, provide insights into the thermal stability of the sample. M exhibited an exothermic characteristic peak at 110°C, which indicates that M changed to a crystalline state, while HLM-N showed a crystallization characteristic peak at 120°C. The gradual increase in the crystallization peak area from M to HLM-N suggests improved nanoparticle stability with an elevated degree of modification.
The XPS analysis results, presented in Figure 2G, offer valuable information regarding the elemental composition and content on the carriers’ surfaces.48 The Si/C ratios of M, M-S, M-N, LM-N, and HLM-N exhibited a gradual decreasing trend. This result indicates that the silicon element in M originated solely from the silicon dioxide, leading to a reduction in silicon atom proportion and an increase in carbon atom proportion on the carrier surfaces following each modification step from M-S to HLM-N. These findings indicate successful surface modification of M at each stage. The Raman spectra of each sample, shown in Figure 2H, serve the purpose of providing insights into the chemical bonding and structural changes occurring during the modification process. M exhibited characteristic peaks of the hydroxyl group at 1450 cm−1 and the silanol group at 2900 cm−1. In the case of M-N, a Raman displacement at 510 cm−1 was observed, attributed to the Raman stretching vibration peak of the disulfide bond, confirming the successful connection of the disulfide bond. For LM-N, the Raman stretching vibration peak at 2900cm−1 was weakened, indicating that the phospholipid molecule binds to M-N with its polar head to form a stable complex.
Structural changes in the nanomaterials were also analyzed, and the XRD spectra for each sample are shown in Figure 2I. The results indicate that M, M-S, and M-N display a diffraction peak at 22 (2θ), while LM-N showed a diffraction peak at 21 (2θ), implying an indeterminate state for all. Specifically, the intensity of the diffraction peak in HLM-N decreased to 21 (2θ), with two weak diffraction peaks appearing at 32 (2θ) and 45 (2θ), indicating the crystallinity of the carrier deteriorates after HA modification.
In Vitro Release Studies
The UV-vis spectra in (Figure 3A and B) reveal a typical absorption peak at 480 nm for both free DOX and M-N@DOX, confirming successful DOX loading into M without altering its UV characteristic peaks. In Table 1, the results of the LC and EE determination for DOX in each nanoparticle are shown. Due to M’s extensive surface area, its LC reached 298.66 μg/mg, with an EE of 85.17%. The DOX-loaded HLM-N exhibited exceptional loading performance, with an LC of 317.35μg/mg and EE of 92.98%, which proves its efficient DOX loading capability.
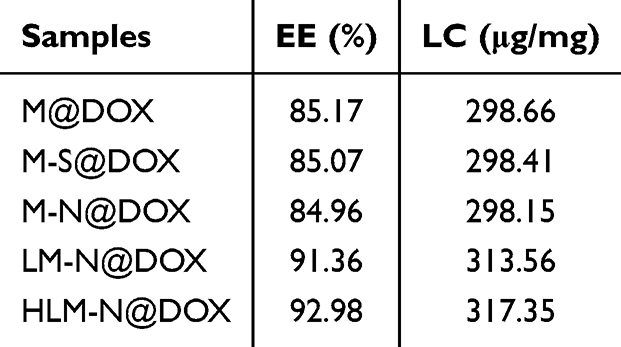 |
Table 1 EE and LC of Different Drug Formulations |
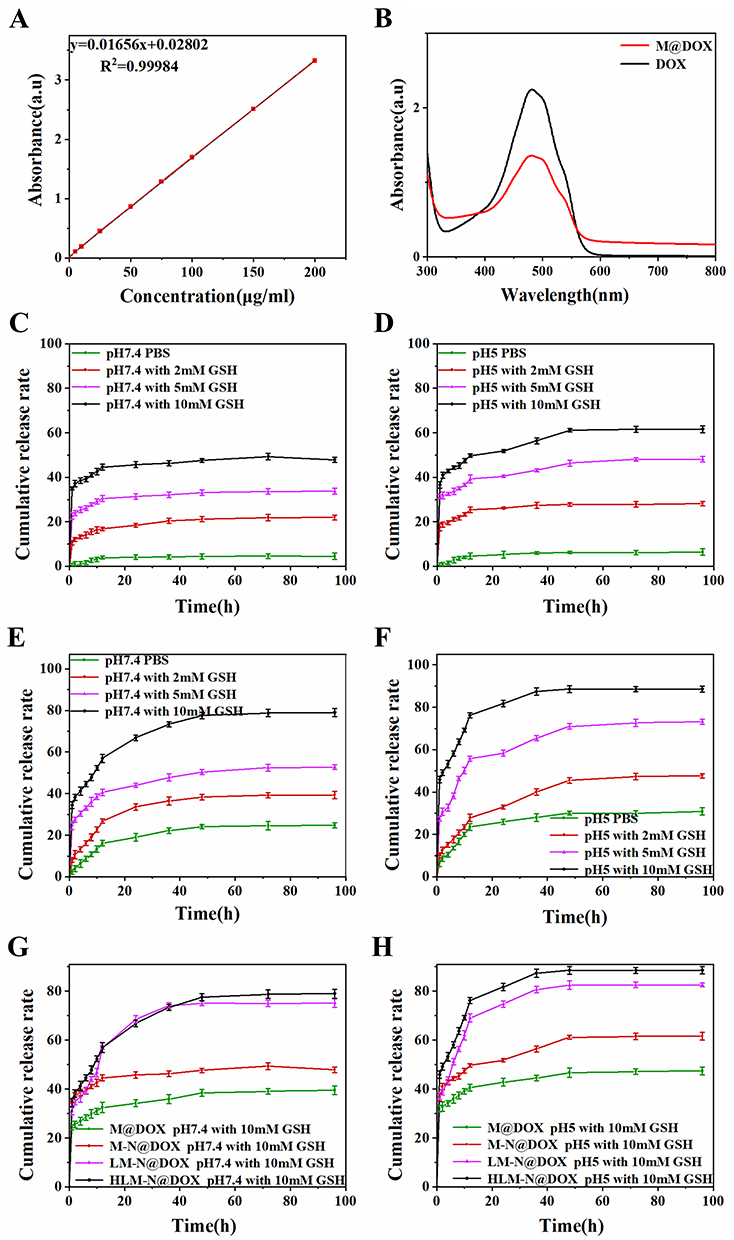 |
Figure 3 (A) Standard curve of DOX in PBS solution. (B) UV-vis absorption spectra of free DOX and M@DOX. DOX release from M-N@DOX under pH 7.4 (C) and pH 5.0 (D) with the addition of 0, 2, 5, or 10 mM GSH. DOX release from HLM-N@DOX under pH 7.4 (E) and pH 5.0 (F) with the addition of 0, 2, 5, or 10 mM GSH. DOX release from M@DOX, M-N@DOX, LM-N@DOX, and HLM-N@DOX under pH 7.4 (G) and pH 5.0 (H) with the addition of 10 mM GSH. |
The release of DOX from the nanoparticles in the simulated tumor microenvironment was monitored using a UV-vis spectrum (Figure 3C and D). M-N/DOX exhibited a GSH-dependent release with a cumulative release rate increasing from 6% to 62% as GSH concentration rose from 0 to 10 mM. This can be attributed to the redox-sensitive disulfide bond breaking in high GSH concentrations,49 leading to effective mesopore blocking, thereby minimizing premature DOX release under normal physiological conditions and reducing potential damage to normal cells.
The impact of the pH levels on the nanoparticle drug release was further investigated (Figure 3E and F). A decline in pH from 7.4 to 5 led to an increase in the release amount of HLM-N@DOX from 78% to 89%. Approximately 76% of DOX was released within 12 h, reaching a cumulative release percentage of 89% within 96 h. Since the concentration of intracellular GSH is more than 1000 times higher than that in the extracellular space,50 these findings suggest that HLM-N@DOX can efficiently trap most DOX before entering cells, releasing the drug in a short burst intracellularly. In addition, the results indicate the dual-responsive drug release properties of HLM-N@DOX, responsive to both redox and pH conditions. Furthermore, the drug release of M@DOX, M-N@DOX, LM-N@DOX, and HLM-N@DOX at pH 5.0 was higher than at pH 7.4 (Figure 3G and H), indicating significant pH-responsive drug release characteristics for all tested nanoparticles.
Hemolysis Study
A comparison of the experimental nanoparticle with the positive control revealed the least hemolysis, signifying maximum hemocompatibility (Figure 4A and B). Of note, the positive control where RBCs were treated with 1% v/v Triton X-100 showed significant hemolysis. Specifically, HLM-N exhibited a hemolysis rate of 4.78% at a concentration of 200 mg/mL, demonstrating a negligible %hemolysis for each nanoparticle, consistently below 5% across varying concentrations. The hemolysis experiment results affirm the significant biosafety and better hemocompatibility of each formulation.
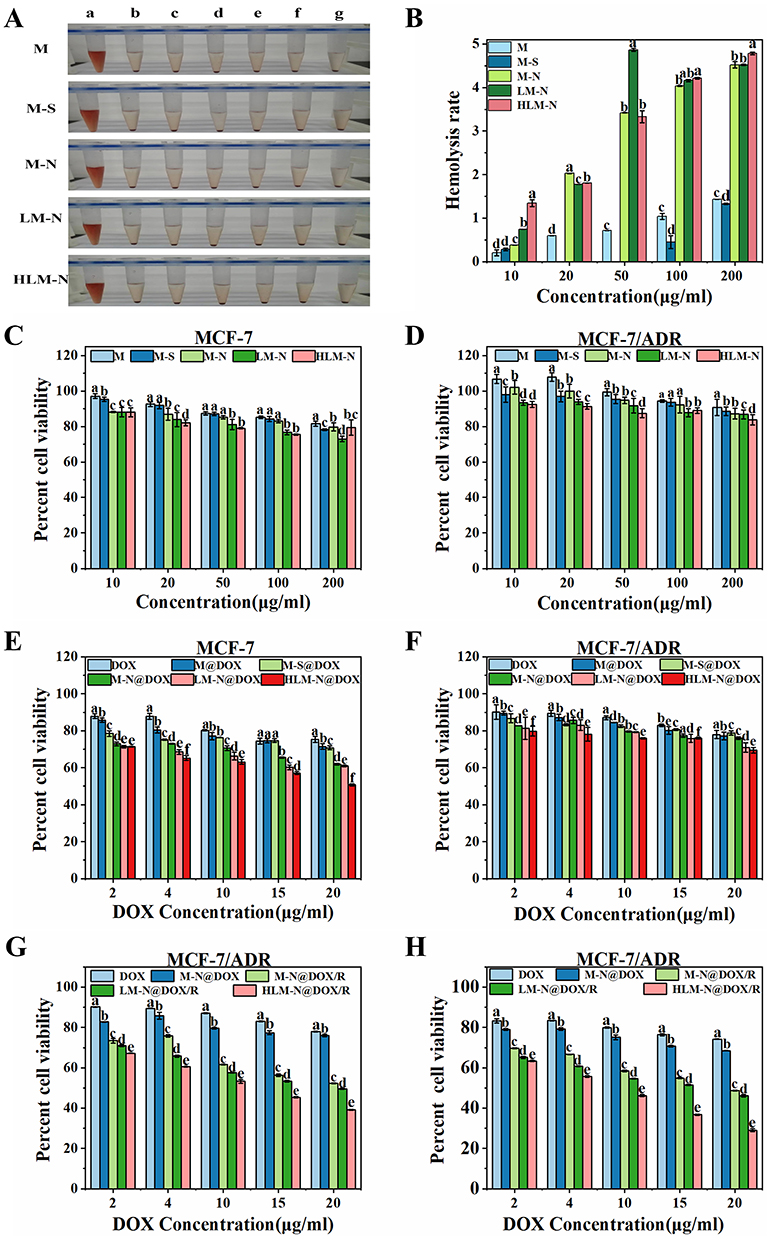 |
Figure 4 (A) Visual view of hemocompatibility of M, M-S, M-N, LM-N, and HLM-N at 200 μg/mL (c), 100 μg/mL (d), 50 μg/mL (e), 20 μg/mL (f), and 10 μg/mL (g). Positive control (a) and negative control (b). (B) %Hemolysis of M, M-S, M-N, LM-N, and HLM-N at different concentrations. Cell viability of MCF-7 (C) and MCF-7/ADR (D) cells treated with M, M-S, M-N, LM-N, and HLM-N at different concentrations for 24 h. Cell viability of MCF-7 (E) and MCF-7/ADR (F) cells treated with DOX, M@DOX, M-S@DOX, M-N@DOX, LM-N@DOX, and HLM-N@DOX at different concentrations for 24 h. Cell viability of MCF-7/ADR cells treated with DOX, M-N@DOX, M-N@DOX/R, LM-N@DOX/R, and HLM-N@DOX/R at different concentrations for 24 h (G) and 48 h (H). |
In Vitro Cytotoxicity Studies
Following 24 h of treatment, these nanoparticles demonstrated good cell biocompatibility, with MCF-7 cell viability near 90% when co-incubated with HLM-N (10 μg/mL) and approximately 80% viability even at a high concentration of 200 μg/mL (Figure 4C and D). Similarly, after co-incubating LO2 cells with various nanocarriers for 24 and 48 h, the cell viability of LO2 cells was almost always above 80% (Figure S1A and B). Subsequently, the cytotoxicity of DOX-loaded carriers was compared with free DOX and empty carriers (Figure 4E and F) in MCF-7 and MCF-7/ADR cells, to determine whether they exhibited the antitumor efficacy as expected. Compared with free DOX, the empty MSNs (M, M-S, M-N, LM-N, and HLM-N) and the DOX-loaded MSNs (M@DOX, M-S@DOX, M-N@DOX, LM-N@DOX, and HLM-N@DOX) showed higher cytotoxicity to MCF-7 and MCF-7/ADR cells, indicating enhanced antitumor efficacy. The cell viability of MCF-7 cells significantly decreased with increasing DOX concentration, reaching over 50% reduction with HLM-N@DOX (20 μg/mL DOX concentration) co-incubation for 24 h (Figure 4E). In contrast, MCF-7/ADR cells exhibited higher viability, with more than 60% survival at the same DOX concentration (Figure 4F).
The enhanced antitumor effect of M-N@DOX was evident upon loading siRNA, resulting in a 34% and 48% decrease in cell viability for MCF-7/ADR cells after 24 h of incubation with M-N@DOX (20 μg/mL DOX concentration) and M-N@DOX/R (20 μg/mL DOX concentration), respectively (Figure 4G). This improvement is attributed to the effective inhibition of P-gp expression by siRNA, thereby enhancing the antitumor effect of M-N@DOX. In the case of the HLM-N@DOX/R (20 μg/mL DOX concentration), after treating MCF-7/ADR cells for 24 and 48 h, the cell viability decreased from 39% to 29% (Figure 4H). The results show significant cytotoxicity of each formulation towards MCF-7 and MCF-7/ADR cells in a time- and concentration-dependent manner.
The above results were quantitatively analyzed in terms of IC50 values by using Graphpad Prism Statistics software, which are listed in Table 2. With an increase in the modification degree, the IC50 value of each formulation for both cell types consistently decreased. However, the IC50 value for MCF-7/ADR was consistently higher than that for MCF-7. Particularly, after loading siRNA onto the MSNs, the IC50 value of MCF-7/ADR cells significantly reduced, indicating that siRNA played a crucial role in reversing multidrug resistance in these cancer cell models.
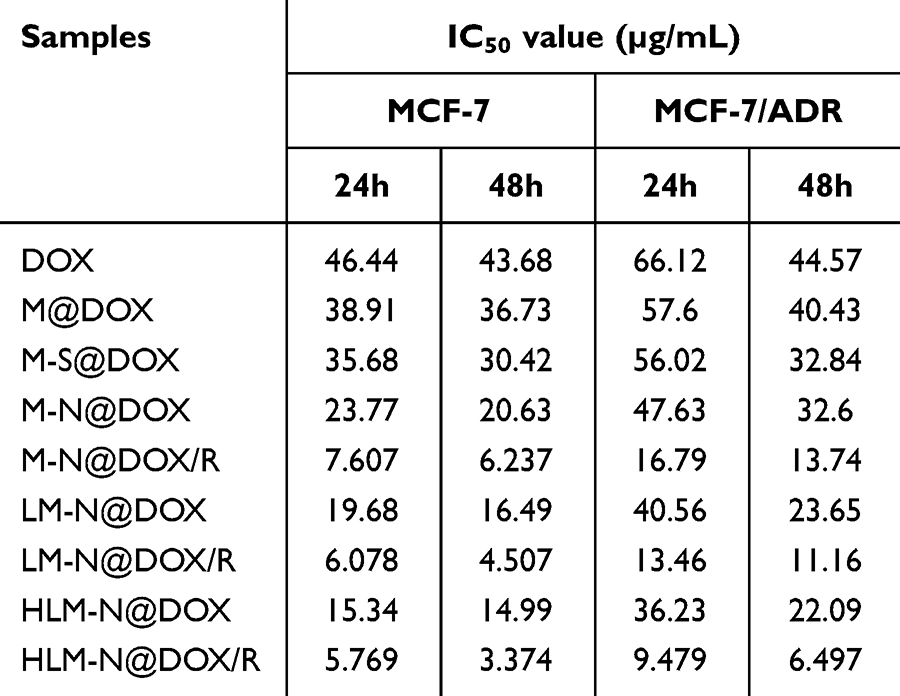 |
Table 2 IC50 Value of MCF-7 and MCF-7/ADR Cells After Treated by Different Drug Formulations |
Cellular Uptake Study
The experiment involved incubating DOX, siRNA, M-N@DOX/R, and HLM-N@DOX/R with MCF-7/ADR cells for 4 h and 24 h, and the fluorescent signal of both FAM-labeled siRNA and DOX was acquired. The fluorescence intensities of siRNA and free DOX reveal that only a residual amount can enter the cell interior, in contrast with a significant fluorescence of siRNA and DOX in the cell interior when they are delivered with the nanoparticles. Particularly, the siRNA fluorescence observed for HLM-N@DOX/R treatment is the strongest regardless of incubation for 4 h or 24 h (Figure 5A and B, respectively) compared with the siRNA alone and M-N@DOX/R conditions. Compared to the position of nucleus, the distribution of the siRNA fluorescence indicates a successful delivery of the siRNA into the cells rather than existed on the external cell surface. The above results can be quantitatively analyzed by ImageJ Statistics software. As can be seen from the Figure 5C, compared with the free DOX group, the fluorescence intensity of the HLM-N@DOX/R was increased by 4.58 times after 24 h co-incubation. For HLM-N@DOX/R, the fluorescence intensity of HLM-N@DOX/R after 24 h co-incubation was 1.57 times higher than that after 4 h co-incubation. These results indicated that our co-delivery system can efficiently deliver the P-gp siRNA synchronously with DOX, and thus the delivered siRNA may be efficiently released and effectively interference the expression of P-gp.
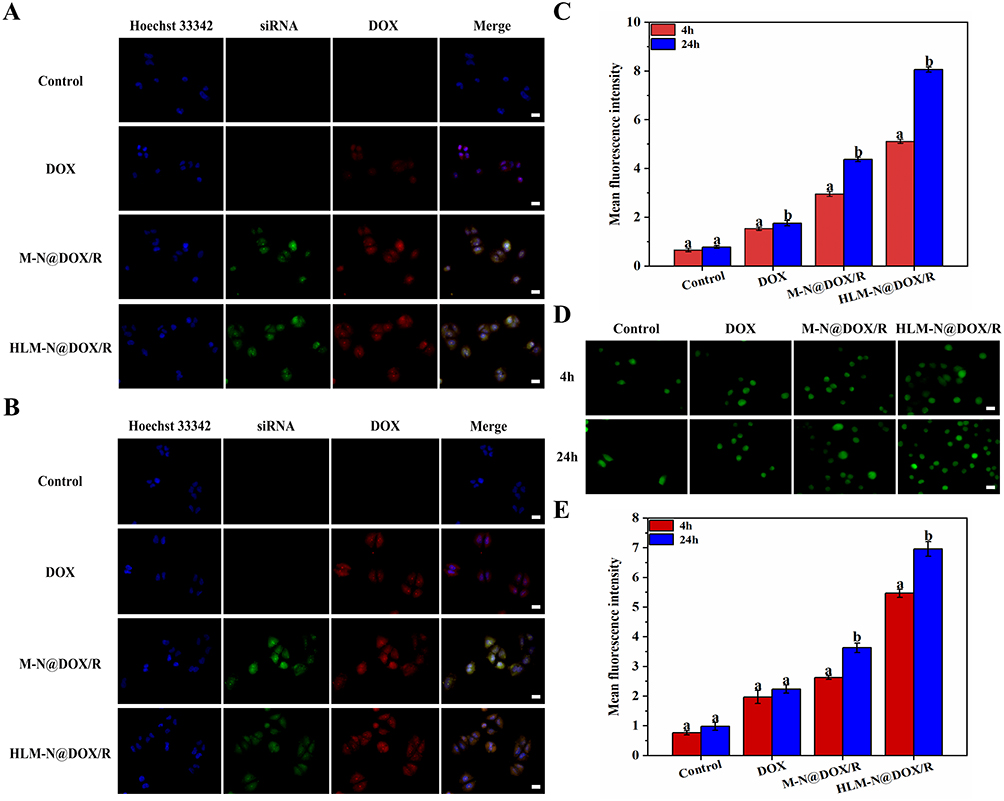 |
Figure 5 Fluorescence microscopy images of MCF-7/ADR cells after co-incubation with DOX, M-N@DOX/R, HLM-N@DOX/R, or without any treatment as a control for 4h (A) and 24 h (B) and mean fluorescence intensity (C). (D) Fluorescence microscopy images of ROS level induced by DOX, M-N@DOX/R, and HLM-N@DOX/R, or without any treatment as a control in MCF-7/ADR cells for 4 h and 24 h and mean fluorescence intensity (E). Scale bar: 20 μm. |
In Vitro Evaluation of ROS Levels
To evaluate the ROS production induced by M-N@DOX/R and HLM-N@DOX/R, the ROS indicator 2’,7’ -dichlorofluorescent yellow diacetate (DCFH-DA) was used to confirm the ROS generation, which could be oxidized to a green fluorescent2’,7’-dichlorofluorescein (DCF) by the intracellular ROS51 (Figure 5D).
The cells treated with M-N@DOX/R and HLM-N@DOX/R exhibited an enhanced ROS signal over the 4 h to 24 h period, while the control group consistently displayed a weak ROS signal. Quantitative analysis of the fluorescent signal revealed that, after 24h of treatment, MCF-7/ADR cells exposed to HLM-N@DOX/R produced a 7.1-fold, 3.1-fold, and 1.9-fold increase in ROS levels compared to the control, free DOX, and M-N@DOX/R groups, respectively (Figure 5E). The findings indicate that HLM-N@DOX/R significantly elevates intracellular ROS levels.
Evaluation of the Endosomal Escape Capability
Nanoparticles are commonly taken up by cells through endosomal compartments and subsequently transported to lysosomes.52,53 Without mechanisms for inducing endosomal escape, these nanoparticles may be confined within these compartments.54 Since endosomes/lysosomes are not the active sites for most therapeutic agents, it is crucial to facilitate release from these compartments to enhance drug efficacy.55 The endolysomes were stained with Lysotracker Red and showed red fluorescence. After 4 h of incubation, a complete overlap of the fluorescent signals of internalized siRNA and endolysomes was observed, indicating that the siRNA molecules had not yet escaped from the endosome (Figure 6A). Following a 16 h incubation, a small amount of the internalized siRNA signal was already observed outside the endolysomes, while after 24 h, only a minor portion of the internalized siRNA signal overlapped with the endosome signal. These findings suggest that HLM-N@DOX/R presents an exceptional endosomal escape capability, with a significant portion of siRNA molecules breaking free from endosomal entrapment after 24 h of treatment. Furthermore, punctate siRNA fluorescence was not found at the cell edge or in the nucleus, revealing that siRNA molecules are exclusively distributed in the cytoplasm where siRNA mediates its functions.56
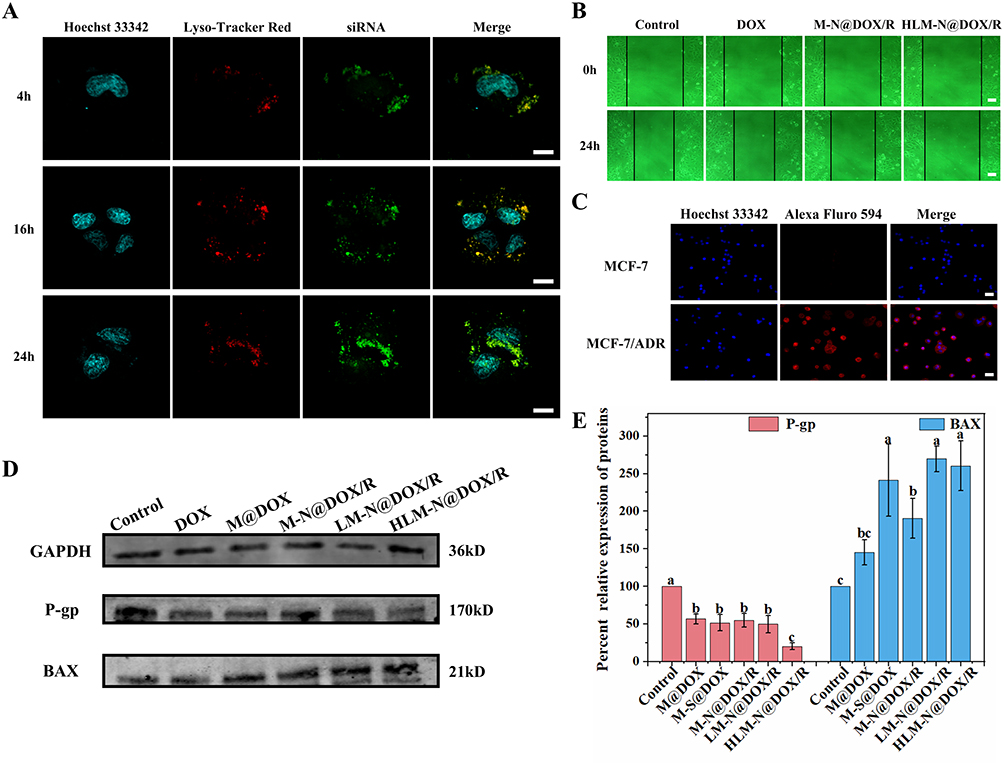 |
Figure 6 (A) Lysosomal escape of MCF-7/ADR cells after 4 h, 16 h, and 24 h treatment with HLM-N@DOX/R. Scale bar: 10 μm. (B) Scratch assay to examine the effect of different drug delivery systems on the migration rate of MCF-7/ADR cells. Scale bar: 20 μm. (C) Cellular immunofluorescence quantification of P-gp expression in MCF-7 and MCF-7/ADR cells. Scale bar: 20 μm. (D) Western blot detection of P and BAX protein expression in MCF-7/ADR cells after treatment with DOX, M@DOX, M-N@DOX/R, LM-N@DOX/R, HLM-N@DOX/R, or without any treatment as a control. (E) Relative expression of P and BAX protein in MCF-7/ADR cells after treatment with DOX, M@DOX, M-N@DOX/R, LM-N@DOX/R, HLM-N@DOX/R, or without any treatment as a control. |
Effects of Drug Delivery Systems on MCF-7/ADR Cell Migration
In the control group, the scratch width significantly narrowed after 24 h, indicating robust MCF-7/ADR cell migration ability (Figure 6B). After incubation with DOX, M-N@DOX/R, and HLM-N@DOX/R for 24 h, cell mobility decreased to 28.89%, 21.36%, and 7.39%, respectively. Interestingly, HLM-N@DOX/R treatment resulted in minimal change in scratch width, indicating significant inhibition of the cell growth.
Immunofluorescent of P-Gp and Impact of HLM-N@DOX/R on P and BAX Protein Expressions
As depicted in Figure 6C, the red fluorescence intensity observed in MCF-7/ADR cells was significantly higher than that of MCF-7 cells, indicating that P-gp overexpression likely contributes significantly to the drug resistance previously observed in MCF-7/ADR cells.
The transfection efficiency of P-gp siRNA was assessed 48 h post-transfection by detecting P-gp expression through Western blot analysis. The expressions of P and BAX protein were quantitatively analyzed by Image Studio software. The results showed a substantial reduction of 80% in P protein expression in MCF-7/ADR cells treated with HLM-N@DOX/R compared to the control group (Figure 6D and E). Accordingly, the same MSNs vehicle induced a notable increase in BAX protein expression compared to the control group. This formulation induced a substantial inhibitory effect on P-gp expression and an upregulation of BAX protein expression, suggesting an enhanced pro-apoptotic effect.
Cell Apoptosis and Cell Cycle Distribution Analysis
MCF-7 and MCF-7/ADR cells incubated with DOX showed apoptosis levels of 19.54% and 14.72% (Figure 7A and Table 3), respectively. Specifically, in the MCF-7 cells, HLM-N@DOX/R vehicle induced a remarkable apoptosis level of 40.82%, while in MCF-7/ADR cells the apoptosis levels reached 30.58%. The dual therapy involving DOX and P-gp siRNA exhibited a pronounced apoptosis effect compared to DOX alone treatment, suggesting the potential of HLM-N@DOX/R to effectively overcome drug efflux pump-mediated drug resistance.57
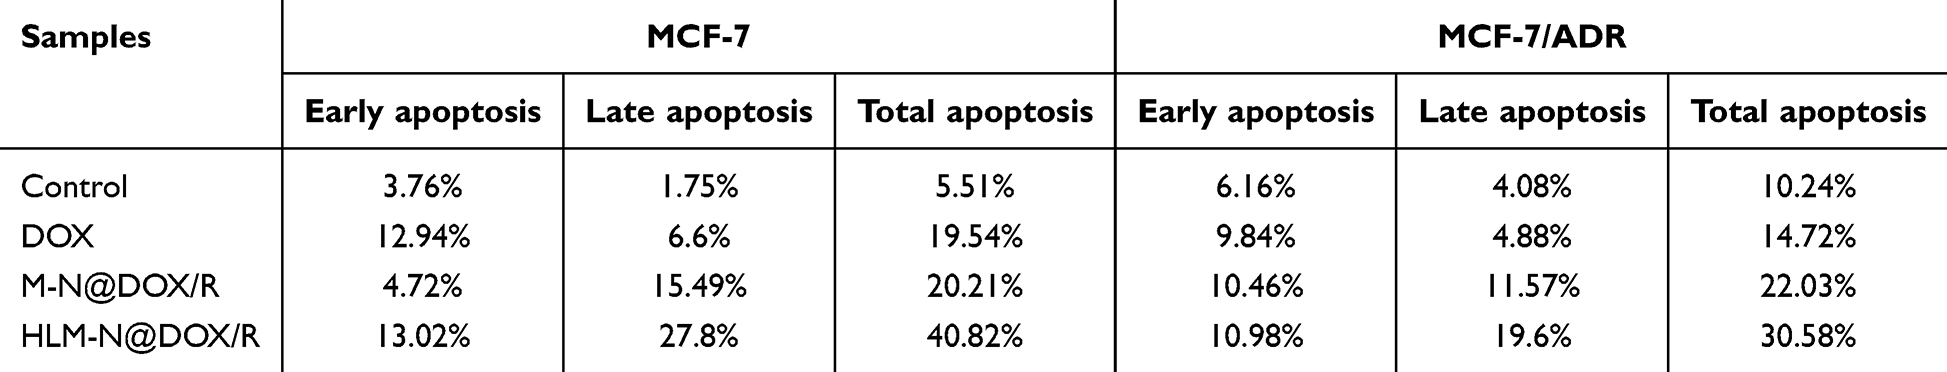 |
Table 3 Cell Apoptosis of MCF-7 and MCF-7/ADR Cells After Treated by Different Drug Formulations |
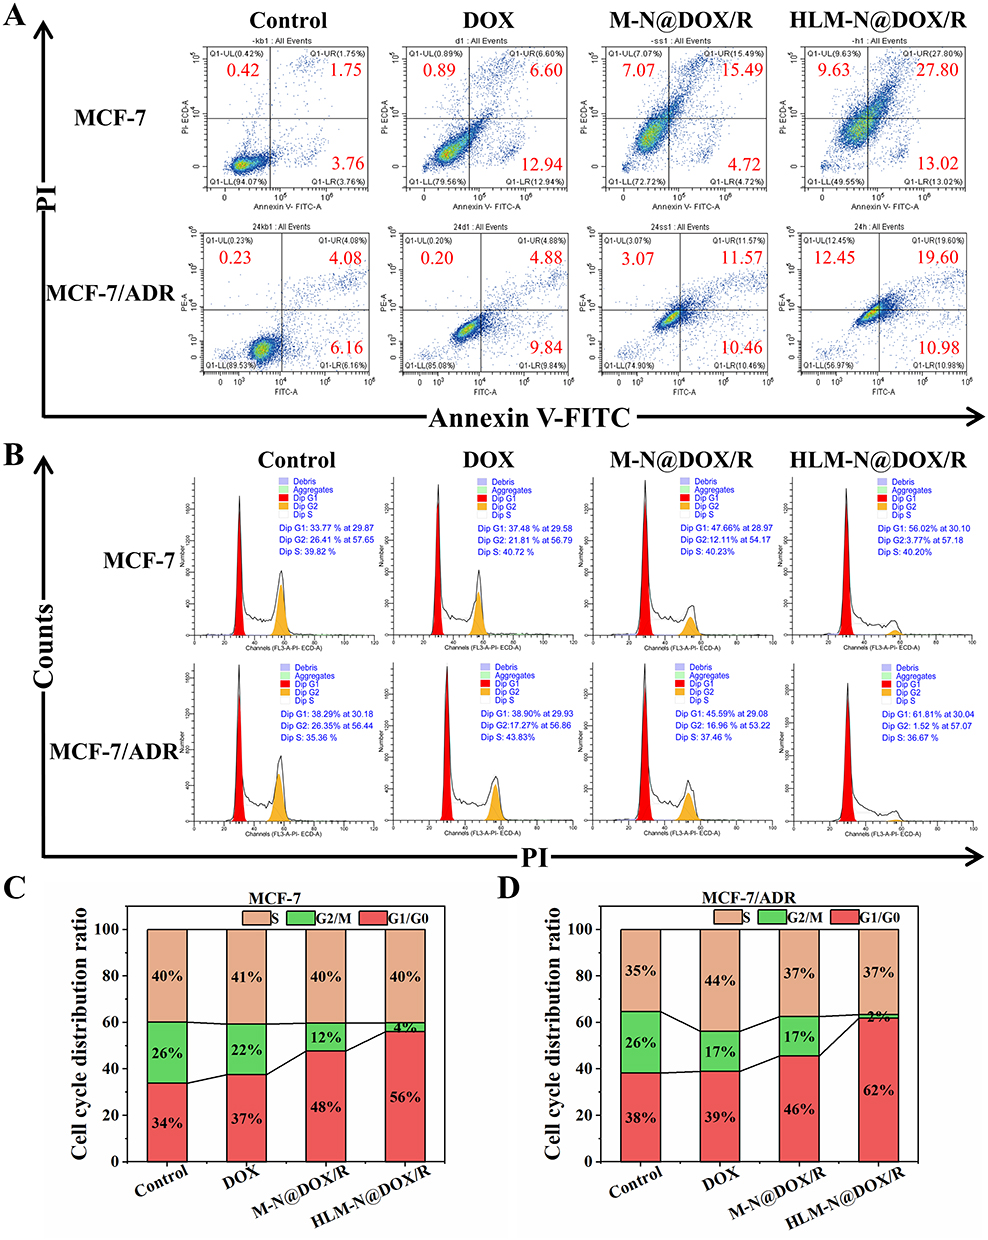 |
Figure 7 (A) MCF-7 and MCF-7/ADR cell apoptosis induced by different drug formulations by using Annexin V-FITC/PI staining. The cells without any treatment as a control group. (B) MCF-7 and MCF-7/ADR cell cycle distribution treated with different drug formulations by using PI staining. The cells without any treatment as a control group. Cell cycle distribution of MCF-7 (C) and MCF-7/ADR (D) cells after treatment with different drug formulations. |
Compared to the control group, the cells treated with DOX showed no obvious difference in the cell cycle distribution, while the M-N@DOX/R vehicle induced more cells arrested in G0/G1 phase (Figure 7B–D). Additionally, HLM-N@DOX/R treatment resulted in an increased number of G0/G1 phase MCF-7/ADR cells, comprising 62% of the cell population compared to 38% in the control group. Simultaneously, there was a decrease in the number of G2/M phase cells, accounting for 2% of the cell population in contrast to 26% in the control group. These findings reveal the unique ability of HLM-N@DOX/R to induce cell cycle arrest at the G0/G1 phase, particularly in MCF-7/ADR cells.
In Vivo Antitumor Effect
A schematic overview of the tumor experiment is presented in Figure 8A, while the tumor growth curve and tumor weight are provided in Figure 8B and C, respectively. Compared with the saline-treated group, all therapeutic groups exhibited significant tumor suppression. Specifically, the HLM-N@DOX/R group showed an average tumor weight of 72.40 ± 16.08 mg, displaying a substantial reduction when compared to the mean tumor weights observed in the DOX group (278 ± 26.38 mg), M-N@DOX/R group (211 ± 29.05 mg), and saline group (320 ± 22.8 mg). Representative images of the tumor sizes for each treatment group are presented in Figure 8D, directly demonstrating the effective tumor inhibition effect of HLM-N@DOX/R. Of note, except for the saline group, no significant decrease in body weight was observed in other treatment groups (Figure 8E), indicating excellent biocompatibility and biosafety of the nanocarrier, as corroborated by previous assessments.
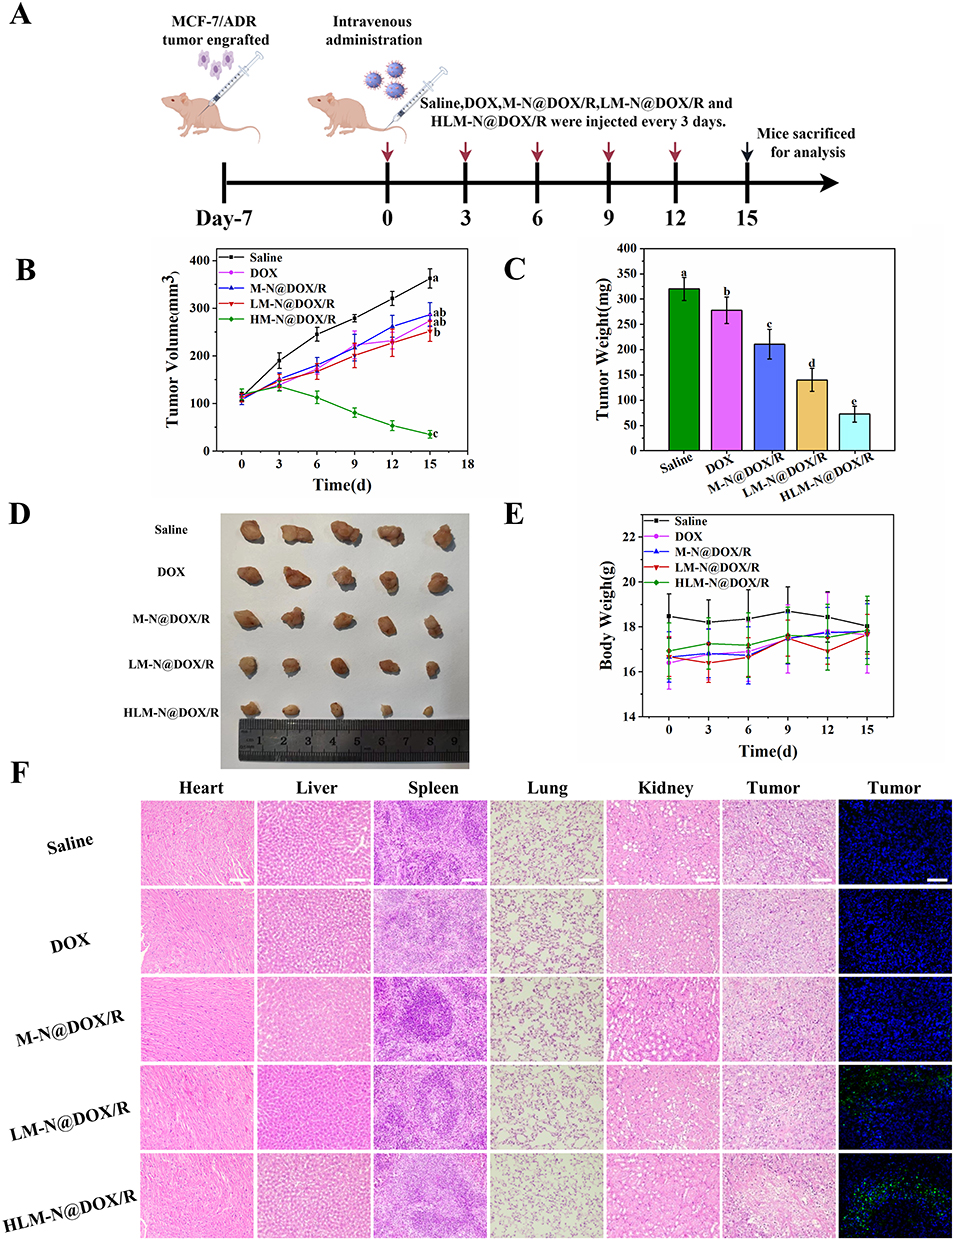 |
Figure 8 (A) Schematic diagram of tumor experiment (By Figdraw). (B) Tumor growth curve after different treatments. (C) Mean tumor weight of each therapy group. (D) Photographs of tumors in each group. (E) Body Weight change curves of different therapy groups. (F) H&E analyses of major organs and tumors and TUNEL analysis of tumors of different treatment groups. Scale bar: 100 μm. Data is presented as mean ± SD (n = 5). |
Histological Analysis
Animals treated with M-N@DOX/R, LM-N@DOX/R, and HLM-N@DOX/R demonstrated similar histological features compared to the normal saline group (Figure 8F). However, the DOX treatment induced a serious state of cardiotoxicity, as observed in the heart sections. These findings indicate that encapsulating DOX in MSNs eliminated the cardiotoxic effects associated with free DOX, showcasing a substantial advantage of the MSNs in mitigating secondary cell toxicity. When analyzing the tumor sections, animals treated with HLM-N@DOX/R exhibited a notable increase in tumor necrosis area compared to the normal saline and other treatment groups. Notable, the HLM-N@DOX/R treatment group did not display significant changes in the morphology of other organs. TUNEL analysis revealed a significant elevation in the number of apoptotic MCF-7/ADR cells when treated with HLM-N@DOX/R compared to the control group. These results emphasize the promising therapeutic potential of HLM-N@DOX/R vehicle, providing an effective and well-tolerated approach to cancer treatment that not only mitigates side effects but also demonstrates excellent biocompatibility and safety.
Conclusion
In this study, we developed the HLM-N nanoparticle as a novel platform for the co-delivery of P-gp siRNA and DOX, aimed at enhancing the therapeutic effect for breast cancer. The functionalized HLM-N@DOX/R possessed dual pH/redox responsive drug release characteristics, good dispersity, biocompatibility, drug-loading capacity and targeting property. The incorporated siRNA inhibits the expression of P-gp in MDR cells, consequently impeding the efflux function of P-gp. This inhibition promotes the accumulation of DOX within tumor cells, effectively reversing the effect of multi-drug resistance. Both in vitro and in vivo experiments robustly validate the significant antitumor efficacy of the HLM-N@DOX/R, which could induce and promote the expression of apoptosis protein BAX and induce rapid apoptosis of both MCF-7 and MCF-7/ADR cells. The findings, while preliminary, indicate that HLM-N holds tremendous potential as an effective and targeted co-delivery system for DOX and P-gp siRNA, offering a promising strategy for overcoming MDR in breast cancer. But there are still many limitations, such as the weak adsorption ability of nanocarriers for siRNA. Further research can be conducted on how it functions at the genetic level and how it breaks through multiple barriers in the body to reach the tumor site and exert its effects.
Data Sharing Statement
All the data of the current study are available from the corresponding authors upon reasonable request.
Consent for Publication
The authors confirm that the work described has not been published before, not under consideration for publication elsewhere. Its publication has been approved by all co-authors.
Funding
This work was supported by the Key R&D and Promotion projects of Henan Province (Scientific and technological research project, No: 232102310015), Foundation for Key Teacher of Colleges and Universities of Henan province (No: 2020GGJS090), Cultivation Programme for Young Backbone Teachers in Henan University of Technology (No: 21420075), and the Natural Science Innovation Fund of Henan University of Technology (2021ZKCJ16).
Disclosure
Yanan Yang and Shuoye Yang are co-first authors for this study. The authors declare no competing interests in this work.
References
1. Wu Y, Zhang Y, Zhang W, Sun CL, Wu JZ, Tang JH. Reversing of multidrug resistance breast cancer by co-delivery of P-gp siRNA and doxorubicin via folic acid-modified core-shell nanomicelles. Colloids Surf B. 2016;138:60–69. doi:10.1016/j.colsurfb.2015.11.041
2. Housman G, Byler S, Heerboth S, et al. Drug Resistance in Cancer: an Overview. Cancers. 2014;6(3):1769–1792. doi:10.3390/cancers6031769
3. Lam JKW, Chow MYT, Zhang Y, Leung SWS. siRNA Versus miRNA as Therapeutics for Gene Silencing. Mol Ther Nucleic Acids. 2015;4(9):e252. doi:10.1038/mtna.2015.23
4. Hong SW, Jiang YY, Kim S, Li CJ, Lee DK. Target Gene Abundance Contributes to the Efficiency of siRNA-Mediated Gene Silencing. Nucleic Acid Therap. 2014;24(3):192–198. doi:10.1089/nat.2013.0466
5. Dana H, Chalbatani GM, Mahmoodzadeh H, et al. Molecular Mechanisms and Biological Functions of siRNA. Int J Biomed Sci. 2017;13(2):48–57. doi:10.59566/IJBS.2017.13048
6. Subhan MA, Attia SA, Torchilin VP. Advances in siRNA delivery strategies for the treatment of MDR cancer. Life Sci. 2021;274:119337. doi:10.1016/j.lfs.2021.119337
7. Pan JY, Mendes LP, Yao MM, et al. Polyamidoamine dendrimers-based nanomedicine for combination therapy with siRNA and chemotherapeutics to overcome multidrug resistance. Eur J Pharm Biopharm. 2019;136:18–28. doi:10.1016/j.ejpb.2019.01.006
8. Mroweh M, Decaens T, Marche PN, Jilkova ZM, Clément F. Modulating the Crosstalk between the Tumor and Its Microenvironment Using RNA Interference: a Treatment Strategy for Hepatocellular Carcinoma. Int J Mol Sci. 2020;22(1):21. doi:10.3390/ijms22010021
9. Zou Y, Sun XH, Wang YB, et al. Single siRNA Nanocapsules for Effective siRNA Brain Delivery and Glioblastoma Treatment. Adv Mater. 2023;35(16):e2300777. doi:10.1002/adma.202300777
10. Buschmann MD, Merzouki A, Lavertu M, Thibault M, Jean M, Darras V. Chitosans for delivery of nucleic acids. Adv Drug Delivery Rev. 2013;65(9):1234–1270. doi:10.1016/j.addr.2013.07.005
11. Zhang J, Li X, Huang L. Non-viral nanocarriers for siRNA delivery in breast cancer. J Control Release. 2014;190:440–450. doi:10.1016/j.jconrel.2014.05.037
12. Meister G, Tuschl T. Mechanisms of gene silencing by double-stranded RNA. Nature. 2004;431(7006):343–349. doi:10.1038/nature02873
13. Nam JP, Nam K, Jung S, Nah JW, Kim SW. Evaluation of dendrimer type bio-reducible polymer as a siRNA delivery carrier for cancer therapy. J Control Release. 2015;209:179–185. doi:10.1016/j.jconrel.2015.04.039
14. Vaishnaw AK, Gollob J, Gamba-Vitalo C, et al. A status report on RNAi therapeutics. Silence. 2010;1(1):14. doi:10.1186/1758-907X-1-14
15. Zhang PH, An KL, Duan XM, Xu H, Li F, Xu F. Recent advances in siRNA delivery for cancer therapy using smart nanocarriers. Drug Discovery Today. 2018;23(4):900–911. doi:10.1016/j.drudis.2018.01.042
16. Peng B, Chen YM, Leong KW. MicroRNA delivery for regenerative medicine. Adv Drug Delivery Rev. 2015;88:108–122. doi:10.1016/j.addr.2015.05.014
17. Abdelrahman M, Eyrolles LD, Alkarib SY, et al. siRNA delivery system based on magnetic nanovectors: characterization and stability evaluation. Eur J Pharm Sci. 2017;106:287–293. doi:10.1016/j.ejps.2017.05.062
18. He HY, Xiao HH, Yan LS, Jing XB, Huang YB. Preparation of oxaliplatin-mesoporous silica nanoparticle conjugates and their application in cancer therapy. J Control Release. 2013;172(1):E36. doi:10.1016/j.jconrel.2013.08.079
19. Dogini DB, Pascoal VDB, Avansini SH, Vieira AS, Pereira TC, Lopes-Cendes I. The new world of RNAs. Gen Mol Biology. 2014;37(1 suppl 1):285–293. doi:10.1590/S1415-47572014000200014
20. Patil VS, Zhou R, Rana TM. Gene regulation by non-coding RNAs. Crit Rev Biochem Mol Biol. 2014;49(1):16–32. doi:10.3109/10409238.2013.844092
21. Xu CF, Wang J. Delivery systems for siRNA drug development in cancer therapy. Asian J Pharm Sci. 2015;10(1):1–12. doi:10.1016/j.ajps.2014.08.011
22. Yi YF, Yu M, Feng C, et al. Transforming “cold” tumors into “hot” ones via tumor-microenvironment-responsive siRNA micelleplexes for enhanced immunotherapy. Matter. 2022;5:2285–2305.
23. Videira M, Arranja A, Rafael D, Gaspar R. Preclinical development of siRNA therapeutics: towards the match between fundamental science and engineered systems. Nanomed Nanotechnol Biol Med. 2014;10(4):689–702. doi:10.1016/j.nano.2013.11.018
24. Zheng Y, Tai WY. Insight into the siRNA transmembrane delivery-From cholesterol conjugating to tagging. Wiley Interdiscip Rev Nanomed Nanobiotechnol. 2020;12(3):e1606. doi:10.1002/wnan.1606
25. Wang J, Lu Z, Wientjes MG, Au JLS. Delivery of siRNA Therapeutics: barriers and Carriers. AAPS J. 2010;12(4):492–503. doi:10.1208/s12248-010-9210-4
26. Saunders NRM, Paolini MS, Fenton OS, et al. A Nanoprimer To Improve the Systemic Delivery of siRNA and mRNA. Nano Lett. 2020;20(6):4264–4269. doi:10.1021/acs.nanolett.0c00752
27. Lin GY, Revia RA, Zhang MQ. Inorganic Nanomaterial-Mediated Gene Therapy in Combination with Other Antitumor Treatment Modalities. Adv Funct Mater. 2021;31(5):2007096. doi:10.1002/adfm.202007096
28. Malmsten M. Inorganic nanomaterials as delivery systems for proteins, peptides, DNA, and siRNA. Curr Opin Colloid Interface Sci. 2013;18(5):468–480. doi:10.1016/j.cocis.2013.06.002
29. Watermann A, Brieger J. Mesoporous Silica Nanoparticles as Drug Delivery Vehicles in Cancer. Nanomaterials. 2017;7(7):189. doi:10.3390/nano7070189
30. Rizzi F, Castaldo R, Latronico T, et al. High Surface Area Mesoporous Silica Nanoparticles with Tunable Size in the Sub-Micrometer Regime: insights on the Size and Porosity Control Mechanisms. Molecules. 2021;26:4247. doi:10.3390/molecules26144247
31. He YJ, Li J, Long MQ, Liang SQ, Xu H. Tuning pore size of mesoporous silica nanoparticles simply by varying reaction parameters. J Non-Crystalline Solids. 2017;457:9–12. doi:10.1016/j.jnoncrysol.2016.11.023
32. Lu J, Liong M, Li ZX, Zink JI, Tamanoi F. Biocompatibility, Biodistribution, and Drug-Delivery Efficiency of Mesoporous Silica Nanoparticles for Cancer Therapy in Animals. Small. 2010;6(16):1794–1805. doi:10.1002/smll.201000538
33. Pan QS, Chen TT, Nie CP, et al. In Situ Synthesis of Ultrathin ZIF-8 Film-Coated MSNs for Codelivering Bcl 2 siRNA and Doxorubicin to Enhance Chemotherapeutic Efficacy in Drug-Resistant Cancer Cells. ACS Appl Mater Interfaces. 2018;10(39):33070–33077. doi:10.1021/acsami.8b13393
34. Prabhakar N, Zhang JX, Desai D, et al. Stimuli-responsive hybrid nanocarriers developed by controllable integration of hyperbranched PEI with mesoporous silica nanoparticles for sustained intracellular siRNA delivery. Int J Nanomed. 2016;11:6591–6608. doi:10.2147/IJN.S120611
35. Hom C, Lu J, Liong M, et al. Mesoporous Silica Nanoparticles Facilitate Delivery of siRNA to Shutdown Signaling Pathways in Mammalian Cells. Small. 2010;6(11):1185–1190. doi:10.1002/smll.200901966
36. Pinese C, Lin JQ, Milbreta U, et al. Sustained delivery of siRNA/mesoporous silica nanoparticle complexes from nanofiber scaffolds for long-term gene silencing. Acta Biomater. 2018;76:164–177. doi:10.1016/j.actbio.2018.05.054
37. Niemelä E, Desai D, Nkizinkiko Y, Eriksson JE, Rosenholm JM. Sugar-decorated mesoporous silica nanoparticles as delivery vehicles for the poorly soluble drug celastrol enables targeted induction of apoptosis in cancer cells. Eur J Pharm Biopharm. 2015;96:11–21. doi:10.1016/j.ejpb.2015.07.009
38. Slita A, Egorova A, Casals E, Kiselev A, Rosenholm JM. Characterization of modified mesoporous silica nanoparticles as vectors for siRNA delivery. Asian J Pharm Sci. 2018;13(6):592–599. doi:10.1016/j.ajps.2018.01.006
39. Sen Karaman D, Desai D, Senthilkumar R, et al. Shape engineering vs organic modification of inorganic nanoparticles as a tool for enhancing cellular internalization. Nanoscale Res Lett. 2012;7(1):358. doi:10.1186/1556-276X-7-358
40. Kawasaki ES, Player A. Nanotechnology, nanomedicine, and the development of new, effective therapies for cancer. Nanomedicine. 2005;1(2):101–109. doi:10.1016/j.nano.2005.03.002
41. Ashley CE, Carnes EC, Phillips GK, et al. The targeted delivery of multicomponent cargos to cancer cells by nanoporous particle-supported lipid bilayers. Nat Mater. 2011;10(5):389–397. doi:10.1038/nmat2992
42. Pan J, Wan D, Gong JL. PEGylated liposome coated QDs/mesoporous silica core-shell nanoparticles for molecular imaging. Chem Commun. 2011;47:3442–3444. doi:10.1039/c0cc05520d
43. Kapoor M, Lee SL, Tyner KM. Liposomal Drug Product Development and Quality: current US Experience and Perspective. AAPS J. 2017;19(3):632–641. doi:10.1208/s12248-017-0049-9
44. Du X, Yin SP, Wang Y, Gu XC, Wang GJ, Li J. Hyaluronic acid-functionalized half-generation of sectorial dendrimers for anticancer drug delivery and enhanced biocompatibility. Carbohydr Polym. 2018;202:513–522. doi:10.1016/j.carbpol.2018.09.015
45. Luo ZJ, Dai Y, Gao HL. Development and application of hyaluronic acid in tumor targeting drug delivery. Acta Pharm Sin B. 2019;9(6):1099–1112. doi:10.1016/j.apsb.2019.06.004
46. Zorov DB, Juhaszova M, Sollott SJ. Mitochondrial reactive oxygen species (ROS) and ROS-induced ROS release. Physiol Rev. 2014;94(3):909–950. doi:10.1152/physrev.00026.2013
47. Zheng GR, Shen YL, Zhao RR, et al. Dual-Targeting Multifunctional Mesoporous Silica Nanocarrier for Codelivery of siRNA and Ursolic Acid to Folate Receptor Overexpressing Cancer Cells. J Agri Food Chem. 2017;65:6904–6911. doi:10.1021/acs.jafc.7b03047
48. Zhao QF, Wang C, Liu Y, et al. PEGylated mesoporous silica as a redox-responsive drug delivery system for loading thiol-containing drugs. Int J Pharm. 2014;477(1–2):613–622. doi:10.1016/j.ijpharm.2014.10.056
49. Xia X, Shi J, Deng Q, Xu N, Huang F, Xiang X. Biodegradable and self-fluorescent ditelluride-bridged mesoporous organosilica/polyethylene glycol-curcumin nanocomposite for dual-responsive drug delivery and enhanced therapy efficiency. Mater Today Chem. 2022, 23, 100660.
50. Chakravarthi S, Jessop CE, Bulleid NJ. The role of glutathione in disulphide bond formation and endoplasmic-reticulum-generated oxidative stress. EMBO Rep. 2006;7:271–275. doi:10.1038/sj.embor.7400645
51. Sun K, Gao ZG, Zhang Y, et al. Enhanced highly toxic reactive oxygen species levels from iron oxide core-shell mesoporous silica nanocarrier-mediated Fenton reactions for cancer therapy. J Mater Chem B. 2018;6(37):5876–5887. doi:10.1039/C8TB01731J
52. Such GK, Yan Y, Johnston APR, Gunawan ST, Caruso F. Interfacing Materials Science and Biology for Drug Carrier Design. Adv Mater. 2015;27(14):2278–2297. doi:10.1002/adma.201405084
53. Li WQ, Sun LP, Xia YQ, et al. Preoccupation of Empty Carriers Decreases Endo-/Lysosome Escape and Reduces the Protein Delivery Efficiency of Mesoporous Silica Nanoparticles. ACS Appl Mater Interfaces. 2018;10(6):5340–5347. doi:10.1021/acsami.7b18577
54. Cupic KI, Rennick JJ, Johnston APR, Such GK. Controlling endosomal escape using nanoparticle composition: current progress and future perspectives. Nanomedicine. 2019;14(2):215–223. doi:10.2217/nnm-2018-0326
55. Haisma H. Endosomal escape pathways for delivery of biologicals. Human Gene Ther. 2011;22:A14–A.
56. Li X, Chen YJ, Wang MQ, Ma YJ, Xia WL, Gu HC. A mesoporous silica nanoparticle - PEI - Fusogenic peptide system for siRNA delivery in cancer therapy. Biomaterials. 2013;34(4):1391–1401. doi:10.1016/j.biomaterials.2012.10.072
57. Cheng D, Cao N, Chen JF, Yu XS, Shuai XT. Multifunctional nanocarrier mediated co-delivery of doxorubicin and siRNA for synergistic enhancement of glioma apoptosis in rat. Biomaterials. 2012;33(4):1170–1179. doi:10.1016/j.biomaterials.2011.10.057
 © 2024 The Author(s). This work is published and licensed by Dove Medical Press Limited. The
full terms of this license are available at https://www.dovepress.com/terms.php
and incorporate the Creative Commons Attribution
- Non Commercial (unported, 3.0) License.
By accessing the work you hereby accept the Terms. Non-commercial uses of the work are permitted
without any further permission from Dove Medical Press Limited, provided the work is properly
attributed. For permission for commercial use of this work, please see paragraphs 4.2 and 5 of our Terms.
© 2024 The Author(s). This work is published and licensed by Dove Medical Press Limited. The
full terms of this license are available at https://www.dovepress.com/terms.php
and incorporate the Creative Commons Attribution
- Non Commercial (unported, 3.0) License.
By accessing the work you hereby accept the Terms. Non-commercial uses of the work are permitted
without any further permission from Dove Medical Press Limited, provided the work is properly
attributed. For permission for commercial use of this work, please see paragraphs 4.2 and 5 of our Terms.