")
Back to Journals » Drug Design, Development and Therapy » Volume 19
Hyodeoxycholic Acid Ameliorates Metabolic Syndrome Through Pathways of Primary Bile Acid Synthesis and Fatty Acid Degradation: Insights From a Rat Model
Authors Chen M , Huang K, Luo W, Zhang F, Gan H , Yang Z
Received 8 January 2025
Accepted for publication 25 April 2025
Published 1 May 2025 Volume 2025:19 Pages 3611—3630
DOI https://doi.org/10.2147/DDDT.S514189
Checked for plagiarism Yes
Review by Single anonymous peer review
Peer reviewer comments 3
Editor who approved publication: Dr Tuo Deng
Meimei Chen,1,2,* Kaiyue Huang,1,2,* Wenqian Luo,1,2 Fei Zhang,1,2 Huijuan Gan,1,2 Zhaoyang Yang1– 3
1College of Traditional Chinese Medicine, Fujian University of Traditional Chinese Medicine, Fuzhou, Fujian, 350122, People’s Republic of China; 2Fujian Key Laboratory of TCM Health Status Identification, Fujian University of Traditional Chinese Medicine, Fuzhou, Fujian, 350122, People’s Republic of China; 3Key Laboratory of Orthopedics & Traumatology of Traditional Chinese Medicine and Rehabilitation Ministry of Education, Fujian University of Traditional Chinese Medicine, Fuzhou, Fujian, 350122, People’s Republic of China
*These authors contributed equally to this work
Correspondence: Huijuan Gan; Zhaoyang Yang, Email [email protected]; [email protected]
Background: Bile acids (BAs) play a crucial role in metabolic regulation, but their specific functions in metabolic syndrome (MS) remain unclear. Hyodeoxycholic acid (HDCA) has shown potential effects in non-alcoholic fatty liver disease (NAFLD), yet its role in MS is unexplored.
Aim: This study aims to assess whether HDCA is a characteristic BA of MS and to investigate its intervention effects and potential mechanisms.
Methods: We employed 16S rDNA sequencing and UHPLC-MS/MS to investigate the dynamics of the gut microbiota and BA profiles in rats and conducted a correlation study between indices, identifying HDCA as the potential characteristic BA. We then examined its interventional effects in MS rats comparing efficacy with the positive drug of MS (metformin). Subsequently, liver RNA sequencing (RNA-seq), gene set enrichment analysis (GSEA), and Wes Automated Simple Western assays were employed to investigate mechanisms of HDCA ameliorating MS.
Results: HDCA was identified as a characteristic BA for MS, exhibiting a significant positive correlation with beneficial gut bacteria and a negative correlation with harmful bacteria, and highly inversely related to various abnormal MS indexes. HDCA treatment led to significant improvements in metabolic abnormalities in MS rats, with a central role in altering serum BA profiles and profoundly modifying the gut microbiome composition. The results of RNA-seq and GSEA indicated that HDCA influenced the expression of genes related to primary bile acid synthesis and fatty acid degradation (p< 0.05). Wes assays validated that FXR, CYP7A1, CYP7B1, PPARα, CPT1, CPT2, FABP1, HMGCS1 and HMGCS2 proteins in MS rats exhibited significant changes after HDCA treatment (p< 0.05), and this was more effective than metformin treatment.
Conclusion: These study is the first to highlight HDCA as a therapeutic candidate for MS and provides new insights into the BA-MS axis, though further validation is needed.
Keywords: metabolic syndrome, bile acid, gut microbiota, hyodeoxycholic acid, animal model, obesity
Graphical Abstract:

Introduction
MS is a cluster of interrelated metabolic disorders, including central obesity, dyslipidemia, and insulin resistance, which collectively increase the risk of cardiovascular diseases and type 2 diabetes.1,2 In recent decades, the global prevalence of MS has risen sharply due to economic development and lifestyle changes, posing a significant public health burden.3 Despite the prevailing consensus that central obesity and insulin resistance are the primary pathogenic drivers of MS, the intricacies of its etiology remain obscure. Despite the emergence of targeted therapies for individual components of MS (eg, GLP-1 analogs for hyperglycemia), current clinical management remains largely symptom-driven, with limited interventions addressing the disease as a multifactorial entity. Therefore, proactively unraveling the pathogenesis and prevention strategies of MS is imperative for mitigating its incidence and halting its progression.
The gut microbiome, the body’s most crucial microecosystem, plays an indispensable role in nutrient metabolism, inflammation regulation, and immune modulation.4 Recent studies have revealed that high-fat diets reduced bifidobacteria abundance in the gut, causing an increase in plasma lipopolysaccharide (LPS) levels. This triggered tissue inflammation, obesity, fasting hyperglycemia, and hyperinsulinemia, underscoring the strong connection between gut microbiome dysbiosis and metabolic disorders.5,6 The impact of the gut microbiome on the body is primarily exerted through its metabolites. Among these, BAs are a critical class of functional metabolites whose synthesis and secretion are intimately linked with the microbiome.7 An imbalance in the gut microbiome can disrupt bile acid metabolism, potentially leading to a variety of diseases.8,9 Beyond facilitating the digestion and absorption of lipids, cholesterol, fat-soluble vitamins, and sterols, BAs also serve as vital endogenous signaling molecules. By interacting with bile acid receptors, such as the farnesoid X receptor (FXR) and the G protein-coupled bile acid receptor (TGR5), they modulate host energy metabolism, insulin sensitivity, and inflammatory responses.10,11 Research indicated that impaired bile acid homeostasis disrupted energy metabolism, reduces insulin sensitivity, and is strongly associated with metabolic diseases, including obesity, type 2 diabetes, and nonalcoholic fatty liver disease (NAFLD).12,13
Among various BAs, HDCA has emerged as a promising therapeutic candidate. Clinical studies have revealed that HDCA levels are significantly reduced in individuals with obesity, diabetes, and NAFLD.14 Research has shown that HDCA can improve glucose homeostasis by regulating the bile acid receptors TGR5 and FXR through a GLP-1-dependent mechanism.15 Animal studies have confirmed that HDCA supplementation attenuates NAFLD in mice by inhibiting RAN-mediated PPARα nucleus-cytoplasm shuttling.16 Furthermore, HDCA has been reported to exhibit hypolipidemic properties and to inhibit atherosclerotic lesion formation through mechanisms such as reducing intestinal cholesterol absorption and enhancing cholesterol efflux.17 HDCA supplementation has also been shown to effectively prevent lithogenic diet (LD)-induced cholesterol gallstone formation by promoting BA synthesis in the liver, inhibiting the nuclear farnesoid X receptor (FXR) activation, and modulating the gut microbiota.18 These findings suggest that HDCA may have beneficial effects on metabolic disorders, making it a promising candidate for further investigation in the context of MS. However, the role of HDCA in MS remains unexplored. Here, we hypothesized that HDCA could serve as a signature BA in MS and exert protective effects.
Given the unclear relationship between gut microbiome changes and bile acid profiles in MS, this study initially utilized 16S rDNA sequencing and ultra-high-performance liquid chromatography-tandem mass spectrometry (UHPLC-MS/MS) to analyze changes in the gut microbiome structure and bile acid spectrum, conducting a correlation analysis to identify HDCA as a potential biomarker for MS. Subsequently, by observing the intervention effects of HDCA on MS rats and its potential mechanisms, this research aimed to provide new perspectives and therapeutic strategies for the prevention and treatment of MS.
Materials and Methods
Experimental Animals
All animal procedures in this study strictly followed the Guidelines on Humane Treatment of Laboratory Animals (Ministry of Science and Technology of China, 2006). The experimental protocol was approved by the Ethics Committee of Fujian University of Traditional Chinese Medicine (Ethical Resolution No. FJTC IACUC 2022238) and conducted in compliance with institutional ethical standards. Animal use was authorized under License No. SCXK (Shanghai) 2022–0004, with ethics approval obtained on December 9, 2022.
Sixty SPF-grade Wistar male rats, aged six weeks and weighing approximately 180±20 g, were bought from the Shanghai SLAC Laboratory Animal Co. Ltd. These rats were housed in the SPF-grade barrier system of the Fujian University of Traditional Chinese Medicine’s Laboratory Animal Research Center, with five per cage, under controlled conditions of 20–22°C room temperature and 50% relative humidity, following a natural light-dark cycle. They were fed standard chow and given ad libitum access to water. After a week of acclimatization, the rats were divided into control group and MS model group. Ten rats in the normal control group were fed with normal diet, and fifty rats in the MS model group were fed with high-sugar-fat diet (36.2% of National Standard rodent breeding feed, 18% fructose, 22% lard, 12% casein, 2% cholesterol, 5% salt and 0.5% bile salt, 1.8% vitamin and mineral mixture and 2.5% maltodextrin) combined with one-time intraperitoneal injection of low dose of streptozotocin (25 mg/kg), the molding time lasted 15 weeks. The metabolic disorder of the animals was accessed by measuring the diagnostic criteria for Metabolic Syndrome, as issued by the International Diabetes Federation in 2005, necessitating the presence of central obesity along with at least two of the following abnormalities: elevated triglycerides, reduced high-density lipoprotein cholesterol (HDL-C), heightened fasting blood glucose (FBG), or increased blood pressure.19 All specimens were abstained from water for 12 h before collection. The rats in control group and model group were collected by tail vein at the weekend of 0, 5, 10, and 15, respectively. One-milliliter plasma was collected in EDTA tube, centrifuged at 4 °C and 3500 r/min (centrifuge radius 6.0 cm) for 10 min, the supernatant was subpacked and frozen at −80 °C. Under sterile conditions, cecal contents of rats were collected for 15 weeks and frozen at −80 °C. Serum samples and cecum contents from eight randomly selected rats in both the normal and MS groups were collected for bile acid metabolomics analysis and 16S rDNA high-throughput sequencing.
Subsequently, rats in MS model group were randomized into 3 groups (seven rats in each group): MS model group, HDCA-treated group and metformin-treated group, and seven randomized rats in normal group were used. Rats in HDCA-treated group were administrated with HDCA (with a purity more than 98%) by intragastric at a dose of 75mg/kg/d according to the previous study,20 and rats in metformin group were administrated with metformin by intragastric at a dose of 100 mg/kg/d for four weeks, respectively.21 The dose of metformin that we employed in the rat experiments was within the human therapeutic range, according to the Guidance of FDA-CDER and Chinese pharmacopoeia.1,6 Both the normal control group and the MS model group received an isodose of the solvent as a control measure. After four weeks’ intervention, all rats were sacrificed by intraperitoneal injection of 20% ullatan solution, and blood samples were isolated by centrifugation at 2500 rpm at 4 °C. And, serum samples were separated into 200 μL sub-aliquots and stored at −80 °C until analysis. Liver tissues and ileum tissues of rats were appropriately divided into two parts, one part was used for fixed dehydration embedding, and the other was placed in the refrigerator at −80 °C for use. About 3–4 pieces of rat ileal contents were taken and stored in the refrigerator at −80 °C. This process was carried out in strict accordance with aseptic operation, and sterile utensils such as sterile scalpel and sterile centrifuge tube were used to avoid specimen contamination. The general flow of the experiment was shown in Figure 1.
 |
Figure 1 General flow of the experiment. |
Bile Acid Analysis
Sixty-nine bile acid standards were accurately measured using an ultraperformance liquid chromatography-tandem mass spectrometry (UPLC/MS-MS) apparatus (Agilent, Thermo Fisher Scientific, USA), equipped with an electrospray ionization (ESI) source.22 Taurochenodeoxycholic acid labeled with four deuterium atoms (TCDCA-d4) served as the internal benchmark. Chromatographic separation was achieved on an Acquity BEH C18 column (150 mm × 2.1 mm internal diameter, with 1.7 μm particle size, Waters Corporation), maintained at 45°C, employing a flow rate of 0.4 mL/min. The mobile phase consisted of a binary solvent system, combining 0.1% ammonium acetate in water with acetonitrile, utilizing gradient elution. Mass spectrometric analysis was conducted in the negative ion mode, while an Orbitrap Exploris 120 mass spectrometer (Thermo Fisher Scientific) was utilized for the development of the assay, operating in Parallel Reaction Monitoring (PRM) mode.
Multivariate Analysis
Principal component analysis (PCA) and orthogonal projections to latent structures-discriminant analysis (OPLS-DA) were performed to determine taxonomic changes between groups. Additionally, LOO cross-validation and a 200 permutation test were applied to evaluate the robustness, predictive ability and reliability of the derived OPLS-DA model. The corresponding evaluation parameters of the models were R2Y(cum) and Q2Y (cum). In addition, VIP (variable importance) scores were adopted to rank the ability of different taxa to discriminate between different groups.23 Bile acid meeting this condition with VIP >1.0 and p-value <0.05 was considered to be different in two groups. The results of the differential metabolite screening were visualized as a volcano plot, which was generated in R version 3.4.4.
Histological Analysis
Liver and ileum tissues were each ensconced in a 4% formaldehyde solution for fixation, followed by a detailed sequence of dehydration, embedding, sectioning, and Hematoxylin-Eosin (H&E) staining. Microscopic examination of the organ tissue slices was subsequently performed under 100x and 400x magnifications.
Intestinal Flora 16S rDNA Sequencing
Following the instructions detailed in the CTAB fecal DNA extraction kit, intestinal microbiota DNA was extracted from 100 mg of rat feces. The DNA was quantified using a UV spectrophotometer and its quality assessed via 2% agarose gel electrophoresis. Polymerase chain reaction (PCR) amplification of the bacterial 16sRNA gene V3 ~ V4 regions was performed using the forward primer 341F (5’-CCTACGGGNGGCWGCAG-3’) and the reverse primer 805R (5’-GACTACHVGGGTATCTAATCC-3’). The amplicon pools were subsequently prepared for sequencing, and the size and quantity of the amplicon library were evaluated using an Agilent 2100 Bioanalyzer (Agilent, USA) and a Library Quantification Kit for Illumina (Kapa Biosciences, Woburn, MA, USA), respectively. Sequencing was conducted on a NovaSeq PE250 platform in accordance with the manufacturer’s recommendations. The sequencing data were processed and analyzed using QIIME2. The alpha diversity levels of each sample were assessed using Chao1, Shannon, Simpson, and Coverage indices, based on the distribution of ASV/OTU across different samples. Beta diversity differences between different samples (groups) were measured through principal coordinate analysis (PCoA), clustering analysis, and other methods, at the taxonomic composition level. Coupled with corresponding statistical tests, differences in species abundance composition between groups were evaluated.
Transcriptomic Analysis of Rat Livers
RNA was extracted from the liver tissues of rats, and its transcriptome was sequenced by BioTree Shanghai (http://www.biotree.com.cn/).24 The mRNA was then enriched, and strand-specific sequencing libraries were generated using the TruSeq RNA Sample Prep Kit (Illumina, San Diego, CA, USA). These libraries were sequenced in an Illumina Novaseq 6000 system to produce 150 bp paired-end sequences. Initial processing of the sequences was performed using Skewer, with quality assessments made via FastQC v0.11.2. The alignment of sequences to gene exons was achieved through the application of Hisat2 v2.0.5, and any genes receiving fewer than 20 reads per sample were omitted from subsequent examinations. Analysis to identify differentially expressed transcripts (DETs) employed the DESeq2 package (version 1.20.0) with the threshold criteria defined as follows: absolute log2 fold change (|log2FC|) greater than or equal to 1, and adjusted p-value (q-value) less than 0.05, utilized within the R computing environment (version 3.4.4). Gene set enrichment analysis was conducted through the application of GSEA software (version 4.1.0) and MSigDB to identify whether a set of genes in KEGG pathways show significant differences in two groups. Briefly, we input gene expression matrix and rank genes using Signal2Noise normalization method. Enrichment scores and p value was calculated in default parameters. KEGG pathways meeting this condition with Normalized Enrichment Score (|NES|) >1, nominal p-value <0.05, FDR q-value <0.25 were considered to be different in two groups.
Wes Automated Simple Western Assay
GAPDH (1:10,000, 60,004-1-Ig), NR1H4 (1:50, 25,055-1-AP), CYP7A1 (1:500, 18,054-1-AP), FABP1 (1:4000, 13,626-1-AP), CPT2 (1:2500, 26,555-1-AP), CPT1 (1:3000,15,184-1-AP), HMGCS1 (1:4000, 17643-AP) and PPARα (1:30, 66,826-1-Ig) were purchased from Proteintech Group, Inc. Additionally, CYP7B1 (1:50, YT1241) and HMGCS2 (1:50, YN8796) were acquired from ImmunoWay Biotechnology Company. The extraction of total tissue protein from the organism was achieved through the lysis utilizing 1 mM PMSF (meilunbio, Dalian, China) and RIPA Lysis Buffer (meilunbio, Dalian, China) in a frigid environment, followed by centrifugation at 12,000 rpm for 5 minutes, and subsequent collection of the supernatant. The concentration of the total protein was ascertained using the BCA Protein Assay Kit (KeyGEN Bio TECH, Jiangsu, China). The 10x Sample Buffer in the kit was diluted to 0.1x Sample Buffer. The total volume of each well was 4.5μL of samples. The 5x Master Mix was fixed to 0.9μL, and the 0.1x Sample Buffer and protein sample were 3.6μL in total. The final protein loading concentration was 2μg/μL. Quantitative protein analysis was conducted employing the Simple Westerns™ System alongside Compass software for the visualization and evaluation of outcomes. The Simple Westerns™ System significantly enhances the precision and quantification of protein analysis, offering a considerable reduction in errors and a diminution in operational duration when juxtaposed with conventional Western blot methodologies.25
Statistical Analysis
Statistical analyses were conducted using the SPSS software version 20.0. Variables conforming to a normal distribution were represented as the mean ± standard deviation and analyzed for differences between two sample groups using the t-test. Variables not adhering to a normal distribution were compared using the Mann–Whitney U-test. For multiple group comparisons, the one-way ANOVA test was employed for normally distributed variables. For non-normally distributed data, the Kruskal–Wallis H-test was used. Correlations between variables were explored through correlation analysis, employing Pearson’s method for data fitting a normal distribution, and Spearman’s method for data not fitting this criterion. In the validation of the Wes automated simple western assay, three samples were randomly selected from each group. A permutation test was conducted to compare the differences in protein levels between the sample groups using the coin package in R to compare groups, with the number of permutations set to 9999. All statistical tests were two-tailed, and a p-value of less than 0.05 was considered statistically significant.
Results
Indexes Changes of MS Rats
By the 15th week of modeling, notable differences had emerged between the control and the metabolic syndrome (MS) groups in aspects including weight, abdominal circumference, Lee’s index, fasting blood glucose (FBG), blood lipids, fasting insulin levels (FINS), and the Homeostatic Model Assessment for Insulin Resistance (HOMA-IR), all bearing statistical significance (p<0.05). The metabolic phenotype indicators for both the control and MS groups, each comprising eight subjects, were listed in Tables 1–3.
 |
Table 1 Comparison of Body Weight, Body Length and Abdominal Circumference Between Normal Group and MS Group (Mean±sd, n=8) |
 |
Table 2 Comparison of Blood Lipid Levels Between Normal Group and MS Group (Mean±sd, n=8) |
 |
Table 3 Comparison of FBG, FINS and HOMA-IR Between Normal Group and MS Group (Mean±sd, n=8) |
Bile Acid Detection results
Bile Acids Analysis
Principal Component Analysis (PCA) and Orthogonal Partial Least Squares Discriminant Analysis (OPLS-DA) were conducted on the 69 identified serum bile acids in both the control and MS groups, as depicted in Figure 2A and B. The control samples were represented by red dots, while the MS samples were marked by deep blue dots, showing a pronounced differentiation in the concentrations of serum bile acids between the two groups, indicative of distinctive characteristics. The constructed OPLS-DA model exhibited a predictive accuracy (R2Y(cum)) of 98.5% and a cross-validated predictive accuracy (Q2Y(cum)) of 96.6%; a permutation test conducted 200 times with random data demonstrated that the predictive accuracy of new models generated under conditions of complete irrelevance was significantly inferior to that of the original model (Figure 2C). Therefore, the OPLS-DA model was characterized by high predictive accuracy and stability, rendering it an effective tool for distinguishing between the characteristic differences in bile acids between the normal and MS groups.
 |
Figure 2 The PCA score plots for the control and (MS) groups (each group, n=8): (A), the score plots from the OPLS-DA model (B), the permutation test results of the OPLS-DA model (C), and the volcano plots of bile acid differential expression between the two groups (D). |
Among the 69 evaluated bile acids, the MS group exhibited significant modifications in the concentration of 24 bile acid components (VIP>1.0 and p<0.05), as depicted in Figure 1D. The cerulean dots symbolized bile acids whose concentrations had appreciably waned, while the scarlet dots represented those with notably escalated concentrations. Employing a threshold derived from the mean Variable Importance in Projection (VIP) value of 1.29 from the first principal component in the OPLS-DA model, nine unique bile acids were identified, denoted in red front in Figure 2D. Amongst these, five bore the most striking contrasts (VIP>1.4 and p<0.01), specifically: 6-ketolithocholic acid, isohyodeoxycholic acid, hyodeoxycholic acid, taurohyodeoxycholic acid, and isoursodeoxycholic acid. Compared to the normal control group, the concentrations of 6-ketolithocholic acid, isohyodeoxycholic acid, hyodeoxycholic acid, and taurohyodeoxycholic acid markedly decreased, whereas isoursodeoxycholic acid’s concentration significantly increased in the serum of MS rats, as detailed in Table 4.
 |
Table 4 The Five Bile Acids with the Most Significant Differences Between the Normal Group and the MS Group (nmol/L) |
Results of Intestinal Flora
The α Diversity Analysis
Through the application of α-diversity analytical methodologies such as the Chao1 index, Simpson index, and Shannon index, an evaluation of the species diversity within the rat intestinal microbiota was conducted. The outcomes, as depicted in Figure 3, illustrated that in comparison with the control group, the Chao1 index, Simpson index, and Shannon index of the MS group were significantly diminished (p<0.02), signifying a notable reduction in the richness, evenness, and diversity of the intestinal microbiota species in the MS rats. The coverage indices for both groups were close to 1, indicating high reliability of the sequencing results.
 |
Figure 3 Chao1 index, Simpson index, Shannon index and Coverage index of intestinal flora of two groups (each group, n=8): A represents the normal group, and B represents the MS group. |
The β Diversity Analysis
Through principal coordinates analysis (PCoA), we assessed the β-diversity in the intestinal microbial structure and composition between two groups. The first two principal components accounted for 53.16% and 9.68% of the variance in microbial community structure, respectively. The PCoA results, illustrated in Figure 4A, indicated significant differences in community structure and composition between the normal group and the MS group. A clustered heatmap of the top 30 species in terms of abundance, as shown in Figure 4B, was constructed. Each row represents a species, and each column represents a sample/group (with A denoting the normal group and B denoting the MS group). A gradient from blue to red in the heatmap reflected the transition from low to high abundance. The closer the abundance was to blue, the lower it was; conversely, the closer it was to red, the higher it was. This suggested significant alterations in the intestinal microbiota of MS rats.
 |
Figure 4 The PCoA plots of the gut microbiota for the control and MS groups (A) and the clustered heatmap of the top 30 abundant species (B) Each group, n=8. |
Difference Analysis of Intestinal Flora Between Normal Group and MS Group
Utilizing the Mann–Whitney U-test to analyze the abundance at the genus level of intestinal microbiota between the normal and MS groups, a total of 333 intestinal genera were involved. Among these, 136 intestinal genera exhibited significant differences in abundance between the groups (p<0.05). In the MS group, the abundance of 92 intestinal genera was significantly decreased, while 44 genera showed a significant increase. Figure 5 elucidated the distribution of the top 30 significantly different intestinal genera between the two groups. Compared to the normal group, the MS group exhibited a significant increase in the abundance of 21 intestinal genera and a significant decrease in 9 genera (p<0.05). The genera with notably increased abundance included Enterococcus, Bacteroides, Akkermansia, Streptococcus, Eubacterium, Ruminococcus, Clostridium, Escherichia-Shigella, Megamonas, Blautia, Desulfovibrio, and Parasutterella. Those with significantly reduced abundance primarily comprised Lactobacillus, Ligilactobacillus, Firmicutes, Allobaculum, Muribaculaceae, and Lachnospiraceae_NK4A136, etc.
 |
Figure 5 Distribution of the top 30 intestinal genera with significant differences between the normal group and the MS group. (A) denotes normal control group, (B) denotes MS model group. Data were expressed as mean±SD, n=8. |
Correlation Analysis Between Characteristic Bile Acids and Biochemical Indexes
In the analysis of the correlation between five characteristic bile acids in the serum of MS rats and their biochemical indexes, as illustrated in Figure 6A and B, a significant positive correlation was observed between HDCA and three other metabolites—its derivatives (isohyodeoxycholic acid, taurohyodeoxycholic acid, and 6-ketolithocholic acid), with correlation coefficients exceeding 0.84 (p<0.001). Conversely, a significant negative correlation was identified with isoursodeoxycholic acid, with a correlation coefficient of 0.63 (p<0.01). Significant negative correlations were also noted with rat weight, abdominal circumference, fasting blood glucose, triglycerides, cholesterol, LDL-C, and HOMA-IR (p<0.02), with correlation coefficients above 0.6, while a significant positive correlation was found with HDL-C (p<0.01), where the correlation coefficient was 0.75. Isoursodeoxycholic acid exhibited a significant positive correlation with rat weight, body length, Lee’s index, abdominal circumference, FBG, cholesterol, LDL-C, and HOMA-IR (p<0.02), with correlation coefficients exceeding 0.6, and a negative correlation trend with HDL-C. This suggested that isoursodeoxycholic acid and hyodeoxycholic acid could serve as characteristic biomarkers in the serum of MS rats.
 |
Figure 6 The correlation analysis results between characteristic BAs and MS metabolic indexes (each group, n=8):(A) Hyodeoxycholic acid; (B) Isoursodeoxycholic acid. |
Correlation Analysis Between Characteristic BAs and Intestinal Flora
In the correlation analysis between five characteristic BAs in the serum of MS rats and the top 30 significantly different abundances of gut microbiota genera (as depicted in Figure 7A and B). Figure 7A illustrated 21 types of microbiota significantly increased in abundance within the MS group, while Figure 7B displayed 9 types experienced a significant decrease. As shown, a pronounced positive correlation was observed between the significantly elevated isoursodeoxycholic acid in the MS group and 16 types of gut bacteria that also increased significantly in abundance. Conversely, the other four bile acids, which showed a marked decrease in concentration, were significantly negatively correlated with these 16 types of gut microbiota, with an average correlation coefficient of 0.73. The implicated microbiota primarily include: Enterococcus, Pseudomonadaceae, Akkermansia, Streptococcus, Bacillus, Ruminococcus, Clostridium, Megamonas, Blautia, Desulfovibrio, Spirochaetaceae, etc. Furthermore, the significantly elevated isoursodeoxycholic acid in the MS group exhibited a notable negative correlation with 5 types of gut bacteria that decreased significantly in abundance. In contrast, the other four bile acids, which decreased significantly in concentration, showed a significant positive correlation with these 5 types of gut microbiota, with an average correlation coefficient of 0.67. These bacteria included beneficial species such as Lactobacillus, Acidophilus, Actinomyces, Bifidobacterium, Muribaculaceae, and Lachnospiraceae_NK4A136. Hence, this suggested that the changes in the abundance of the top 30 significantly different gut microbiota led to variations in the concentrations of the five bile acids, subsequently contributing to the development of MS. These five bile acids could serve as characteristic biomarkers in the serum of MS rats, particularly isoursodeoxycholic acid and hyodeoxycholic acid.
 |
Figure 7 Correlation analysis results of MS characteristic bile acids and the top 30 gut microbiota genera with different abundance between groups (each group, n=8): the color of the triangle in the upper left corner represented the size of the correlation coefficient, the blue negative correlation, and the red positive correlation; the triangle in the lower right corner represented the significant p value, x represents p<0.05, xx represented p<0.01, and xxx represented p<0.001. (A) showed 21 species of gut microbiota genera with significantly up-regulated abundance in MS group and (B) showed 9 species with significantly down-regulated abundance in MS group. |
Significant Alterations on Metabolic Indexes of MS Rats After HDCA Intervention
Twenty-one MS rats were randomly divided into three groups: an MS model group, a HDCA intervention group, a metformin intervention group, and compared to a normal control group, with each group consisting of 7 rats. After 4 weeks of intervention, the results showed that HDCA significantly reduced the body weight, waist circumference, Lee’s index, FBG, triglycerides (TG), cholesterol (TC), low-density lipoprotein cholesterol (LDL-C), fasting insulin levels (Ins), and the insulin resistance index (HOMA-IR) in MS rats (p<0.02), and significantly increased the high-density lipoprotein cholesterol (HDL-C) levels in MS rats (p<0.01). There was no significant difference in the effects between the HDCA group, the metformin group, and the control group (p>0.05). The specific results were shown in Figure 8. This study further suggested that the abnormal HDCA concentration led to the occurrence of MS and was one of the key regulatory molecules in the development of MS.
 |
Figure 8 Results of metabolism-related indexes of MS with significant changes after 4 weeks of intervention: significant P-values between the two groups were shown on the horizontal line, with Control representing the normal group, Model representing the MS group, MET representing the metformin intervention group, and HDCA representing the hyodeoxycholic acid intervention group. Data were expressed as mean±SD, n=7. *p<0.05, **p<0.01, ***p<0.001, ****p<0.0001. |
In addition, we analyzed the changes in BA composition in serum and found that HDCA was the major contributor to the alterations in the BA profile following HDCA treatment (Figure S1).
HDCA intervention was able to upregulate the abundance of beneficial gut microbiota genera such as Ligilactobacillus, Lachnospiraceae, Firmicutes, Allobaculum, Lachnospiraceae_NK4A136, and Lactobacillus in the MS model group while reducing the abundance of harmful bacteria such as Enterococcus, Bacteroides, Streptococcus, Escherichia-Shigella, Blautia, and Desulfovibrio (Figure S2).
Morphology Analysis of Livers and Ileums
The liver and ileum play pivotal roles in the metabolism of bile acids. According to Figure 9A and B, the liver cells of the control group exhibited a clear structure, with a radiating arrangement around the central vein, homogeneous cytoplasm, and nuclei of normal size and shape, centrally located. In contrast, the liver cells of the MS model group displayed indistinct contours and disorganized arrangements and were filled with lipid droplets of varying sizes within the cytoplasm, alongside significant nuclear compression and displacement, leading to extensive hepatocyte degeneration and necrosis. Compared to the MS model group, the metformin and HDCA groups showed a marked reduction in lipid vacuoles, significantly ameliorated fatty liver degeneration, and comparatively clearer and more orderly cell structure.
 |
Figure 9 The physiological changes in different groups of liver and ileum: (A) Representative images of H&E staining of Liver (x100), scale bars, 100μm; (B) Representative images of H&E staining of Liver (x400), scale bars, 50μm; (C) Representative images of H&E staining of ileum (x100), scale bars, 100μm; (D) Representative images of H&E staining of ileum (x400), scale bars, 50μm. |
According to Figure 9C and D, in the control group, the ileum’s morphological structure was normal, with densely arranged villi and an intact, continuous mucous membrane. Conversely, the ileum of the MS model group presented abnormal morphology, with widened villi, sparse and disordered arrangement. Relative to the MS model group, the ileum tissue in both the metformin and HDCA groups exhibited more orderly villi arrangement and reduced tissue destruction.
Liver Transcription Profile Analysis
To investigate the potential mechanisms of action of HDCA, we conducted a comprehensive analysis of rat liver tissues using RNA sequencing technology. As shown in Figure S3a,b,c, a total of 2131 differential genes were identified between the normal control group and the MS model group. Additionally, 230 differential genes were found between the MS model group and the HDCA intervention group (p<0.05, fold change > 2). Among these, 137 differential genes overlapped. Notably, the expression of 133 genes was reversed by HDCA treatment. Further, KEGG enrichment analysis was performed on the gene expression data by employing the methodology of GSEA. As shown in Figure 10A, GSEA results from the KEGG pathway showed the top 30 gene sets with the most significant P-values and false discovery rate (FDR) scores. It was evident that, following HDCA intervention, genes were primarily enriched in pathways such as acetate and dicarboxylate metabolism, fatty acid degradation, glycine, leucine and isoleucine degradation, pyruvate metabolism, and primary bile acid synthesis. Concurrently, line graphs displayed the enrichment scores (ES) for primary bile acid synthesis and fatty acid degradation pathways, as shown in Figure 10B. Gene sets related to primary bile acid synthesis and fatty acid degradation biological pathways were significantly enriched in the analyzed gene list (p<0.01), exhibiting high ES values, indicating that primary bile acid synthesis and fatty acid degradation biological pathways played a significant role in the HDCA intervention group.
 |
Figure 10 GSEA results of KEGG Pathways in Liver RNA-Seq Data Comparing the MS Group with the HDCA Treatment Group (each group, n=7): (A) showed the results of the top 30 KEGG pathways in GSEA enrichment, and (B) showed the ES line charts of GSEA enrichment scores in the primary bile acid synthesis and fatty acid degradation pathways. In (A), the horizontal coordinate was the NES value of the gene set, the vertical coordinate was the name of the gene set in the KEGG database, and the color represented the corrected P value. In B,E was the HDCA intervention group, (B) was the MS group, and ES value was the enrichment score. |
Wes Automated Simple Western Assay Validation
Subsequently, we validated the expression of key gene proteins in the primary bile acid synthesis pathway (FXR, CYP7A1, and CYP7B1) and critical gene proteins in the fatty acid degradation pathway (PPARα, CPT1, CPT2, FABP1, HMGCS1 and HMGCS2) through Wes automated simple western assay analysis. A permutation test was applied to compare the differences between the sample groups, with the number of permutations set to 9999. The data were expressed as quartiles. As illustrated in Figure 11, compared to the normal control group, the expressions of FXR, CYP7B1, PPARα, CPT1, CPT2, FABP1, HMGCS1 and HMGCS2 in the livers of MS rats were significantly downregulated, while CYP7A1 was markedly upregulated. Following HDCA intervention, there was a significant improvement in the expression of these proteins, and CYP7B1 was also significantly upregulated. In comparison to the metformin intervention group, HDCA demonstrated a greater regulatory effect on the aberrant protein expressions in MS rats. These findings suggest that HDCA may exert its biological effects through the modulation of key gene proteins involved in primary bile acid synthesis and fatty acid degradation pathways.
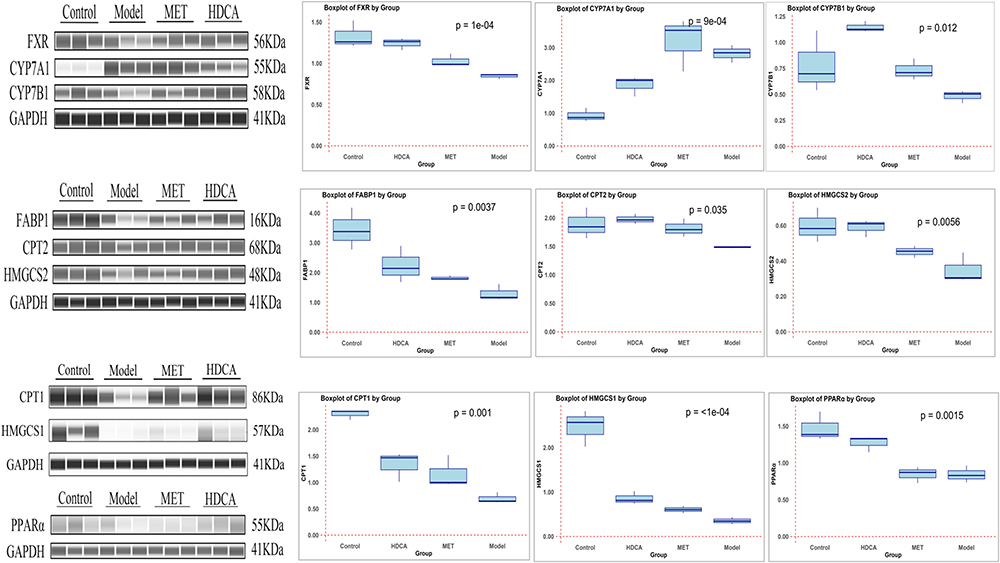 |
Figure 11 Expression of some core proteins of bile acid synthesis and fatty acid degradation pathways in liver tissues of each group (n=3): Control is normal control group; Model is MS group; MET was the metformin intervention group; HDCA was hyodeoxycholic acid intervention group; A permutation test was applied to compare the differences between sample groups, with the number of permutations set to 9999 and the data were expressed as quartiles. |
Discussion
Accumulating evidence has established that gut microbiota dysbiosis and subsequent alterations in microbial-derived metabolites, particularly BAs, play pivotal roles in the pathogenesis of metabolic disorders including obesity, type 2 diabetes, and NAFLD, all of which were related to MS.26 However, the precise BA signatures and their mechanistic links to MS progression remain unexplored. Our study provides new insights by identifying HDCA as a central regulator in MS pathophysiology through integrated microbiota-BA metabolism-mechanism analyses.
Our research identified five distinct bile acids in the serum between two groups, which exhibited a high correlation with various biochemical indexes of MS. Notably, the increased levels of isoursodeoxycholic acid significantly correlated with the aberrant indicators of MS. Conversely, the decreased levels of HDCA, iso-hyodeoxycholic acid, taurohyodeoxycholic acid, and 6-ketolithocholic acid displayed a significantly inversely relationship with these irregular markers. Iso-hyodeoxycholic acid, tauroursodeoxycholic acid and 6-ketolithocholic acid are derivatives of HDCA. Isoursodeoxycholic acid can be metabolically converted from HDCA, with the two exhibiting a negative correlation, with a correlation coefficient reaching as high as 0.65, indicating a close relationship between the reduced levels of HDCA and the elevated levels of isoursodeoxycholic acid in the serum of rats with MS. These findings were consistent with previous studies demonstrating the role of HDCA in lowering cholesterol, promoting fatty acid oxidation, exerting anti-inflammatory effects, and improving glucose homeostasis.16,18,20 Furthermore, HDCA has been found to be significantly reduced in conditions such as diabetes and NAFLD.14 Therefore, HDCA may serve as a potential biomarker in the serum of rats with MS.
The composition of the gut microbiota critically influences BA pool concentrations, and disruptions in microbial community structure can lead to significant alterations. Our research revealed a substantial decrease in the diversity and richness of gut flora in MS rats compared to controls, resulting in a microbial imbalance. Specifically, the MS group exhibited decreased abundances of Lactobacillus, Acidophilus, Actinobacteria, Bifidobacteria, Muribaculaceae, and Lachnospiraceae_NK4A136. Conversely, Enterococcus, Pseudomonas, Streptococcus, Bacillus, Ruminococcus, Clostridium, Escherichia-Shigella, Megamonas, Blautia, Desulfovibrio, and Helicobacter were more prevalent, suggesting a shift toward a pathogen-dominated gut environment. Similar microbial imbalances have been reported in metabolic disorders. For instance, individuals with type II diabetes showed reduced microbial diversity, with lower abundances of Prevotella and Firmicutes but higher levels of Pseudomonas and Proteobacteria.27,28 Additionally, certain obese patients exhibited increased relative proportions of Anaerobic cocci, Filamentous bacilli, Rod-shaped bacteria, Dorea, Escherichia-Shigella, Bacillus, Clostridium, Megamonas, and Streptococcus.29 Our findings corroborate these observations and further highlight the role of specific bacterial taxa in MS pathogenesis.
A correlation analysis between bile acids and the 30 most abundant gut flora revealed that HDCA exhibited a positively correlated with beneficial bacteria, like Lactobacillus, Ligilactobacillus, Firmicutes, Actinobacteria, Muribaculaceae, and Lachnospiraceae_NK4A136_group, which were depleted in MS rats. Conversely, HDCA showed a negative correlation with pathogenic flora, including Enterococcus, Bacteroides, Streptococcus, Bacillus, Ruminococcaceae, Clostridium, Megamonas, Blautia, Desulfovibrio, and Helicobacter, whose abundance increased in MS rats. This indicated that gut microbiota dysbiosis contributed to alterations in the BA pool. Notably, Enterococcus, Escherichia-Shigella, Streptococcus, and Clostridium, which are associated with inflammation, may compromise intestinal integrity, allowing endotoxins to enter the bloodstream and potentially exacerbating insulin resistance and systemic inflammation.30,31 Bacteroides play a crucial role in colonic metabolism, fermenting carbohydrates, utilizing nitrogenous substances, and transforming bile acids and sterols.32 In contrast, beneficial bacteria like Lactobacillus and Ligilactobacillus can impact bile acid metabolism via bile salt hydrolase (BSH) activity, promoting intestinal health and reducing inflammation.33
After a four-week intervention, HDCA significantly improved various metabolic indexes of MS rats, with no notable differences compared to the outcomes of control or metformin-treated groups (p>0.05). This intervention also demonstrated that HDCA played a pivotal role in modulating the bile acid profile. Specifically, HDCA enhanced the abundance of beneficial bacteria such as Ligilactobacillus, Lachnospiraceae, Firmicutes, Allobaculum, Lachnospiraceae_NK4A136, and Lactobacillus while reducing the prevalence of harmful bacteria, including Enterococcus, Bacteroides, Streptococcus, Escherichia-Shigella, Blautia, and Desulfovibrio. These findings highlight HDCA’s role as a key regulatory molecule in MS development and suggest its potential as a therapeutic agent.
The GSEA of liver RNA-seq data revealed that primary bile acid synthesis and fatty acid degradation pathways were among the top 30 significantly altered KEGG pathways in the HDCA intervention group. These findings highlighted the pivotal roles of these biological pathways in regulating metabolic processes. Bile acids are not only the primary route for cholesterol elimination in the body but also act as crucial signaling molecules that activate various bile acid receptors, playing significant roles in carbohydrate and lipid metabolism and energy homeostasis. Thus, the regulation of the bile acid synthesis pathway is vital for maintaining lipid metabolism and energy balance. In hepatocytes, bile acids are synthesized from cholesterol through two major pathways: the classical pathway (mediated by CYP7A1) and the alternative pathway (mediated by CYP7B1), with the classical pathway accounting for ≥75% of total bile acid production under normal conditions.34 The FXR, the liver’s primary bile acid sensor, plays a crucial role in regulating bile acid biosynthesis and enterohepatic circulation.35 Upon activation by bile acids, hepatic FXR induces small heterodimer partner (SHP) expression. SHP then binds liver receptor homolog-1 (LRH-1), inhibiting CYP7A1 expression in the classical pathway and consequently suppressing bile acid synthesis.36 Further western assay validated key protein expression in primary bile acid synthesis (FXR, CYP7A1, and CYP7B1). The results showed that HDCA intervention significantly ameliorated the aberrant expression of these key proteins in MS rats, demonstrating superior regulatory effects compared to metformin treatment. Abnormal expression of FXR and CYP7A1 in the classical bile acid synthesis pathway indicated that bile acid synthesis was disrupted in MS rats. However, HDCA intervention significantly improved their expression and also significantly enhanced the expression of the key enzyme CYP7B1 in the alternative synthesis pathway. This suggests that HDCA may inhibit the classical synthesis pathway of bile acids and upregulate their alternative synthesis pathway, thereby modulating bile acid synthesis and balance. Studies have shown that the alternative pathway of BA synthesis has a potential role in the treatment of metabolic diseases such as hyperglycemia and fatty liver disease and may emerge as a novel target for intervention.26
Moreover, the liver is the primary site for fatty acid oxidative degradation, which occurs via the β-oxidation pathway in cellular mitochondria and peroxisomes, serving as a central pathway for cellular energy production. Disruptions in fatty acid oxidation can lead to fatty acid accumulation and metabolic imbalance. Research indicates that when circulating fatty acid levels exceed the storage capacity of adipose tissue and the oxidative capacity of peripheral tissues, excess free fatty acids accumulate as triglycerides in non-adipose tissues, such as muscle cells, hepatocytes, and pancreatic β-cells. This process is associated with insulin resistance, NAFLD, and type 2 diabetes.37 Our research revealed that the expression of key proteins involved in the fatty acid degradation pathway (PPARα, CPT1, CPT2, FABP1, HMGCS1 and HMGCS2) in MS rats was significantly reduced compared to the normal and intervention groups. This indicated that the fatty acid degradation pathway was significantly disrupted in MS rats. HDCA intervention significantly enhanced their expression, confirming its novel role in activating the fatty acid degradation pathway and exerting an anti-MS effect. PPARα, as an important regulatory factor in fatty acid oxidative degradation, is highly expressed in the liver, heart, kidneys, and skeletal muscles. It modulates lipid metabolism, inflammatory responses, and energy balance by modulating genes related to fatty acid oxidation and transport, such as carnitine palmitoyltransferase (CPT1, CPT2) and fatty acid-binding proteins (FABP1, FABP4), as well as the activity of the key enzyme in ketone body synthesis, HMGCS2.38 Extensive data have shown that the expression of PPARα was altered during the development of NAFLD and NASH in both animal models and patients.39,40 Consistent with these reports, we observed PPARα dysregulation in MS rats. Importantly, our study advances current knowledge by demonstrating HDCA’s capacity to normalize PPARα expression and its downstream effectors, thereby proposing a potential therapeutic approach for metabolic disorders.
Conclusion
This study provides novel insights into the role of HDCA in MS for the first time. We identified HDCA as a characteristic bile acid of MS, demonstrating its significant correlations with gut microbiota and metabolic abnormalities (p<0.05). HDCA treatment effectively improved metabolic parameters in MS rats (p<0.05), outperforming metformin in aspects. Mechanistically, HDCA not only acted by regulating key proteins in the primary bile acid synthesis pathway, such as FXR, CYP7A1, and CYP7B1, but also affected key proteins in the fatty acid degradation pathway, such as PPARα, CPT1, CPT2, FABP1, HMGCS1 and HMGCS2 (p<0.05). These findings highlight HDCA as a promising therapeutic candidate for MS and underscore the importance of the BA-MS axis in future research and clinical applications. While our study provides mechanistic insights, causal relationships require further validation. These animal findings necessitate human studies to confirm translational potential and optimize HDCA dosing for metabolic disorders.
Declaration of Generative AI in Scientific Writing
The authors declare no AI in scientific writing.
Data Sharing Statement
The data used to support the findings of this study are included within the article.
Acknowledgments
We thank all resources used in this study.
Author Contributions
All authors contributed to conception, execution, data analysis, drafting or revising the article, have agreed on the journal to which the article will be submitted, gave final approval of the version to be published, and agree to be accountable for all aspects of the work.
Funding
This work is supported by the Fujian Provincial Natural Science fund subject of China (2022J01361 and 2024L3014) and the Natural Science fund subject of Fujian University of traditional Chinese Medicine (XJC2023004 and X2022005-Special financial project), and the fifth batch of national excellent clinical talents training program for Traditional Chinese Medicine (No. 239[2022] of Chinese Medicine People’s Education Letter).
Disclosure
The authors declare no conflicts of interest in this work.
References
1. McCracken E, Monaghan M, Sreenivasan S. Pathophysiology of the metabolic syndrome. Clin Dermatol. 2018;36(1):14–20. doi:10.1016/j.clindermatol.2017.09.004
2. Maurice J, Manousou P. Non-alcoholic fatty liver disease. Clin Med (Lond). 2018;18(3):245–250. doi:10.7861/clinmedicine.18-3-245
3. Kaneko K, Yatsuya H, Li Y, et al. Risk and population attributable fraction of metabolic syndrome and impaired fasting glucose for the incidence of type 2 diabetes mellitus among middle-aged Japanese individuals: Aichi Worker’s Cohort Study. J Diabetes Investig. 2020;11(5):1163–1169. doi:10.1111/jdi.13230
4. Dabke K, Hendrick G, Devkota S. The gut microbiome and metabolic syndrome. J Clin Invest. 2019;129(10):4050–4057. doi:10.1172/JCI129194
5. Wu J, Wang K, Wang X, Pang Y, Jiang C. The role of the gut microbiome and its metabolites in metabolic diseases. Protein Cell. 2021;12(5):360–373. doi:10.1007/s13238-020-00814-7
6. Belizário JE, Faintuch J, Garay-Malpartida M. Gut microbiome dysbiosis and immunometabolism: new frontiers for treatment of metabolic diseases. Mediators Inflamm. 2018;2018:2037838. doi:10.1155/2018/2037838
7. de Vos WM, Tilg H, Van Hul M, Cani PD. Gut microbiome and health: mechanistic insights. Gut. 2022;71(5):1020–1032. doi:10.1136/gutjnl-2021-326789
8. Cai J, Rimal B, Jiang C, Chiang JYL, Patterson AD. Bile acid metabolism and signaling, the microbiota, and metabolic disease. Pharmacol Ther. 2022;237:108238. doi:10.1016/j.pharmthera.2022.108238
9. Winston JA, Theriot CM. Diversification of host bile acids by members of the gut microbiota. Gut Microbes. 2020;11(2):158–171. doi:10.1080/19490976.2019.1674124
10. Jiao TY, Ma YD, Guo XZ, Ye YF, Xie C. Bile acid and receptors: biology and drug discovery for nonalcoholic fatty liver disease. Acta Pharmacol Sin. 2022;43(5):1103–1119. doi:10.1038/s41401-022-00880-z
11. Pathak P, Xie C, Nichols RG, et al. Intestine farnesoid X receptor agonist and the gut microbiota activate G-protein bile acid receptor-1 signaling to improve metabolism. Hepatology. 2018;68(4):1574–1588. doi:10.1002/hep.29857
12. Chávez-Talavera O, Tailleux A, Lefebvre P, Staels B. Bile acid control of metabolism and inflammation in obesity, type 2 diabetes, dyslipidemia, and nonalcoholic fatty liver disease. Gastroenterology. 2017;152(7):1679–1694. doi:10.1053/j.gastro.2017.01.055
13. McGlone ER, Bloom SR. Bile acids and the metabolic syndrome. Ann Clin Biochem. 2019;56(3):326–337. doi:10.1177/0004563218817798
14. Zheng X, Chen T, Zhao A, et al. Hyocholic acid species as novel biomarkers for metabolic disorders. Nat Commun. 2021;12(1):1487. doi:10.1038/s41467-021-21744-w
15. Zheng X, Chen T, Jiang R, et al. Hyocholic acid species improve glucose homeostasis through a distinct TGR5 and FXR signaling mechanism. Cell Metab. 2021;33(4):791–803. doi:10.1016/j.cmet.2020.11.017
16. Zhong J, He X, Gao X, et al. Hyodeoxycholic acid ameliorates nonalcoholic fatty liver disease by inhibiting RAN-mediated PPARα nucleus-cytoplasm shuttling. Nat Commun. 2023;14(1):5451. doi:10.1038/s41467-023-41061-8
17. Shih DM, Shaposhnik Z, Meng Y, et al. Hyodeoxycholic acid improves HDL function and inhibits atherosclerotic lesion formation in LDLR-knockout mice. FASEB J. 2013;27(9):3805–3817. doi:10.1096/fj.12-223008
18. Shen S, Huang D, Qian S, et al. Hyodeoxycholic acid attenuates cholesterol gallstone formation via modulation of bile acid metabolism and gut microbiota. Eur J Pharmacol. 2023;955:175891. doi:10.1016/j.ejphar.2023.175891
19. Oda E. Historical perspectives of the metabolic syndrome. Clin Dermatol. 2018;36(1):3–8. doi:10.1016/j.clindermatol.2017.09.002
20. Kuang J, Wang J, Li Y, et al. Hyodeoxycholic acid alleviates non-alcoholic fatty liver disease through modulating the gut-liver axis. Cell Metab. 2023;35(10):1752–1766. doi:10.1016/j.cmet.2023.07.011
21. Chen Z, Kang J, Guo Y, et al. Effect of Wendan Decoction on metabolic syndrome in rats. China Journal of Traditional Chinese Medicine and Pharmacy. 2018;33(4):1373–1376.
22. Yang C, Huang S, Lin Z, et al. Polysaccharides from Enteromorpha prolifera alleviate hypercholesterolemia via modulating the gut microbiota and bile acid metabolism. Food Funct. 2022;13(23):12194–12207. doi:10.1039/D2FO02079C
23. Wiklund S, Johansson E, Sjöström L, et al. Visualization of GC/TOF-MS-based metabolomics data for identification of biochemically interesting compounds using OPLS class models. Anal Chem. 2008;80(1):115–122. doi:10.1021/ac0713510
24. Shan S, Zhou J, Yin R, et al. Millet bran protein hydrolysate displays the anti-non-alcoholic fatty liver disease effect via activating peroxisome proliferator-activated receptor γ to restrain fatty acid uptake. J Agric Food Chem. 2023;71(3):1628–1642. doi:10.1021/acs.jafc.2c08169
25. Ye L, Zhang Q, Cheng Y, et al. Tumor-derived exosomal HMGB1 fosters hepatocellular carcinoma immune evasion by promoting TIM-1+ regulatory B cell expansion. J Immunother Cancer. 2018;6(1):145. doi:10.1186/s40425-018-0451-6
26. Jia W, Wei M, Rajani C, Zheng X. Targeting the alternative bile acid synthetic pathway for metabolic diseases. Protein Cell. 2021;12(5):411–425. doi:10.1007/s13238-020-00804-9
27. Kulathunga J, Simsek S. A review: cereals on modulating the microbiota/metabolome for metabolic health. Curr Nutr Rep. 2022;11(3):371–385.
28. Cunningham AL, Stephens JW, Harris DA. Gut microbiota influence in type 2 diabetes mellitus (T2DM). Gut Pathog. 2021;13(1):50.
29. Pinart M, Dötsch A, Schlicht K, et al. Gut microbiome composition in obese and non-obese persons: a systematic review and meta-analysis. Nutrients. 2021;14(1):12. doi:10.3390/nu14010012
30. Ferrari ML, Malardé V, Grassart A, et al. Shigella promotes major alteration of gut epithelial physiology and tissue invasion by shutting off host intracellular transport. Proc Natl Acad Sci U S A. 2019;116(27):13582–13591. doi:10.1073/pnas.1902922116
31. Hou K, Wu ZX, Chen XY, et al. Microbiota in health and diseases. Signal Transduct Target Ther. 2022;7(1):135. doi:10.1038/s41392-022-00974-4
32. Fiebig A, Schnizlein MK, Pena-Rivera S, et al. Bile acid fitness determinants of a Bacteroides fragilis isolate from a human pouchitis patient. Preprint. bioRxiv. 2024;15(1):e02830–23.
33. Prete R, Long SL, Gallardo AL, Gahan CG, Corsetti A, Joyce SA. Beneficial bile acid metabolism from Lactobacillus plantarum of food origin. Sci Rep. 2020;10(1):1165. doi:10.1038/s41598-020-58069-5
34. Jia W, Xie G, Jia W. Bile acid-microbiota crosstalk in gastrointestinal inflammation and carcinogenesis. Nat Rev Gastroenterol Hepatol. 2018;15(2):111–128. doi:10.1038/nrgastro.2017.119
35. Chiang JYL, Ferrell JM. Discovery of farnesoid X receptor and its role in bile acid metabolism. Mol Cell Endocrinol. 2022;548:111618. doi:10.1016/j.mce.2022.111618
36. Goodwin B, Jones SA, Price RR, et al. A regulatory cascade of the nuclear receptors FXR, SHP-1, and LRH-1 represses bile acid biosynthesis. Mol Cell. 2000;6(3):517–526. doi:10.1016/S1097-2765(00)00051-4
37. Schweiger M, Romauch M, Schreiber R, et al. Pharmacological inhibition of adipose triglyceride lipase corrects high-fat diet-induced insulin resistance and hepatosteatosis in mice. Nat Commun. 2017;8:14859. doi:10.1038/ncomms14859
38. Rakhshandehroo M, Hooiveld G, Müller M, Kersten S. Comparative analysis of gene regulation by the transcription factor PPARalpha between mouse and human. PLoS One. 2009;4(8):e6796. doi:10.1371/journal.pone.0006796
39. Wang Y, Nakajima T, Gonzalez FJ, Tanaka N. PPARs as metabolic regulators in the liver: lessons from liver-specific PPAR-null mice. Int J mol Sci. 2020;21(6):2061. doi:10.3390/ijms21062061
40. Francque SM, Bedossa P, Ratziu V, et al. A randomized, controlled trial of the pan-PPAR agonist lanifibranor in NASH. N Engl J Med. 2021;385(17):1547–1558. doi:10.1056/NEJMoa2036205
 © 2025 The Author(s). This work is published and licensed by Dove Medical Press Limited. The
full terms of this license are available at https://www.dovepress.com/terms.php
and incorporate the Creative Commons Attribution
- Non Commercial (unported, 4.0) License.
By accessing the work you hereby accept the Terms. Non-commercial uses of the work are permitted
without any further permission from Dove Medical Press Limited, provided the work is properly
attributed. For permission for commercial use of this work, please see paragraphs 4.2 and 5 of our Terms.
© 2025 The Author(s). This work is published and licensed by Dove Medical Press Limited. The
full terms of this license are available at https://www.dovepress.com/terms.php
and incorporate the Creative Commons Attribution
- Non Commercial (unported, 4.0) License.
By accessing the work you hereby accept the Terms. Non-commercial uses of the work are permitted
without any further permission from Dove Medical Press Limited, provided the work is properly
attributed. For permission for commercial use of this work, please see paragraphs 4.2 and 5 of our Terms.