")
Back to Journals » Journal of Pain Research » Volume 18
Identification and Experimental Verification of Potential Immune Cell-Associated Gene Biomarkers in Human Intervertebral Disc Degeneration
Authors Shi WH, Zou HS, Wang XY, Lu J, Yu HQ, Zhang PP, Huang LL, Chu PC, Liang DC, Zhang YN, Li B
Received 11 November 2024
Accepted for publication 31 January 2025
Published 26 February 2025 Volume 2025:18 Pages 993—1007
DOI https://doi.org/10.2147/JPR.S505859
Checked for plagiarism Yes
Review by Single anonymous peer review
Peer reviewer comments 2
Editor who approved publication: Dr Wendy Imlach
Wei-Han Shi,1,* Hui-Shuang Zou,1,* Xiang-Yu Wang,2,* Jie Lu,1 Hua-Qi Yu,1 Ping-Ping Zhang,1 Li-Li Huang,3 Peng-Cheng Chu,1 Da-Chuan Liang,3 Ya-Ning Zhang,1 Bin Li1
1Department of Orthopedics, Shanxi Medical University Seventh Affiliated Hospital, Linfen People’s Hospital, Linfen, Shanxi, 041000, People’s Republic of China; 2Department of Pain Medicine, First Medical Center, PLA General Hospital, Beijing, 100000, People’s Republic of China; 3Department of Scientific Research Management, Shanxi Medical University Seventh Affiliated Hospital, Linfen People’s Hospital, Linfen, Shanxi, 041000, People’s Republic of China
*These authors contributed equally to this work
Correspondence: Bin Li; Ya-Ning Zhang, Shanxi Medical University Seventh Affiliated Hospital, Linfen People’s Hospital, 319 Gulou West Street, Yaodu District, Linfen, Shanxi, 041000, People’s Republic of China, Email [email protected]; [email protected]
Objective: Intervertebral disc degeneration (IDD) is one of the most common diseases in the elderly population. Recently, immune disorders have been considered to play an important role in IDD. This study aimed to conduct a bioinformatic analysis to identify biomarkers associated with IDD immune cells.
Methods: We obtained the gene expression profiles of IDD by downloading the Gene Expression Omnibus Series (GSE)150408 and GSE124272 from the Gene Expression Omnibus (GEO) database. IDD and immune cell-related hub genes were identified via multiple bioinformatics analyses, and their diagnostic performance was evaluated using receiver operating characteristic (ROC) analysis. In addition, a long non-coding RNA (lncRNA)-signature gene co-expression network was constructed. Finally, the diagnostic accuracy of the biomarkers was verified using Real-time quantitative PCR (RT-qPCR).
Results: ASAP1-IT1, IKZF2, KLHL14, lnc-C10orf131-1, and LOC101927805 were identified as signature genes of IDD. Further, ROC analysis revealed that the five signature gene models had a strong ability to discriminate between the IDD and healthy control samples. We also found that the five signature genes were significantly associated with immune-inflammatory feedback, cell cycle, and skeletal system. Furthermore, an lncRNA signature gene network was constructed to reveal the regulatory mechanisms of the biomarkers. Finally, RT-qPCR results verified that IKZF2 and KLHL14 were significantly downregulated in patients with IDD, and ASAP1-IT1 was significantly upregulated.
Conclusion: This study identified ASAP1-IT1, IKZF2, and KLHL14 as the key signature genes of IDD. These key hub genes may serve as potential therapeutic targets for IDD.
Keywords: intervertebral disc degeneration, immune cells, bioinformatics, biomarkers
Introduction
Low back pain has a high incidence in patients with skeletal and muscular diseases, and is the main cause of dysfunction, worldwide.1–3 Intervertebral disc degeneration (IDD) is a major cause of low back pain; however, its specific pathogenesis is unclear.4 IDD is a prevalent degenerative disease that is usually accompanied by lower back pain, lumbar spinal stenosis, lumbar disc herniation, and sciatica.5 The progression of intervertebral disc (IVD) degeneration involves many etiological factors including heredity, aging, and biomechanical overload. However, the progression of degenerative IVD has not yet been fully elucidated.6,7 At present, common IDD treatments include symptomatic and surgical treatments; however, these treatments can only relieve the symptoms of IDD and cannot fundamentally improve the condition.8–10 Therefore, it is necessary to identify potential diagnostic markers and molecular therapeutic targets for IDD.
Starkweather et al suggested that the neuroimmune system is triggered during disc herniation-caused nerve root pain, which triggers immune cells to discharge proinflammatory cytokines, which signal the brain via humoral and neural pathways, causing ache and functional changes in neural action.11 Immunity abnormalities are a crucial contributor to the development of IDD.4,12 Several studies have examined the characteristics of immune-related inflammatory response and molecular immunology in low back pain.13 Increasing evidence suggests that immune infiltration plays an important role in the occurrence and development of IDD. IDD shows different patterns of immune cell infiltration in IVD tissues, and different cytokines secreted by immune cells participate in the initiation and development of IDD by regulating the inflammatory response. Many studies have examined immune cells in IVD tissues. For example, the main function of macrophages in herniated discs is to promote the reabsorption of prominent tissues, participate in the process of blood vessel ingrowth, and release a variety of inflammatory cytokines.14,15 Dynamic polarization of macrophage M1 and M2 cell subtypes was found in the progression of IDD and played a significant role in regulating cell metabolism, especially in Pro nucleus pulposus cells.16 In addition, T cells promote the autoimmune response in the disc through the release of interleukin (IL) and TNF-α, leading to the occurrence of pain.17 The presence of B cells18 and natural killer (NK) cells19 in human discs has been reported. Furthermore, some studies have involved bioinformatic analysis of immune cell-associated gene,20 but there have been few reports on the expression and role of immune cell-related genes in IDD.
This study conducted weighted gene co-expression network analysis (WGCNA) to identify immune cell-related hub genes. Next, three machine learning methods were used to screen candidate signature genes from IDD immune-related hub genes. Furthermore, a network containing 5 diagnostic markers and 24 long non-coding RNAs (lncRNAs) was constructed. Through the above analyses, five diagnostic markers were identified, which provide a theoretical foundation and have reference value in the study of IDD from an immunological perspective.
Methods
Data Source
The Gene Expression Omnibus Series (GSE)150408 and GSE124272 datasets were from the Gene Expression Omnibus (GEO) database (https://www.ncbi.nlm.nih.gov/geo/). The GSE150408 dataset includes gene expression profiles of whole-blood samples of 17 IDD and 17 healthy control samples. Messenger RNA (mRNA) and lncRNA expression profiles were primarily used in this study. Whole blood samples from eight IDD and eight healthy control samples were obtained from the GSE124272 dataset.
Differential Expression (DE) Analysis
DE analysis of the GSE150408 and GSE124272 datasets was performed using the R package limma. |log2 fold change (FC)| >0.5 and P value <0.05 were used as the significance thresholds. We obtained differentially expressed (DE)-mRNAs and DE-lncRNAs from the GSE150408 dataset and DE-mRNAs from the GSE124272 dataset. We performed an intersection analysis to identify robust DE-mRNAs. In brief, an intersection analysis was performed on the upregulated DE-mRNAs in both datasets to identify the commonly upregulated and downregulated mRNAs. These common mRNAs were defined as IDD-related DE mRNAs. Furthermore, intersection analysis was performed using the Venn Diagram online tool.
Functional Enrichment Analysis
Functional enrichment analyses were performed to explore potential biological functions of the target genes. In this study, gene ontology (GO) analysis was performed on IDD-related DE-mRNAs using the R package cluster Profiler. The GO system consists of three main categories: cellular component (CC), biological process (BP), and molecular function (MF). P value <0.05 indicated a significantly enriched term. However, no enriched terms for IDD-related DE-mRNAs were identified in the BP category.
Immune Infiltration Analyses
Immune infiltration was estimated using both the marker gene expression-based microenvironment cell population-counter (MCP-counter) and single-sample gene set enrichment analysis (ssGSEA) algorithms for each sample in each of the two datasets (GSE150408 and GSE124272) in GEO database. MCP-counter was implemented in the R package MCP-counter to quantify the abundance of different immune cells based on specific molecular markers.21 The Wilcoxon rank-sum test was used to examine the differences between immune cells from healthy controls and IDD samples. P <0.05.
Construction of the Co-Expression Network by a WGCNA
Co-expression networks and hub genes targeting immune cells (the DE and consistently expressed genes in both the GSE150408 and GSE124272 datasets) were constructed and analyzed using the R package WGCNA based on the mRNA expression profiles of the GSE150408 and GSE124272 datasets. In the GSE150408 and GSE124272 cohorts, sample aggregation was first assessed by cluster analysis. Next, a scale-free co-expression network was created using an adjacency matrix based on the soft threshold parameter, β. Hierarchical clustering analysis was then performed to identify the modules of genes with similar expression patterns. Similar modules in each cohort were then merged based on MEDissThres of 0.4. Finally, we calculated the Pearson correlations between the modules and specific features (immune cells) and identified the modules of interest based on a P value ≤0.05, and a |correlation coefficient (cor)| value >0.3. After selecting the modules of interest, we defined a |ModuleMembership (MM)| value >0.6 (the correlation between a phenotype and a gene) and a |GeneTraitSignificance (GS)| value >0.4 (the correlation between a gene expression profile and module eigengene) as the thresholds for screening the immune-related hub genes in the modules of interest.
To identify the IDD- and immune-related hub genes, we conducted an overlap analysis to identify common genes among the IDD-related DE-mRNAs, GSE150408-immune-related hub genes, and GSE124272-immune-related hub genes, which were then defined as IDD- and immune-related hub genes.
Protein-Protein Interaction Networks
Protein-protein interaction networks (confidence =0.15) were constructed to predict the protein-protein interactions of the IDD- and immune-related hub genes using the STRING database (https://cn.string-db.org/). Next, these data were uploaded into Cytoscape software to visualize the networks of the IDD- and immune-related hub genes.
Identification of Signature Genes
This study used machine learning, a novel algorithmic analysis tool, to identify signature genes that could be used to distinguish between healthy control samples and IDD samples. We extracted the expression profile data of IDD- and immune-related hub genes in the GSE150408 and GSE124272 datasets as feature subsets. The signature genes were selected by three machine-learning algorithms (Support vector machine-recursive feature elimination (SVM-RFE), last absolute convergence and selection operator (LASSO), and extreme gradient boosting decision trees (XGBoost)) in the GSE150408 data set and validated in the GSE124272 data set. LASSO is a regularized regression algorithm performed using the R package glmnet. SVM-RFE is a supervised learning technique that applies recursion to the rank features. We applied the SVM algorithm using the R package e1071. XGBoost is a decision-tree-based ensemble of machine learning algorithms implemented using the XGBoost package. The real feature genes were the common genes filtered by the three machine-learning algorithms. The ability of the identified signature gene/linear regression model (constructed based on the signature gene) to distinguish between IDD and healthy control samples was assessed by the area under the curve (AUC) of the receiver operating characteristic (ROC) curve. The ROC curves were analyzed using the pROC in R software.
Gene Set Enrichment Analysis (GSEA) of Signature Genes
GSEA was conducted using the GSE150408 dataset. We downloaded the C5 (c5.all.v7.5.1. entrez.gmt) and C2 (c2.cp.kegg.v7.5.1. entrez.gmt) sub-collections from the MSigDB as the reference gene sets to perform the GSEA analysis for the signature genes. Gene sets were considered significant if they had a normalized enrichment score| >1, adjusted P value <0.05, and q value <0.25.
Construction of lncRNA-mRNA Co-Expression Network
In this study, Pearson correlation analysis was performed to investigate the immune-related lncRNA targeting the signature genes based on the expression profiles of the signature genes and DE-lncRNAs extracted from the GSE150408 dataset. According to lncRNA-mRNA co-expression relationship pair theory, the relationship between lncRNAs and mRNAs should be positively correlated. Thus, we integrated and uploaded DE-lncRNA-featured gene relationship pairs with P values <0.05, and cor values >0.3 into the Cytoscape software for co-expression network visualization.
Real-Time Quantitative PCR (RT-qPCR)
Peripheral blood samples were collected from 20 healthy individuals and 20 IDD patients. Patients with intervertebral disc degeneration (IDD) were identified based on the presence of specific clinical symptoms and a Pfirrmann grade ranging from IV to V. In contrast, healthy controls exhibited no clinical symptoms and had a Pfirrmann grade of I to II.22 The recruitment period for participants was from December 1, 2023, to April 1, 2024, and the participants signed an informed consent form (No. E20231128083), and complied with the Declaration of Helsinki. The RNAiso Blood Kit (Takara Beijing, China) was used for total RNA extraction. A PrimeScript ™ II 1st Strand complementary DNA (cDNA) Synthesis Kit (Takara, Shiga, Japan) was used for cDNA synthesis. RT-qPCR was performed on a LightCycler 96 (Roche Life Sciences, Swiss Basel, Switzerland) using Real-Time PCR Mix (Cowin Biotech, Taizhou, Jiangsu, China). The 2−ΔΔCt method was used to evaluate relative mRNA expression. GAPDH was used as the internal control. The independent experiments were repeated three times. Detailed primer sequences are shown in Supplementary Table 1.
Statistical Analysis
All statistical analyses were performed using R software. The expression levels of the signature genes were compared between patients with IDD and healthy controls using Wilcoxon’s test. P <0.05.
Results
Analysis of IDD-Related DE-mRNAs
The GSE150408 and GSE124272 datasets were obtained from the GEO database. After matching the mRNA expression profiles of the GEO database, differential expression (DE) analysis was performed. In total, 520 DE-mRNAs were identified in the GSE150408 dataset. Compared to the healthy control samples, 290 and 230 mRNAs were significantly upregulated and downregulated, respectively, in the IDD samples (Figure 1A). We also identified 2502 DE-mRNAs between IDD and healthy control samples in the GSE124272 dataset. Compared to the healthy control samples, 1296 and 1206 mRNAs were significantly upregulated and downregulated, respectively, in the IDD samples (Figure 1B). To identify robust DE-mRNAs, we performed overlap analysis of GSE150408-DE-mRNAs and GSE124272-DE-mRNAs. The results are shown in Figure 1C-D. 67 mRNAs were upregulated in both GEO datasets (IDD vs healthy control samples) and 33 mRNAs were downregulated in IDD in both GEO datasets (IDD vs healthy control samples), which were defined as IDD-related DE-mRNAs.
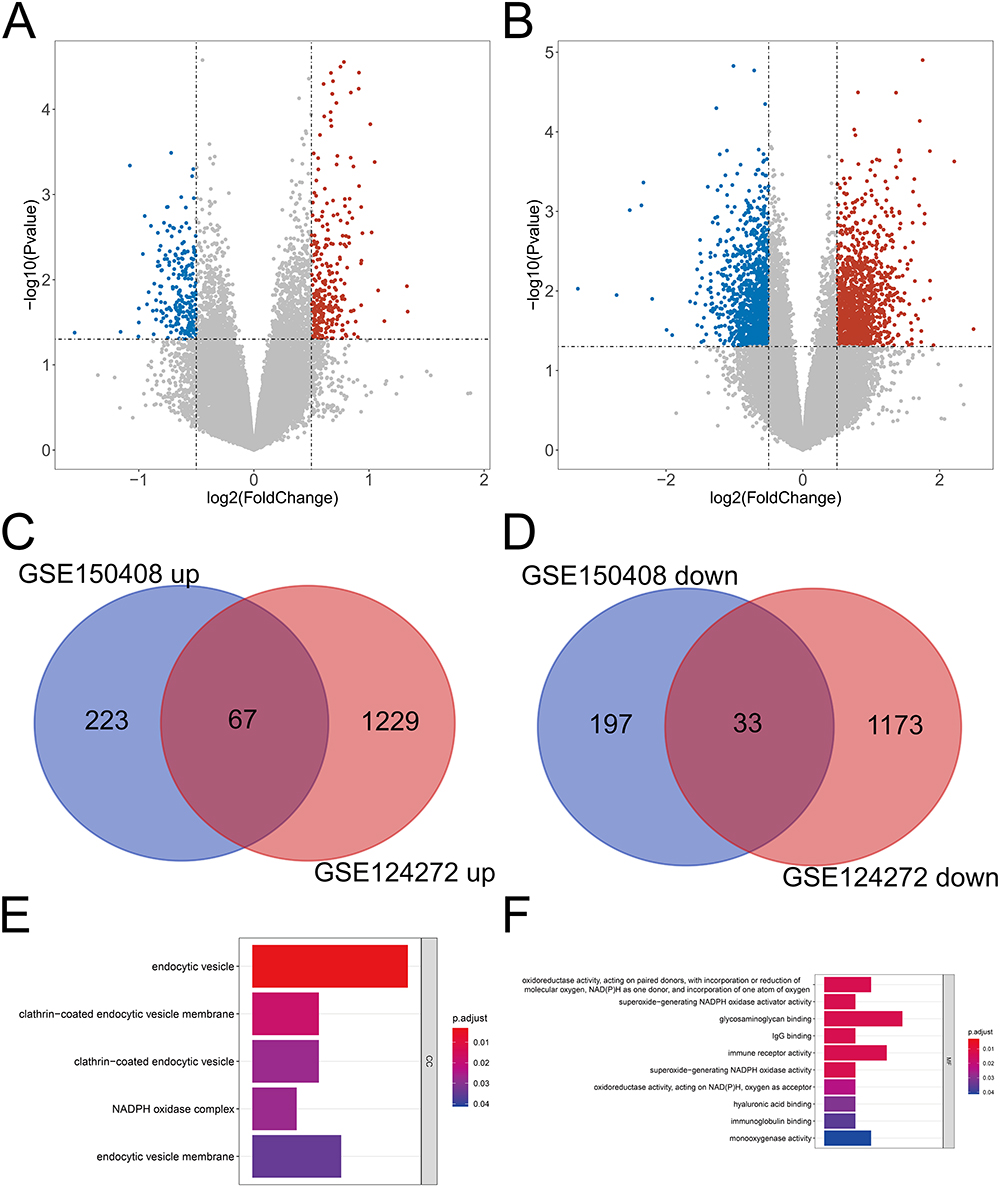 |
Figure 1 Identification of DE IDD-related genes. (A-B) Volcano plot of the DEGs in the IDD and control samples in the GSE150408 (A) and GSE124272 (B) datasets. (C-D) Venn diagram of the differentially upregulated (C) and differentially downregulated (D) key common genes. (D) Venn diagram of the key common genes. (E-F) GO terms in the CC (E) and MF (F) categories enriched by the differentially expressed IDD-related DE-mRNAs. Abbreviations: DE, Differential expression; IDD, intervertebral disc degeneration; DEGs, differentially expressed genes; GSE, Gene Expression Omnibus Series; GO, gene ontology; CC, cellular component; MF, molecular function. |
Furthermore, we performed GO enrichment analysis to determine the potential biological functions of IDD-related DE-mRNAs. Five CC terms and 12 MF terms were found to be enriched. In the CC category, IDD-related DE-mRNAs were significantly associated with endocytic vesicles and the nicotinamide adenine dinucleotide phosphate (NADPH) oxidase complex (Figure 1E). Figure 1F shows the top 10 terms in the MF category, and these genes were found to be significantly associated with NADPH. Moreover, Immunoglobulin G (IgG) binding, immune receptor activity, and immunoglobulin binding were significantly enriched.
Immune Landscape in IDD and Healthy Controls
In the GSE150408 and GSE124272 datasets, the MCP-counter was first used to impute the contents of eight immune cells, one fibroblast, and one epithelial cell in the IDD and healthy control samples, and the differences between the two groups were assessed using the Wilcoxon rank-sum test. The results are shown in Figure 2A. In the GSE150408 dataset, natural killer cells were significantly downregulated in the IDD samples compared to the healthy control samples, while the content of neutrophils was significantly upregulated in the IDD samples (all P <0.05; Figure 2A). In the GSE124272 dataset, T cells, cytotoxic lymphocytes, and natural killer cells were reduced more in the IDD samples than in the healthy control samples, while neutrophils and endothelial cells were more abundant in the IDD samples (all P <0.05; Figure 2B). Furthermore, the ssGSEA approach was used for immune infiltration analysis of 28 immune cells in both the datasets. As shown in Figure 2C, neutrophil and MDSC expression in the GSE150408 cohort was higher in IDD samples than in controls (all P <0.05). For the GSE124272 dataset, the expression levels of activated CD4 T cells and natural killer CD56dim cells in the case samples were lower, while activated dendritic cells and mast cells were upregulated (all P <0.05; Figure 2D). The above results suggest that natural killer cells and neutrophils are robust differentially abundant immune cells in IDD and healthy control samples.
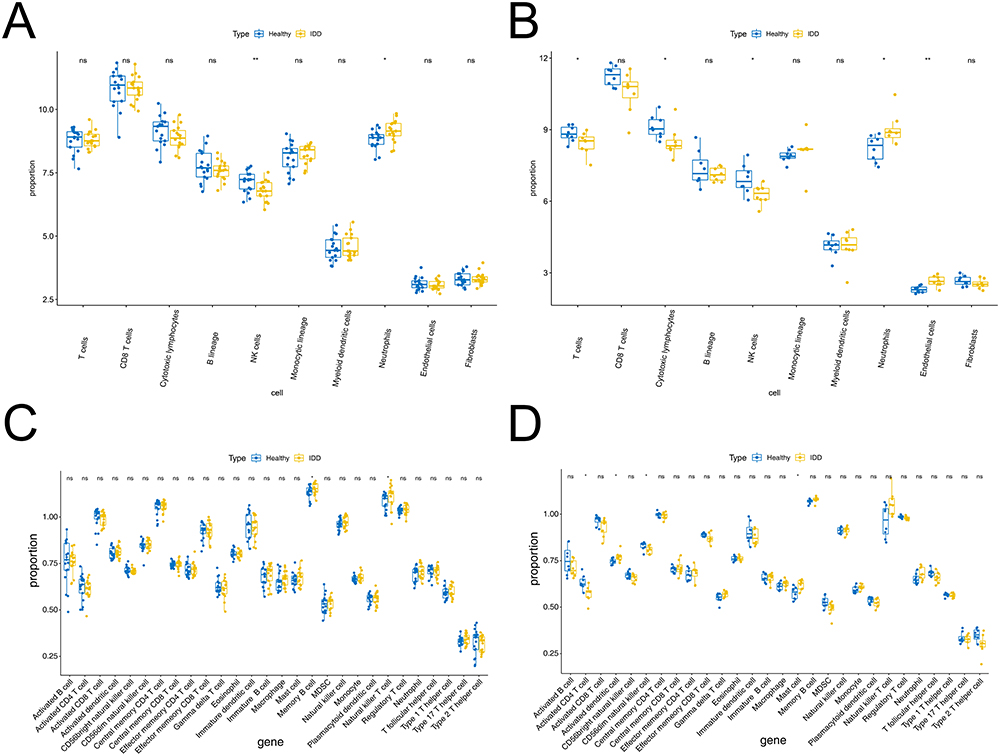 |
Figure 2 Immune cells infiltration was analyzed between the IDD and healthy control groups. (A-B) MCP-counter calculated in the GSE150408 (A) and GSE124272 (B) datasets. (C-D) Box plot of 28 immune cells infiltration between the IDD and healthy control groups through ssGSEA algorithm in GSE150408 (C) and GSE124272 (D). ns represents no significant difference, * P <0.05, ** P <0.01. Abbreviations: IDD, intervertebral disc degeneration; MCP, microenvironment cell population; GSE, Gene Expression Omnibus Series; ssGSEA, single sample gene set enrichment analysis. |
Identification of Immune Cell-Related Hub Genes by WGCNA
We performed WGCNA to identify immune cell-related hub genes. Natural killer cells and neutrophils were used as phenotypic data. To construct a scale-free network, the soft threshold was set to two in the GSE150408 dataset (Figure 3A) and three in the GSE124272 dataset (Figure 3B). Subsequently, 20 and 22 modules were obtained from the GSE150408 (Figure 3C) and GSE124272 (Figure 3D) datasets, respectively, based on the dynamic shear tree algorithm and a MEDissThres of 0.4. In the GSE150408 dataset, the royal-blue module (cor =0.38, P=0.03) was significantly and positively correlated with natural killer cells, and the black (cor =−0.41, P=0.02), green (cor =−0.41, P=0.02), and dark grey (cor =−0.36, P=0.04) modules were significantly and negatively correlated with neutrophils and were considered to be interesting modules (Figure 3E). In the GSE124272 dataset, the black (correlated with neutrophils; cor =0.77, P=5e-04), blue (correlated with neutrophils; cor =−0.86, P=5e-02), coral1 (correlated with natural killer cells; cor =0.6, P=0.02), and light steel-blue1 (correlated with neutrophils; cor =0.86, P=3e-05) modules were considered interesting modules (Figure 3F). We then calculated the values between MM and GS in the modules of interest and obtained hub genes. In the GSE150408 dataset, 22, 100, 100, and 70 hub genes were identified in the royal-blue, black, green, and dark-gray modules, respectively (Figure 4A). In the GSE124272 dataset (Figure 4B), 9802 hub genes were identified in the four modules of interest (black: 2396; blue: 6963; coral1:363; light steel-blue1:80). The genes identified in the modules of interest were referred to as immune cell-related hub genes and used in subsequent analyses.
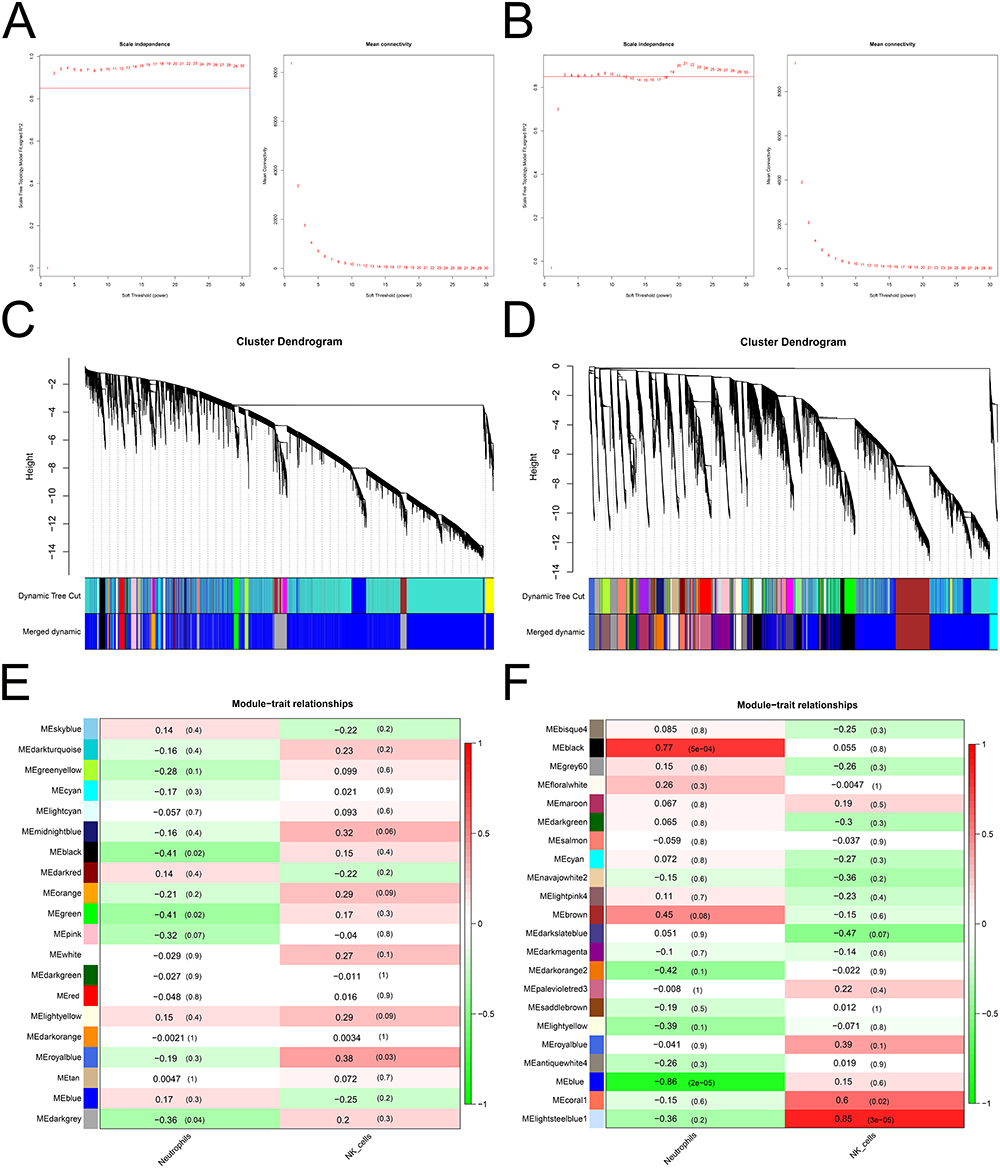 |
Figure 3 Identification of the module and construction of the weighted gene co-expression network involved in IDD. (A-B) Construction of a scale-free network using the GSE150408 (A) and GSE124272 (B) datasets. (C-D) Dendrogram of the genes clustered on the basis of the highly correlated eigengenes in the GSE150408 (C) and GSE124272 (D) datasets. (E-F) Heatmap of the correlations between the module eigengenes and different cells in the GSE150408 (E) and GSE124272 (F) datasets. Abbreviations: IDD, intervertebral disc degeneration; GSE, Gene Expression Omnibus Series. |
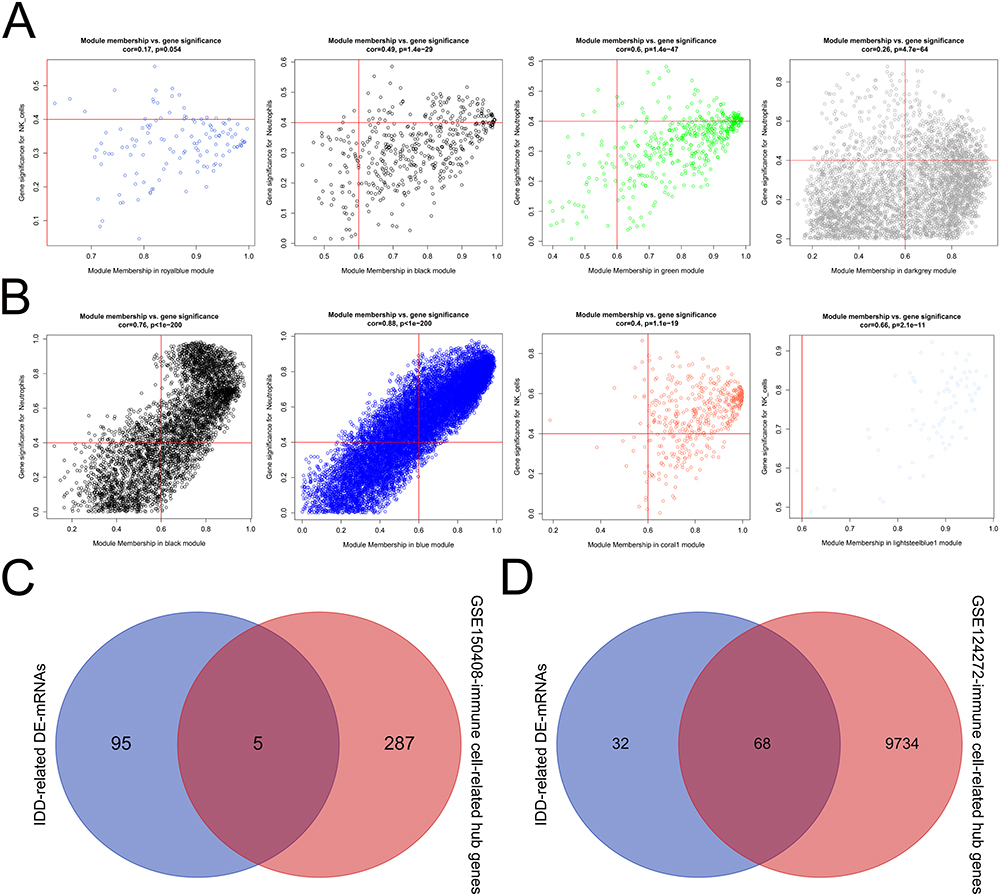 |
Figure 4 The hub gene and reciprocal network. (A-B) Scatter plot of module eigengenes in the royal-blue, black, green, and dark-grey modules of the GSE150408 (A) and GSE124272 (B) datasets. (C-D) Overlap analysis between the IDD-related DE-mRNAs and GSE150408 (C) or GSE124272 (D) -immune cell-related hub genes. (E) The reciprocal network between the IDD- and immune-related hub genes. Abbreviations: IDD, intervertebral disc degeneration; GSE, Gene Expression Omnibus Series. |
Identification and Evaluation of Signature Genes
To identify IDD- and immune-related hub genes, we performed an overlap analysis. As shown in Figure 4C, there were five common genes between IDD-related DE-mRNAs and the GSE150408-immune cell-related hub genes. Additionally, there were 68 common genes between IDD-related DE-mRNAs and the GSE124272-immune cell-related hub genes (Figure 4D). The integration of the above common genes resulted in 68 co-genes, which were defined as IDD- and immune-related hub genes. We also visualized the reciprocal network between these IDD- and immune-related hub genes, which contained 20 nodes and 36 edges, using STRING and Cytoscape software (Supplementary Figure S1). Furthermore, based on the GSE150408 dataset, candidate signature genes from 68 IDD and immune-related hub genes were screened. LASSO regression analysis identified the following 12 candidate signature genes based on a λ min value of 0.042 (Figure 5A): ASAP1-IT1, IKZF2, KLHL14, KRTAP5-7, lnc-C10orf131-1, lnc-TBK1-1, lnc-TNFAIP6-2, lnc-ZNF438-1, LOC101927805, NRCAM, PDGFD, and RGL3. ROC curve analysis showed that the LASSO regression model, which comprised the above-mentioned 12 genes, was able to accurately distinguish between the IDD samples and healthy control samples in the GSE150408 dataset (AUC =1; Figure 5B). The SVM-RFE algorithm identified 59 candidate signature genes using 10-fold cross-validation, at a minimum error rate of 0.138 (Figure 5C). Fourteen candidate signature genes were identified from the 68 IDD and immune-related hub genes by XGBoost analysis (Supplementary Table 2). The ROC curve of the XGboost model had an AUC of 1 (Figure 5D), indicating that this 14-gene based model had a satisfactory ability to identify the sample types. We then performed an overlap analysis to identify the intersection between the LASSO-candidate signature genes, SVM-RFE-candidate signature genes, and XGboost-candidate signature genes. As shown in Figure 5D, five overlapping genes were identified: ASAP1-IT1, IKZF2, KLHL14, lnc-C10orf131-1, and LOC101927805. These five genes were considered as real signature genes.
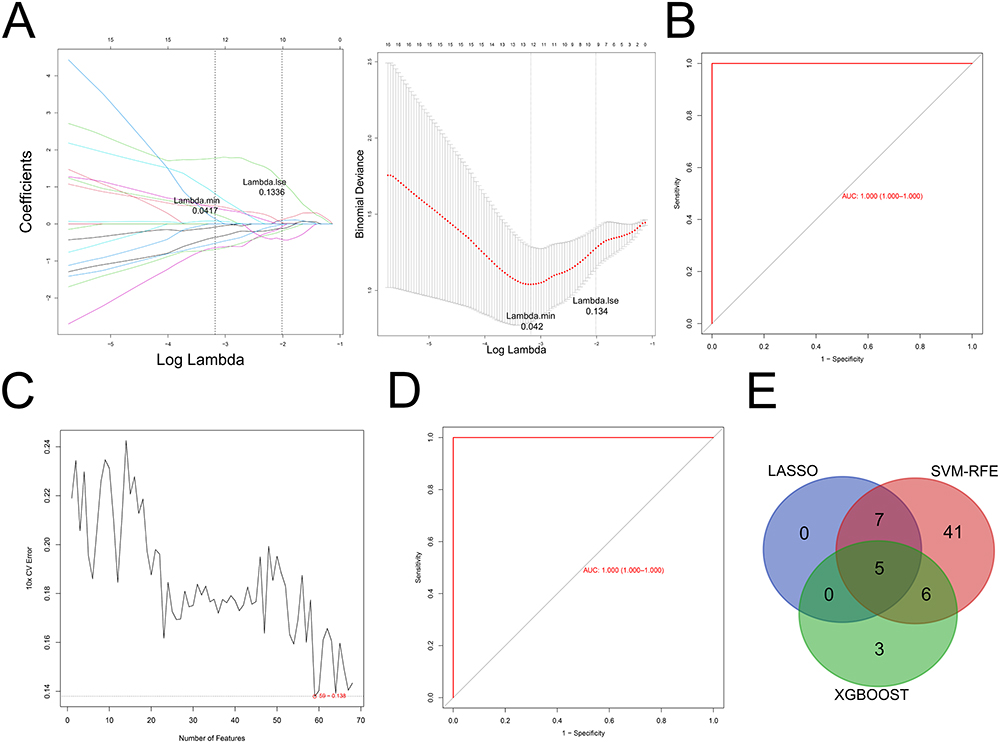 |
Figure 5 Identification of the signature genes. (A) LASSO regression analysis. (B) ROC analysis of 12 candidate signature genes in the LASSO regression model. (C) SVM-RFE algorithm. (D) ROC analysis of 68 candidate signature genes in XGBoost model. (E) Overlap analysis between the LASSO-candidate, SVM-RFE-candidate, and XGBoost-candidate. Abbreviations: LASSO, last absolute convergence and selection operator; SVM-RFE, support vector machine-recursive feature elimination, XGBoost, extreme gradient boosting decision trees; ROC, receiver operating characteristic. |
Next, we evaluated the ability of the five signature genes to distinguish between the IDD samples and healthy control samples in the GSE124272 and GSE150408 datasets. In the GSE150408 dataset, ASAP1-IT1 had the highest accuracy (AUC =0.9), followed by IKZF2 (AUC =0.789), LOC101927805 (AUC =0.751), KLHL14 (AUC =0.74), and lnc-C10orf131-1 (AUC =0.706) (Figure 6A). In the GSE124272 dataset, the ROC curves of all five signature genes had AUC >0.8 (Figure 6B). We then constructed a linear regression model based on the five signature genes, and the ROC curves showed that the 5-gene model had an AUC of 1 in the GSE150408 dataset (Figure 6C) and an AUC of 0.953 in the GSE124272 dataset (Figure 6D). Furthermore, we assessed the differences in expression of the five signature genes between the IDD samples and healthy control samples. Specifically, IKZF2, KLHL14, and LOC101927805 were significantly downregulated in the IDD samples compared to the healthy control samples, whereas lnc-C10orf131-1 and ASAP1-IT1 were significantly upregulated (all P <0.05; Figure 6E-F). This suggested that the five signature genes (ASAP1-IT1, IKZF2, KLHL14, lnc-C10orf131-1, and LOC101927805) could serve as potential diagnostic markers for IDD.
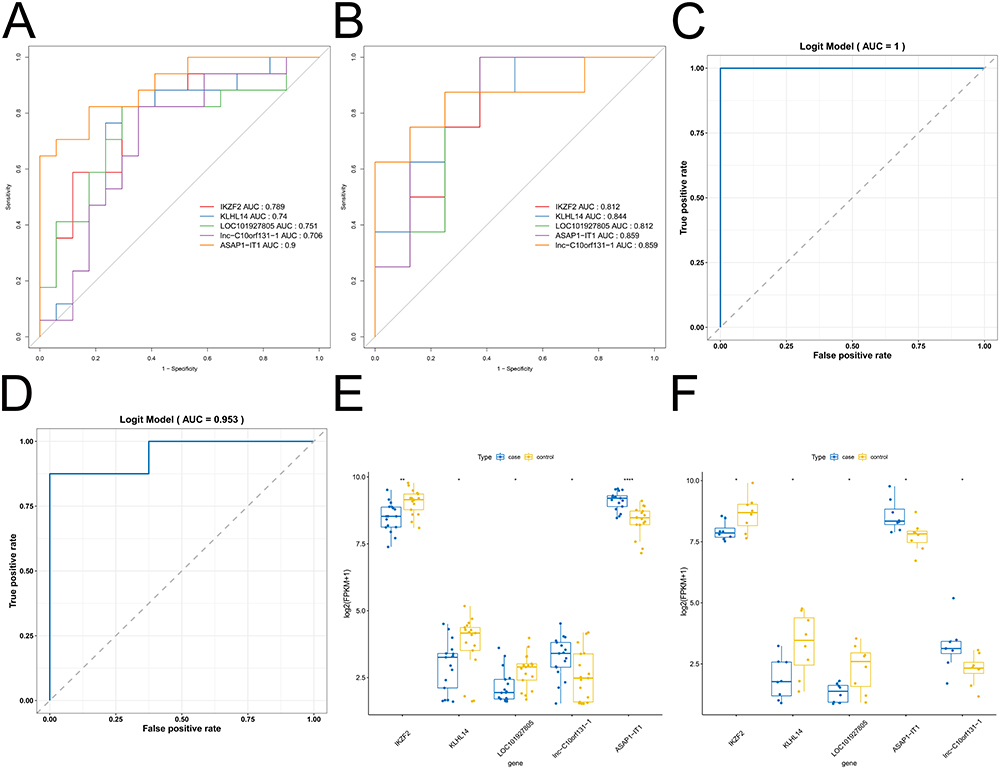 |
Figure 6 Evaluation of the signature genes. (A-B) ROC curve for the diagnostic markers in the GSE150408 (A) and GSE124272 (B) datasets. (C-D) Logistic regression of ROC curve in the GSE150408 (C) and GSE124272 (D) datasets. (E-F) Wilcoxon rank-sum test of diagnostic markers in the GSE150408 (E) and GSE124272 (F) datasets. * P <0.05, ** P <0.01, **** P <0.0001. Abbreviations: ROC, receiver operating characteristic; GSE, Gene Expression Omnibus Series. |
Exploring the Potential Molecular Mechanisms of the 5 Signature Genes
We conducted to examine the potential biological pathways of the five signature genes. Collectively, we found that the five signature genes were significantly associated with the immune response, inflammatory response, and cell cycle-related signaling pathways, including the adaptive immune response, regulation of inflammatory response, and negative regulation of the cell cycle. Supplementary Figure S2 shows the top 10 GO terms enriched by ASAP1-IT1 (Figure S2A), IKZF2 (Figure S2B), KLHL14 (Figure S2C), lnc-C10orf131-1 (Figure S2D), and LOC101927805 (Figure S2E). Kyoto Encyclopedia of Genes and Genomes (KEGG) analysis was also performed using GSEA to reveal the pathways in which the individual signature genes were involved (Supplementary Figure S3). A comprehensive analysis revealed that these signature genes correlated with the immune-inflammatory response, amino acid degradation and metabolism, cell cycle, and multiple disease-related signaling pathways, including antigen processing and presentation, valine leucine and isoleucine degradation, DNA replication, and acute myeloid leukemia-related signaling pathways. Supplementary Figure S2 shows the top 10 pathways, including ASAP1-IT1 (Supplementary Figure S3A), IKZF2 (Supplementary Figure S3B), KLHL14 (Supplementary Figure S3C), lnc-C10orf131-1 (Supplementary Figure S3D), and LOC101927805 (Supplementary Figure S3E).
Co-Expression Network of DE-lncRNA-Signature Genes
After matching the lncRNA expression profiles in the GSE150408 dataset, DE analysis was performed to identify the DE-lncRNAs. We identified 37 DE-lncRNAs and calculated their Pearson’s correlations with the five signature genes. Based on the lncRNA-mRNA regulatory relationship theory, we identified lncRNA-mRNA relationship pairs that had a cor value >0.3 and a P value <0.05. Ultimately, we identified 38 lncRNA-mRNA relationship pairs and visualized the DE-lncRNA-signature gene co-expression network using the Cytoscape software, which contained 29 nodes (5 signature genes and 24 lncRNAs) and 38 edges (Supplementary Figure S4). KLHL14, LOC101927805, and lnc-C10orf131-1 were simultaneously regulated by LINC01560. IFNG-AS1 and PLCG1-AS1 were regulated by IKZF2, KLHL14, and LOC101927805. lnc-C10orf131-1 and ASAP1-IT1 are simultaneously regulated by six lncRNAs. Both FUT8-AS1 and LINC00920 regulate IKZF2 and KLHL14 expression.
Expression Level of Key Differentially Expressed Genes (DEGs)
To further validate the correctness of the analyzed outcomes, the expression of the three DEGs was identified using RT-qPCR. The results showed that three DEGs associated with IDD were upregulated in patients with IDD. Furthermore, the results demonstrated that IKZF2 and KLHL14 were significantly downregulated in IDD patients, while ASAP1-IT1 was significantly upregulated (Figure 7A-C).
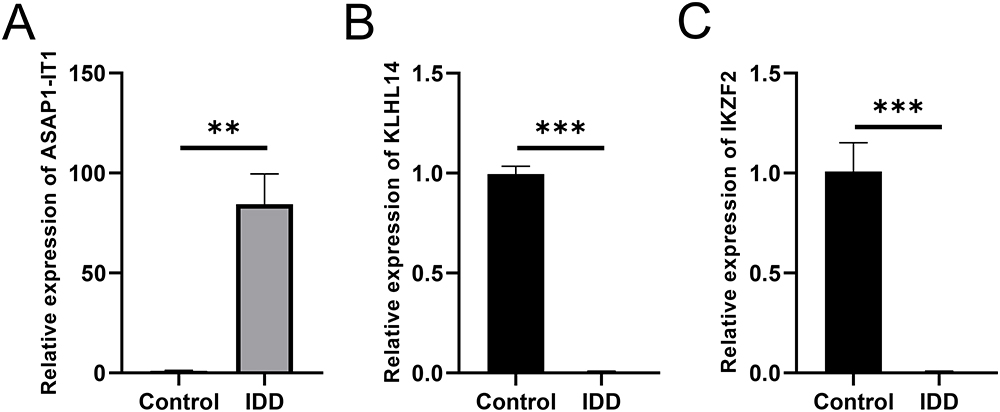 |
Figure 7 Expression level of 3 hub DEGs in healthy control and IDD patients. (A-C) Expression levels of ASAP1-IT1 (A), KLHL14 (B) and IKZF2 (C). N=20, ** P <0.01, *** P <0.001. Abbreviations: DEGs, differentially expressed genes; IDD, intervertebral disc degeneration. |
Discussion
Lumbar disc herniation is often caused by lumbar disc degeneration,23 mechanical overload,24 or trauma.25 When the IVD protrudes, the physical barrier between the IVD and the immune system is broken, and the nucleus pulposus is exposed to the immune system, which in turn causes the expression of chemical and inflammatory factors and infiltration of inflammatory cells.7 Inflammatory cytokines are secreted by the nucleus pulposus, annulus fibrosus, and infiltrating immune cells around herniated IVD. By activating matrix metalloproteinases and other proteases, cytokines cause the decomposition and destruction of the extracellular matrix and increase the recruitment of immune cells, thus forming an immune and inflammatory microenvironment around the IVD.26
There are few reports about natural killer cells in IVD herniations. It has been reported that the activity of natural killer cells is more downregulated in patients with IDD than in healthy individuals.27 In addition to being recognized by macrophages, natural killer cells also have positive cytotoxic effects on nucleus pulposus cells, which may have an immunological function in the early phase of IDD.19 Another bioinformatics analysis reported that the DEGs of IDD patients were involved in natural killer cell-mediated cytotoxicity, which is consistent with our findings.28
Neutrophils have been shown to release proteolytic enzymes to accelerate the degenerative process of the lumbar disc, especially in IDD patients who are cigarette smokers.29 Gorth et al verified that cytokine expression induced by IDD in a mouse model could result in neutrophil infiltration into the disc, which accelerates the process of IDD.30,31 Two recently published WGCNA co-expression analyses revealed that neutrophil activation, regulation of the cytokine-mediated signaling pathway, and apoptosis play important roles in the IDD process, which is consistent with our findings.32,33
Several studies have contended that ncRNAs, including microRNAs and lncRNAs, play significant roles in IDD.34–36 In this study, we found that some lncRNAs were closely related to signature genes. Previous studies have shown that these genes and lncRNAs are involved in the development and progression of several cancers. For example, lncRNA FUT8-AS1 has been shown to inhibit melanoma malignancy by promoting miR-145-5p biogenesis and inhibiting NRAS/MAPK signaling.37 INC00920, which is regulated by ERG, has been shown to increase prostate cancer cell survival via the 14-3-3ε-FOXO pathway.38 LINC00174 has been shown to increase glycolysis and tumor progression by regulating the miR-152-3p/SLC2A1 axis in glioma.39 SGMS1-AS1 has been shown to restrain the development of lung adenocarcinoma via the miR-106a-5p/MYLI9 axis.40 TMEM92-AS1 stimulates gastric cancer progression by binding to YBX1 to mediate CCL5.41 TPRG1-AS1 suppresses liver cancer progression by sponging miR-4691-5p and miR-3659.42 FAM201A has been shown to have a protective effect against interleukin (IL)-1 β-induced chondrocyte injury.43 However, the roles of FUT8-AS1, INC00920, LINC00174, TMEM92-AS1, TPRG1-AS1, and FAM201A in IDD have not yet been reported. As the first well-described lncRNA that enhances interferon (IFN)-γ production in T cells, IFNG-AS1 plays an essential role in TH1 polarization and T-cell effector functions.44 We speculate that IKZF2, KLHL14, and LOC101927805 regulate IDD by regulating T-cell immunity through IFNG-AS1. However, comprehensive and integrated analyses of lncRNAs associated with IDD are lacking.
This study identified signature genes IKZF2, LOC101927805, KLHL14, lnc-C10orf131-1, and ASAP1-IT1. In this study, GSEA results suggested that these five signature genes were mainly involved in NADPH, IgG binding, and immune receptor activity. NADPH oxidase activation and IgG binding have been shown to be associated with IDD.45,46 Collectively, we found that these five signature genes were significantly associated with the immune system, immune-inflammatory responses, skeletal system, cell cycle, amino acid degradation, and metabolism. Thus, we speculated that these five signature genes play crucial roles in IDD by regulating immune feedback and the skeletal system.
Among the hematopoiesis-specific transcription factors that regulate lymphocyte development, IKZF2 belongs to the Ikaros family of zinc-finger proteins. IKZF2 has been widely studied in leukemia and lymphoma, but has seldom been studied in IDD. ZFP36L2 reduces IKZF2 expression and inhibits regulatory T-cell function, indicating that IKZF2 is involved in the post-transcriptional regulation of immunological responses and inflammatory diseases.47 In GSEA, IKZF2 was significantly associated with mitochondrial gene expression, oxidative phosphorylation, and the cytokine-mediated signaling pathway, which participates in IDD.32,48,49
A previous study examined the role of Klhl14 in the IVD and axial skeleton development processes for the first time.50 According to our study, Klhl14 is significantly correlated with ribosome and B cell activation, which are implicated in the process of IDD.51 ASAP1-IT1 expression was associated with the proportion of neutrophils and gamma delta T cells, which was beneficial for regulating the infiltration of immune cells and contributing to the diagnosis and treatment of IDD.33 As for LOC101927805 and lnc-C10orf131-1, no relevant studies have been conducted. Additionally, ASAP1-IT1 and LOC101927805 were found to be associated with the adaptive immune response and DNA repair in GSEA analysis, which is involved in the process of IDD.52,53 Thus, we are the first to find that LOC101927805 and lnc-C10orf131-1 may influence the occurrence and progression of IDD and could potentially be useful in diagnosing IDD.
Molecular markers serve as indicators of biological alterations. The shifts observed in the biomarker spectra within degenerated intervertebral discs and peripheral blood could potentially hold a significant sway in the early identification of IDD).54 Diagnostic value analyses demonstrated that the identified biomarkers exhibit high precision and stability in discerning IDD. Nevertheless, clinical validation is essential to establish these genes as viable therapeutic targets or diagnostic markers. Once clinical verification is complete, the expression patterns of the central genes can be harnessed to formulate pertinent diagnostic markers or biomarkers, which will be instrumental in diagnosing the disease, forecasting its course, and gauging treatment efficacy. On the other hand, by capitalizing on the specific expression patterns of these central genes, drugs can be developed to directly act on them, thereby modulating the immune response and impeding the progression of IDD.
There are also some limitations in the current study, including the small sample size and incomplete clinical parameters of IDD patients. In addition, several studies have focused on biomarkers of IDD involved in autophagy, aging, and lymphatics.55–57. However, we examined the expression and diagnostic value of these hub genes using different machine-learning algorithms and intend to apply more in vitro experiments as well as clinical work to further determine the findings of this study in the future. In addition, the predicted lncRNA-mRNA interactions should be further examined to determine the underlying regulatory mechanism of IDD through subsequent basic experiments. In addition, we will predict potential therapeutic drugs through a drug screening system and verify them at the animal level.
Conclusions
We identified five signature genes and constructed an lncRNA signature gene network to reveal the regulatory mechanisms of the biomarkers. Furthermore, we verified the three signature genes using biological experiments. These verified hub genes may provide important insights into the potential molecular mechanisms of IDD and may reveal new biomarkers for diagnosis.
Data Sharing Statement
The original contributions presented in this study are included in the article/supplementary materials, and further inquiries can be directed to the corresponding author.
Ethics Approval Information
Studies involving humans were approved by the ethics committee of Linfen People’s Hospital (No. E20231128083), and complied with the Declaration of Helsinki. All participants provided written informed consent to participate in this study.
Funding
This study was supported by the Scientific Research Fund of Linfen people’s Hospital (Nos. No. T20220609027, T2023083 and T2023089), the Key Research Project of Linfen City (Nos. No. 2405) and the Basic Research Project of Shanxi Province (Nos. No. 202203021221295).
Disclosure
The authors have no conflicts of interest relevant to this article.
References
1. Cieza A, Causey K, Kamenov K, Hanson SW, Chatterji S, Vos T. Global estimates of the need for rehabilitation based on the Global Burden of Disease study 2019: a systematic analysis for the Global Burden of Disease Study 2019. Lancet. 2021;396(10267):2006–2017. doi:10.1016/S0140-6736(20)32340-0
2. Diseases GBD, Injuries C. Global burden of 369 diseases and injuries in 204 countries and territories, 1990-2019: a systematic analysis for the Global Burden of Disease Study 2019. Lancet. 2020;396(10258):1204–1222. doi:10.1016/S0140-6736(20)30925-9
3. Hartvigsen J, Hancock MJ, Kongsted A, et al. What low back pain is and why we need to pay attention. Lancet. 2018;391(10137):2356–2367. doi:10.1016/s0140-6736(18)30480-x
4. Francisco V, Pino J, Gonzalez-Gay MA, et al. A new immunometabolic perspective of intervertebral disc degeneration. Nat Rev Rheumatol. 2022;18(1):47–60. doi:10.1038/s41584-021-00713-z
5. Zhang Z, Wang Q, Li Y, Li B, Zheng L, He C. Hub genes and key pathways of intervertebral disc degeneration: bioinformatics analysis and validation. Biomed Res Int. 2021;2021(1):5340449. doi:10.1155/2021/5340449
6. Lyu FJ, Cui H, Pan H, et al. Painful intervertebral disc degeneration and inflammation: from laboratory evidence to clinical interventions. Bone Res. 2021;9(1):7. doi:10.1038/s41413-020-00125-x
7. Risbud MV, Shapiro IM. Role of cytokines in intervertebral disc degeneration: pain and disc content. Nat Rev Rheumatol. 2014;10(1):44–56. doi:10.1038/nrrheum.2013.160
8. Brusko GD, Wang MY. Endoscopic lumbar interbody fusion. Neurosurg Clin N Am. 2020;31(1):17–24. doi:10.1016/j.nec.2019.08.002
9. Li Z, Chen X, Xu D, Li S, Chan MTV, Wu WKK. Circular RNAs in nucleus pulposus cell function and intervertebral disc degeneration. Cell Prolif. 2019;52(6):e12704. doi:10.1111/cpr.12704
10. Tendulkar G, Chen T, Ehnert S, Kaps HP, Nussler AK. Intervertebral disc nucleus repair: hype or hope? Int J mol Sci. 2019;20(15):3622. doi:10.3390/ijms20153622
11. Starkweather A, Witek-Janusek L, Mathews HL. Neural-immune interactions: implications for pain management in patients with low-back pain and sciatica. Biol Res Nurs. 2005;6(3):196–206. doi:10.1177/1099800404272221
12. Molinos M, Almeida CR, Caldeira J, Cunha C, Goncalves RM, Barbosa MA. Inflammation in intervertebral disc degeneration and regeneration. J R Soc Interface. 2015;12(108):20150429. doi:10.1098/rsif.2015.0429
13. Evans C. Potential biologic therapies for the intervertebral disc. J Bone Joint Surg Am. 2006;88(Suppl 2):95–98. doi:10.2106/JBJS.E.01328
14. Kobayashi S, Meir A, Kokubo Y, et al. Ultrastructural analysis on lumbar disc herniation using surgical specimens: role of neovascularization and macrophages in hernias. Spine (Phila Pa 1976). 2009;34(7):655–662. doi:10.1097/BRS.0b013e31819c9d5b
15. Koike Y, Uzuki M, Kokubun S, Sawai T. Angiogenesis and inflammatory cell infiltration in lumbar disc herniation. Spine (Phila Pa 1976). 2003;28(17):1928–1933. doi:10.1097/01.BRS.0000083324.65405.AE
16. Ling Z, Liu Y, Wang Z, et al. Single-cell RNA-seq analysis reveals macrophage involved in the progression of human intervertebral disc degeneration. Front Cell Dev Biol. 2021;9:833420. doi:10.3389/fcell.2021.833420
17. Geiss A, Larsson K, Junevik K, Rydevik B, Olmarker K. Autologous nucleus pulposus primes T cells to develop into interleukin-4-producing effector cells: an experimental study on the autoimmune properties of nucleus pulposus. J Orthop Res. 2009;27(1):97–103. doi:10.1002/jor.20691
18. Virri J, Gronblad M, Seitsalo S, Habtemariam A, Kaapa E, Karaharju E. Comparison of the prevalence of inflammatory cells in subtypes of disc herniations and associations with straight leg raising. Spine (Phila Pa 1976). 2001;26(21):2311–2315. doi:10.1097/00007632-200111010-00004
19. Murai K, Sakai D, Nakamura Y, et al. Primary immune system responders to nucleus pulposus cells: evidence for immune response in disc herniation. Eur Cell Mater. 2010;19:13–21. doi:10.22203/ecm.v019a02
20. Wang C, Zhao X, Zhang H, et al. Comprehensive analysis of immune-related genes associated with the microenvironment of patients with unexplained infertility. Ann translat Med. 2023;11(2):84. doi:10.21037/atm-22-5810
21. Becht E, Giraldo NA, Lacroix L, et al. Estimating the population abundance of tissue-infiltrating immune and stromal cell populations using gene expression. Genome Biol. 2016;17(1):218. doi:10.1186/s13059-016-1070-5
22. Pfirrmann CW, Metzdorf A, Zanetti M, Hodler J, Boos N. Magnetic resonance classification of lumbar intervertebral disc degeneration. Spine. 2001;26(17):1873–1878. doi:10.1097/00007632-200109010-00011
23. Sollmann N, Weidlich D, Cervantes B, et al. T2 mapping of lumbosacral nerves in patients suffering from unilateral radicular pain due to degenerative disc disease. J Neurosurg Spine. 2019;1–9. doi:10.3171/2018.10.Spine181172.
24. Paul CP, de Graaf M, Bisschop A, et al. Static axial overloading primes lumbar caprine intervertebral discs for posterior herniation. PLoS One. 2017;12(4):e0174278. doi:10.1371/journal.pone.0174278
25. Yamaguchi JT, Hsu WK. Intervertebral disc herniation in elite athletes. Int Orthop. 2019;43(4):833–840. doi:10.1007/s00264-018-4261-8
26. Johnson ZI, Doolittle AC, Snuggs JW, Shapiro IM, Le Maitre CL, Risbud MV. TNF-α promotes nuclear enrichment of the transcription factor TonEBP/NFAT5 to selectively control inflammatory but not osmoregulatory responses in nucleus pulposus cells. J Biol Chem. 2017;292(42):17561–17575. doi:10.1074/jbc.M117.790378
27. Sato N, Kikuchi S, Sato K. Quantifying the stress induced by distress in patients with lumbar disc herniation in terms of natural killer cell activity measurements: chromium release assay versus multiparameter flow cytometric assay. Spine. 2002;27(19):2095–2100. doi:10.1097/00007632-200210010-00004
28. Liu C, Chen N, Huang K, et al. Identifying hub genes and potential mechanisms associated with senescence in human annulus cells by gene expression profiling and bioinformatics analysis. Mol Med Rep. 2018;17(3):3465–3472. doi:10.3892/mmr.2017.8322
29. Fogelholm RR, Alho AV. Smoking and intervertebral disc degeneration. Med Hypotheses. 2001;56(4):537–539. doi:10.1054/mehy.2000.1253
30. Gorth DJ, Shapiro IM, Risbud MV. Transgenic mice overexpressing human TNF-alpha experience early onset spontaneous intervertebral disc herniation in the absence of overt degeneration. Cell Death Dis. 2018;10(1):7. doi:10.1038/s41419-018-1246-x
31. Gorth DJ, Shapiro IM, Risbud MV. A new understanding of the role of IL-1 in age-related intervertebral disc degeneration in a murine model. J Bone Mineral Res. 2019;34(8):1531–1542. doi:10.1002/jbmr.3714
32. Li H, Li W, Zhang L, et al. Comprehensive network analysis identified SIRT7, NTRK2, and CHI3L1 as new potential markers for intervertebral disc degeneration. J Oncol. 2022;2022:4407541. doi:10.1155/2022/4407541
33. Ma X, Su J, Wang B, Jin X. Identification of characteristic genes in whole blood of intervertebral disc degeneration patients by Weighted Gene Coexpression Network Analysis (WGCNA). Comput. Math. Methods Med. 2022;2022:6609901. doi:10.1155/2022/6609901
34. Li Z, Yu X, Shen J, Chan MT, Wu WK. MicroRNA in intervertebral disc degeneration. Cell Prolif. 2015;48(3):278–283. doi:10.1111/cpr.12180
35. Chen WK, Yu XH, Yang W, et al. lncRNAs: novel players in intervertebral disc degeneration and osteoarthritis. Cell Prolif. 2017;50(1). doi:10.1111/cpr.12313
36. Ji ML, Jiang H, Zhang XJ, et al. Preclinical development of a microRNA-based therapy for intervertebral disc degeneration. Nat Commun. 2018;9(1):5051. doi:10.1038/s41467-018-07360-1
37. Chen XJ, Liu S, Han DM, et al. FUT8-AS1 inhibits the malignancy of melanoma through promoting miR-145-5p biogenesis and suppressing NRAS/MAPK Signaling. Front Oncol. 2020;10:586085. doi:10.3389/fonc.2020.586085
38. Angeles AK, Heckmann D, Flosdorf N, Duensing S, Sultmann H. The ERG-Regulated LINC00920 promotes prostate cancer cell survival via the 14-3-3epsilon-FOXO pathway. mol Cancer Res. 2020;18(10):1545–1559. doi:10.1158/1541-7786.MCR-20-0021
39. Shi J, Zhang Y, Qin B, Wang Y, Zhu X. Long non-coding RNA LINC00174 promotes glycolysis and tumor progression by regulating miR-152-3p/SLC2A1 axis in glioma. J Exp Clin Cancer Res. 2019;38(1):395. doi:10.1186/s13046-019-1390-x
40. Liu T, Yang C, Wang W, Liu C. LncRNA SGMS1-AS1 regulates lung adenocarcinoma cell proliferation, migration, invasion, and EMT progression via miR-106a-5p/MYLI9 axis. Thorac Cancer. 2021;12(14):2104–2112. doi:10.1111/1759-7714.14043
41. Song S, He X, Wang J, et al. A novel long noncoding RNA, TMEM92-AS1, promotes gastric cancer progression by binding to YBX1 to mediate CCL5. Mol Oncol. 2021;15(4):1256–1273. doi:10.1002/1878-0261.12863
42. Choi JH, Kwon SM, Moon SU, et al. TPRG1-AS1 induces RBM24 expression and inhibits liver cancer progression by sponging miR-4691-5p and miR-3659. Liver Int. 2021;41(11):2788–2800. doi:10.1111/liv.15026
43. Gan K, Wu W, Li J, et al. Positive feedback loop of lncRNA FAM201A/miR‑146a‑5p/POU2F1 regulates IL‑1β‑induced chondrocyte injury in vitro. Mol Med Rep. 2022;25(1). doi:10.3892/mmr.2021.12536
44. Zeni PF, Mraz M. LncRNAs in adaptive immunity: role in physiological and pathological conditions. RNA Biol. 2021;18(5):619–632. doi:10.1080/15476286.2020.1838783
45. Ge J, Chen L, Yang Y, Lu X, Xiang Z. Sparstolonin B prevents lumbar intervertebral disc degeneration through toll like receptor 4, NADPH oxidase activation and the protein kinase B signaling pathway. Mol Med Rep. 2018;17(1):1347–1353. doi:10.3892/mmr.2017.7966
46. Rajasekaran S, Soundararajan DCR, Nayagam SM, et al. Modic changes are associated with activation of intense inflammatory and host defense response pathways - molecular insights from proteomic analysis of human intervertebral discs. Spine J. 2022;22(1):19–38. doi:10.1016/j.spinee.2021.07.003
47. Makita S, Takatori H, Nakajima H. Post-transcriptional regulation of immune responses and inflammatory diseases by RNA-binding ZFP36 family proteins. Front Immunol. 2021;12:711633. doi:10.3389/fimmu.2021.711633
48. Gruber HE, Watts JA, Hoelscher GL, et al. Mitochondrial gene expression in the human annulus: in vivo data from annulus cells and selectively harvested senescent annulus cells. Spine J. 2011;11(8):782–791. doi:10.1016/j.spinee.2011.06.012
49. Wang D, Hartman R, Han C, et al. Lactate oxidative phosphorylation by annulus fibrosus cells: evidence for lactate-dependent metabolic symbiosis in intervertebral discs. Arthritis Res Ther. 2021;23(1):145. doi:10.1186/s13075-021-02501-2
50. Kraus P, Sivakamasundari V, Olsen V, Villeneuve V, Hinds A, Lufkin T. Klhl14 Antisense RNA is a target of key skeletogenic transcription factors in the developing intervertebral disc. Spine. 2019;44(5):E260–E268. doi:10.1097/BRS.0000000000002827
51. Gao C, Ning B, Sang C, Zhang Y. Rapamycin prevents the intervertebral disc degeneration via inhibiting differentiation and senescence of annulus fibrosus cells. Aging (Albany NY). 2018;10(1):131–143. doi:10.18632/aging.101364
52. Shamji MF, Setton LA, Jarvis W, et al. Proinflammatory cytokine expression profile in degenerated and herniated human intervertebral disc tissues. Arthritis Rheum. 2010;62(7):1974–1982. doi:10.1002/art.27444
53. Cong L, Zhang XL, Wang XK, et al. Upregulation of FoxO6 in nucleus pulposus cells promotes DNA damage repair via activation of RAD51. Eur Rev Med Pharmacol Sci. 2021;25(17):5392–5401. doi:10.26355/eurrev_202109_26646
54. Kamali A, Ziadlou R, Lang G, et al. Small molecule-based treatment approaches for intervertebral disc degeneration: current options and future directions. Theranostics. 2021;11(1):27–47. doi:10.7150/thno.48987
55. Wang Y, Wang Z, Tang Y, et al. Diagnostic model based on key autophagy-related genes in intervertebral disc degeneration. BMC Musculoskelet Disord. 2023;24(1):927. doi:10.1186/s12891-023-06886-w
56. Gao H, Dong G, Yao Y, Yang H. Identification and validation of aging-related genes in neuropathic pain using bioinformatics. Front Genet. 2024;15:1430275. doi:10.3389/fgene.2024.1430275
57. Lin M, Li S, Wang Y, et al. Machine learning-based diagnostic model of lymphatics-associated genes for new therapeutic target analysis in intervertebral disc degeneration. Front Immunol. 2024;15:1441028. doi:10.3389/fimmu.2024.1441028
 © 2025 The Author(s). This work is published and licensed by Dove Medical Press Limited. The
full terms of this license are available at https://www.dovepress.com/terms.php
and incorporate the Creative Commons Attribution
- Non Commercial (unported, 3.0) License.
By accessing the work you hereby accept the Terms. Non-commercial uses of the work are permitted
without any further permission from Dove Medical Press Limited, provided the work is properly
attributed. For permission for commercial use of this work, please see paragraphs 4.2 and 5 of our Terms.
© 2025 The Author(s). This work is published and licensed by Dove Medical Press Limited. The
full terms of this license are available at https://www.dovepress.com/terms.php
and incorporate the Creative Commons Attribution
- Non Commercial (unported, 3.0) License.
By accessing the work you hereby accept the Terms. Non-commercial uses of the work are permitted
without any further permission from Dove Medical Press Limited, provided the work is properly
attributed. For permission for commercial use of this work, please see paragraphs 4.2 and 5 of our Terms.
Recommended articles
Manuscript Title: A 4-miRNAs Serum Panel for Obstructive Sleep Apnea Syndrome Screening
Mo J, Zeng C, Li W, Song W, Xu P
Nature and Science of Sleep 2022, 14:2055-2064
Published Date: 9 November 2022
Elucidating the Gene Signatures and Immune Cell Types in HIV-Infected Immunological Non-Responders by Bioinformatics Analyses
Xiao Q, Han J, Yu F, Yan L, Li Q, Lao X, Zhao H, Zhang F
International Journal of General Medicine 2022, 15:8491-8507
Published Date: 7 December 2022
Decoding the Intercellular Cross-Talking Between Immune Cells and Renal Innate Cells in Diabetic Kidney Disease by Bioinformatics
Zhou M, Lu F, Jiang L, Chen C, Chen S, Geng L, Sun R, Li Q, Duan S, Zhang B, Mao H, Xing C, Yuan Y
Journal of Inflammation Research 2023, 16:3049-3062
Published Date: 21 July 2023
Identification of Critical Biomarkers and Mechanisms of Fructus Ligustri Lucidi on Vitiligo Using Integrated Bioinformatics Analysis

Liang TS, Tang N, Xian MH, Wen WL, Huang CJ, Cai LH, Li QL, Wu YH
Clinical, Cosmetic and Investigational Dermatology 2023, 16:2061-2071
Published Date: 7 August 2023
Network Analysis of Osteoarthritis Progression Using a Steiner Minimal Tree Algorithm
Xie Y, Shao F, Ji Y, Feng D, Wang L, Huang Z, Wu S, Sun F, Jiang H, Miyamoto A, Wang H, Zhang C
Journal of Inflammation Research 2024, 17:3201-3209
Published Date: 18 May 2024