")
Back to Journals » Diabetes, Metabolic Syndrome and Obesity » Volume 17
Insulin Resistance Surrogates May Predict HTN-HUA in Young, Non-Obese Individuals
Authors Zuo YQ , Gao ZH , Yin YL, Yang X, Guan X, Feng PY
Received 10 June 2024
Accepted for publication 24 September 2024
Published 28 September 2024 Volume 2024:17 Pages 3593—3601
DOI https://doi.org/10.2147/DMSO.S482184
Checked for plagiarism Yes
Review by Single anonymous peer review
Peer reviewer comments 3
Editor who approved publication: Prof. Dr. Antonio Brunetti
Yu-Qiang Zuo,1 Zhi-Hong Gao,1 Yu-Ling Yin,1 Xu Yang,1 Xing Guan,2 Ping-Yong Feng3
1Department of Physical Examination Center, The 2nd Hospital of Hebei Medical University, Shijiazhuang, Hebei, People’s Republic of China; 2Department of Physical Examination Center, The People’s Hospital of Shijiazhuang City, Shijiazhuang, Hebei, People’s Republic of China; 3Department of Imaging Center, The 2nd Hospital of Hebei Medical University, Shijiazhuang, Hebei, People’s Republic of China
Correspondence: Ping-Yong Feng, Department of Imaging Center, The 2 nd Hospital of Hebei Medical University, and the Master Instructor of MM of the Imaging Medicine, Shijiazhuang, Hebei, People’s Republic of China, Email [email protected]
Objective: To compare the associations of three surrogate markers of insulin resistance (IR) [glucose and triglycerides (TyG index), TyG index with BMI (TyG-BMI), and the ratio of triglycerides divided by HDL-C (TG/HDL-C)] with hypertensive patients (HTN) plus hyperuricemia (HUA) (HTN-HUA) in young, non-obese individuals.
Methods: Data from a cross-sectional epidemiological study of an annual health check-up population aged younger than 66 years were used to calculate the three IR surrogate indexes. The association with HTN-HUA and insulin resistance surrogates was examined with multinomial logistic regression and a receiver operating characteristic (ROC) curve.
Results: A total of 6952 participants were included, including 671 (9.65%) participants with HTN alone, 272 (3.91%) participants with HUA alone, and 62 (0.90%) participants with HTN and HUA. Binary multiple-logistic regression results showed that TG/HDL-C was significantly correlated with HTN, HUA, and HTN-HUA. Compared with the lowest quartile, the odds ratios (95% CI) of the highest quartile of TG/HDL-C for HTN-HUA were 3.462 (1.138~10.530). TG/HDL-C and TyG-BMI had moderate discriminative abilities for HTN-HUA, and the area under the curve was 0.748 (0.682~0.815), 0.746 (0.694~0.798).
Conclusion: Our study suggests that TG/HDL-C had a significant correlation with HTN-HUA and that TG/HDL-C had moderate discriminative abilities for HTN-HUA.
Keywords: insulin resistance, TyG index, TG/HDL-C ratio, HTN-HUA
Introduction
Hypertension (HTN) is a major cause of morbidity and mortality, with 8.5 million deaths worldwide from stroke, ischemic heart disease, other vascular diseases, and renal disease.1,2 The number of HTN patients worldwide has doubled since 1990.2 In China, the crude or age-standardized HTN prevalence increased from 14.0% to 15.3% to 34.1% to 25.6% from 1991 to 2015.3 Uric acid, the end-product of purine metabolism in humans, may play a role in developing cardiovascular diseases such as HTN, atrial fibrillation, chronic kidney disease, heart failure, coronary artery disease, and cardiovascular death.4 Although the relationship of hyperuricemia (HUA) to HTN is still controversial, there has been a growing interest in uric acid due to the increased prevalence of HUA worldwide.4–6
Insulin resistance (IR) is a systemic disorder that affects many organs and plays a vital role in the pathogenesis of HTN and HUA.7–9 The key mechanisms links IR and HTN, HUA may be as following: Inappropriate activation of the renin-angiotensin-aldosterone system (RAAS), impaired Nitric Oxide (NO) production, oxidative stress and systemic inflammation.10 Homeostasis model assessment insulin resistance is usually used to measure IR in work, but it is not suitable for large-scale screening. Therefore, some scholars proposed alternative indicators to measure IR, including the ratio of triglycerides divided by HDL-C (TG/HDL-C),11 the production of glucose and triglycerides (TyG index),12 and TyG index with BMI (TyG-BMI).13 All these indices serve as valuable tools in clinical practice for early detection and management of insulin resistance and its related complications, such as hypertension, hyperuricemia, and type 2 diabetes.
Although some studies have investigated the association of IR surrogates with HTN, HUA, or HTN-HUA, the results still need confirmation in a large-scale population. HTN and HUA are known to be correlated with obesity and age,14–16 so whether the association is still applicable to a population young non-obese individuals is uncertain. And many non-obese people believe that they do not have insulin resistance or hypertension, hyperuricemia. So we choose the non-obese young individuals as the participants. This study was conducted using data from annual health check-up populations to investigate the association of the three IR surrogates and HTN-HUA and to find the best predictor of HTN-HUA in young, non-obese individuals.
Materials and Methods
Study Population
This retrospective study included 6952 asymptomatic young individuals who underwent annual health check-ups at the Second Hospital of Hebei Medical University from January to December 2021. The participants are non-obese individuals (18.5≤BMI<24 kg/m2) and completed clinical data. Exclusion criteria were secondary hypertension, renal artery stenosis, primary glomerular diseases, liver or renal insufficiency, thyroid disease, malignant tumors, and use of lipid-lowering or uric acid-lowering drugs in the past month. Antihypertensive drugs, including diuretics, ACEI, ARB, and CCB, and hypoglycemic drugs, including a-glucosidase inhibitors, insulin sensitizers, dipeptidyl peptidase 4 (DPP-4) inhibitors, may affect serum uric acid levels; Therefore, in this study, all included participants were recorded on the use of antihypertensive and hypoglycemic drugs as pointed out above were excluded. The study was approved by the Research Ethics Committee of the second hospital of Hebei Medical University (Approval No.2022-R341), and the requirement for patient informed consent was waived due to the retrospective nature of review. This study adhered to the principles outlined in the Declaration of Helsinki, and all patient-identifying information was removed from the database.
Data Collection
Data collected from the participants included age, sex, weight, height, pulse, systolic and diastolic blood pressure, triglycerides, total cholesterol, high-density lipoprotein cholesterol, low-density lipoprotein cholesterol, serum uric acid, serum creatinine, urea, fasting blood glucose, smoking and drinking status, menopause status, and medical and medication history. The young age ranged from 18–65 years as WHO declared that 65 years is still consider young.
Measurement Methods and Diagnosis Criteria
After a 5-minute rest, blood pressure was measured in the right arm of seated participants using an electronic sphygmomanometer. Two measurements were taken 2 minutes apart, and the mean was calculated. Hypertension was defined as an average systolic blood pressure ≥140mmHg or diastolic blood pressure ≥90mmHg, a self-reported history of hypertension, or current use of antihypertensive agents.17,18 Hyperuricemia was defined as two non-fasting serum uric acid levels ≥420umol/L.19 Diabetes was defined as fasting blood glucose ≥7.0 mmol/L, self-reported history of diabetes, or current use of anti-diabetic agents.20 Insulin resistance surrogates were calculated using the following formulas: TyG=ln[TG(mg/dL)×FPG(mg/dL)/2], TyG-BMI=TyG×BMI, and TG/HDL-C=TG(mg/dL)/HDL-C(mg/dL). Sample size calculation in this study was based on the ability to detect the HTN, HUA, HTN-HUA at least of 0.75 (probability of type I error =0.01, power=0.99).
Statistical Analysis
Statistical analyses were conducted using IBM SPSS Statistics 25.0 software (IBM Corp., Armonk, NY, USA) and MedCalc 16.8 software (MedCalc Software Ltd., Ostend, Belgium). Categorical variables were presented as numbers (percentages), and the Chi-Square (χ2) test was used to compare categorical variables. The normality of continuous variables was assessed using the Kolmogorov–Smirnov test. Data that did not conform to a normal distribution were presented as medians with interquartile range (M, IQR), and were compared using the Kruskal-Willi’s test. Receiver operating characteristic (ROC) analyses and the area under the curves (AUC) were used to evaluate the ability of the insulin resistance surrogates to discriminate hyperuricemia, hypertension, and hyperuricemia plus hypertension. The AUC was compared using the DeLong test via MedCalc software. Graphs were created using Graphpad Prism software (Graphpad, Inc., La Jolla, CA, USA). All p-values were two-sided, and p<0.05 was considered statistically significant.
Results
Basic Characteristics
Table 1 summarizes the baseline characteristics of all study participants. A total of 6,952 participants were included, including 733 (10.54%) with HTN and 334 (4.80%) with HUA. The incidence of HUA in the HTN patients was 8.46% (62/733). The Kruskal-Willi’s test results showed that the proportion of participants taking antidiabetic agents among the four groups was not statistically significant (p>0.05). Compared to the normal group, the male composition ratio, age, BMI, uric acid, serum creatinine, FPG, SBP, DBP, TG, HDL-C, LDL-C, TC, proportion of smoking, and proportion of drinking were higher in the HTN and HUA plus HTN groups than in the control group, and there were statistically significant differences (all p<0.05). The difference in TG/HDL-C among the HUA plus HTN group was higher than the other three groups and was statistically significant (all p<0.05). However, there was no significant difference in TyG and TyG-BMI between the HTN and HUA plus HTN groups (both p>0.05). Figure 1 shows the TyG, TG/HDL-C, and TyG-BMI values in the separate groups, with the TG/HDL-C value in the HUA plus HTN group being higher than the other three groups.
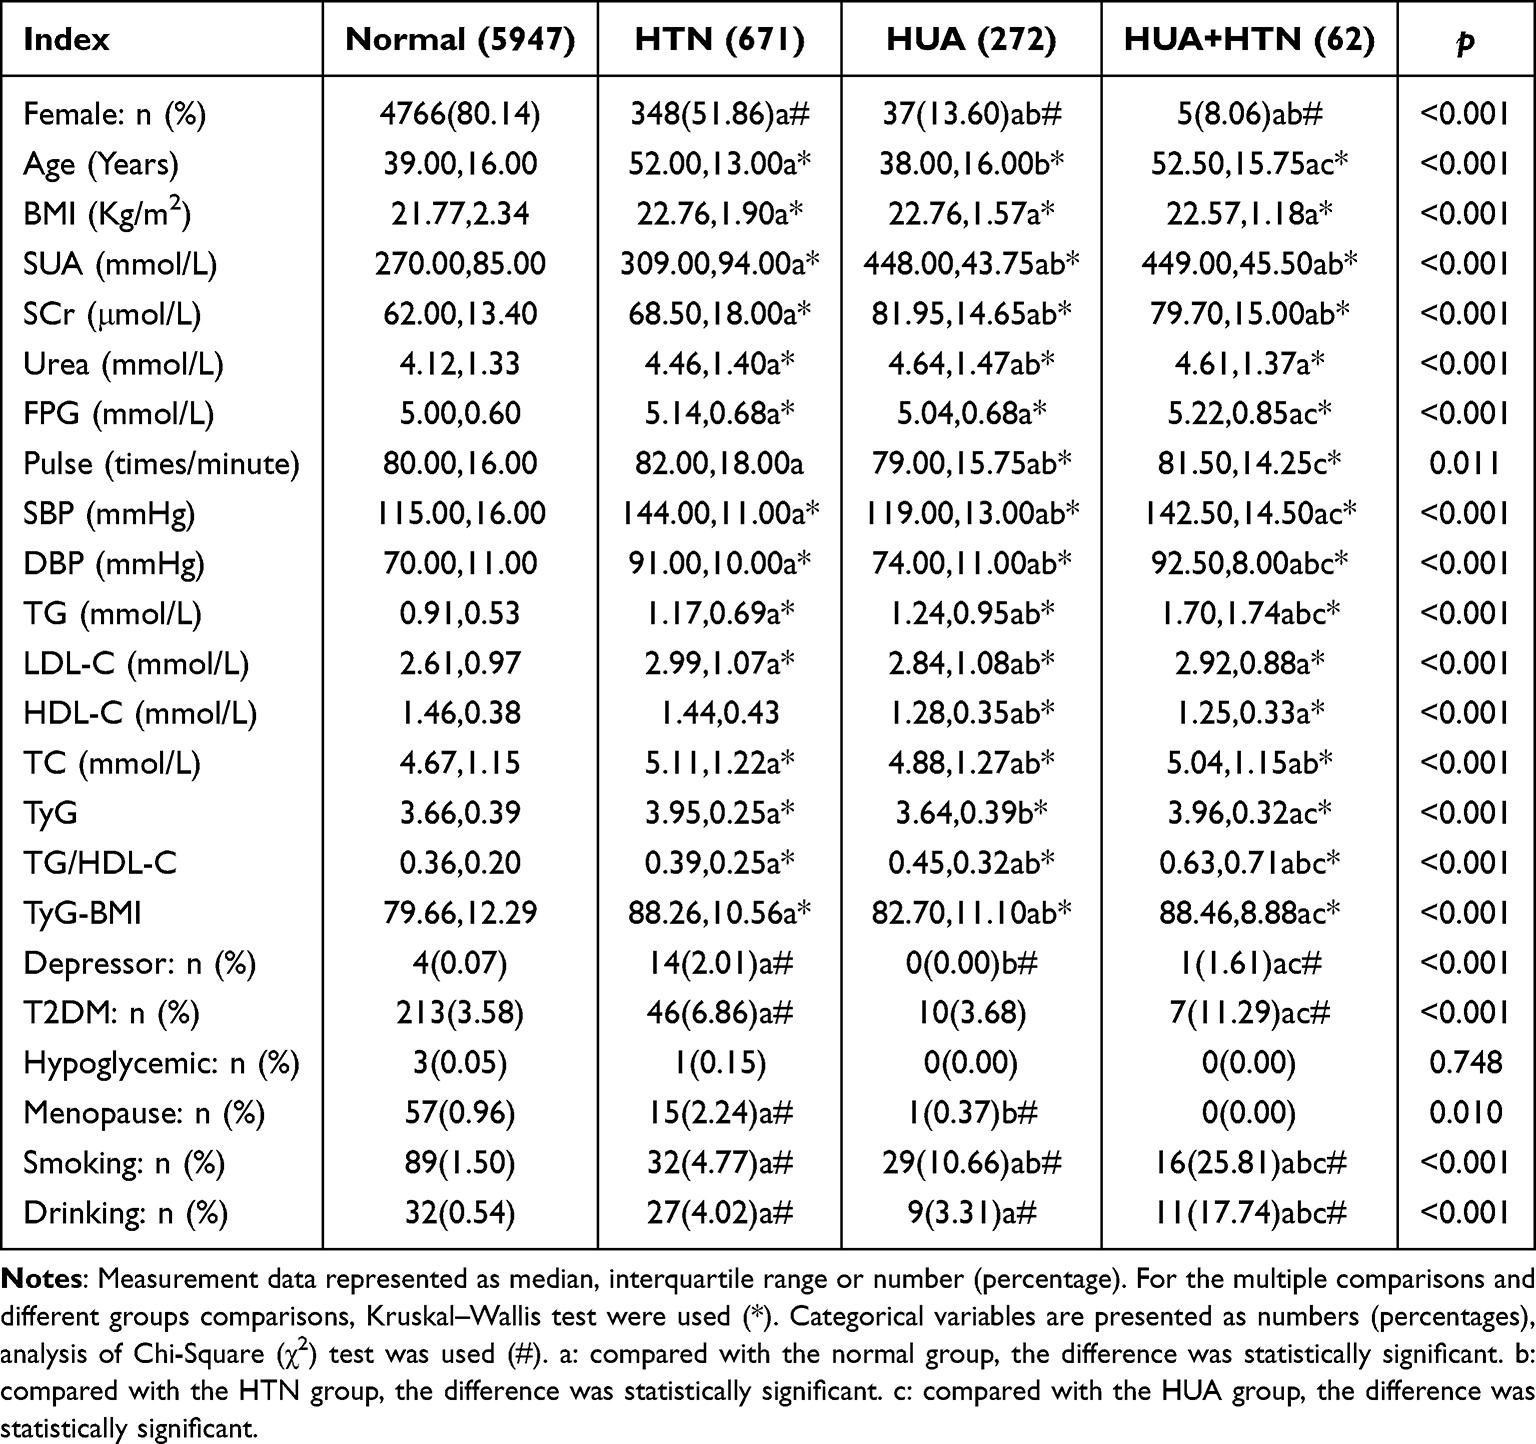 |
Table 1 General Information and Clinical Data of Participants |
 |
Figure 1 TyG, TG/HDL-C and TyG-BMI values in different groups The bold dash lines indicate median and thin dash lines indicate quantiles. |
Association Between TyG, TG/HDL-C, and TyG-BMI and Risks of HTN, HUA, and HUA+HTN
Table 2 shows the multivariable analysis of the association between TyG, TG/HDL-C, TyG-BMI, and the risks of HTN, HUA, and HUA+HTN. The highest quartiles versus the lowest quartile were used to determine the ORs and 95% CI. In order to explore the true association between the TyG, TG/HDL-C, TyG-BMI and HTN, HUA HUA+HTN, we constructed three models, model 1(crude), model 2 (adjusted by Sex, Age, Drinking, Smoking, Menopause status) and model 3 (adjusted by Sex, Age, Drinking, Smoking, Menopause status, LDL-C and TC). The results of the multiple variable analysis showed that in model 1 (crude), both TG/HDL-C and TyG-BMI were correlated with HTN, HUA, and HUA+HTN, but TyG was not correlated with HUA. In model 2, TG/HDL-C and TyG-BMI were adjusted for sex, age, smoking status, and drinking status. The results showed that TG/HDL-C was still significantly correlated with HTN and HUA+HTN, but TyG-BMI was no longer correlated with HUA+HTN. In model 3, TG/HDL-C was adjusted for sex, age, smoking status, drinking status, TC, and LDL-C. The results showed that TG/HDL-C still significantly correlated with HUA, HTN, and HUA+HTN. The ORs (95% CI) of the highest quartile for HUA, HTN, and HUA+HTN were 2.499 (1.681~3.716), 1.537 (1.189~1.988), and 3.462 (1.138~10.530), respectively (all p<0.05). But, compared with TG/HDL-C ratio, the TyG-BMI had a larger odds ratio (2.082 vs 1.537) and more significant discriminative ability (0.750 vs.0.580) for HTN (all p<0.05).
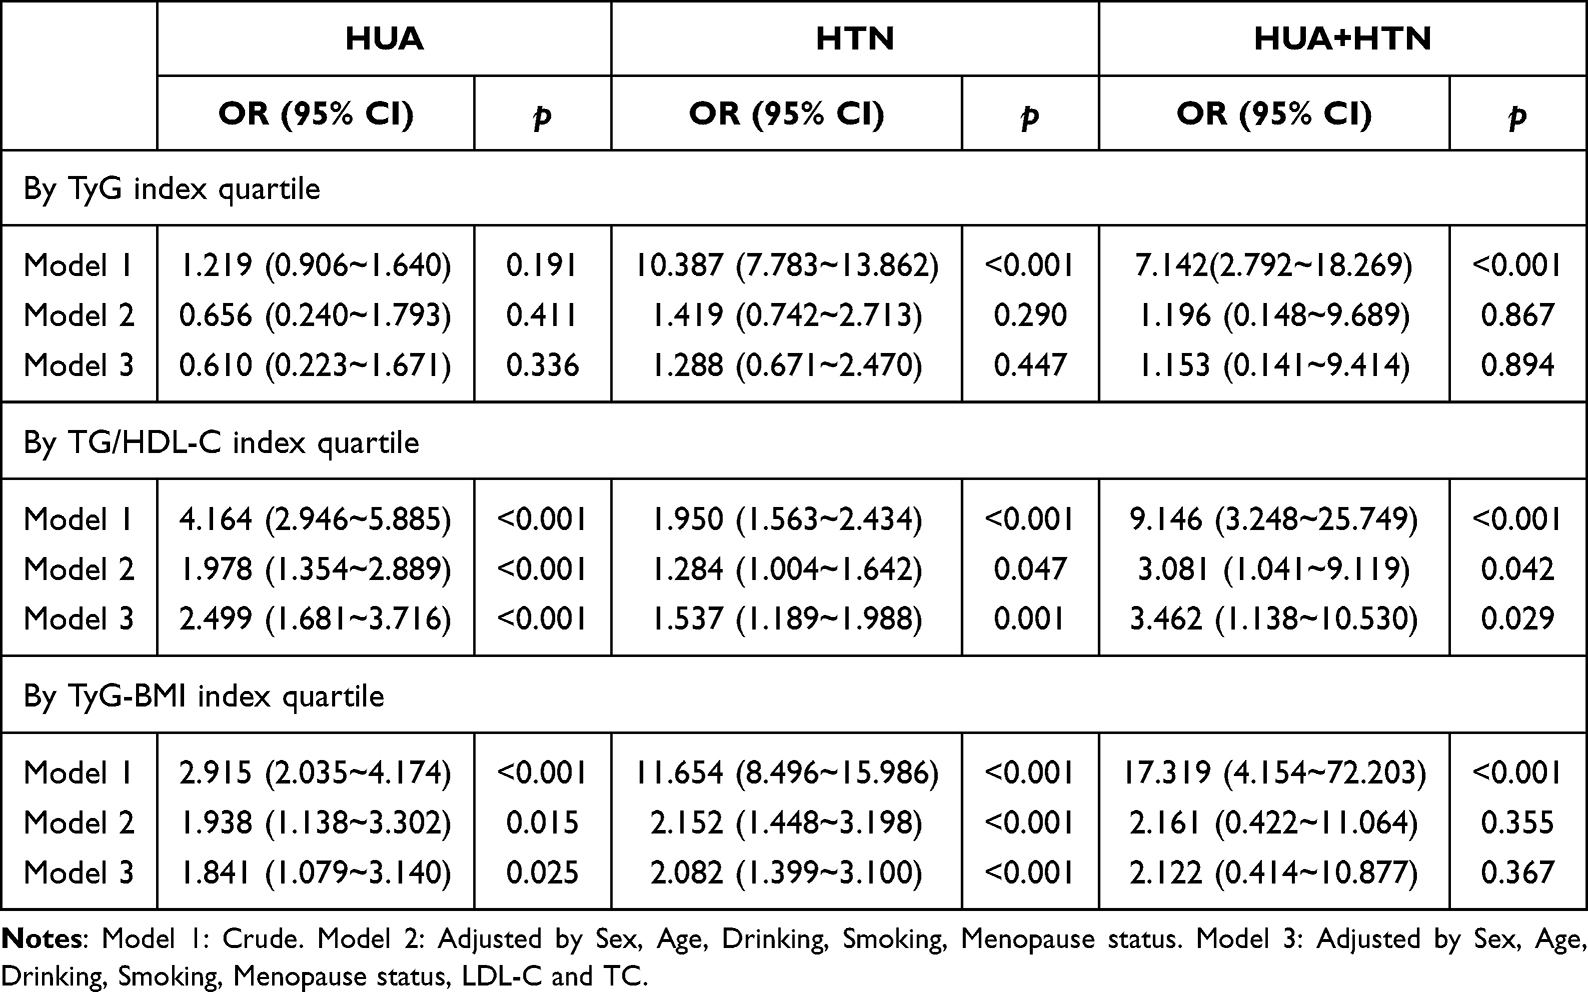 |
Table 2 Binary Multivariate Logistic Regression Analysis for the Highest Quartiles Vs the Lowest Quartiles of TyG, TG/HDL-C, TyG-BMI for HTN, HUA and HTN-HUA |
AUCs and Cutoff Values of TyG, TG/HDL-C, and TyG-BMI for the Prediction of HTN+HUA
Table 3 shows the AUCs of TyG, TG/HDL-C, and TyG-BMI for the discrimination of HUA, HTN, and HUA+HTN. TG/HDL-C had a significant discriminative ability for HTN, HUA, and HUA+HTN, with AUCs of 0.580 (0.558~0.602), 0.660 (0.628~0.691), and 0.748 (0.682~0.815), respectively. The cutoff values were 0.545, 0.475, and 0.605. TyG-BMI had a significant discriminative ability for HTN and HUA, with AUCs of 0.750 (0.732~0.769) and 0.610 (0.581~0.639), respectively. The cutoff values were 80.045 and 79.245. The DeLong test was used to adjust the difference between TG/HDL-C and TyG-BMI for the prediction of HUA and HTN. There was statistical significance in AUC between them (TG/HDL-C vs TyG-BMI for predicting HUA: Z = 2.475, p = 0.0133; TyG-BMI vs TG/HDL-C for predicting HTN: Z = 12.754, p<0.001) (both p<0.05). While, TG/HDL-C vs TyG-BMI for predicting HTN+HUA: Z = 0.065, p = 0.949 (p>0.05) (Figure 2).
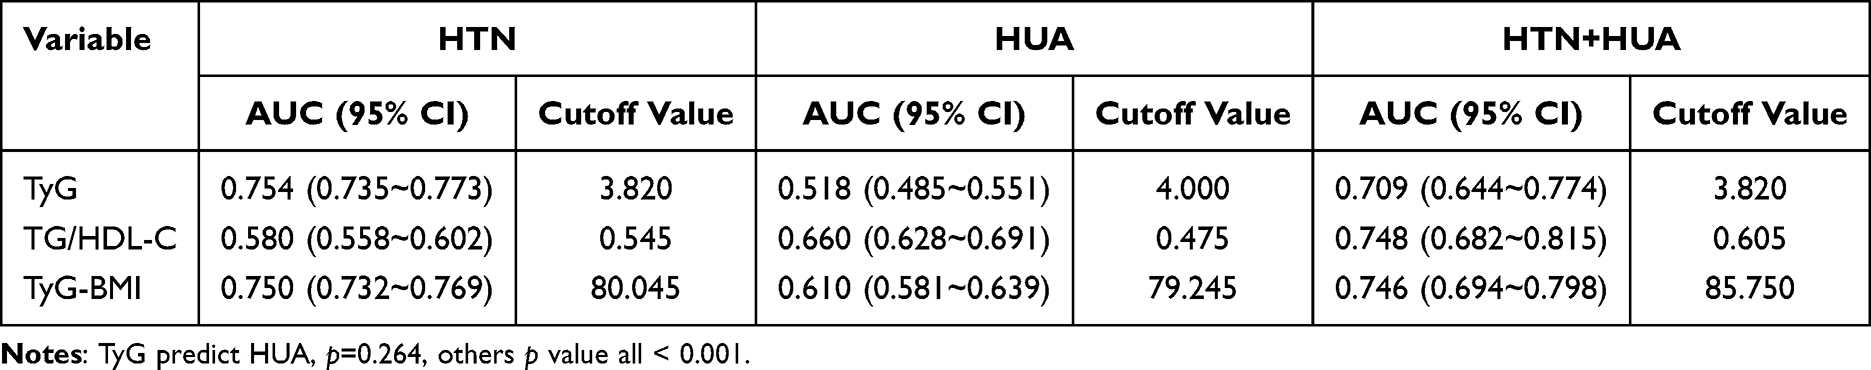 |
Table 3 ROC Curve Analysis of IR Surrogates for Prediction of HTN, HUA, and HTN-HUA |
 |
Figure 2 (A) ROC performance for predicting the HTN. (B) Roc performance for predicting the HUA. (C) ROC performance for predicting HTN+HUA. |
Discussion
Our study aimed to investigate the prevalence of hypertension (HTN) and hyperuricemia (HUA) in a large-scale health check-up population and to explore the association of insulin resistance (IR) surrogates with HTN, HUA, and HTN-HUA. The study included 6,952 participants, among whom the prevalence of HTN was 10.54% (733/6952), and the patients with HTN-HUA accounted for 8.64% (62/733) in the HTN population. The results showed that the TG/HDL-C ratio was associated with HTN, HUA, and HTN-HUA, and it had better predictive value for HUA and HTN-HUA. On the other hand, the TyG-BMI was associated with HTN and HUA alone, and it had better predictive value for HTN.
Insulin resistance is defined clinically as the inability of a known quantity of exogenous or endogenous insulin to increase glucose uptake and utilization in an individual as much as it does in a normal population.21 IR is the central component of metabolic syndrome, and is associated with various cardiovascular disease, and hyperuricemia and gout.22 The IR plays a pivotal role in the development of both HTN and HUA, the molecular mechanisms including the following: (1) Inappropriate activation of the RAAS, particularly the production of angiotensin II and aldosterone, these hormones increase blood pressure by promoting sodium retention and vasoconstriction, and the angiotensin II reduces renal urate clearance, leading to the accumulation of uric acid in the blood; (2) IR reduced signaling in the P13K-Akt-pathway, which leads to decreased activation of endothelial nitric oxide synthase (eNOS). As a result, lack of NO promotes vascular stiffness and high blood pressure and reduces blood flow to the kidneys, impairing renal clearance of uric acid, contributing to hyperuricemia; (3) IR is associated with heightened oxidative stress, which can impair insulin signaling and damage vascular endothelium. This contributes to endothelial dysfunction, vascular inflammation, and stiffening, which are key drivers of hypertension; while, Uric acid is both a product and a contributor to oxidative stress, creating a feedback loop that exacerbates its own production and accumulation in the bloodstream; (4) IR promotes a state of chronic low-grade inflammation, with increased levels of pro-inflammatory cytokines such as TNF-α and IL-6. These cytokines promote insulin resistance and contribute to vascular inflammation and endothelial dysfunction, which are linked to both hypertension and hyperuricemia.10
Several studies have shown that HUA is independently associated with cardiovascular events in HTN patients.23–25 Since HTN and HUA are related to metabolic disorders, and IR is the core element of metabolic disorder, many scholars have explored the association of IR surrogates with HTN and HUA in different populations and reached different conclusions. For instance, Li et al26 found that TyG, TyG-BMI, and TG/HDL-C were all associated with HTN-HUA, and the TyG-BMI had discriminative abilities for HTN-HUA in older than 65-year-old populations. Xiong et al14 found that the body fat percentage was positively associated with HTN-HUA for both men and women.
To eliminate the unnecessary effects of estrogen or drugs that may affect SUA, we excluded participants who used drugs that may affect SUA or hormone levels and recorded the participants’ menopausal status. Our conclusion is different from those of earlier studies, as we found that only the TG/HDL-C ratio was associated with HTN, HUA, and the HTN-HUA index, while the TyG-BMI was only associated with HTN and HUA alone. The TyG was not associated with HTN, HUA, or HTN-HUA. These inconsistent conclusions may be due to several factors, such as participants’ age, gender ratio, BMI, and lifestyle, which can affect the conclusion. Dyslipidemia, including elevated TG, elevated LDL-C, and low HDL-C, is known to be independently associated with HTN and HUA, and HDL-C is strongly associated with HUA.27,28 Additionally, both TyG and TyG-BMI include fasting plasma glucose (FPG) levels, and FPG level and SUA level are in an inverted U-shaped relationship. When FPG level increases to a threshold, it will lead to competitive inhibition of reabsorption of SUA and increase the excretion of SUA.29,30 In this study, we found that compared with TG/HDL-C, TyG-BMI had a larger odds ratio (2.082 vs.1.537) and more significant discriminative ability (0.750 vs 0.580) for HTN, this result is consistent with previous study results.31,32 Lim et al33 found that for IR prediction, TyG-BMI was superior to TyG, TyG-WC, and TyG-WHtR. And theoretically, the integration of TyG and obesity parameters (including WC, BMI, and WHtR) is more advantageous in reflecting IR, as obesity has been widely certified as one of the important factors contributing to IR. And an increase in BMI increases the risk of HTN, so TyG-BMI integrated the TyG and BMI has significant ability to discriminate HTN.
Previous studies34,35 have supported the hypothesis of a biological interrelationship between blood pressure and lipids, but lipid levels are susceptible to multiple factors including genetics, lifestyle, certain disorders and medications, and the HDL-C levels are not truly reflective of HDL-C function as demonstrated in previous studies.36,37 So the TG/HDL-C ratio may have lower predictive value for HTN.
There were several limitations to this study. Firstly, the study design was cross-sectional, which means that we cannot establish a causal relationship between the IR surrogates and HTN-HUA. Secondly, all participants were under the age of 66, had a normal BMI, and were civil servants with high education levels, low smoking rates, and low drinking rates. Therefore, the results may not be representative of the general population. Thirdly, the IR surrogates used in the study, including TyG, TyG-BMI, and TG/HDL-C, are not direct measures of IR, and further research is needed to explore the association between IR and HTN-HUA.
In conclusion, this study found that TG/HDL-C was associated with HTN, HUA, and HTN-HUA. Additionally, TG/HDL-C and TyG-BMI had high predictive value for HTN-HUA. The findings suggest that TG/HDL-C and TyG-BMI, a readily available and cost-effective IR surrogate, can predict the occurrence of HTN-HUA and can be used as a management monitor for HTN-HUA in young, non-obese individuals.
Summary
TyG-BMI and TG/HDL-C ratio were related with HTN, HUA and HTN+HUA;
TG/HDL-C ratio had a better predictive value for HUA than TyG-BMI in young, non-obese individuals;
TyG-BMI had a better predictive value for HTN in young, non-obese individuals;
TG/HDL-C ratio and TyG-BMI had high predictive value for HTN-HUA in young, non-obese individuals.
Disclosure
The authors report no conflicts of interest in this work.
References
1. NCD Risk Factor Collaboration (NCD-RisC). Worldwide trends in hypertension prevalence and progress in treatment and control from 1990 to 2019: a pooled analysis of 1201 population-representative studies with 104 million participants. Lancet. 2021;398(10304):957–980. doi:10.1016/S0140-6736(21)01330-1
2. Mahdi A, Armitage LC, Tarassenko L, et al. Estimated Prevalence of Hypertension and Undiagnosed Hypertension in a Large Inpatient Population: a Cross-sectional Observational Study. Am J Hypertens. 2021;34(9):963–972. doi:10.1093/ajh/hpab070
3. Ma S, Yang L, Zhao M, et al. Trends in hypertension prevalence, awareness, treatment and control rates among Chinese adults, 1991-2015. J Hypertens. 2021;39(4):740–748. doi:10.1097/HJH.0000000000002698
4. Saito Y, Tanaka A, Node K, et al. Uric acid and cardiovascular disease: a clinical review. J Cardiol. 2021;78(1):51–57. doi:10.1016/j.jjcc.2020.12.013
5. Timerga A, Haile K. Evaluation of uric acid disorders and associated factors in essential hypertensive patients at Wolkite University specialized hospital, Southern Ethiopia. PLoS One. 2021;16(9):e0256557. doi:10.1371/journal.pone.0256557
6. Takahashi T, Beppu T, Hidaka Y, et al. Uric acid-lowering effect of dotinurad, a novel selective urate reabsorption inhibitor, in hypertensive patients with gout or asymptomatic hyperuricemia: a pooled analysis of individual participant data in Phase II and III trials. Clin Exp Hypertens. 2021;43(8):730–741. doi:10.1080/10641963.2021.1950752
7. Ormazabal V, Nair S, Elfeky O, et al. Association between insulin resistance and the development of cardiovascular disease. Cardiovasc Diabetol. 2018;17(1):122. doi:10.1186/s12933-018-0762-4
8. Dawson J, Wyss A. Chicken or the Egg? Hyperuricemia, Insulin Resistance, and Hypertension. Hypertension. 2017;70(4):698–699. doi:10.1161/HYPERTENSIONAHA.117.09685
9. Mancusi C, Izzo R, Di Gioia G, et al. Insulin Resistance the Hinge Between Hypertension and Type 2 Diabetes. High Blood Press Cardiovasc Prev. 2020;27(6):515–526. doi:10.1007/s40292-020-00408-8
10. Jia G, Sowers JR. Hypertension in Diabetes: an Update of Basic Mechanisms and Clinical Disease. Hypertension. 2021;78(5):1197–1205. doi:10.1161/HYPERTENSIONAHA.121.17981
11. McLaughlin T, Reaven G, Abbasi F, et al. Is there a simple way to identify insulin-resistant individuals at increased risk of cardiovascular disease? Am J Cardiol. 2005;96(3):399–404. doi:10.1016/j.amjcard.2005.03.085
12. Guerrero-Romero F, Simental-Mendía LE, González-Ortiz M, et al. The product of triglycerides and glucose, a simple measure of insulin sensitivity. Comparison with the euglycemic-hyperinsulinemic clamp. J Clin Endocrinol Metab. 2010;95(7):3347–3351. doi:10.1210/jc.2010-0288
13. Er LK, Wu S, Chou HH, et al. Triglyceride Glucose-Body Mass Index Is a Simple and Clinically Useful Surrogate Marker for Insulin Resistance in Nondiabetic Individuals. PLoS One. 2016;11(3):e0149731. doi:10.1371/journal.pone.0149731
14. Xiong Y, Wangsheng F, Wang S, et al. Positive association between body fat percentage and hyperuricemia in patients with hypertension: the China H-type hypertension registry study. Nutr Metab Cardiovasc Dis. 2021;31(11):3076–3084. doi:10.1016/j.numecd.2021.07.002
15. Yang L, He Z, Gu X, Cheng H, Li L. Dose-Response Relationship Between BMI and Hyperuricemia. Int J Gen Med. 2021;14:8065–8071. doi:10.2147/IJGM.S341622
16. Sun J, Sun M, Su Y, et al. Mediation effect of obesity on the association between triglyceride-glucose index and hyperuricemia in Chinese hypertension adults. J Clin Hypertens. 2022;24(1):47–57. doi:10.1111/jch.14405
17. Williams B, Mancia G, Spiering W, et al. ESC/ESH Guidelines for the management of arterial hypertension. The Task Force for the management of arterial hypertension of the European Society of Cardiology (ESC) and the European Society of Hypertension (ESH)]. G Ital Cardiol. 2018;19(11 Suppl 1):3S–73S. doi:10.1714/3026.30245
18. Lu J, Lu Y, Wang X, et al. Prevalence, awareness, treatment, and control of hypertension in China: data from 1·7 million adults in a population-based screening study (China PEACE Million Persons Project). Lancet. 2017;390(10112):2549–2558. doi:10.1016/S0140-6736(17)32478-9
19. Multidisciplinary Expert Task Force on Hyperuricemia and Related Disease. Chinese multidisciplinary expert consensus on the diagnosis and treatment of hyperuricemia and related diseases. Chin Med J. 2017;130(20):2473–2488. doi:10.4103/0366-6999.216416
20. Cosentino F, Grant PJ, Aboyans V, et al. ESC Guidelines on diabetes, pre-diabetes, and cardiovascular diseases developed in collaboration with the EASD. Eur Heart J. 2020;41(2):255–323. doi:10.1093/eurheartj/ehz486
21. Lebovitz HE. Insulin resistance: definition and consequences. Exp Clin Endocrinol Diab. 2001;109(Suppl 2):S135–48. doi:10.1055/s-2001-18576
22. Adnan E, Rahman IA, Faridin HP. Relationship between insulin resistance, metabolic syndrome components and serum uric acid. Diabetes Metab Syndr. 2019;13(3):2158–2162. doi:10.1016/j.dsx.2019.04.001
23. Yanai H, Adachi H, Hakoshima M, et al. Molecular Biological and Clinical Understanding of the Pathophysiology and Treatments of Hyperuricemia and Its Association with Metabolic Syndrome, Cardiovascular Diseases and Chronic Kidney Disease. Int J Mol Sci. 2021;22(17):9221. doi:10.3390/ijms22179221
24. Li L, Zhao M, Wang C, et al. Early onset of hyperuricemia is associated with increased cardiovascular disease and mortality risk. Clin Res Cardiol. 2021;110(7):1096–1105. doi:10.1007/s00392-021-01849-4
25. Mohammed AQ, Abdu FA, Liu L, et al. Hyperuricemia Predicts Adverse Outcomes After Myocardial Infarction With Non-obstructive Coronary Arteries. Front Med Lausanne. 2021;8:716840. doi:10.3389/fmed.2021.716840
26. Li Y, You A, Tomlinson B, et al. Insulin resistance surrogates predict hypertension plus hyperuricemia. J Diabetes Investig. 2021;12(11):2046–2053. doi:10.1111/jdi.13573
27. Pang S, Jiang Q, Sun P, et al. Hyperuricemia prevalence and its association with metabolic disorders: a multicenter retrospective real-world study in China. Ann Transl Med. 2021;9(20):1550. doi:10.21037/atm-21-5052
28. Al Shanableh Y, Hussein YY, Saidwali AH, et al. Prevalence of asymptomatic hyperuricemia and its association with prediabetes, dyslipidemia and subclinical inflammation markers among young healthy adults in Qatar. BMC Endocr Disord. 2022;22(1):21. doi:10.1186/s12902-022-00937-4
29. Li H, Zha X, Zhu Y, et al. An Invert U-Shaped Curve: relationship Between Fasting Plasma Glucose and Serum Uric Acid Concentration in a Large Health Check-Up Population in China. Medicine. 2016;95(16):e3456. doi:10.1097/MD.0000000000003456
30. Liu Y, Li W, Chen J, et al. The elevation of serum uric acid depends on insulin resistance but not fasting plasma glucose in hyperuricaemia. Clin Exp Rheumatol. 2022;40(3):613–619. doi:10.55563/clinexprheumatol/qayjr5
31. Bala C, Gheorghe-Fronea O, Pop D, et al. The Association Between Six Surrogate Insulin Resistance Indexes and Hypertension: a Population-Based Study. Metab Syndr Relat Disord. 2019;17(6):328–333. doi:10.1089/met.2018.0122
32. Rattanatham R, Tangpong J, Chatatikun M, et al. Assessment of eight insulin resistance surrogate indexes for predicting metabolic syndrome and hypertension in Thai law enforcement officers. PeerJ. 2023;11:e15463. doi:10.7717/peerj.15463
33. Lim J, Kim J, Koo SH, et al. Comparison of triglyceride glucose index, and related parameters to predict insulin resistance in Korean adults: an analysis of the 2007-2010 Korean National Health and Nutrition Examination Survey. PLoS One. 2019;14(3):e0212963. doi:10.1371/journal.pone.0212963
34. Johnson AA, Stolzing A. The role of lipid metabolism in aging, lifespan regulation, and age-related disease. Aging Cell. 2019;18(6):e13048. doi:10.1111/acel.13048
35. Jeon S, Carr R. Alcohol effects on hepatic lipid metabolism. J Lipid Res. 2020;61(4):470–479. doi:10.1194/jlr.R119000547
36. Cheng W, Kong F, Chen S. Comparison of the predictive value of four insulin resistance surrogates for the prevalence of hypertension: a population-based study. Diabetol Metab Syndr. 2022;14(1):137. doi:10.1186/s13098-022-00907-9
37. Rosenson RS, HB B Jr, Davidson WS, et al. Cholesterol efflux and atheroprotection: advancing the concept of reverse cholesterol transport. Circulation. 2012;125(15):1905–1919. doi:10.1161/CIRCULATIONAHA.111.066589
 © 2024 The Author(s). This work is published and licensed by Dove Medical Press Limited. The
full terms of this license are available at https://www.dovepress.com/terms.php
and incorporate the Creative Commons Attribution
- Non Commercial (unported, 3.0) License.
By accessing the work you hereby accept the Terms. Non-commercial uses of the work are permitted
without any further permission from Dove Medical Press Limited, provided the work is properly
attributed. For permission for commercial use of this work, please see paragraphs 4.2 and 5 of our Terms.
© 2024 The Author(s). This work is published and licensed by Dove Medical Press Limited. The
full terms of this license are available at https://www.dovepress.com/terms.php
and incorporate the Creative Commons Attribution
- Non Commercial (unported, 3.0) License.
By accessing the work you hereby accept the Terms. Non-commercial uses of the work are permitted
without any further permission from Dove Medical Press Limited, provided the work is properly
attributed. For permission for commercial use of this work, please see paragraphs 4.2 and 5 of our Terms.