")
Back to Journals » Diabetes, Metabolic Syndrome and Obesity » Volume 17
Integrated Transcriptomics and Proteomics Identified CMPK1 as a Potential Biomarker for Type 2 Diabetes Mellitus
Authors Zhao K, Mao R , Yi W, Ren Z , Liu Y , Yang H, Wang S, Feng Z
Received 7 May 2024
Accepted for publication 25 July 2024
Published 1 August 2024 Volume 2024:17 Pages 2923—2934
DOI https://doi.org/10.2147/DMSO.S467950
Checked for plagiarism Yes
Review by Single anonymous peer review
Peer reviewer comments 2
Editor who approved publication: Prof. Dr. Juei-Tang Cheng
Kang Zhao,1,* Rui Mao,2,* Wei Yi,3– 6 Zhengyun Ren,3– 6 Yanjun Liu,3– 5 Huawu Yang,3– 5 Senlin Wang,3– 6 Zhonghui Feng4– 6
1Section for Day Surgery, Department of General Surgery, The Third People’s Hospital of Chengdu, The Affiliated Hospital of Southwest Jiao Tong University, Chengdu, 610031, People’s Republic of China; 2Department of Dermatology, Xiangya Hospital, Central South University, Changsha, People’s Republic of China; 3College of Medicine, Southwest Jiaotong University, Chengdu, People’s Republic of China; 4Center of Gastrointestinal and Minimally Invasive Surgery, Department of General Surgery, The Third People’s Hospital of Chengdu, The Affiliated Hospital of Southwest Jiao Tong University, Chengdu, Sichuan, People’s Republic of China; 5The Center for Obesity and Metabolic Health, The Third People’s Hospital of Chengdu, The Affiliated Hospital of Southwest Jiao Tong University, Chengdu, 610031, People’s Republic of China; 6Medical Research Center, The Third People’s Hospital of Chengdu, The Affiliated Hospital of Southwest Jiao Tong University, Chengdu, Sichuan, People’s Republic of China
*These authors contributed equally to this work
Correspondence: Zhonghui Feng, Center of Gastrointestinal and Minimally Invasive Surgery, Department of General Surgery, The Third People’s Hospital of Chengdu, Affiliated Hospital of Southwest Jiaotong University, Chengdu, Sichuan, 610031, People’s Republic of China, Email [email protected]
Aim/Introduction: Type 2 diabetes mellitus (T2DM) is one of the most frequent and widespread disease in the world.Obesity is the most significant predictor of T2DM, but the exact mechanism how obesity promotes T2DM remains unknown. Finding specific biomarkers to assist in diagnosing and treating patients with obese and T2DM is critical.
Materials and Methods: We collected liver tissues from obesity patients with and without T2DM for proteomic sequencing and immunohistochemistry assay. Analysis Gene Ontology(GO) enrichment, Kyoto Encyclopedia of Genes and Genomes(KEGG), and protein interaction network (PPI) were performed on the parameters and data derived from the Tandem Mass Tags(TMT)-based proteomics analysis of liver tissues. Transcriptome data were downloaded from the Gene Expression Omnibus(GEO)website and genes that are deferentially expressed in both transcriptome and proteome were selected.
Results: We identified 140 deferentially expressed proteins from proteomic sequencing. Six biomarkers were deferentially expressed in both proteome and transcriptome with consistent changes in direction. The protein–protein interaction (PPI) analysis suggested CMPK1, the expression with greatest difference, was the core protein among the six biomarkers. Immunohistochemistry validated CMPK1 was upregulated significantly in the liver tissues of T2DM patients. The correlation analysis revealed that the expression of CMPK1 was significantly associated with key molecules in T2DM-related pathways at both protein and transcriptome levels.
Conclusion and Novelty: Our study showed CMPK1 was upregulated in the liver of T2DM patients and provides a possible new target for screening and diagnosing T2DM in patients with obese and a novel theoretical basis for the pathophysiological mechanism of obesity-related metabolic diseases.
Keywords: type 2 diabetes mellitus, obesity, CMPK1, proteomic, transcriptomic, immunohistochemistry
Introduction
Diabetes is one of the most widespread and frequent life-threatening metabolic diseases globally mainly manifesting as chronic hyperglycaemia.Type 2 diabetes mellitus (T2DM) is characterized by insulin resistance, initial hyperinsulinaemia, and progressive decline in the capacity of pancreatic β cells to produce insulin. T2DM accounts for approximately 90% of diabetes cases and affecting 5% of the global population.1 The combination of insulin resistance and β-cell dysfunction ultimately leads to T2DM.2,3 T2DM and its complications represent a substantial mortality and disability burden worldwide.
The increase in obesity, energy-dense diets, sedentary lifestyle, and population ageing are the main drivers of the global prevalence of T2DM.4,5 However, the roles and mechanisms of major risk factors, particularly obesity and early developmental factors in the epidemic of T2DM remain unclear.6 Strong evidence indicates many cases of T2DM could be prevented by maintaining a healthy body.7 Approximately 80% of T2DM patients are overweight or obese.8–10 Although not all obese individuals will develop T2DM and not all individuals with T2DM are obese, the current increase in obesity prevalence is related to the increase in the prevalence of T2DM. Being overweight or obese is the most important predictor of T2DM, and the exact mechanisms remain unknown.11
Current early screening and diagnostic tests for T2DM are based solely on changes in glucose levels, such as fasting plasma glucose (FPG), 2-h plasma glucose (2-h PG) in a 75-g oral glucose tolerance (OGT), or the glycated haemoglobin (HbA1c) test. However, these tests are time-consuming, inconvenient, and conducted too late for effective intervention in T2DM.12 Therefore, biomarkers for the early diagnosis of T2DM are required to facilitate early intervention or treatment. Biomarkers are measurable biological characteristics that distinguish normal from pathological states. Thus, the sensitivity and specificity of a biomarker to a disease are critical. Omics-based classifications, such as genomics, transcriptomics, and proteomics, can be used to assess changes in total genes, RNA, and proteins. Recent advances in high-throughput technologies have led to the development of effective omics methods for screening diagnostic biomarkers and can provide a better understanding of molecules and their changes in normal physiological and disease processes as a whole.12–14
This project investigated the deferentially expressed proteins and genes in the liver of patients with obese but with or without T2DM. The results provide possible new targets for screening and diagnosing T2DM in patients with obese and a new theoretical basis for the pathophysiological mechanisms underlying obesity-related metabolic diseases.
Materials and Methods
Patients
Liver tissue samples for proteomic sequencing were obtained from six participants in two distinct groups at Chengdu Third People’s Hospital. The groups comprised three individuals with obesity and Type 2 Diabetes Mellitus (T2DM) and three individuals with obesity but without T2DM. These participants were recruited within a one-month period, from October 2020 to November 2020. Additionally, 52 liver tissue samples intended for immunohistochemistry were collected over a five-month period, from April 2021 to September 2021.The inclusion criteria were as follows: (1) patients with a Body Mass Index (BMI) ≥ 28 kg/m2; (2) patients who were hospitalized and undergoing bariatric surgery; (3) patients who were fully informed about the study and gave their consent to participate; (4) patients who had completed all preoperative examinations and had complete inpatient medical records; and (5) patients approved by the ethics committee of the hospital. The exclusion criteria were as follows: (1) patients with concurrent malignant tumours or a history of malignant tumours; (2) patients with severe liver disease or kidney failure; (3) patients with incomplete preoperative examination or incomplete inpatient medical records; and (4) patients with difficult-to-control mental illness. The study protocols were carried out in accordance with the approved guidelines. All experimental protocols were approved by the Institutional Review Board of the Third People’s Hospital of Chengdu (Approval No.2022-S-62). Informed consent was obtained from all subjects.
Sample Collection and Processing
The liver tissue samples measuring approximately 0.5 cm × 0.5 cm × 0.5 cm were stored at −80°C. For analysis, the samples were removed from the −80°C freezer and subjected to liquid nitrogen grinding. The resulting powder was transferred into 1.5-mL Eppendorf tubes, and 500 μL of SDT solution was added to each tube. The tubes were vortexed to ensure complete mixing and then boiled at 100°C for 10 min. The samples were then subjected to ice-bath sonication (35 W, 5 min, 3-s on/7-s off intervals) and centrifuged at 13,000 x g for 30 min. The supernatant was then transferred into 0.22-μm filter tubes and centrifuged at 13,000 x g for 20 min at 25°C. The lower filtrate was collected and subjected to BCA quantification.15
SDS–PAGE
Protein samples (20 μg) were mixed with 5X sample loading buffer (Tris-HCl pH6.8 (250 mM), SDS (10%), bromophenol blue (0.5%), glycerol (50%), and DTT (5%)) and boiled at 100°C for 5 min. After centrifugation, the supernatant was collected and loaded onto a 12% SDS-PAGE gel. Electrophoresis was performed at 150 V for 45 min. The gel was then washed with deionized water to remove the electrophoresis buffer, stained, scanned, and imaged.
Enzymatic Hydrolysis
Three hundred micrograms of each sample was used for filter-aided sample preparation (FASP) for enzymatic hydrolysis. The samples were boiled at 100°C with 100 mM DTT for 5 min, cooled to ambient temperature and mixed with 200 μL UA buffer. Next, the mixture was transferred to a 30-kDa ultrafiltration tube and centrifuged at 13,000 x g for 30 min at ambient temperature, after which the filtrate was discarded. This step was repeated three times. Then, 100 μL IAA (50 mM IAA in UA) was added, and the mixture was oscillated at 600 r/min for 1 min, followed by incubation at 300 r/min for 30 min at ambient temperature in the dark. Then, the mixture was centrifuged at 13,000 x g for 30 min at ambient temperature. After that, 100 μL UA buffer was added, and the mixture was centrifuged at 13,000 x g for 30 min at ambient temperature. This step was also repeated three times. Next, 100 μL 100 mM/L DS buffer was added, and the mixture was centrifuged at 13,000 x g for 30 min at room temperature, repeated three times. Finally, the filtrate was discarded, 52 μL Trypsin buffer was added, and the mixture was placed on a constant temperature mixer (300 r/min, 18 hours, 37°C). The filtrate was collected by centrifugation at 13,000 x g for 30 min at ambient temperature, moved to a new collection tube, and 40 μL 100 mM DS buffer was added. The mixture was then centrifuged at 13,000 x g for 30 min at room temperature, and the filtrate was obtained for peptide quantification at OD280.
Peptide Labelling and HpH Grading
One hundred micrograms of each sample per group was labelled using a Thermo Scientific TMT6plex Samples Isobaric Label Reagent Set kit, according to the manufacturer’s directions. After labelling, all peptides were mixed separately and pre-graded by HpH.16 Column: Gemini-NX 4.6×150 mm column (3 μm, 110 MPa; Phenomenex, 00F-4453-E0). A 1100 Series HPLC Value System (Agilent) was used, and the graded gradient is shown in Tables S2–5. Buffers A and B comprised 10 mM of ammonium acetate at pH 10.0 and 10 mM of ammonium acetate with 90% ACN at pH 10.0, respectively. After HpH classification, approximately 24 sections and eluting fragments were collected, merged into 12 sections according to the HpH chromatogram, and stored at −80°C after freeze-drying.
Lc–Ms/Ms
Liquid phases A and B comprised 0.1% formic acid aqueous solution and 0.1% formic acid acetonitrile solution, respectively. A Thermo Scientific chromatographic analytical column was equilibrated with 95% A. The relevant liquid gradient parameters were as follows: from 0 to 40 min, the linear gradient of B was 5% to 28%; from 40 to 42 min, the linear gradient of B was 28% to 90%; from 42 to 60 min, the linear gradient of B was maintained at 90%. The enzymatic hydrolysis products were desalted and separated by capillary high-performance liquid chromatography and analysed using an Orbitrap Fusion mass spectrometer. The analysis time was 60 min, the detection mode was positive ions, the scanning range of the parent ion was 375–1800 m/z, the resolution of first-order mass spectrometry was 120,000 at m-max z 200, the scanning mode was Top-Speed, the AGC target was 4e5, and the first-order Maximum IT was 50 ms. The number of scan ranges was 1, with a dynamic exclusion of 40.0 s. The data-dependent mode was cycle time, and the time between master scans was 3 s. The mass-charge ratio of peptides was collected using the following methods: the second-order spectrum was scanned at the same time as the first-order scan, and the scanning cycle was 3smemms2. The activation type was HCD. The resolution of the second-order mass spectrometry was 50000 at/m, the number of microscans was 1, and the second-order maximum IT was 105 ms, and the AGC target was 1e5.
Mass Spectrometry Database Search Analysis
The RAW file contains the original data for mass spectrometry analysis. The database identification and quantitative analysis were conducted using the Mascot software Proteome Discoverer 2.4.17 The database used in this experiment was “uniprot_human_192901_20201124.fasta”, which contains a total of 192,901 sequences. We used Mascot version 2.3 for the library search. We used the results of peptide fragment identification to screen using FDR ≤ 0.01 and completed the quantitative analysis based on the peak intensity of the peptides. We obtained the median value of the protein content from the quantitative data of all identified peptides of each protein. Finally, we homogenized the median of all quantitative protein data through each channel and obtained the final quantitative results.
Transcriptome Data Acquisition
GSE64998 and GSE15653 datasets comprising gene expression profiles of obese participants with and without T2DM, were downloaded from the Gene Expression Omnibus (GEO) database (RRID:SCR_005012, https://www.ncbi.nlm.nih.gov/geo/). GSE64998 comprises gene expression profiles from liver tissues of patients diagnosed with non-alcoholic fatty liver disease (NAFLD). This dataset includes 45 subjects, stratified according to the severity of their condition, ranging from mild to severe NAFLD. The gene expression profiling for this dataset was conducted using the Illumina HumanHT-12 V4.0 expression beadchip. GSE15653 features gene expression data from liver biopsies of patients undergoing surgical procedures. It encompassing a total of 40 samples. The Affymetrix Human Genome U133 Plus 2.0 Array was used to analyze these samples. Both datasets were in FPKM format and were converted by log2 for further analysis.
Differential Analysis
We used the limma package in R software to perform a differential analysis of the gene expression between the two groups.18 We identified the significant differentially expressed genes between the two groups by setting adjusted P < 0.05 and | log2FC (fold change) | > 1 as the cut-off criteria.
Protein–Protein Interaction (PPI) and Enrichment Analysis
The PPI network was analysed and visualized using GENEMANIA tools.19 Gene Ontology (GO)-BP and Kyoto Encyclopedia of Genes and Genomes (KEGG) enrichment analyses and gene set enrichment analysis (GSEA) were performed using the clusterProfiler package.20 The input file was the expression matrix and grouped text of the log2 transformation. The P value was adjusted by Benjamini–Hochberg (BH) method, and the adjusted P value threshold was set at 0.05.
Immunohistochemistry Staining
Immunohistochemistry staining for CMPK1 (Abcam, ab225940) was performed using standard techniques according to the manufacturer’s instructions. Briefly, tissue sections were incubated with the primary antibody overnight at 4°C, followed by incubation with a secondary antibody. The enzyme substrate was 3.3’-diaminobenzidine tetrahydrochloride (DAB). The positive signal of CMPK1 was quantified by measuring the integrated optical density (IOD) using Image-Pro Plus 6.0. The area was measured using an Olympus Cell Sens Standard, and the average optical density (AOD) of CMPK1 positive signal was calculated as AOD = IOD/μm².
Statistical Analyses
Statistical analyses were performed using GraphPad Prism™ 7.0 (GraphPad, CA, USA), R (version 3.6.2), and SPSS 25.0 (SPSS, IL, USA). Data are presented as mean ± standard deviations. Student’s t-test was used for comparisons between two groups. Differences were considered statistically significant when P < 0.05. The correlation analysis between molecules uses person correlation analysis method.
Results
Proteome Sequencing and Differential Analysis
We selectively collected liver tissues of three patients with obese and T2DM and three patients with obese but without T2DM (the DM2 and No-DM2 groups, respectively) for human liver tissue TMT proteomic analysis and screened out the differentially expressed proteins between the two groups. The SDS–PAGE gel image of the samples is shown in Figure 1A. In this test, a total of 7185 proteins with quantitative data in all channels and 41,404 peptides were identified (Figure 1B). According to the screening conditions of a P value <0.05 and a ratio of change multiple exceeding 1.2, there were 140 significant differentially expressed proteins (DEPs) between the two groups (Figure 1C and Table S1). There were 50 upregulated genes and 90 downregulated genes in the liver tissue of the DM2 group, compared to the No-DM2 group (Figures 1D and E).
 |
Figure 1 Proteome sequencing and differential analysis. (A) SDS–PAGE gel image of the samples. (B) Mass spectrometry identification information statistical analysis chart. (C) Significant differentially expressed protein cluster analysis; (D) Histogram of significant differences in protein numbers; (E) Significant difference protein volcanic map analysis. |
Enrichment and PPI Analysis of DEPs
The GO enrichment analysis of the DEPs suggested that the functions were mainly concentrated in immune-related pathways such as tumour necrosis factor secretion, positive regulation of tumour necrosis factor superfamily cytokine production, IgA immunoglobulin complex, T cell receptor complex, IgM immunoglobulin complex, and phosphoglycerate kinase activity (Figure 2A and Table S2). The results of the KEGG enrichment analysis suggested that the functions of the DEPs may be concentrated in immune and metabolic pathways, such as NF-kappa B signalling pathway, B cell receptor signalling pathway, intestinal immune network for IgA production, PI3K-Akt signalling pathway, and metabolic pathways (Figure 2B and Table S3). Multiple core interaction network nodes including CMPK1 were identified among the DEPs by PPI analysis (Figure 2C).
 |
Figure 2 Functional enrichment and protein–protein interaction analysis of significantly differentially expressed proteins. (A) GO enrichment analysis of differentially expressed proteins. (B) KEGG enrichment analysis of differentially expressed proteins; the darker the colour is, the more significant the adjusted P value is. (C) Protein interaction network analysis of differentially expressed proteins; the larger the circle is, the more protein interactions there are. |
Transcriptome Differences and Enrichment Analysis
We initially integrated the GSE64998 and GSE15653 datasets using the sva package and corrected for batch effects (Data available on reasonable request from the authors). A total of 88 and 376 genes were upregulated in the DM2 and No-DM2 groups, respectively (Figures 3A and B). KEGG enrichment analysis of the differentially expressed genes suggested that inflammatory and immune-related pathways, such as the IL-17 signalling pathway, adipocytokine signalling pathway, MAPK signalling pathway, and cytokine–cytokine receptor interaction, were significantly enriched (Figure 3C). GO-BP enrichment analysis suggested that leptin and cell proliferation-related pathways, such as cellular response to leptin stimulus, leptin-mediated signalling pathway, positive regulation of cell population proliferation, regulation of cell population proliferation, and positive regulation of mitotic cell cycle spindle assembly checkpoint, were significantly enriched (Figure 3D).
 |
Figure 3 Transcriptome differential and enrichment analyses. (A) Volcanic map of differentially expressed genes between the obese group with type 2 diabetes and the simple obesity group. (B) Differentially expressed gene heat map between the obese group with type 2 diabetes and the simple obesity group. (C) KEGG enrichment analysis of differentially expressed genes; the darker the colour is, the more significant the adjusted P value is (D) GO enrichment analysis of differentially expressed genes; the darker the colour is, the more significant the adjusted P value is. |
Integrin and Transcriptome Identification of Core Molecules
We analysed the expression correlation between proteome and transcriptome according to the differences in the expression of genes and their encoded proteins, and the results suggested that there was a strong correlation between the expression of matching gene–protein pairs between the two omics datasets (Figure 4A, R2 = 0.53). In addition, according to the screening conditions of the two differentially expressed molecules, we obtained a total of six differentially expressed protein–gene pairs in the same direction, including two molecules (CMPK1 and HADHB) that were upregulated simultaneously and four molecules (UROD, ABI3BP, MFSD9, and SRRM2) that were downregulated simultaneously (Table 1). The PPI analysis of the six molecules indicated that CMPK1 demonstrated the highest degree of interaction with other molecules (Figure 4B).
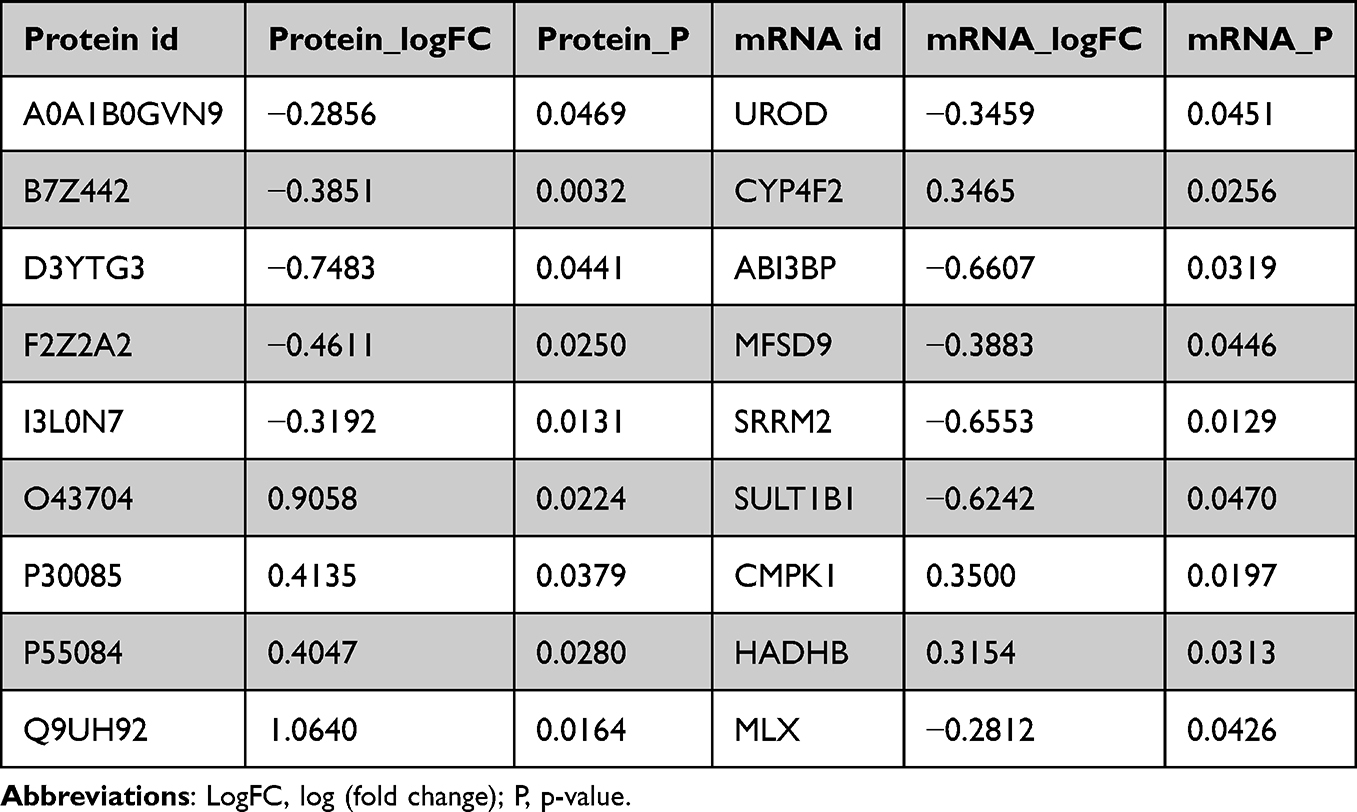 |
Table 1 Transcriptional and Protein Level Expression Information of Matched Molecules |
 |
Figure 4 Integration analysis of the transcriptome and proteome. (A) Correlation graph between proteomics and transcriptomics. (B) Protein interaction networks of molecules differentially expressed simultaneously in the transcriptome and proteome. |
CMPK1 Was Significantly Associated with Various Diabetes Biomarkers
We collected biomarkers closely related to the onset of T2DM from the MsigDB database (KEGG_TYPE_II_DIABETES_MELLITUS) to explore the relationship between the above six molecules and diabetes. We assessed the correlation between the six molecules mentioned above and T2DM biomarkers at the transcription and protein levels. The results suggest that CMPK1 is significantly related to most key molecules in the pathogenesis of diabetes, including HK1, HK3, INSR, INSR1, and the MAPK, PI3K, and mTOR signalling pathways at both the transcriptional (Figure 5A and B) and protein levels.
 |
Figure 5 Identification of core action molecules. (A) Correlation analysis between six common differentially expressed molecules and key diabetes molecules at the transcriptional level. (B) Correlation analysis of six common differentially expressed molecules and key diabetes molecules at the protein level. |
CMPK1 Expression is Upregulated in the Liver of Patients with Obese and Diabetes, as Confirmed by Immunohistochemistry
31 liver samples from patients with obese and T2DM and 21 liver samples from patients with obese but without T2DM were collected, and immunohistochemistry was used to measure CMPK1 protein expression (Figure 6, Table S4 and S5). CMPK1 was located in the cytoplasm and nucleus; consistent with the bioinformatics analysis results, the protein expression levels of CMPK1 in the liver of those with T2DM were upregulated, but not in those without T2DM (Figure 6).
 |
Figure 6 Immunohistochemical detection of CMPK1 expression in liver tissues. (A) CMPK1 expression in the Non-DM2 group. (B) CMPK1 expression in the DM2 group. (C) Box plot of the average optical density (AOD) of immunohistochemical staining (*P < 0.05). |
Discussion
We identified deferentially expressed proteins between the liver of obese people with and without T2DMthrough proteomics analysis. Then, we combined these data with GEO datasets and reveal six genes differentially expressed at the genomic and transcriptomic level through bio-informatics analyses, including 2 molecules CMPK1 and HADHB that were upregulated, and 4 molecules that were downregulated (UROD, ABI3BP, MFSD9 and SRRM2). HADHB protein is an important component of mitochondrial trifunctional enzymes, which involved in the mitochondrial β-oxidation pathway and breaking down long-chain fatty acids into acetyl-CoA to generate energy across tissues.21 Uroporphyrinogen decarboxylase (UROD) can catalyze the decarboxylation of uroporphyrinogen III to coproporphyrinogen III and also a key regulator of heme biosynthesis.22
ABI3BP is an extracellular matrix protein and its function is not well-understood.23 Major facilitator superfamily domain-containing protein 9 (MFSD9) is an orphan protein and atypical solute carrier of MFS type.24 SRRM2 (or SRm300) sereine/arginine repetitive matrix 2 is a nuclear-speckle marker and a RNA splicing gene, whose dysfunction is associated with several human diseases.25
According to bioinformatics analysis, CMPK1 has the highest interaction with other molecules, and is significantly related to most star molecules in the pathogenesis of diabetes, including HK1, HK3, INSR, INSR1, MAPK signal, PI3K signal, MTOR signal and protein level. Therefore, weselected CMPK1 for experimental verification. Immunohistochemistry further verified that the expression of CMPK1 was up-regulated in obese patients with diabetes, which was consistent with the results of proteomics.
A literature survey revealed that this study was the first to explore the relationship between CMPK1 and obesity and T2DM. CMPK1 is an enzyme required for nucleic acid biosynthesis.26 UMP/CMP kinase is responsible for the phosphorylation of the ribonucleotide metabolite 5-fluoro-5’-monophosphate (FUMP) in the 5-FU metabolic process and is recognized as a key step in the conversion of 5-FU to cytotoxic metabolites.27 The discovery of CMPK1 is of great significance for revealing the underlying relationship between obesity and T2DM and exploring an effective method for the early prevention and diagnosis of T2DM.
It is important to acknowledge several limitations of our study. Firstly, the proteome and transcriptome samples were not derived from the same batch, which may compromise the precision in screening biomarkers. Secondly, the proteomic analysis was based on only six samples, which limits the generalizability of our findings; future studies with a larger sample size would provide more robust evidence. Lastly, there is a lack of comprehensive clinical data accompanying the transcriptome and proteome samples, which restricts our ability to analyze the correlation between identified biomarkers and diabetes-related clinical characteristics effectively.In conclusion, we revealed unregulated expression of CMPK1 in the liver tissue of patients with obese and T2DM, providing new ideas for the follow-up exploration of the mechanism of action and prediction, diagnosis and treatment strategies for patients with obese and T2DM. Next, we will verify and test the other five genes and investigate the function of these genes in T2DM, which will provide new potential diagnostic biomarkers and therapeutic targets for treating diabetes.
Data Sharing Statement
Data is available on reasonable request from the corresponding authors.
Ethics
Approval of the research protocol: The study protocol was approved by been approved by the Ethics Committee of the Third People’s Hospital of Chengdu (approval number: [2022]-S-62) and it conforms to the provisions of the Declaration of Helsinki.
Informed Consent
All individual participants included in the study gave their informed consent.
Acknowledgments
This work were supported by the National Natural Science Foundation of China (82202007), The Third People’s Hospital of Chengdu Clinical Research Program (2023PI22), Natural Science Foundation of Sichuan Province (2023NSFSC0739).
Disclosure
The authors report no conflicts of interest in this work.
References
1. Ahmad E, Lim S, Lamptey R, et al. Type 2 diabetes. Lancet. 2022;400(10365):1803–1820.
2. Wysham C, Shubrook J. Beta-cell failure in type 2 diabetes: mechanisms, markers, and clinical implications. Postgrad Med. 2020;132(8):676–686. doi:10.1080/00325481.2020.1771047
3. Chen C, Cohrs CM, Stertmann J, et al. Human beta cell mass and function in diabetes: recent advances in knowledge and technologies to understand disease pathogenesis. Mol Metab. 2017;6(9):943–957. doi:10.1016/j.molmet.2017.06.019
4. Fuchsberger C, Flannick J, Teslovich TM, et al. The genetic architecture of type 2 diabetes. Nature. 2016;536(7614):41–47. doi:10.1038/nature18642
5. Chatterjee S, Khunti K, Davies MJ. Type 2 diabetes. Lancet. 2017;389(10085):2239–2251. doi:10.1016/S0140-6736(17)30058-2
6. Hu FB, Manson JE, Stampfer MJ, et al. Diet, lifestyle, and the risk of type 2 diabetes mellitus in women. N Engl J Med. 2001;345(11):790–797. doi:10.1056/NEJMoa010492
7. Schellenberg ES, Dryden DM, Vandermeer B, et al. Lifestyle interventions for patients with and at risk for type 2 diabetes: a systematic review and meta-analysis. Ann Intern Med. 2013;159(8):543–551. doi:10.7326/0003-4819-159-8-201310150-00007
8. Maggio CA, Pi-Sunyer FX. Obesity and type 2 diabetes. Endocrinol Metab Clin North Am. 2003;32(4):805–22,viii. doi:10.1016/S0889-8529(03)00071-9
9. Stockdale T. Obesity, diabetes and other problems. Nutr Health. 2003;17(3):205–210. doi:10.1177/026010600301700303
10. Olsovsky J. [Obesity and diabetes]. Vnitr Lek. 2003;49(12):956–959.
11. Malone JI, Hansen BC. Does obesity cause type 2 diabetes mellitus (T2DM)? Or is it the opposite? Pediatr Diabetes. 2019;20(1):5–9.
12. Gan WZ, Ramachandran V, Lim CS, et al. Omics-based biomarkers in the diagnosis of diabetes. J Basic Clin Physiol Pharmacol. 2019;31(2):1.
13. Chuang HY, Hofree M, Ideker T. A decade of systems biology. Annu Rev Cell Dev Biol. 2010;26:721–744.
14. Karahalil B. Overview of systems biology and omics technologies. Curr Med Chem. 2016;23(37):4221–4230. doi:10.2174/0929867323666160926150617
15. Wiśniewski JR, Zougman A, Nagaraj N, et al. Universal sample preparation method for proteome analysis. Nat Methods. 2009;6(5):359–362. doi:10.1038/nmeth.1322
16. Hogrebe A, von Stechow L, Bekker-Jensen DB, et al. Benchmarking common quantification strategies for large-scale phosphoproteomics. Nat Commun. 2018;9(1):1045.
17. Bouabdallah K, Marit G, Reiffers J, et al. Hodgkin’s disease and secondary Philadelphia chromosome positive chronic myelogenous leukemia. Cancer Genet Cytogenet. 1991;55(2):277–278. doi:10.1016/0165-4608(91)90091-8
18. Robinson MD, McCarthy DJ, Smyth GK. edgeR: a Bioconductor package for differential expression analysis of digital gene expression data. Bioinformatics. 2010;26(1):139–140. doi:10.1093/bioinformatics/btp616
19. Warde-Farley D, Donaldson SL, Comes O, et al. The GeneMANIA prediction server: biological network integration for gene prioritization and predicting gene function. Nucleic Acids Res. 2010;38:W214–20.
20. Yu G, Wang L-G, Han Y, et al. clusterProfiler: an R package for comparing biological themes among gene clusters. OMICS. 2012;16(5):284–287. doi:10.1089/omi.2011.0118
21. Choi JH, Yoon H-R, Kim G-H, et al. Identification of novel mutations of the HADHA and HADHB genes in patients with mitochondrial trifunctional protein deficiency. Int J Mol Med. 2007;19(1):81–87.
22. Elder GH, Roberts AG. Uroporphyrinogen decarboxylase. J Bioenerg Biomembr. 1995;27(2):207–214. doi:10.1007/BF02110035
23. Delfín DA, DeAguero JL, McKown EN. The extracellular matrix protein ABI3BP in cardiovascular health and disease. Front Cardiovasc Med. 2019;6:23. doi:10.3389/fcvm.2019.00023
24. Perland E, Hellsten SV, Schweizer N, et al. Structural prediction of two novel human atypical SLC transporters, MFSD4A and MFSD9, and their neuroanatomical distribution in mice. PLoS One. 2017;12(10):e0186325. doi:10.1371/journal.pone.0186325
25. Shehadeh LA, Yu K, Wang L, et al. SRRM2, a potential blood biomarker revealing high alternative splicing in Parkinson’s disease. PLoS One. 2010;5(2):e9104. doi:10.1371/journal.pone.0009104
26. Chu H, Han N, Xu J. CMPK1 regulated by miR-130b attenuates response to 5-FU treatment in gastric cancer. Front Oncol. 2021;11:637470. doi:10.3389/fonc.2021.637470
27. Ryu JS, Shin E-S, Nam H-S, et al. Differential effect of polymorphisms of CMPK1 and RRM1 on survival in advanced non-small cell lung cancer patients treated with gemcitabine or taxane/cisplatinum. J Thorac Oncol. 2011;6(8):1320–1329. doi:10.1097/JTO.0b013e3182208e26
 © 2024 The Author(s). This work is published and licensed by Dove Medical Press Limited. The
full terms of this license are available at https://www.dovepress.com/terms.php
and incorporate the Creative Commons Attribution
- Non Commercial (unported, 3.0) License.
By accessing the work you hereby accept the Terms. Non-commercial uses of the work are permitted
without any further permission from Dove Medical Press Limited, provided the work is properly
attributed. For permission for commercial use of this work, please see paragraphs 4.2 and 5 of our Terms.
© 2024 The Author(s). This work is published and licensed by Dove Medical Press Limited. The
full terms of this license are available at https://www.dovepress.com/terms.php
and incorporate the Creative Commons Attribution
- Non Commercial (unported, 3.0) License.
By accessing the work you hereby accept the Terms. Non-commercial uses of the work are permitted
without any further permission from Dove Medical Press Limited, provided the work is properly
attributed. For permission for commercial use of this work, please see paragraphs 4.2 and 5 of our Terms.
Recommended articles
Tirzepatide: Does the Evidence to Date Show Potential for the Treatment of Early Stage Type 2 Diabetes?
Razzaki TS, Weiner A, Shukla AP
Therapeutics and Clinical Risk Management 2022, 18:955-964
Published Date: 28 September 2022
Comparison of Plasma Exosome Proteomes Between Obese and Non-Obese Patients with Type 2 Diabetes Mellitus
Wang Y, Wu Y, Yang S, Chen Y
Diabetes, Metabolic Syndrome and Obesity 2023, 16:629-642
Published Date: 7 March 2023
Adolescents with Type 2 Diabetes: Overcoming Barriers to Effective Weight Management
Salama M, Biggs BK, Creo A, Prissel R, Al Nofal A, Kumar S
Diabetes, Metabolic Syndrome and Obesity 2023, 16:693-711
Published Date: 9 March 2023
Clinical Classification of Obesity and Implications for Metabolic Dysfunction-Associated Fatty Liver Disease and Treatment
Ding Y, Deng Q, Yang M, Niu H, Wang Z, Xia S
Diabetes, Metabolic Syndrome and Obesity 2023, 16:3303-3329
Published Date: 25 October 2023
Resistance Training in Cardiovascular Diseases: A Review on Its Effectiveness in Controlling Risk Factors
Nazir A, Heryaman H, Juli C, Ugusman A, Martha JW, Moeliono MA, Atik N
Integrated Blood Pressure Control 2024, 17:21-37
Published Date: 18 March 2024