")
Back to Journals » International Journal of Nanomedicine » Volume 19
Iontophoresis-Enhanced Buccal Delivery of Cisplatin-Encapsulated Chitosan Nanoparticles for Treating Oral Cancer in a Mouse Model
Authors Chen YW, He AC , Huang TY, Lai DH , Wang YP, Liu WW, Kuo WT, Hou HH, Cheng SJ, Lee CY , Chuang WC, Chang CC, Lee BS
Received 26 April 2024
Accepted for publication 9 October 2024
Published 16 October 2024 Volume 2024:19 Pages 10435—10453
DOI https://doi.org/10.2147/IJN.S475742
Checked for plagiarism Yes
Review by Single anonymous peer review
Peer reviewer comments 2
Editor who approved publication: Professor Farooq A. Shiekh
Yi-Wen Chen,1,2 Ai-Chia He,3 Tzu-Yun Huang,1,3 De-Hao Lai,3 Yi-Ping Wang,1 Wei-Wen Liu,1,3 Wei-Ting Kuo,1,3 Hsin-Han Hou,1,3 Shih-Jung Cheng,1,3 Chen-Yi Lee,1 Wei-Chun Chuang,1 Che-Chen Chang,4 Bor-Shiunn Lee1,3
1Department of Dentistry, National Taiwan University Hospital, Taipei, 100229, Taiwan; 2Graduate Institute of Clinical Dentistry, School of Dentistry, National Taiwan University, Taipei, 100229, Taiwan; 3Graduate Institute of Oral Biology, School of Dentistry, National Taiwan University, Taipei, 100229, Taiwan; 4Department of Chemistry, National Taiwan University, Taipei, 10617, Taiwan
Correspondence: Bor-Shiunn Lee, Graduate Institute of Oral Biology, School of Dentistry, National Taiwan University, No. 1, Changde Street, Taipei, 100229, Taiwan, Tel +886-2-23123456 ext 66846, Fax +886-2-2383-1346, Email [email protected]
Introduction: Cisplatin is one of the most effective chemotherapeutic drugs used in oral cancer treatment, but systemic administration has side effects. The purpose of this study was to evaluate the effect of iontophoresis on the enhancement of cisplatin release from cisplatin-encapsulated chitosan nanoparticles.
Methods: The effect of different mass ratios of chitosan to tripolyphosphate (TPP) (5:1, 10:1, 15:1, 20:1) on the encapsulation efficiency of cisplatin was investigated. Uptake of cisplatin-encapsulated chitosan by cells was observed using a confocal laser scanning microscope. The cell viability at different cisplatin concentrations was examined using a 3-(4,5-dimethylthiazol-2-yl)-2,5-diphenyltetrazolium bromide assay. Three iontophoresis methods, namely constant-current chronopotentiometry (CCCP), cyclic chronopotentiometry (CCP), and differential pulse voltammetry (DPV), were used to enhance cisplatin release from cisplatin-encapsulated chitosan nanoparticles. In addition, mouse oral squamous cell carcinoma cell lines were implanted into the mouse oral mucosa to induce oral cancer. The effects of enhanced cisplatin release by CCCP, CCP, and DPV on tumor suppression in mice were evaluated. Tumors and lymph nodes were isolated for hematoxylin-eosin staining and immunohistochemistry staining including Ki-67 and pan CK after sacrifice. Inductively coupled plasma mass spectrometry was conducted to quantify the platinum content within the tumors.
Results: The results showed that nanoparticles with a mass ratio of 15:1 exhibited the highest cisplatin encapsulation efficiency (approximately 15.6%) and longest continued release (up to 35 days) in phosphate buffered saline with a release rate of 100%. Cellular uptake results suggested that chitosan nanoparticles were delivered to the cytoplasm via endocytosis. The results of the MTT assay revealed that the survival rate of cells decreased as the cisplatin concentration increased. The CCP (1 mA, on:off = 1 s: 1 s) and DPV (0– 0.06 V) groups were the most effective in inhibiting tumor growth, and both groups exhibited the lowest percentage of Ki-67 positive and pan CK positive.
Conclusion: This study is the first to investigate and determine the efficacy of DPV in enhancing in vivo drug release from nanoparticles for the treatment of cancer in animals. The results suggest that the CCP and DPV methods have the potential to be combined with surgery for oral cancer treatment.
Keywords: oral cancer, cisplatin, chitosan, nanoparticle, iontophoresis
Graphical Abstract:

Introduction
Oral cancer is one of the most common cancers, accounting for 2% of the total cases in the world in 2020. Oral squamous cell carcinoma (OSCC) is a well-known type of malignant tumor, accounting for more than 90% of all oral cancers, followed by adenocarcinomas, and then by other types of malignancies.1,2 OSCC develops when the cells of the oral mucosa are stimulated over a long period of time, with the main sources of stimulation being cigarette smoking, alcohol consumption, and betel nut chewing. Despite recent advances in diagnosis and treatment, such as using salivary exosomes as a biomarker for early detection,3 the prognosis of oral cancer remains unsatisfactory and the 5-year survival rate of OSCC has been approximately 64.4% for the past 30 years.4 The treatment of oral cancer depends largely on the site and stage of the disease, as well as the patient’s overall health status. Surgery, radiotherapy, and chemotherapy are the major treatment methods for OSCC, among which surgical resection of lesions is the most commonly used. However, excessively large resection areas may cause cosmetic and functional impairment to the patient. By contrast, chemotherapy can reduce the size of the tumor, control the progression of the localized lesion, increase the survival rate of the patient, and improve the patient’s quality of life.5 Other adjunctive treatment methods that have been investigated include nanomedicine-based therapy and robot-assisted surgery.6,7
Cisplatin is one of the most effective chemotherapeutic drugs used in human and veterinary medicine for the treatment of a wide range of solid malignancies, including testicular, ovarian, head and neck, colorectal, bladder, and lung cancers. Cisplatin exerts its anticancer effects through multiple mechanisms, but its most prominent mode of action involves the generation of DNA damage, which then activates the DNA damage response and induces mitochondrial apoptosis.8 Unfortunately, cisplatin administration has been associated with numerous side effects, including nephrotoxicity, severe nausea and vomiting, myelosuppression, ototoxicity, and neurotoxicity.9,10
Chitosan is a functional biopolymer that can be obtained through partial deacetylation of highly abundant natural chitin polymers. It is prepared using chemical or biological methods, with the latter including enzymatic and fermentation methods. Chitosan can be easily removed from organisms without causing adverse reactions. In addition to good mucosal adhesion, it also demonstrates antimicrobial properties, coagulation ability, and immunostimulatory activity.11,12 Chitosan has a variety of pharmaceutical applications and is currently considered a carrier material for drug delivery systems. Not only is it the second most abundant natural biopolymer derived from the exoskeleton of crustaceans and the cell walls of fungi and insects, but it can also be used as a nanocarrier.13,14 Chitosan has good biocompatibility and degradability, its cytotoxicity is low, and its positively charged properties have been exploited to introduce it into cancerous tissues.15,16
Nanoparticles are used in cancer therapy because of their unique size, which makes them suitable for drug delivery applications. The nanoscale size, large surface-to-volume ratio, and surface functionalization capabilities of nanoparticles play crucial roles in their biodistribution in vivo.17 Nanomedicines for cancer therapy are superior to conventional drugs because of their enhanced permeability effects and the possibility of using more than one therapeutic agent in combination therapy, thus allowing preferential drug delivery to tumors. Nanocarriers can also overcome drug solubility or stability issues and minimize drug-induced side effects.18 Polymer nanoparticles are typically defined as solid colloidal particles in the range of 1–1000 nm, a generic term for any type of polymer nanoparticles (particularly nanospheres and nanocapsules).19 A polymeric nanocapsule consists of a solid core of a specific polymer encapsulating a drug and surrounded by layer of a suitable stabilizer.20
Iontophoresis has been used to facilitate the subcutaneous absorption of topically administered ionic reagents or drugs.21 Through the ionic electroosmotic process of electromigration and electroosmosis, iontophoresis therapy increases the penetration of charged and neutral compounds and offers the option of programmed drug delivery. Iontophoresis involves the delivery of selected ions to tissues via direct current flow through a drug solution to the patient. This method of drug administration has many advantages, such as requiring only a very small amount of drug to be delivered to achieve therapeutic effects, reducing the systemic side effects of the drug substantially, and being generally accepted by patients, circumventing the fear of injections.22
Chronopotentiometry (CP) is commonly used in in vitro drug flux experiments.23,24 The drug is assumed to reach the skin surface through diffusion from the donor solution and the concentration gradient across the surface of the stratum corneum is constant. In CP, once the drug reaches the stratum corneum, it is swept by iontophoresis into an electric field that penetrates the skin and passes through the stratum corneum via ion migration before reaching the recipient compartment.21 Differential pulse voltammetry (DPV) is a voltammetric method that uses a series of regular step voltage pulses to make electrochemical measurements.25 DPV uses the difference between current points; typically, the first point is taken before the pulse, and the second point is taken approximately 40 ms after the pulse, and then subtracted for the displayed single-point current value.26 DPV lowers the analytical detection limit and greatly improves the sensitivity of the analysis. This method is often used for trace substance detection, such as the quantification of metal ions in samples.27
In this study, cisplatin-encapsulated chitosan nanoparticles were prepared, and their zeta potential, cisplatin encapsulation efficiency, and cisplatin release in vitro were investigated. Encapsulation efficiency represents the ability of a drug to retain ingredients with therapeutic properties. The more potent cisplatin-encapsulated nanoparticles are in terms of therapeutics, the higher their encapsulation efficiency is in the in vivo environment. Their efficiency drops drastically when the nanoparticles reach the point of care. Cisplatin-encapsulated chitosan nanoparticles mixed with temperature-sensitive hydrogels were included in patches and cisplatin release from the patches was enhanced using constant-current chronopotentiometry (CCCP), cyclic chronopotentiometry (CCP), and DPV. Finally, mouse animal studies were used to examine the efficacy of the aforementioned electrochemical methods in reducing tumor size. The hypothesis of this study was that the electrochemical method can enhance in vivo drug release from nanoparticles and reduce tumor size. Consequently, the patient’s resection defect after the remaining smaller tumors are surgically removed could be easier to repair and the patient’s appearance and confidence will be improved.
Materials and Methods
Chitosan (99% degree of deacetylation, average molecular weight 100 kDa), cis-platinum (II) diamine dichloride (Pt(NH3)2Cl2, molecular weight: 300.05), acetic acid (C2H4O2), sodium tripolyphosphate (Na5O10P3), Tween 80 (C64H124O26), sodium hydroxide (NaOH), dimethylformamide HCON(CH3)2, o-phenylenediamine (C6H8N2), phosphate-buffered saline (PBS), Hoechst 33342, fluorescein isothiocyanate (FITC), N-isopropylacrylamide (C6H11NO)n, and ammonium persulfate (NH4)2S2O8 were purchased from Sigma-Aldrich (St. Louis, MO, USA) without further purification. Porous non-woven fabric facial mask paper (Nikita) was purchased from FPI Trade (New Taipei City, Taiwan). Zoletil 50 (Virbac, Carros, France), Rompun (Bayer, Leverkusen, Germany), Vaseline (Unilever, Shanghai, China), and isoflurane (Panion & BF Biotech Inc., Taipei, Taiwan) were obtained from commercial suppliers.
Preparation of Cisplatin-Encapsulated Chitosan Nanoparticles
The preparation of cisplatin-encapsulated chitosan nanoparticles based on ion gelation of tripolyphosphate (TPP) with chitosan was modified from a previous study.28 Chitosan was dissolved in a 1% (v/v) acetic acid solution to obtain concentrations of 1.5 and 2 mg/mL. Four milliliters of 1.25 mg/mL cisplatin were mixed into 40 mL of chitosan solution and stirred at 600 rpm for 1 min at room temperature. Subsequently, 200 μL of Tween 80 was added and stirred at 600 rpm for 5 min, followed by emulsification at 33 W for 5 min using a probe sonicator (Misonix Sonicator 3000, Misonix, Inc., Farmingdale, NY, USA). The pH of the emulsified solution was adjusted to 4.6–4.8 using 1 N NaOH. Next, 0.5 mg/mL or 1 mg/mL TPP solution was slowly added to the pH-adjusted solution under magnetic stirring at 300 rpm for 30 min. Four different mass ratios (5:1, 10:1, 15:1, 20:1) of chitosan to TPP were used for the preparation. The chitosan nanoparticles were collected under centrifugation at 12000 rpm at 20 °C for 60 min. The supernatant liquid was used to calculate the cisplatin encapsulation efficiency. Table 1 shows the ingredients, amounts, and mass ratios of the prepared nanoparticles.
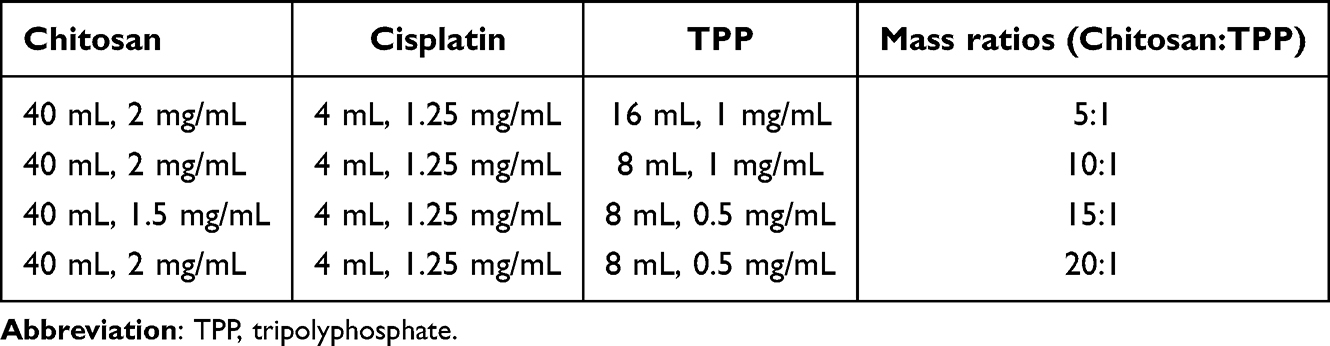 |
Table 1 Ingredients, Amounts, and Mass Ratios of the Prepared Nanoparticles |
Determination of Particle Size, Polydispersity Index, Zeta Potential, and Encapsulation Efficiency (%)
The particle size, polydispersity index, and zeta potential of chitosan nanoparticles were measured via dynamic light scattering (DLS) analyses using a 90Plus Nanoparticle Size Analyzer (Brookhaven Instruments Corp., Holtsville, NY, USA). The particle size measurements were conducted at a wavelength of 632.8 nm, a fixed 90° angle, and temperature of 25 °C. BIC software with a dust filter cutoff value of 30 was used to analyze the particle size and polydispersity index. ZetaPlus software was used to measure the zeta potential. To measure cisplatin encapsulation efficiency (%), cisplatin concentrations of 0.625, 1.25, 2.5, and 5 μg/mL were prepared to establish a calibration curve. Subsequently, o-phenylenediamine (OPDA) was dissolved in dimethylformamide to form a 1.4 mg/mL solution. OPDA solution (0.5 mL) and cisplatin (0.5 mL) were reacted at 90 °C for 10 min to form a light blue product, which was then cooled in an ice bath for 10 min to terminate the reaction. An ultraviolet visible (UV-Vis) spectrophotometer (Agilent 8453, Agilent Technologies, Santa Clara, CA, USA) was used to measure the absorbance at 703 nm.29 Cisplatin encapsulation efficiency was calculated using the following formula:

where the subscript 0 represents the initial state, and s represents the supernatant liquid.
In vitro Release
Because the mass ratio of chitosan to TPP of 15:1 exhibited the highest encapsulation efficiency, this ratio was selected for the following experiment. To measure release in vitro, 5 mL of phosphate-buffered saline (PBS) was added to 1 mL of chitosan nanoparticles containing approximately 195 μg of cisplatin (1.25 mg × 15.6% encapsulation efficiency) and stirred at 100 rpm at 37 °C. At every time point, 0.7 mL of the solution was removed for UV measurement using the UV-Vis spectrophotometer and 0.7 mL of PBS was added to keep the total volume constant.
Morphology
The morphology of chitosan nanoparticles was examined using transmission electron microscopy (TEM) (JEM-1400, JEOL Ltd., Tokyo, Japan) at an accelerating voltage of 80 kV. Nanoparticles on copper grids were treated with 1% uranyl acetate for negative staining.
Cellular Uptake
Cisplatin-encapsulated chitosan nanoparticles were prepared as described previously. However, 5 mL of fluorescein isothiocyanate (FITC) solution (1 mg/mL, Thermo Fisher Scientific, Waltham, MA, USA) dissolved in anhydrous methanol was added to the chitosan solution after sonication. The reaction was kept in the dark at room temperature for 4 h. The rest of the procedure was the same as described previously. The FITC-labeled chitosan nanoparticles were precipitated by adding 0.5 M NaOH until the pH value was 10. The unreacted FITC was washed with deionized water and separated by centrifuging repeatedly until no fluorescence was detected in the supernatant.30
Hoechst 33342 (Sigma-Aldrich) was added to mouse oral squamous cell carcinoma (MOC2) cells (Kerafast, Inc., Boston, MA, USA), an aggressive growth phenotype derived from primary tumors in C57BL/6 mice, which were incubated at 37 °C for 15 min. Subsequently, MOC2 cells were washed twice with 0.1 M PBS, and 55 mg nanoparticles were added, followed by incubation for 2 h. The concentration of nanoparticles was 27.5 mg/mL. The cells were washed twice with 0.1 M PBS and then observed using a confocal laser scanning microscope (LSM780, Carl Zeiss, Oberkochen, Germany).
Cell Viability
MOC2 cells were cultured in 24-well culture plates (5×10⁴ per well) for 24 h to allow cell attachment. Subsequently, cisplatin-encapsulated chitosan nanoparticles (0.68, 1.27, 2.34, 4.03, and 6.26 mg/mL) were added so that the wells contained cisplatin at concentrations of 2.4, 4.5, 8.3, 14.3, and 22.2 µg/mL and cultured for 1 d. The culture plates without added cisplatin-encapsulated chitosan nanoparticles served as controls. The survival rate was calculated using the following formula:

The cells were then incubated at 37 °C for 3 h with a mixture of 3-(4,5-dimethylthiazol-2-yl)-2,5-diphenyltetrazolium bromide (MTT) solution: Dulbecco’s modified Eagle’s medium = 9:1. The medium was then aspirated and 0.5 mL of dimethyl sulfoxide was added. The optical density at 570 nm was measured using a microplate reader (ELx 800, Biotek, Winooski, VT, USA).
Preparation of Patches Containing Hydrogels and Chitosan Nanoparticles
To facilitate the application of chitosan nanoparticles, 1.358 g of N-isopropylacrylamide was dissolved in 20 mL of deionized water, and then 0.0264 g of ammonium persulfate was added and mixed until dissolved.31 Subsequently, chitosan nanoparticles containing approximately 195 μg of cisplatin (1.25 mg × 15.6% encapsulation efficiency) were mixed with 1 mL of hydrogel and then poured onto porous non-woven fabric facial mask paper with a diameter of 1.2 cm (Nikita, FPI Trade) to form a cisplatin patch. Finally, each patch was irradiated under 400 W UV light for 15 min using a UV curing machine (XL-UV, Guan Chun Machine, New Taipei City, Taiwan). Images of the synthesized patch after being dried at 50 °C for 30 min, immersed in deionized water for 30 min and then stored below 33 °C, and immersed in deionized water for 30 min and then stored above 33 °C, were captured using a digital camera (Olympus E-300, Olympus Imaging America Inc., New York, NY, USA) in combination with a 50-mm 1:2 macro lens as well as an automatic ring-light electronic flash illumination.
Swelling Analysis of Patches
Six patches were weighed using an analytical balance (HR-200, A&D Weighing, Co., Bradford, MA, USA) to an accuracy of 0.001 g after preparation and then immersed in distilled water (50 mL) at 37 °C for 30 min and 24 h. The patches were weighed again and the water absorption (Wab) of the patches was calculated as a percentage using the following equation:

where M1 is the initial weight of the patch before immersion in water (after sample preparation) and M2 is the weight of the patch after immersion for 30 min and 24 h.
Ex vivo Permeation Across Mouse Skin
Three different electrochemical methods were used: CCCP, CCP, and DPV. In CCCP, the current was set at 0.5 mA or 1 mA (Figure 1a) and operated for 30 min. The CCP group contained three subgroups, with the current of each CCP cycle being set at 1 mA for 0.5 s and 0 mA for 0.5 s (1800 cycles) (on:off = 0.5 s:0.5 s), 1 mA for 1 s and 0 mA for 1 s (900 cycles, Figure 1b) (on:off = 1 s:1 s), and 1 mA for 2 s and 0 mA for 2 s (450 cycles) (on:off = 2 s:2 s). The total operation time was 30 min. The DPV group contained four subgroups (Table 2), and a representative graph of voltage versus time is shown in Figure 1c. In DPV, the initial potential increased gradually in steps with a fixed amplitude to reach the set upper limit potential, with a total operation time of 30 min.
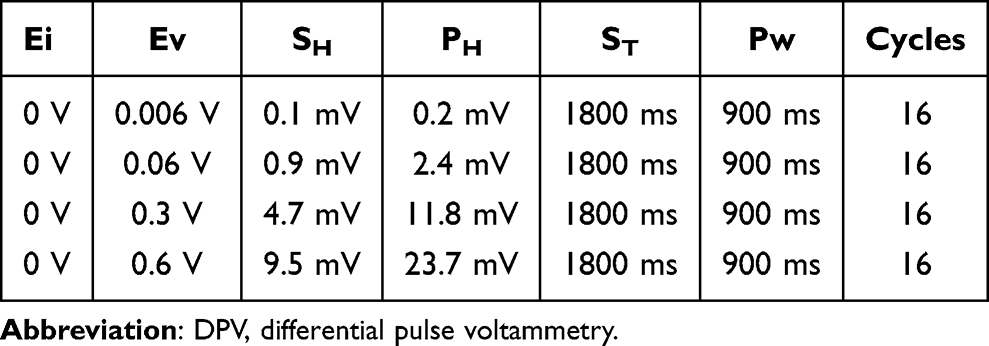 |
Table 2 Parameters of the Four DPV Subgroups |
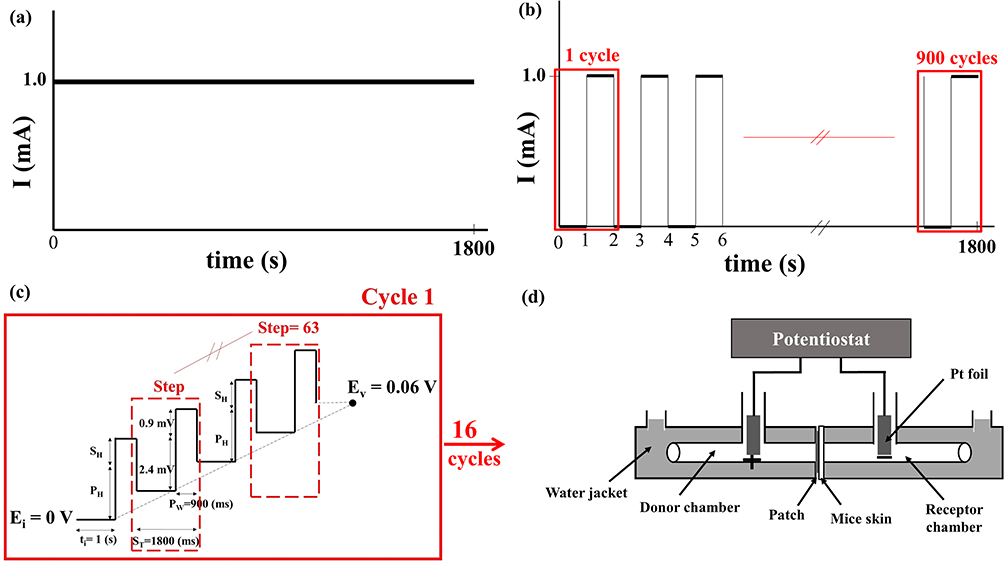 |
Figure 1 Schematic diagrams of current variation with time in the (a) constant-current chronopotentiometry (CCCP, 1 mA) and (b) cyclic chronopotentiometry (CCP, 1 mA, on:off = 1 s:1 s) groups, and of voltage variation with time in (c) the differential pulse voltammetry (DPV, 0–0.06 (V) group. (d) A customized horizontal glass bath was connected to a commercial potentiostat (SP150) for measuring cisplatin release. |
A customized horizontal glass bath (Figure 1d) filled with PBS was placed on a heating plate for temperature control at 37 °C and two magnetic stir bars were placed on both sides of the chamber, stirring at 500 rpm. The bath was connected to a commercial potentiostat (SP150, Bio-Logic Science Instruments, Claix, France). The passive group received cisplatin patches without undergoing CCCP, CCP, or DPV. The back skin of C57BL/6 mice was collected for in vitro experiments. They were sacrificed and the hair on their backs was removed. The skin was separated from the underlying tissue using scissors and trimmed to approximately 0.6 mm in thickness. The thickness and resistance of the skin of each mouse were measured using an electronic vernier (CD-10CX, Mitutoyo Co., Ltd., Tokyo, Japan) and a commercial potentiostat, respectively. Each piece of mouse skin was then placed together with a cisplatin patch in the middle of the customized horizontal glass bath, with the middle of the frame secured using paraffin and insulating tape. After the electrochemical experiment, 6 mL of PBS from the receptor chamber was analyzed to detect the cisplatin content.
In vivo Studies Using the Mouse Model
The design of the animal experiments (Figure 2) was modified from a previous study.31 The experiments included five groups (control, passive, CCCP, CCP, and DPV), each comprising eight mice, all of which were injected with MOC2 cells. MOC2 cells have been used to produce tumors with low immunogenicity and high metastatic incidence.32 Mice that received no cisplatin patches or any electrochemical treatment served as controls. All other groups of mice received cisplatin patches. The passive group comprised mice that received cisplatin patches but did not receive any electrochemical treatment. The mice treated with CCCP at a current of 1 mA constituted the CCCP group (Figure 1a). The mice treated with CCP with the current of each cycle set at 1 mA for 1 s and 0 mA for 1 s (900 cycles, Figure 1b) constituted the CCP group. The mice in the DPV group were treated using DPV with the parameters shown in Table 2 (Ei 0 V to Ev 0.06 V).
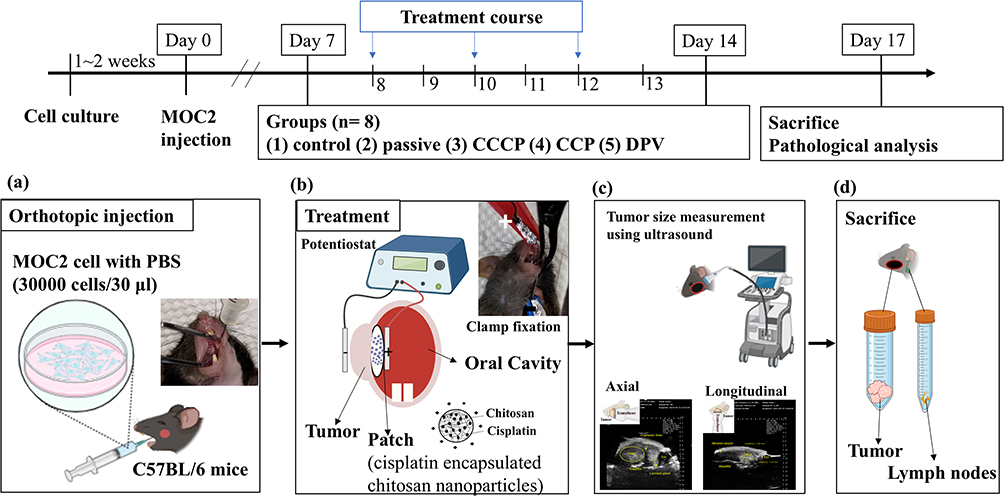 |
Figure 2 Schedule of the animal experiment. (a) MOC2 cancer cells were injected into the oral mucosa of C57BL/6 mice. (b) A patch containing cisplatin-encapsulated chitosan nanoparticles was placed on the tumor. A positive electrode was placed inside the oral cavity and a negative electrode was placed on the outside of the cheek. The tumor and the patch were clamped together with a conducting clip. (c) Tumors were located and measured axially and longitudinally using ultrasound. (d) Mice were sacrificed, and tumors as well as lymph nodes were prepared for histologic examinations. Abbreviations: CCCP, constant-current chronopotentiometry; CCP, cyclic chronopotentiometry; DPV, differential pulse voltammetry. |
Six-week-old wild-type C57BL/6 mice were purchased from the National Laboratory Animal Center in Taiwan and raised in the Animal Center of National Taiwan University School of Medicine for 3–7 d to acclimate the mice to the environment. All animal experiments complied with ARRIVE guidelines and were conducted in accordance with the National Research Council’s Guide for the Care and Use of Laboratory Animals. The guidelines and protocols were approved by the Institutional Animal Care and Use Committee of National Taiwan University (IACUC- 20210234). MOC2 cells (30,000 cells/30 μL) were injected into the oral mucosa of each 7-week-old mouse under isoflurane gas anesthesia (Figure 2a) on what was designated as Day 0. A PB406 probe (Prospect T1, S-Sharp Corporation, New Taipei City, Taiwan) providing ultrasound radiation and a B-mode scan frequency of 33–50 MHz was used to track tumor size progression33 and measure tumor size (approximately 10–20 mm3) on Day 7. The body weight of mice during the experiment was measured to maintain the weight change of the mice within 20% of the original body weight to comply with animal welfare regulations.
All mice were treated at 2-day intervals from Days 8 to 13. Each mouse received three treatments, each lasting 30 min. Tumor size was also measured using ultrasound after the second (Day 11) and third (Day 14) treatments. For the treatment, the mouse was anesthetized with Zoletil 50® and Rompun® and injected intraperitoneally. Vaseline was applied to the cheek of the mouse and a cisplatin patch was applied to the inside of the mouse’s cheek. The positive electrode (platinum) of the potentiostat was then placed inside the oral cavity and the negative electrode (platinum sheet) was placed on the outside of the cheek. The tumor and the patch were held together with a metal clamp (Figure 2b) before electrochemical treatment was performed. The long and short axes of the tumor were measured and the following equation was used to calculate the tumor volume34 (Figure 2c):

where a represents the length of the long axis, and b represents that of the short axis.
The tumors and neck lymph nodes were removed, immobilized in 10% formalin, embedded in paraffin, sectioned, and subjected to hematoxylin-eosin (H&E) staining and immunohistochemistry (IHC) staining (Figure 2d). To quantify the severity of tumor necrosis, it was stratified from 1 to 5: 1 = minimal (< 1%); 2 = mild (1–25%); 3 = moderate (26–50%); 4 = moderate/severe (51–75%); 5 = severe/high (76–100%). The proportion (%) of Ki-67 positive (brown) cells in 500 cells was calculated and statistically analyzed.35 The area of pan-CK positive (brown) was framed on the lymph node by image J, and the percentage (%) of the positive area to the total lymph node area was calculated and analyzed.36 To confirm the successful electrochemical diffusion of cisplatin into tumors, tumors (n = 4) were excised and analyzed for Pt content using inductively coupled plasma mass spectrometry (ICP-MS, Agilent 7700 Series, Agilent Technologies).
Statistical Analysis
A one-way analysis of variance was performed using SPSS software (SPSS 22.0, IBM, Armonk, NY, USA) to analyze differences between values. The level of significance was 0.05 based on Tukey–Kramer multiple comparison tests.
Results and Discussion
The general properties of cisplatin-encapsulated chitosan nanoparticles were examined. The particle size distribution of four different nanoparticles with chitosan-to-TPP mass ratios of 5:1, 10:1, 15:1, and 20:1 is demonstrated in Figure 3a–d. All chitosan nanoparticles revealed two groups of particle size distributions with a smaller size less than 500 nm and a larger size greater than 1000 nm. The polydispersity index was 0.34 ± 0.02, 0.07 ± 0.04, 0.14 ± 0.09, and 0.28 ± 0.02, respectively (Figure 3e). The zeta potentials (mV) of four different nanoparticles with chitosan-to-TPP mass ratios of 5:1, 10:1, 15:1, and 20:1 were 11.37 ± 0.29, 11.45 ± 0.57, 12.05 ± 0.58, and 11.57 ± 0.68, respectively (Figure 3f), indicating that the surface of the nanoparticles was positively charged. Their respective encapsulation efficiencies were 7.44 ± 0.39%, 10.40 ± 0.58%, 15.60 ± 0.91%, and 7.28 ± 1.05% (Figure 3g). Because the encapsulation efficiency was highest when the mass ratio was 15:1, this mass ratio was used in the subsequent experiments. Figure 3h and i show the percentage and concentration (mg/mL), respectively, of cisplatin released from the nanoparticles in PBS solution at 37 °C. During the first 24 h, 28.16% (0.011 mg/mL) of cisplatin was released. Subsequently, the release gradually slowed down until Day 35, when the release reached 100% (0.033 mg/mL). TEM examination revealed that the size of spherical discrete chitosan nanoparticles was smaller than 200 nm (Figure 3j), but aggregation was also noted (Figure 3k).
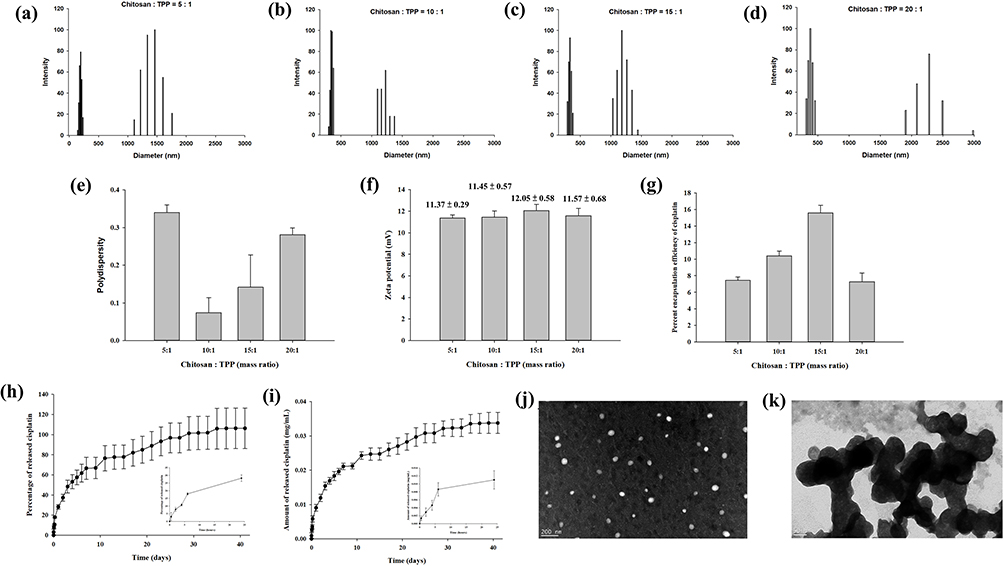 |
Figure 3 (a–d) Particle size distribution, (e) polydispersity index, (f) zeta potential, and (g) encapsulation efficiency of the chitosan nanoparticles prepared with four different chitosan-to-tripolyphosphate (TPP) mass ratios (5:1, 10:1, 15:1, 20:1). Two groups of particle size distributions were found for chitosan nanoparticles with a smaller size less than 500 nm and a larger size greater than 1000 nm. The zeta potential of the nanoparticles indicated that their surfaces were positively charged. The encapsulation efficiency was the highest when the mass ratio of chitosan to TPP was 15:1. The (h) percentage and (i) concentration (mg/mL) of cisplatin released from the nanoparticles prepared with the mass ratio of 15:1. Of the cisplatin, 28.16% (0.011 mg/mL) was released within the first 24 h, and progressively slower release continued until 100% (0.033 mg/mL) release was achieved on Day 35. (j) The nanoparticles prepared with the mass ratio of 15:1 were spherical with a size range of 100–200 nm and the size increased after aggregation (k). |
The positive charge on nanoparticle surfaces, as revealed by the zeta potential measurements, may have resulted from the protonation of D-glucosamine in the polymer structure.37 This positively charged surface adheres more readily to mucosa and increases the potential for cellular uptake.38 The encapsulation efficiency correlated with the chitosan concentration until the mass ratio was 15:1; the higher the chitosan concentration, the higher the encapsulation efficiency. However, a higher chitosan concentration also increased the solution viscosity, which negatively affected encapsulation efficiency because of the restriction of uniform dispersion of cisplatin molecules around the chitosan molecular chains during nanoparticle formation in the viscous solution.39 Therefore, the encapsulation efficiency of cisplatin decreased when the mass ratio of chitosan to TPP was 20:1.
A quick release of cisplatin was noted during the first 24 h, although 100% release was achieved on Day 35 (Figure 3h and i). This burst of cisplatin is a challenge for drug delivery and the mechanism is ascribed to swelling, dissolution, and partitioning of the nanocarrier.40 By contrast, diffusion and erosion are considered the predominant mechanism of sustained release. Synthesized chitosan nanoparticles are very reactive because of high surface energy, and aggregation reduces this surface energy.41 Therefore, the particle size distribution demonstrated non-aggregation and aggregation nanoparticles (Figure 3a–d, j and k).
Confocal laser scanning microscopy was used to examine MOC2 cells stained with Hoechst 33342 and incubated with FITC-labeled chitosan nanoparticles for 2 h. Figure 4a shows a fluorescence image of FITC-conjugated chitosan nanoparticles in green, and Figure 4b shows a bright-field image of the MOC2 cells. Figure 4c shows a fluorescence image of MOC2 cells in blue, and Figure 4d presents a merged image of Figure 4a–c. The FITC-labeled chitosan nanoparticles were located in the cytoplasm. Two main pathways have been noted for nanoparticle endocytosis, including phagocytosis and pinocytosis.38 After endocytosis, chitosan nanoparticles were transported from endosomes to lysosomes, where they were degraded by enzymes, followed by drug release. The results of this study suggested that FITC-labeled chitosan nanoparticles were delivered to the cytoplasm via endocytosis.
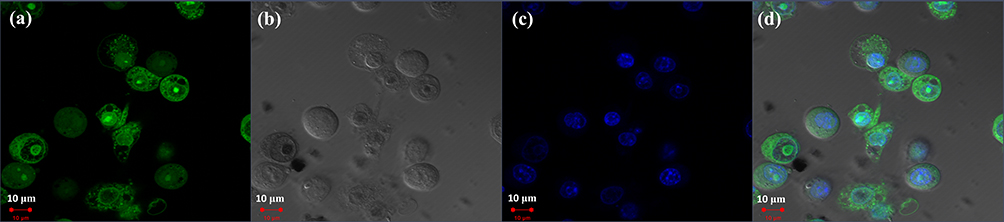 |
Figure 4 Endocytosis of fluorescein isothiocyanate (FITC)-labeled chitosan nanoparticles by MOC2 cells. (a) Fluorescence image of FITC-conjugated chitosan nanoparticles in green. (b) Bright-field image of MOC2 cells. (c) Fluorescence image of MOC2 cells in blue. (d) Merged image of (a–c). |
The results of the MTT assay revealed that as the cisplatin concentration increased, the survival rate of MOC2 cells decreased (Figure 5a). It was reduced to 81% when cisplatin at 2.4 µg/mL was added and was further reduced to 43% when cisplatin at 8.3 µg/mL was added.
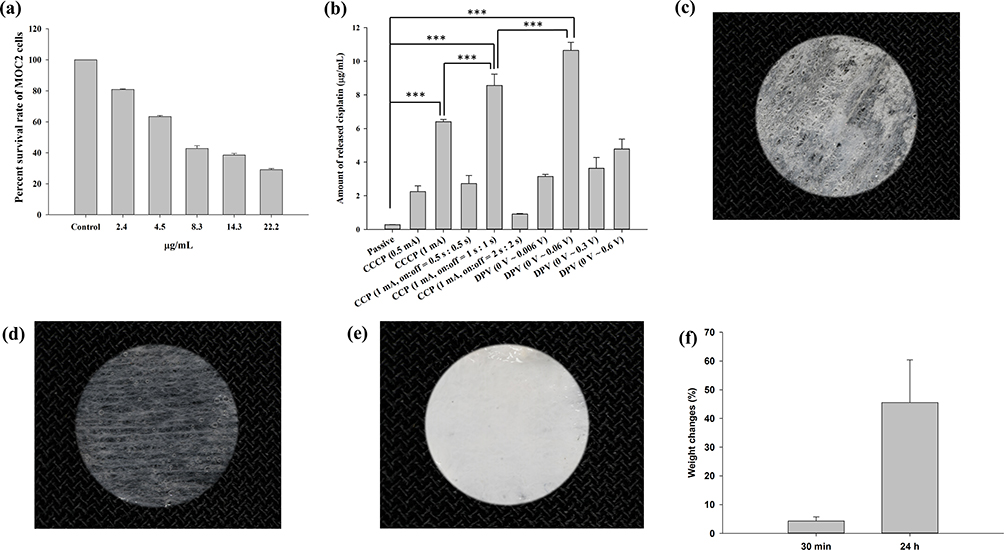 |
Figure 5 (a) Effects of different cisplatin concentrations on MOC2 cell viability according to an MTT assay. The survival rate of MOC2 cells decreased with increasing cisplatin concentrations. (b) Cisplatin release in the receptor chamber of a customized horizontal glass bath. The highest release of cisplatin occurred in the DPV (0–0.06 (V) group. Significant differences are labeled as *** (p < 0.001). Images of a patch after being (c) dried at 50 °C for 30 min, (d) immersed in deionized water for 30 min then stored below 33 °C, and (e) immersed in deionized water for 30 min then stored above 33 °C. (f) The weight changes (%) of patches after immersion in distilled water for 30 min and 24 h were 4.3 ± 1.4% and 45.5 ± 14.9%, respectively. Abbreviations: CCCP, constant-current chronopotentiometry; CCP, cyclic chronopotentiometry; DPV, differential pulse voltammetry. |
Table 3 shows the thickness and electrical resistance of mouse skin. The average thickness of mouse skin ranged from 0.588 to 0.685 mm, and the average resistance ranged from 5.604 to 7.494 Ω. Figure 5b shows the amount of cisplatin released in the receptor chamber of the glass bath when the patch coated with chitosan-encapsulated nanoparticles was in contact with mouse skin and placed between the two chambers (Figure 1d). The passive group with no electrical current applied exhibited the least release (0.28 μg/mL). In the CCCP group, the 1 mA current prominently increased cisplatin release compared with the 0.5 mA current (6.41 μg/mL vs 2.24 μg/mL). In the CCP group, the on:off = 1 s:1 s subgroup exhibited the highest cisplatin release (8.56 μg/mL), which was significantly higher than the CCCP (1 mA) group (***p < 0.001). In the DPV group, the 0–0.06 V subgroup exhibited the highest cisplatin release (10.65 μg/mL), which was significantly higher than the CCP (1 mA, on:off = 1 s:1 s) subgroup (***p < 0.001).
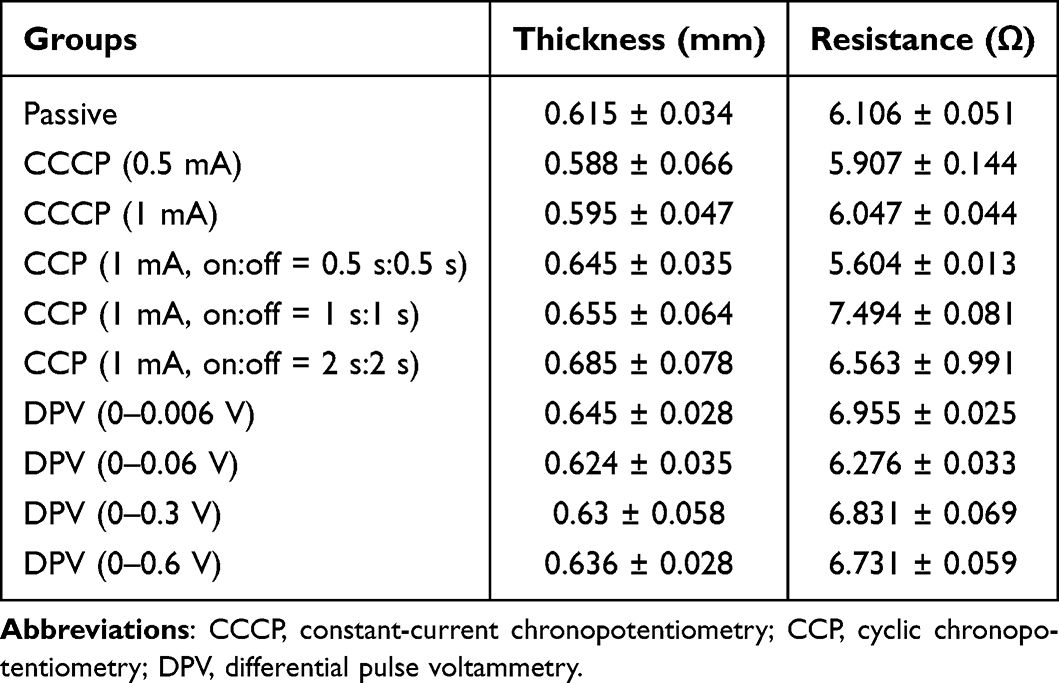 |
Table 3 Thickness and Resistance of Mouse Skin |
Iontophoresis may lead to higher nanoparticle penetration,42 and a higher electrical current can improve iontophoresis efficiency, as shown in the CCCP group.43 The effect of iontophoresis is generally related to current density (mA/cm2). In this study, the patch was 1.2 cm in diameter and had a surface area of 1.13 cm2, which fit the oral cavity of the mice. The current density was 0.88 mA/cm2 (1 mA /1.13 cm2) for the CCCP experiments. A previous study demonstrated that a current density of 0.5 mA/cm2 for 24 h did not affect skin morphology and skin resistance returned to baseline levels after current interruption.44 Previous studies have mostly investigated the penetration of drugs through the skin, but did not include electrodes in contact with both mucosa and the cheek at the same time, as in this study. Other studies have used a transbuccal delivery device (IntelliDrug, 0.21 mA (2 mA/cm2), 10 min) to introduce alcohol withdrawal drugs into the cheeks of pigs and humans.45,46 The results showed that the drug delivery efficiency was 4–17 times higher compared with conventional oral administration, and no adverse effects were observed. Therefore, a current intensity of 2 mA/cm2 for intraoral use is acceptable Moreover, the human body cannot feel a current with an intensity < 1 mA.47 Thus, a current intensity as high as 0.88 mA/cm2 was adopted in this study. Because CCCP (1 mA) produced higher cisplatin release than CCCP (0.5 mA), this subgroup was chosen in the animal study.
In this study, the CCP source signal was a square wave, which provided depolarization time to reduce skin impedance. The pulse waveform allowed the skin to depolarize and return to a primary state before the next pulse started.48 Therefore, electric charges did not accumulate in the surface layer, thereby improving the drug penetration efficiency. Another study also showed that pulsed current increased drug penetration and reduced patient discomfort and skin irritation.49 This study also supported the role of pulsed current, because the amount of cisplatin released was significantly higher in the CCP (1 mA, on:off = 1 s:1 s) subgroup than in the CCCP (1 mA) subgroup (Figure 5b).
Figure 5c shows the image of a patch dried at 50 °C for 30 min. The lower critical solution temperature of poly(N-isopropylacrylamide) is approximately 33 °C and the components are immiscible above this temperature.50 After being immersed in deionized water for 30 min and then stored below 33 °C, the patch swelled due to water absorption within the matrix (Figure 5d). By contrast, poly(N-isopropylacrylamide) shrank and became opaque after being immersed in deionized water for 30 min and then stored above 33 °C (Figure 5e). Swelling analysis revealed that the weight changes (%) of the patches after immersion in distilled water for 30 min and 24 h were 4.3 ± 1.4% and 45.5 ± 14.9%, respectively (Figure 5f). The results indicated the water absorption property of the hydrogel contained in the patches. However, the patch was designed for use once and 30 min each time and 4.3% swelling may not cause visible volume changes.
Previous studies have developed a transungual system using constant voltage iontophoresis to effectively deliver efinaconazole to treat onychomycosis.51,52 In addition, an electric field generated by applying a voltage of 50–70 mV and a current of 3 mA was found to produce a drug delivery effect that maximized the percentage of dead cells.53 The highest cisplatin release in the DPV group was not produced by the subgroup with the highest voltage (0–0.6 V) but from that with the lower voltage (0–0.06 V), indicating that a higher voltage does not necessarily lead to better drug delivery. The reason is that applying higher voltages can cause changes in the molecular structure of nanoparticles, thereby reducing drug penetration.54,55 Morphological changes in nanoparticles may further affect the efficiency of penetration through barriers such as skin or mucous membranes.56 Based on the results of electrochemical treatment to enhance the release of cisplatin through mouse skin, the CCCP (1 mA), CCP (1 mA, on:off = 1 s:1 s), and DPV (0–0.06V) subgroups were selected for animal experiments.
Figure 6a shows the ultrasound measurements of tumor size at different time points (Days 7, 11, and 14). Before treatment (Day 7), no significant difference was observed in tumor size among the groups. After the second treatment (Day 11), the tumor size of the control group (68.6 ± 8.3 mm3) was significantly larger than that of the CCP (1 mA, on:off = 1 s:1 s) group (21.5 ± 14.6 mm3) and the DPV (0–0.06 V) group (28.4 ± 11.8 mm3) (**p < 0.01). On Day 11, the tumor sizes in the passive group (55.3 ± 16.9 mm3) and the CCCP (1 mA) group (50.3 ± 21.5 mm3) were similar, with no significant difference. After the third treatment (Day 14), the tumor sizes in the control group (121.2 ± 22.0 mm3) and passive group (132.7 ± 32.0 mm3) were significantly larger than those in the CCP (1 mA, on:off = 1 s:1 s) group (57.9 ± 17.0 mm3) and DPV (0–0.06 V) group (62.4 ± 24.0 mm3) (Figure 6a).
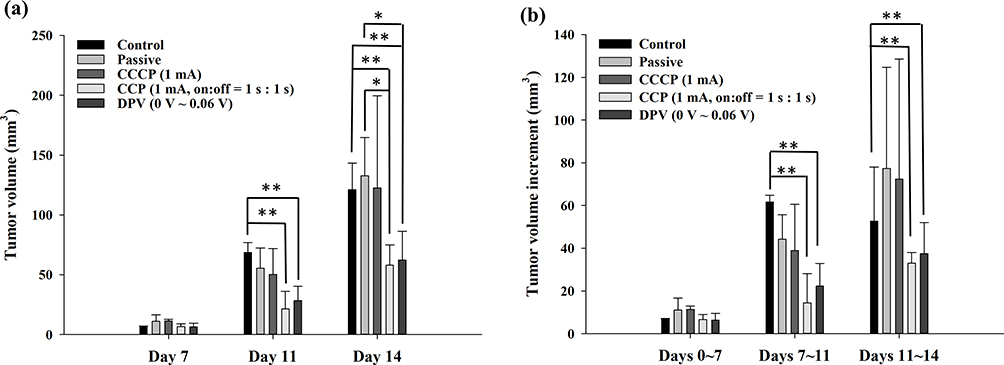 |
Figure 6 (a) Tumor volume (mm3) measured using ultrasound on Days 7, 11, and 14. (b) The tumor volume increment (mm3) was determined by subtracting the previously measured volume. Significant differences are labeled as * (p < 0.05) and ** (p < 0.01). Abbreviations: CCCP, constant-current chronopotentiometry; CCP, cyclic chronopotentiometry; DPV, differential pulse voltammetry. |
The tumor volume increment was determined by subtracting the previously measured size, as shown in Figure 6b. The tumor volume increments in the control group from Days 7 to 11 and from Days 11 to 14 were significantly higher than the corresponding increments in the CCP (1 mA, on:off = 1 s:1 s) group and DPV (0–0.06 V) group. The results showed that the CCP and DPV methods effectively inhibited tumor growth after the second treatment.
Contrary to the general expectation of rampant tumor growth in the control group, tumors in the passive and CCCP groups grew slightly faster than in the control group before and after the third treatment (Days 11 to 14), but the difference was not significant (Figure 6b). The reason for the slightly slower growth rate may be that the tumor size of the control group grew faster from Days 7 to 11 than in the other four groups. However, the limited space in the cheek may have slowed down the growth in tumor size, causing the increment of the tumor volume to decrease, as the tumor continued to grow and invade the neighboring tissues or organs. Tumor volume increments from Days 7 to 11 were generally smaller than those from Days 11 to 14. The reason was that two electrochemical treatments (on Days 8 and 10) were performed between Days 7 and 11, whereas only one treatment (on Day 12) was performed between Days 11 and 14. This showed that the frequency of treatment influenced the growth rate of the tumor.
Axial and longitudinal ultrasound images of a tumor and the surrounding organs and bone are shown in Figure 7a and b, respectively.57 The mandible was located below the tumor, and a round black shadow on the right side represented the eye, with a lacrimal gland nearby. A dark shadow was clearly discernible near the tumor (Figure 7a), which was due to the upper bones (particularly those corresponding to the zygomatic bone) blocking ultrasound penetration. Longitudinal view images provided a clearer perspective than axial view images. Figure 7c shows the longitudinal images in each group and they present a clear boundary between the tumor and muscle, allowing the tumor parts to be clearly distinguished.
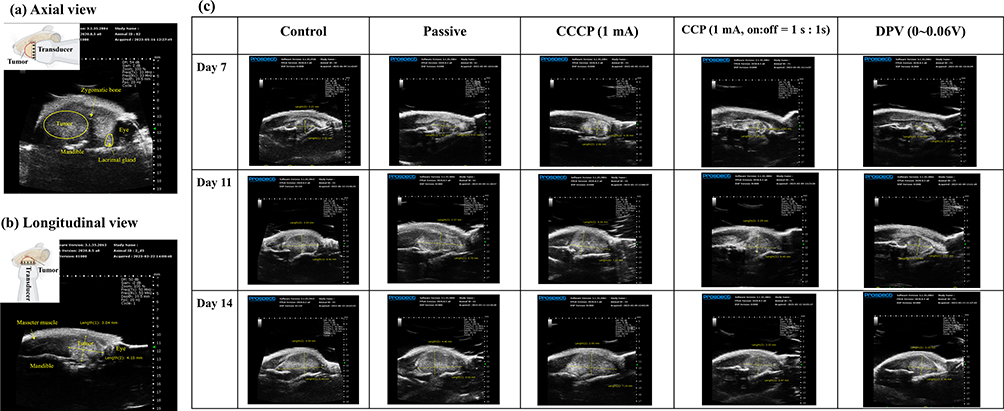 |
Figure 7 Ultrasound imaging of tumors. (a) Axial view (the yellow circle outlines the tumor). (b) Longitudinal view (the crossed arrows represent the tumor). (c) Longitudinal views of the control, passive, CCCP (1 mA), CCP (1 mA, on:off = 1 s:1 s), and DPV (0–0.06 (V) groups on Days 7, 11, and 14. Abbreviations: CCCP, constant-current chronopotentiometry; CCP, cyclic chronopotentiometry; DPV, differential pulse voltammetry. |
In comparison, distinguishing the tumor margin with the naked eye was difficult on Day 7 and, when the tumor size was small, using an electronic ruler for measurement might have underestimated the tumor size. When tumors grew too large and extended beyond the jawbone, the accuracy of ultrasound measurements was compromised. Therefore, the duration of the animal studies was limited to 14 days so that ultrasound could effectively measure tumor size.
A pilot study was conducted to determine appropriate treatment options and implement 3R (replacement, reduction, refinement) principles for mouse experiments. We observed that when cheek tumors grew to macroscopic levels (approximately 10–12 d), they influenced food intake, body weight, and vital signs in mice. To prevent excessive tumor growth from affecting the results, the experiment design included animal sacrifice on Day 17, with body weight loss within 20%. Vaseline was also regularly applied to wounds caused by scratches and bites. Figure 8 shows the body weight changes in mice from Days 8 to 17. Overall, weight loss occurred in all groups. However, no significant differences were observed at different time points within the same group. Furthermore, no significant differences were observed among groups at the same time point. The study complied with animal welfare regulations, and the weight of the mice did not decrease to < 20% of their original body weight during the experiment.
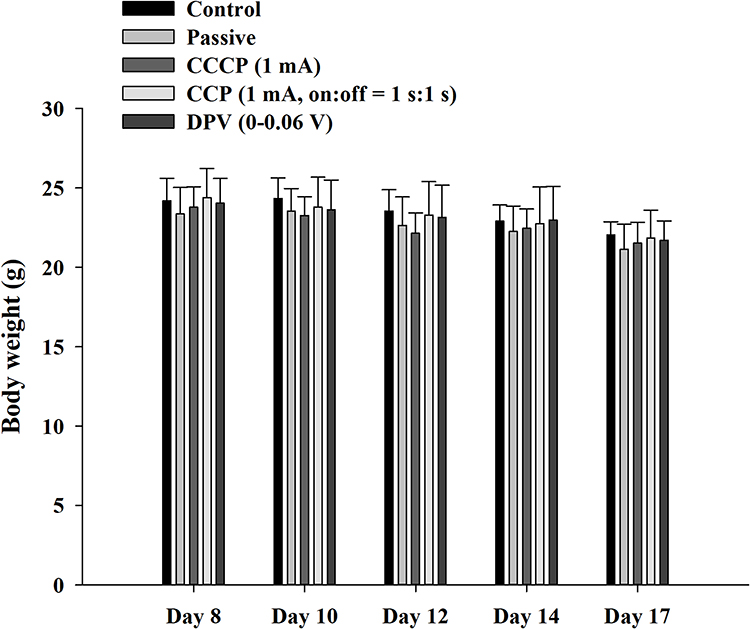 |
Figure 8 Body weight of mice during the experiment. The weight change of the mice was maintained within 20% of the original body weight during the experiment. Abbreviations: CCCP, constant-current chronopotentiometry; CCP, cyclic chronopotentiometry; DPV, differential pulse voltammetry. |
Histopathological examination of the xenograft tumors revealed significantly larger central necrotic areas (delineated by arrows) within the tumors of the control, passive, and CCCP (1 mA) groups than both the CCP (1 mA, on:off = 1 s:1 s) and DPV (0–0.06 V) groups (Figure 9a and b). This indicated that the proliferation rate of tumor cells in the former three groups was much faster than that in the latter two groups, resulting in a more severe decoupling of the nutritional needs of active tumor cells from their vascular supply, resulting in more tumor necrosis. Moderate (Grade 3) necrosis was found in the control, passive, and CCCP (1 mA) groups. In comparison, the CCP (1 mA, on:off = 1 s:1 s) and DPV (0–0.06 V) groups exhibited a mild (Grade 2) degree of necrosis.
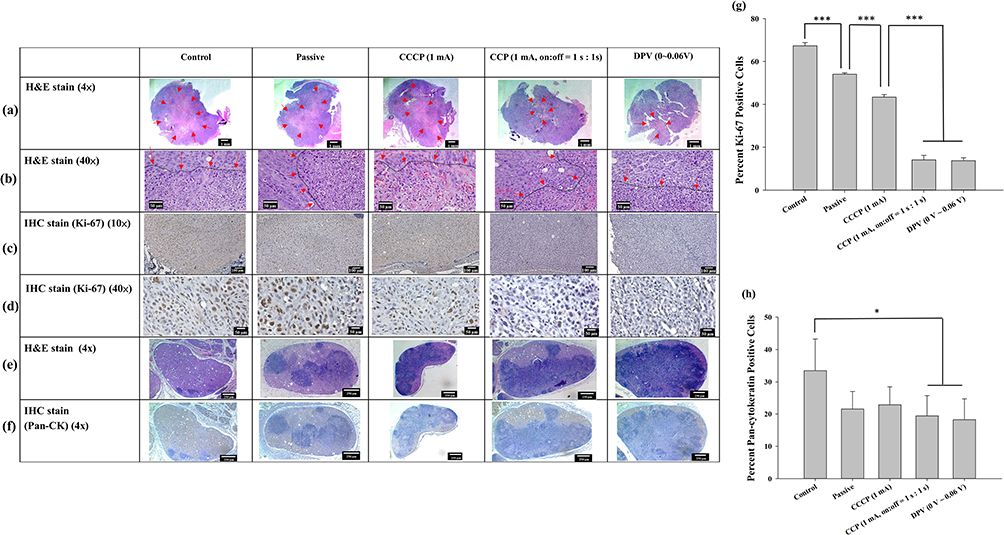 |
Figure 9 Tumor histology observed at (a) 4× and (b) 40× magnification using H&E staining. Arrows indicate the central region displaying signs of cell death, characterized by cytoplasmic staining after cell rupture. The black dashed lines indicated by arrows delineate the boundaries between tumor cells and areas of cell death. IHC staining of Ki-67 in brown color at (c) 10× and (d) 40× magnification. (e) H&E staining (4×) and (f) IHC staining (4×) of lymph node pan-cytokeratin. The lymph nodes were infiltrated by tumor cells and the original cell structure was damaged. (g) Percentage of Ki-67-positive cells/total cells. (h) Percentage of pan-cytokeratin-positive area/total area. Significant differences are labeled as * (p < 0.05) and *** (p < 0.001). Abbreviations: CCCP, constant-current chronopotentiometry; CCP, cyclic chronopotentiometry; DPV, differential pulse voltammetry; H&E, hematoxylin-eosin; IHC, immunohistochemistry. |
The growth of tumors relies on the peripheral blood vessels to provide nutrients, and the degree of tumor necrosis is related to tumor metastasis.58 Although the degree of necrosis in the control group was the same as that in the passive and CCCP (1 mA) groups, the necrosis area in the control group was larger than that in the other groups, indicating a higher degree of tumor cell infiltration. Conversely, the degree of tumor necrosis and lymph node infiltration in the CCP (1 mA, on:off = 1 s:1 s) group and the DPV (0–0.06 V) groups was less, indicating that the two methods more strongly inhibited tumor growth.
The proliferative index of tumors was quantified using IHC for Ki-67, a nuclear marker present in all active phases of the cell cycle (Figure 9c and d), and the percentage of Ki-67-positive (brown-stained) cells was calculated based on 500 cell counts. Most positive Ki-67 labeling was located at the peripheral edge of the tumor and consisted of viable tumor cells. The proportion of tumor cells beginning cell division, in descending group order, was control (67.4 ± 1.5%), passive (54.1 ± 0.6%), CCCP (1 mA) (43.4 ± 1.2%), CCP (1 mA, on:off = 1 s:1 s) (14.1 ± 2.1%), and DPV (0–0.06 V) (13.8 ± 1.3%). In addition, the proportions of the CCP (1 mA, on:off = 1 s:1 s) and DPV (0–0.06 V) groups were significantly lower than those of the control, passive, and CCCP (1 mA) groups (p < 0.001). However, no significant differences (p > 0.05) were found between the CCP (1 mA, on:off = 1 s:1 s) and DPV (0–0.06 V) groups (Figure 9g).
Ki-67 is closely related to cell proliferation, and the Ki-67 protein can be detected in both mitotic and interphase cells. Cisplatin mutates DNA and promotes tumor cell apoptosis. Previous studies have shown that well-differentiated oral cancer has higher tumor differentiation (Ki-67 positivity) in the periphery area and lower tumor differentiation in the central area,59 which was supported by the findings shown in Figure 9c. In addition, Ki-67 is a crucial indicator of treatment outcome and should be considered in decisions over future treatment modalities.60
Lymph node metastasis was analyzed using IHC staining of pan-cytokeratin. According to the tumor necrosis stratification system, the control group exhibited moderate (Grade 3) infiltration and the other four groups showed mild (Grade 2) infiltration (H&E and IHC staining of pan-cytokeratin, Figure 9e and f, respectively). Pan-cytokeratin-positive (brown) areas were selected using Image J and divided by the total lymph node area. The results showed that the tumor cell infiltration in the control group (33.5 ± 9.8%) was significantly higher than that in the CCP (1 mA, on:off = 1 s:1 s) group (19.5 ± 6.3%) and the DPV (0–0.06 V) group (18.3 ± 6.5%) (p < 0.05) (Figure 9h).
Pan-cytokeratin is a keratin commonly found in epithelial cells and tumor cells but not in normal lymph nodes.61 Both H&E and IHC staining results revealed tumor cell infiltration in lymph nodes, but the CCP (1 mA, on:off = 1 s:1 s) group (19.5 ± 6.3%) and DPV (0–0.06 V) group exhibited smaller pan-cytokeratin positive area. Because IHC staining is specific for keratin and can identify tumor cells more clearly, the results indicated that the control group exhibited a higher degree of tumor malignancy and cell metastasis. The percentage of Ki-67- and Pan-CK-positive cells was significantly lower in the CCP (1 mA, on:off = 1 s:1 s) group (19.5 ± 6.3%) and the DPV (0–0.06 V) group. It indicated that the treatment outcomes of these two groups was superior to those of the other groups.
Because cisplatin is a coordination complex of platinum (Pt), ICP-MS was used to measure the Pt content in tumors. The control group contained no Pt (< 0.2 ppb) because of the lack of patch treatment (Figure 10). The Pt contents of the other four groups were 0.28 ± 0.12 ng/mg in the passive group, 0.58 ± 0.08 ng/mg in the CCCP (1 mA) group, 0.91 ± 0.17 ng/mg in the CCP (1 mA, on:off = 1 s:1 s) group, and 1.17 ± 0.12 ng/mg in the DPV (0–0.06 V) group. The Pt content of the CCP and DPV groups was significantly higher than that of the CCCP and passive groups. However, no significant difference was found between the CCP (1 mA, on:off = 1 s:1 s) group and the DPV (0–0.06 V) group. The cisplatin content results were consistent with the tumor volume changes and histological findings, suggesting that cisplatin was effectively introduced into the tumors in the CCP (1 mA, on:off = 1 s:1 s) group and the DPV (0–0.06 V) group.
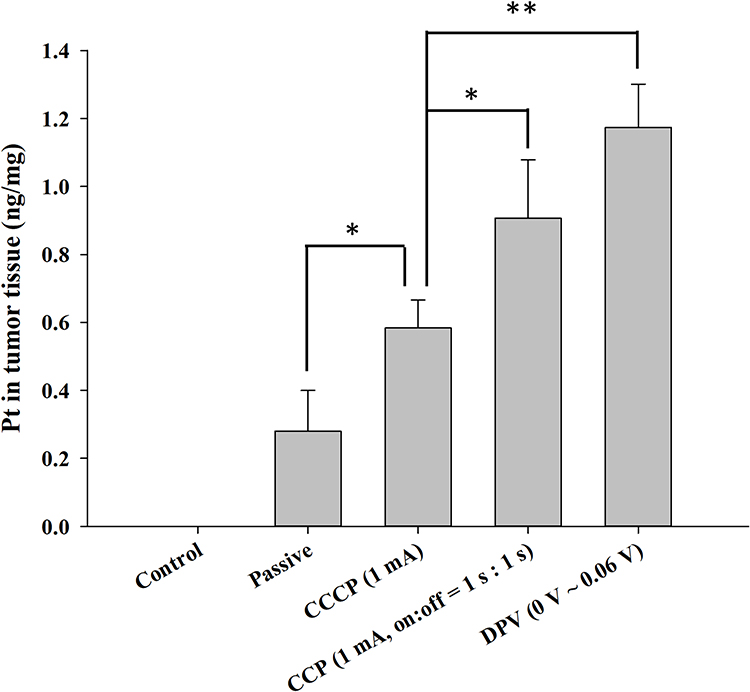 |
Figure 10 Determination of platinum content in tumor tissues using ICP-MS. Significant differences are labeled as * (p < 0.05) and ** (p < 0.01). Abbreviations: CCCP, constant-current chronopotentiometry; CCP, cyclic chronopotentiometry; DPV, differential pulse voltammetry. |
Conclusion
This study successfully used the positively charged properties of chitosan nanoparticles and iontophoresis to enhance the entry of cisplatin into cancerous tissues. In this animal study, chitosan nanoparticles were mixed with a temperature-sensitive hydrogel and porous non-woven fabric mask paper to form patches for easier manipulation and use in different electrochemical methods. Mouse experiments showed that CCP (1 mA, on:off = 1 s:1 s) and DPV (0–0.06 V) groups effectively enhanced the release of cisplatin into tumors and exhibited the optimal tumor inhibitory effect. Although the application of iontophoresis to accelerate the delivery of cisplatin/chitosan nanoparticles in oral cancer treatment yields promising outcomes, future clinical studies are required to prove the efficacy of CCP and DPV methods combined with surgery for oral cancer treatment.
Data Sharing Statement
The data that support the findings of this study are available upon request from the corresponding author. Due to privacy or ethical restrictions, these data are not to be made public.
Ethics Approval
All animal experiments complied with ARRIVE guidelines and were conducted in accordance with the National Research Council’s Guide for the Care and Use of Laboratory Animals. The guidelines and protocols were approved by the Institutional Animal Care and Use Committee of National Taiwan University (IACUC- 20210234).
Acknowledgments
The authors would like to thank National Taiwan University Hospital for assisting in ultrasound measurement.
Author Contributions
All authors made a substantial contribution to the work reported, whether that is in the conception, study design, execution, acquisition of data, analysis and interpretation, or in all these areas; participated in drafting, revising or critically reviewing the article; gave final approval of the version to be published; have agreed on the journal to which the article has been submitted; and agree to be accountable for all aspects of the work.
Funding
This study was supported by grants from the Ministry of Science and Technology of Taiwan (111-2628-B002-037, 112-2314-B-002-081-MY3) and National Taiwan University Hospital (110-S5072, 112-S0131).
Disclosure
The authors declare that they have no conflicts of interest.
References
1. Sung H, Ferlay J, Siegel RL, et al. Global cancer statistics 2020: GLOBOCAN estimates of incidence and mortality worldwide for 36 cancers in 185 countries. CA Cancer J Clin. 2021;71(3):209–249. doi:10.3322/caac.21660
2. Bagan J, Sarrion G, Jimenez Y. Oral cancer: clinical features. Oral Oncol. 2010;46(6):414–417. doi:10.1016/j.oraloncology.2010.03.009
3. Nair S, Tang KD, Kenny L, Punyadeera C. Salivary exosomes as potential biomarkers in cancer. Oral Oncol. 2018;84:31–40. doi:10.1016/j.oraloncology.2018.07.001
4. Zanoni DK, Montero PH, Migliacci JC, et al. Survival outcomes after treatment of cancer of the oral cavity (1985–2015). Oral Oncol. 2019;90:115–121. doi:10.1016/j.oraloncology.2019.02.001
5. Parmar A, Macluskey M, Mc Goldrick N, et al. Interventions for the treatment of oral cavity and oropharyngeal cancer: chemotherapy. Cochrane Database Syst Rev. 2021;12(12):CD006386.
6. Saravanan M. Comment on “Nanomedicine, an emerging therapeutic strategy for oral cancer therapy”. Oral Oncol. 2024;152:106806. doi:10.1016/j.oraloncology.2024.106806
7. Saravanan M, Sampath S, Arockiaraj J. The use of advanced transoral robotic surgery in the treatment of oropharynx squamous cell carcinoma: a modern alternative for open surgery. Oral Oncol. 2023;145:106522. doi:10.1016/j.oraloncology.2023.106522
8. Galluzzi L, Senovilla L, Vitale I, et al. Molecular mechanisms of cisplatin resistance. Oncogene. 2012;31(15):1869–1883. doi:10.1038/onc.2011.384
9. Dasari S, Tchounwou PB. Cisplatin in cancer therapy: molecular mechanisms of action. Eur J Pharmacol. 2014;740:364–378. doi:10.1016/j.ejphar.2014.07.025
10. Barabas K, Milner R, Lurie D, Adin C. Cisplatin: a review of toxicities and therapeutic applications. Vet Comp Oncol. 2008;6(1):1–18. doi:10.1111/j.1476-5829.2007.00142.x
11. Kou S, Peters LM, Mucalo MR. Chitosan: a review of sources and preparation methods. Int J Biol Macromol. 2021;169(1):85–94. doi:10.1016/j.ijbiomac.2020.12.005
12. Saeedi M, Vahidi O, Moghbeli MR, et al. Customizing nano-chitosan for sustainable drug delivery. J Control Release. 2022;350:175–192. doi:10.1016/j.jconrel.2022.07.038
13. Mourya VK, Inamdar NN. Chitosan-modifications and applications: opportunities galore. React Funct Polym. 2008;68(6):1013–1051.
14. Lee BS, Lee CC, Lin HP, et al. A functional chitosan membrane with grafted epigallocatechin-3-gallate and lovastatin enhances periodontal tissue regeneration in dogs. Carbohydr Polym. 2016;151:790–802. doi:10.1016/j.carbpol.2016.06.026
15. Goldberg M, Manzi A, Birdi A, et al. A nanoengineered topical transmucosal cisplatin delivery system induces anti-tumor response in animal models and patients with oral cancer. Nat Commun. 2022;13(1):4829. doi:10.1038/s41467-022-31859-3
16. Babu A, Ramesh R. Multifaceted applications of chitosan in cancer drug delivery and therapy. Mar Drugs. 2017;15(4):96. doi:10.3390/md15040096
17. Elkomy MH, Ali AA, Eid HM. Chitosan on the surface of nanoparticles for enhanced drug delivery: a comprehensive review. J Control Release. 2022;351:923–940. doi:10.1016/j.jconrel.2022.10.005
18. Adepu S, Ramakrishna S. Controlled drug delivery systems: current status and future directions. Molecules. 2021;26(19):5905. doi:10.3390/molecules26195905
19. Lu XY, Wu DC, Li ZJ, et al. Polymer nanoparticles. Prog Mol Biol Transl Sci. 2011;104:299–323.
20. Rao JP, Geckeler KE. Polymer nanoparticles: preparation techniques and size-control parameters. Prog Polym Sci. 2011;36(7):887–913. doi:10.1016/j.progpolymsci.2011.01.001
21. Phatale V, Vaiphei KK, Jha S, et al. Overcoming skin barriers through advanced transdermal drug delivery approaches. J Control Release. 2022;351:361–380. doi:10.1016/j.jconrel.2022.09.025
22. Sangsuriyonk K, Paradee N, Sirivat A. Electrically controlled release of anticancer drug 5-fluorouracil from carboxymethyl cellulose hydrogels. Int J Biol Macromol. 2020;165:865–873. doi:10.1016/j.ijbiomac.2020.09.228
23. Jansod S, Afshar MG, Crespo GA, et al. Phenytoin speciation with potentiometric and chronopotentiometric ion-selective membrane electrodes. Biosens Bioelectron. 2016;79:114–120. doi:10.1016/j.bios.2015.12.011
24. Brezo T, Stojanovič Z, Suturovič Z, et al. Simple, rapid and selective chronopotentiometric method for the determination of riboflavin in pharmaceutical preparations using a glassy carbon electrode. Acta Chim Slov. 2015;62(4):923–931. doi:10.17344/acsi.2015.1745
25. Laborda E, González J, Molina Á. Recent advances on the theory of pulse techniques: a mini review. Electrochem Commun. 2014;43:25–30. doi:10.1016/j.elecom.2014.03.004
26. Bard AJ, Faulkner LR, White HS. Electrochemical Methods: Fundamentals and Applications. John Wiley & Sons; 2022.
27. Lin CH, Lin JH, Chen CF, et al. Conducting polymer-based sensors for food and drug analysis. J Food Drug Anal. 2021;29(4):544–558. doi:10.38212/2224-6614.3374
28. Seda Tığlı Aydın R, Pulat M. 5-Fluorouracil encapsulated chitosan nanoparticles for pH-stimulated drug delivery: evaluation of controlled release kinetics. J Nanomater. 2012;2012:313961. doi:10.1155/2012/313961
29. Basotra M, Singh SK, Gulati M. Development and validation of a simple and sensitive spectrometric method for estimation of cisplatin hydrochloride in tablet dosage forms: application to dissolution studies. ISRN Anal Chem. 2013;2013:936254.
30. Moussaa SH, Tayel AA, Al-Turki AI. Evaluation of fungal chitosan as a biocontrol and antibacterial agent using fluorescence-labeling. Int J Biol Macromol. 2013;54:204–208. doi:10.1016/j.ijbiomac.2012.12.029
31. Anderson K, Ryan N, Alkhimovitch A, et al. Inhibition of PI3K isoform p110γ increases both anti-tumor and immunosuppressive responses to aggressive murine head and neck squamous cell carcinoma with low immunogenicity. Cancers. 2021;13(5):953. doi:10.3390/cancers13050953
32. Kono M, Saito S, Egloff AM, et al. The mouse oral carcinoma (MOC) model: a 10-year retrospective on model development and head and neck cancer investigations. Oral Oncol. 2022;132:106012. doi:10.1016/j.oraloncology.2022.106012
33. Mirniaharikandehei S, VanOsdol J, Heidari M, et al. Developing a quantitative ultrasound image feature analysis scheme to assess tumor treatment efficacy using a mouse model. Sci Rep. 2019;9(1):7293. doi:10.1038/s41598-019-43847-7
34. Tomayko MM, Reynolds CP. Determination of subcutaneous tumor size in athymic (nude) mice. Cancer Chemother Pharmacol. 1989;24(3):148–154. doi:10.1007/BF00300234
35. Kinra P, Malik A. Ki 67: are we counting it right? Indian J Pathol Microbiol. 2020;63(1):98–99. doi:10.4103/IJPM.IJPM_770_19
36. Engelmann L, Thierauf J, Laureano NK, et al. Organotypic co-cultures as a novel 3D model for head and neck squamous cell carcinoma. Cancers. 2020;12(8):2330. doi:10.3390/cancers12082330
37. Ojeda-Hernández DD, Canales-Aguirre AA, Matias-Guiu J, et al. Potential of chitosan and its derivatives for biomedical applications in the central nervous system. Front Bioeng Biotechnol. 2020;8:389. doi:10.3389/fbioe.2020.00389
38. Aibani N, Rai R, Patel P, et al. Chitosan nanoparticles at the biological interface: implications for drug delivery. Pharmaceutics. 2021;13(10):1686. doi:10.3390/pharmaceutics13101686
39. Gan Q, Wang T. Chitosan nanoparticle as protein delivery carrier--systematic examination of fabrication conditions for efficient loading and release. Colloids Surf B. 2007;59(1):24–34. doi:10.1016/j.colsurfb.2007.04.009
40. Bhattacharjee S. Understanding the burst release phenomenon: toward designing effective nanoparticulate drug-delivery systems. Ther Deliv. 2021;12(1):21–36. doi:10.4155/tde-2020-0099
41. Shrestha S, Wang B, Dutta P. Nanoparticle processing: understanding and controlling aggregation. Adv Colloid Interface Sci. 2020;279:102162. doi:10.1016/j.cis.2020.102162
42. Takeuchi I, Suzuki T, Makino K. Iontophoretic transdermal delivery using chitosan-coated PLGA nanoparticles for transcutaneous immunization. Colloids Surf A. 2021;608:125607. doi:10.1016/j.colsurfa.2020.125607
43. Andrade JFM, Cunha-Filho M, Gelfuso GM, et al. Iontophoresis for the cutaneous delivery of nanoentraped drugs. Expert Opin Drug Deliv. 2023;20(6):785–798. doi:10.1080/17425247.2023.2209719
44. Dhote V, Bhatnagar P, Mishra PK, et al. Iontophoresis: a potential emergence of a transdermal drug delivery system. Sci Pharm. 2012;80(1):1–28. doi:10.3797/scipharm.1108-20
45. Paderni C, Campisi G, Schumacher A, et al. Controlled delivery of naltrexone by an intraoral device: in vivo study on human subjects. Int J Pharm. 2013;452(1–2):128–134. doi:10.1016/j.ijpharm.2013.04.070
46. Campisi G, Giannola LI, Florena AM, et al. Bioavailability in vivo of naltrexone following transbuccal administration by an electronically-controlled intraoral device: a trial on pigs. J Control Release. 2010;145(3):214–220. doi:10.1016/j.jconrel.2010.04.027
47. Cadick J, Capelli-Schellpfeffer M, Neitzel D. Electrical Safety Handbook 3E. Mcgraw-Hill; 2005.
48. Zakzewski CA, Amory DW, Jasaitis DK, et al. Iontophoretically enhanced transdermal delivery of an ACE inhibitor in induced hypertensive rabbits: preliminary report. Cardiovasc Drugs Ther. 1992;6(6):589–595. doi:10.1007/BF00052560
49. Raiman J, Koljonen M, Huikko K, et al. Delivery and stability of LHRH and Nafarelin in human skin: the effect of constant/pulsed iontophoresis. Eur J Pharm Sci. 2004;21(2):371–377. doi:10.1016/j.ejps.2003.11.003
50. Zhang JT, Huang SW, Xue YN, et al. Poly(N-isopropylacrylamide) nanoparticle-incorporated PNIPAAm hydrogels with fast shrinking kinetics. Macromol Rapid Commun. 2005;26(16):1346–1350. doi:10.1002/marc.200500298
51. Nair AB, Aldhubiab B, Shah J, et al. Design, development, and evaluation of constant voltage iontophoresis for the transungual delivery of efinaconazole. Pharmaceutics. 2023;15(5):1422. doi:10.3390/pharmaceutics15051422
52. Nair AB, Al-Dhubiab BE, Shah J, et al. Constant voltage iontophoresis technique to deliver terbinafine via transungual delivery system: formulation optimization using box-behnken design and in vitro evaluation. Pharmaceutics. 2021;13(10):1692. doi:10.3390/pharmaceutics13101692
53. Moarefian M, Davalos RV, Tafti DK, et al. Modeling iontophoretic drug delivery in a microfluidic device. Lab on a Chip. 2020;20(18):3310–3321. doi:10.1039/D0LC00602E
54. Ita K. Perspectives on transdermal electroporation. Pharmaceutics. 2016;8(1):9. doi:10.3390/pharmaceutics8010009
55. Haider A, Haider S, Kang IK. A comprehensive review summarizing the effect of electrospinning parameters and potential applications of nanofibers in biomedical and biotechnology. Arab J Chem. 2018;11(8):1165–1188. doi:10.1016/j.arabjc.2015.11.015
56. Neidhart SM, Gezelter JD. Thermal transport is influenced by nanoparticle morphology: a molecular dynamics study. J Phys Chem C. 2018;122(2):1430–1436. doi:10.1021/acs.jpcc.7b12362
57. Richtsmeier JT, Baxter LL, Reeves RH. Parallels of craniofacial maldevelopment in Down syndrome and Ts65Dn mice. Dev Dyn. 2000;217(2):137–145. doi:10.1002/(SICI)1097-0177(200002)217:2<137::AID-DVDY1>3.0.CO;2-N
58. Yamamoto A, Huang Y, Krajina BA, et al. Metastasis from the tumor interior and necrotic core formation are regulated by breast cancer-derived angiopoietin-like 7. Proc Natl Acad Sci USA. 2023;120(10):e2214888120. doi:10.1073/pnas.2214888120
59. Takkem A, Barakat C, Zakaraia S, et al. Ki-67 prognostic value in different histological grades of oral epithelial dysplasia and oral squamous cell carcinoma. Asian Pac J Cancer Prev. 2018;19(11):3279–3286. doi:10.31557/APJCP.2018.19.11.3279
60. Gadbail AR, Sarode SC, Chaudhary MS, et al. Ki67 labelling index predicts clinical outcome and survival in oral squamous cell carcinoma. J Appl Oral Sci. 2021;29:e20200751.
61. Yang Y, Li J, Mao S, et al. Comparison of immunohistology using pan-CK and EMA in the diagnosis of lymph node metastasis of gastric cancer, particularly micrometastasis and isolated tumor cells. Oncol Lett. 2013;5(3):768–772. doi:10.3892/ol.2012.1078
 © 2024 The Author(s). This work is published and licensed by Dove Medical Press Limited. The
full terms of this license are available at https://www.dovepress.com/terms.php
and incorporate the Creative Commons Attribution
- Non Commercial (unported, 3.0) License.
By accessing the work you hereby accept the Terms. Non-commercial uses of the work are permitted
without any further permission from Dove Medical Press Limited, provided the work is properly
attributed. For permission for commercial use of this work, please see paragraphs 4.2 and 5 of our Terms.
© 2024 The Author(s). This work is published and licensed by Dove Medical Press Limited. The
full terms of this license are available at https://www.dovepress.com/terms.php
and incorporate the Creative Commons Attribution
- Non Commercial (unported, 3.0) License.
By accessing the work you hereby accept the Terms. Non-commercial uses of the work are permitted
without any further permission from Dove Medical Press Limited, provided the work is properly
attributed. For permission for commercial use of this work, please see paragraphs 4.2 and 5 of our Terms.