")
Back to Journals » International Journal of Nanomedicine » Volume 19
Iron-Based Nanoplatforms Achieve Hepatocellular Carcinoma Regression Through a Cascade of Effects
Authors Huang K, Yi X, Xie H, Luo J, Zeng Q, He F, Wang L
Received 16 July 2024
Accepted for publication 17 October 2024
Published 1 November 2024 Volume 2024:19 Pages 11105—11128
DOI https://doi.org/10.2147/IJN.S479425
Checked for plagiarism Yes
Review by Single anonymous peer review
Peer reviewer comments 5
Editor who approved publication: Dr Xing Zhang
Kunzhao Huang,* Xiaoyuan Yi,* Huaying Xie, Jianzhang Luo, Qingyu Zeng, Feifei He, Liyan Wang
Digestive Department, The Affiliated Hospital of Guilin Medical College, Guilin, 541001, People’s Republic of China
*These authors contributed equally to this work
Correspondence: Liyan Wang, Digestive Department, The Affiliated Hospital of Guilin Medical College, Guilin, 541001, People’s Republic of China, Tel +86-15295953938, Email [email protected]
Purpose: Ferroptosis is a regulated form of cell death characterized by iron-dependent accumulation of associated lipid peroxides (LPO), which can induce cell death when a certain level is reached. However, the extremely complex tumor microenvironment (TME) has the characteristics of antioxidant, even if it induces ferroptosis of tumor cells, its killing effect on tumor cells is still very limited. To solve this problem, we constructed a novel nanomaterials (GOx/EC@Fe3O4@CCM). We evaluated the anticancer effect of this nanomaterial in inhibiting tumor growth through comprehensive in vitro and in vivo experiments.
Methods: We successfully synthesized GOx/EC@Fe3O4 by one-pan synthesis method, then coated the Hepatocellular carcinoma cell membrane on its surface by co-extrusion technology, and finally synthesized the GOx/EC@Fe3O4@CCM nanoplatforms. We characterized the compounds in terms of morphology, particle size, and Zeta potential. In addition, we also studied the anti-tumor effect of GOx/EC@Fe3O4@CCM nanoplatforms from the following aspects, including the performance test of the nanoplatform, the intracellular effect of the nanoplatform, the anti-tumor effect in vitro, the intracellular ROS analysis, the intracellular effect of EC, and the anti-tumor effect in vivo.
Results: The iron-based carriers in GOx/EC@Fe3O4@CCM nanoplatforms are released and produce ferrous ions (Fe2+) in an acidic environment. Due to the limitation of the endogenous level of hydrogen peroxide (H2O2), we introduced GOx into the TME or tumor cells. Under the catalysis of GOx, glucose reacted rapidly to produce a large amount of H2O2, which then combined with Fe2+ to produce a large number of Hydroxyl radical (·OH). Its toxicity leads to dysfunction of cell membrane and organelles, and then causes cell damage. EC inhibits Nuclear factor erythroid 2-related factor 2 (Nrf2) in cancer cells, which effectively down-regulates downstream gene products, including NAD(P)H quinone oxidoreductase 1 (NQO1) and heme oxygenase 1 (HMOX1). A series of chain reactions reduce the escape effect of oxidative stress (OS) and effectively maintain a high level of intracellular oxidation. Furthermore, it induces sustained and intense ferroptosis in tumor cells. Finally, the use of cancer cell membrane modified nanoplatforms due to the homology of membrane protein components improves the tumor cell targeting of the nanoplatforms, showing significant tumor cell inhibition and killing effect in vivo.
Conclusion: The results showed that the GOx/EC@Fe3O4@CCM nanoplatforms successfully induced significant ferroptosis of Hepatocellular carcinoma cells through a cascade effect, and finally effectively promoted cancer cell regression.
Keywords: ferroptosis, mesoporous Fe3O4, glucose oxidase, ethyl carbamate, Nrf2
Graphical Abstract:

Introduction
Hepatocellular carcinoma (HCC) is a common cancer and a common cause of death caused by cancer in the world. Relevant studies predict that with the growth of the world’s population, the number of cases and deaths will gradually increase in the next 20 years.1 Therefore, there is an urgent need for some new effective treatment options to reduce the pain and prolong the life of patients with HCC. Chemodynamic therapy (CDT) is an important treatment strategy for patients with hepatocellular carcinoma, including ferroptosis, a newly discovered regulatory cell death mode in recent years, which has rapidly attracted wide attention in the field of liver diseases, especially in the field of liver cancer.2 The main feature of ferroptosis is the accumulation of reactive oxygen species (ROS) induced by iron, which leads to the peroxidation of cells, in which Fenton reaction is the key link.3,4 In simple terms, the typical Fenton reaction is: In an acidic environment, H2O2 reacts with Fe2+ to generate ·OH with strong oxidative capacity, and trigger more other ROS. ROS act on cells, easily causing damage to cell membrane, nucleic acid, protein and a variety of metabolic enzymes to achieve the degradation of organic matter, resulting in dysfunction of cancer cells and even ferrodeath of cancer cells.5,6 As an important component of Fenton reaction, increasing the content of H2O2 in the tumor site is conducive to increasing the possibility of ferroptosis of tumor cells and further improving the efficiency of killing tumor cells.7,8 However, tumor cells and their TME have a strong self-regulatory ability to quickly alleviate internal or external damage, including excessive H2O2. Therefore, as the level of H2O2 increases, cancer cells will activate their own antioxidant system and release antioxidants to control them.9,10 We hypothesized that increasing the level of H2O2 and inhibiting the antioxidant mechanism of cancer cells could be a potential solution to this problem.
Generally, Nrf2 is a transcription factor that plays a key role in OS response and plays an important role in inducing the body’s antioxidant response, such as regulating REDOX balance, drug metabolism and excretion, energy metabolism, iron metabolism, amino acid metabolism, survival, proliferation, autophagy, proteasome degradation, DNA repair, and mitochondrial physiology.11 Generally, after OS, Nrf2 activates the expression of protective genes in cells, such as HMOX1 and NQO1.12,13 In summary, Nrf2 signaling pathway can effectively inhibit LPO and free iron accumulation and prevent cell damage, including ferroptosis, by controlling its target genes.14 Relevant studies have shown that EC can inhibit Nrf2, which can effectively reduce the antioxidant capacity of cancer cells and improve the sensitivity of tumor cells to ferroptosis.15,16 In addition, the liver is prone to oxidative damage, and usually excessive iron accumulation is one of the important features of most liver diseases, which provides an important physiological basis for ferroptosis in hepatocellular carcinoma.17 Secondly, the endogenous content of H2O2 in cells is very limited. Although inhibition of Nrf2 can increase the intracellular OS level to a certain extent, it is not enough to cause significant ferroptosis of cancer cells. It is well known that enzymes, as efficient catalysts in chemical reactions, can greatly shorten the time of chemical reactions and significantly improve the efficiency of reactions. In order to further increase the intracellular H2O2 content, some existing studies have shown that the intracellular H2O2 level can be greatly increased by using GOx.18 The brief process of the reaction is as follows: glucose, under the action of GOx, produces H2O2 and gluconic acid. In the process of this reaction, on the one hand, not only a large amount of H2O2 is generated, which promotes the Fenton reaction, but also consumes the glucose required by the cell on the other hand. A large number of studies have shown that rapidly proliferating tumor cells require a large amount of energy, and the consumption of glucose also produces a starvation effect on cancer cells to a certain extent, effectively inhibiting the rapid growth of cancer cells.19–21 Finally, mesoporous Fe3O4 is widely used as a drug carrier to carry various drugs for cancer treatment because of its rich porous characteristics, which endow it with many advantages of sustained drug release and high drug loading rate.22,23 Its rich iron ions are also one of the important components of Fenton reaction, especially in the acidic environment of tumors, Fe2+ dissociated from Fe3O4 is more abundant.24,25 Other studies have shown that it is feasible to use mesoporous Fe3O4 nanoparticles to deliver GOx and other drugs, and this combination is a new direction for the development of nanomedicine.26
In this study, we synthesized the characteristics of HCC and the above characteristics of various drugs and carriers to construct mesoporous Fe3O4 nanoplatforms carrying GOx and EC, and modified the surface of nanoplatforms with cancer cell membrane to enhance their targeting effect on target cancer cells. Previous studies have demonstrated that cancer cell membrane-modified nanoplatforms confer many unique properties to these nanoplatforms, including immune evasion and homologous targeting functions. These nanoplatforms also exhibit many advantages such as prolonged circulation time in vivo, good biocompatibility and minimal cytotoxicity to healthy organs.27 In brief, on the one hand, GOx uses glucose to produce large amounts of H2O2, on the other hand, EC inhibits Nrf2, thereby inhibiting its downstream antioxidant system, furthermore, Fe3O4, as an iron-based carrier, provides abundant Fe2+, which reacts with H2O2 to generate toxic ·OH in an acidic environment. In addition, intracellular Glutathione (GSH) was converted to Glutathione Oxidized (GSSG) under the action of nanoplatforms, and the expression of glutathione peroxidase (GPX4) was down-regulated, further inhibiting the antioxidant system of cancer cells. Taken together, the nanoplatform significantly accelerated the accumulation of LPO by up-regulating the intracellular OS level in tumor cells from the above aspects. This series of cascade effects improves the efficiency of CDT, and finally promotes the strong Fenton reaction of cancer cells to cause ferroptosis of cancer cells, which can effectively inhibit the growth of tumors and even eliminate tumors, providing a new possibility for the treatment of liver cancer.
Materials and Methods
Material
FeCl3·6H2O, sodium citrate, ethylene glycol, glucose oxidase (GOx), ethyl carbamate (EC), PBS, Coomassie Brilliant blue, 3.3′,5,5′-tetramethylbenzidine (TMB), hydrogen peroxide (H2O2), HAc-NaAc buffer, 5.5-dithiyl-(2-nitrobenzoic acid) (DTNB), Glutathione (GSH), rhodamine B (RhB), blocking buffer, PVDF membranes, and Cy5.5 were purchased from Aladdin. Membrane protein extraction kit, trypsin, anhydrous glucose, glucose content detection kit, DAPI, EdU, Calcein-AM/PI, standard 3-(4,5-dimethylthiazol-2-yl)-2,5-diphenyltetrazolium (MTT), Annexin V-FITC/PI, 2′,7′-dichlorodihydrofluorescein diacetate (DCFH-DA), Hoechst33342, ATP detection kit, JC-1 staining working solution, RIPA lysis, MDA detection kit, GSH and GSSG detection kits were purchased from Beyotime. H2O2 content detection kit was purchased from Sangon Biotech. FerroOrange was purchased from Dojindo. The cell ferrous colorimetry test box was purchased from Elabscience. ·OH, C11-BODIPY, and GSH fluorescent probes were purchased from thermofisher.
Synthesis of Mesoporous Fe3O4
1.6 g FeCl3·6H2O, 0.90 g sodium citrate and 4 g sodium acetate were fully dissolved in 80 mL ethylene glycol. After stirring well, the solution was transferred to an autoclave lined with Teflon and heated continuously at 200°C for 10 h. It was then allowed to cool naturally to room temperature, washed repeatedly with distilled water and absolute ethanol, and purified by centrifugation (10000 rpm, 5 min) to obtain mesoporous Fe3O4.
Synthesis of GOx@Fe3O4
After 1 mg of GOx was fully dissolved in 1 mL of PBS, an additional 1 mg of Fe3O4 nanoplatforms were added and stirred overnight in the dark. It was purified by centrifugation (10000 rpm, 10 min) to obtain GOx@Fe3O4.
Synthesis of EC@Fe3O4
After fully dissolving 550 mg EC in 1 mL of PBS, an additional 1 mg Fe3O4 nanoplatforms were added and stirred overnight in the dark. It was purified by centrifugation (10000 rpm, 10 min) to obtain EC@Fe3O4.
Synthesis of GOx/EC@Fe3O4
After fully dissolving 550 mg EC with 1 mg GOx in 1 mL PBS, an additional 1 mg Fe3O4 nanoplatforms were added and stirred overnight in the dark. GOx/EC@Fe3O4 was obtained by purification by centrifugation (10000 rpm, 10 min).
Cell Membrane Isolation
The cell membranes of Huh7 and Hepa1-6 were obtained by membrane protein extraction kit. In brief, Huh7 and Hepa1-6 cells (about 20–50 million) were cultured in large quantities, washed with PBS, digested with trypsin, and centrifuged to obtain the cells. 1 mL of membrane protein extraction reagent A was added to the collected Huh7 and Hepa1-6 cells and resuspended fully, the cells were transferred to a glass homogenizer, and thoroughly ground on ice about 60 times. The resulting mixture was then centrifuged (3000 rpm, 10 min, 4°C) and the supernatant was removed. The collected supernatant was centrifuged again (13000 rpm, 30 min, 4°C), and the resulting precipitate was the cell membrane. The cell membrane was resuspended in PBS and stored at −80 ° C for further use.
Synthesis of GOx/EC@Fe3O4@CCM
The above synthesized GOx/EC@Fe3O4 was stirred thoroughly with Huh7 or Hepa1-6 cell membranes, respectively, and then encapsulated by physical co-extrusion method.
Morphology Observation and Zeta Potential Measurement
The morphology of the nanoplatforms was observed by transmission electron microscopy (TEM Tecnai G2 F30), and the particle size of the nanoplatforms was measured. The Zeta potential of the nanoplatforms was measured using a Zetasizer Nano-zs90 (Malvern, UK) instrument.
Membrane Protein Characterization
In this study, sodium dodecyl sulfate-polyacrylamide gel electrophoresis (SDS−PAGE) was used to investigate the types of membrane proteins in Huh7 cells, the membrane of Huh7 cells, and the GOx/EC@Fe3O4@CCM nanoplatforms coated with the membrane of Huh7 cells, and the membrane of Hepa1-6 cells, Hepa1-6 cells, and the GOx/EC@Fe3O4@CCM nanoplatforms coated with the membrane of Hepa1-6 cells. Total proteins were extracted from Huh7 or Hepa1-6 cells using RIPA lysis buffer, and protein quantification was performed with the cell membrane and membrane-coated GOx/EC@Fe3O4@CCM nanoplatforms, respectively. Proteins were then analyzed by polyacrylamide gel electrophoresis in both cell types separately. At the end of electrophoresis, the gels were removed, stained uniformly with Coomassie Brilliant blue on a shaker, and washed thoroughly with PBS after 30 min. Finally, it was placed in the gel imaging system to scan the protein bands in the gel.
Detection of GOx and EC
GOx has a characteristic absorption peak at 276 nm. The absorption peaks at 276 nm of GOx, EC@Fe3O4 and GOx/EC@Fe3O4 were detected by ultraviolet spectrophotometer (UV-1800). EC was detected by liquid chromatography-mass spectrometer (LCMS Agilent 1290II-6460).
Test of Hemolysis
Blood compatibility or biosafety was determined by assessing the compatibility between red blood cells (RBC) and GOx/EC@Fe3O4@CCM nanoplatforms. 800 μL of normal saline (negative control group), ultrapure water (positive control group) and various concentrations of GOx/EC@Fe3O4@CCM nanoparticle suspension (experimental group) were added to 200 μL of RBC. When all erythrocytes in ultrapure water (positive control group) were hemolytic, they were centrifuged at 2000 rpm for 5 minutes in a centrifuge. Then photos were taken, and 100 μL of each supernatant was placed in the microplate, and the absorbance of the supernatant at 540 nm was measured by ultraviolet spectrophotometer. Finally, the hemolysis rate was calculated according to the following formula:

In this equation, A is the absorbance of the experimental group, B is the absorbance of the negative control group, and C is the absorbance of the positive control group.
POD-Like Activity
This experiment was used to verify whether the GOx/EC@Fe3O4@CCM nanoplatforms have the ability to perform peroxidase like activity. First, 100 μL of GOx/EC@Fe3O4@CCM nanoplatforms (1 mg/mL), 100 μL of TMB (10 mM), and 300 μL of H2O2 (10 mM) were added to 500 μL of HAc-NaAc buffer (pH=4.5, 5.0, 6.5, and 7.4), respectively. After 10 min of reaction, the reaction was detected in a UV spectrophotometer. The POD-like activity of the material at different pH conditions was evaluated by recording the absorbance at 652 nm. Secondly, the POD-like activity of the nanomaterials at different concentrations (0, 20, 40, 60, 80, 100 μg/mL) in HAc-NaAc buffer (pH=5.0) was also tested.
GSH-OXD-Like Activity
The GSH-OXD-like activity of GOx/EC@Fe3O4@CCM nanoplatforms was determined by colorimetry using DTNB as the staining substrate. 100 μL of nanoparticle solution (1 mg/mL) and 100 μL of GSH solution (10 mM) were added to 800 μL of PBS solution (pH=8.0) and mixed thoroughly. The cells were placed at room temperature in the dark and set at different time points (0, 1, 2, 3, and 4 h). Then 100 μL of each of the above solutions were added to 880 μL of PBS followed by 20 μL of DTNB (5 mM). The GSH-OXD-like activity of the GOx/EC@Fe3O4@CCM nanoplatforms was measured for 4 h. In brief, a test solution of GOx/EC@Fe3O4@CCM nanoplatforms was prepared with PBS solution. At the end of each time point, the absorption peak of the solution at 412nm was detected by UV spectrophotometer.
Release Tests of GOx, EC, and Fe2+
Firstly, different concentrations of GOx solution were configured, and the standard curve of GOx solution was made according to the absorbance values of different concentrations of GOx. 1 mL of GOx/EC@Fe3O4@CCM nanoplatforms (1 mg/mL) were placed in a dialysis bag and shaken in PBS solution at pH=5.0. The dialysis device was set at different time points (0, 0.5, 1, 2, 4 h), and 1 mL PBS was collected. The absorbance value of all collected PBS was measured by ultraviolet spectrophotometer, and then the absorbance value was substituted into the concentration standard curve, and the obtained value was the GOx concentration released by GOx/EC@Fe3O4@CCM nanoplatforms at the same time point. EC release was detected as described above by passing 1 mL of collected PBS through LCMS separately. PBS was collected at different time points (0, 10, 20, 40, 80h) and Fe2+ release was measured by ICP-OES (Agilent 730).
The Optimal pH for the Catalytic Reaction
An appropriate amount of anhydrous glucose was weighed and fully dissolved in PBS solution (pH=7.4) and PBS solution (pH=5.0), respectively, and prepared into 1500 mg/dL glucose solution. Take 900 μL from each of the above glucose solutions, add 100 μL of GOx/EC@Fe3O4@CCM nanoplatforms (1 mg/mL) respectively, after standing at room temperature for 2 h, take 5 μL from each tube to detect the glucose concentration in the solution using the glucose content detection kit, and the obtained concentration is the remaining glucose concentration in the solution after the reaction. The glucose consumption ability of GOx/EC@Fe3O4@CCM nanoplatforms under different pH solution conditions was known by the glucose concentration changes in the solution before and after the reaction and compared.
Measurement of the Ability to Consume Glucose
First, an appropriate amount of anhydrous glucose was weighed, and the 1500 mg/dL glucose solution was fully dissolved with PBS before use. 900 μL glucose solution prepared above was added to 100 μL PBS group, EC@Fe3O4, GOx@Fe3O4, GOx/EC@Fe3O4 and GOx/EC@Fe3O4@CCM at a concentration of 1 mg/mL. After standing at room temperature for 2 h, 5 μL of each sample was taken to detect the glucose concentration in the solution after the reaction using the glucose content detection kit, and the concentration obtained was the concentration of glucose in the remaining solution after the reaction. The glucose consumption ability of each group was known through the concentration change and compared.
Detection of the Capacity to Produce H2O2
The reaction of H2O2 and titanium sulfate formed a yellow titanium peroxide complex, which had a characteristic absorption peak at 415 nm detected by ultraviolet spectrophotometer. An appropriate amount of anhydrous glucose was weighed and fully dissolved in PBS, and glucose solutions were set at concentrations of 100, 200, 400, 600, and 800 mg/dL, respectively. 900 uL of each glucose solution with different concentrations was added to 100 μL of GOx/EC@Fe3O4@CCM with a concentration of 1 mg/mL. After standing at room temperature for 2 h, H2O2 in the liquid was detected by the H2O2 content detection kit. In addition, an appropriate amount of anhydrous glucose was weighed, fully dissolved in PBS, and prepared into 1500 mg/dL glucose solution for later use. 100 μL PBS and 1 mg/mL EC@Fe3O4, GOx, GOx@Fe3O4, GOx/EC@Fe3O4, GOx/EC@Fe3O4@CCM nanoplatforms were added to 900 μL of the above prepared glucose solution and left for 2 h at room temperature. H2O2 in the liquid was detected by H2O2 content detection kit. The concentration of H2O2 in each sample solution was calculated and compared to know the ability of each group to consume glucose to produce H2O2.
Cell Culture
Huh7 (human hepatoma cells) and Hepa1-6 (mouse hepatoma cells) were from MeisenCTCC (China). Cells were cultured in plain DMEM supplemented with 10% FBS and 1% streptomycin − penicillin, and the conditions of the incubator were 37°C and 5% carbon dioxide.
Analysis of Drug Uptake Behavior
1 mg rhodamine B (RhB) was fully dissolved in 1 mL PBS, and 1 mg GOx/EC@Fe3O4@CCM nanoplatforms were added and stirred overnight in the dark. RhB-labeled GOx/EC@Fe3O4@CCM was purified by centrifugation (10000 rpm, 10 min). Huh7 and Hepa1-6 cells were seeded in climbing sections of 24-well plates at a density of 1×10⁵ cells /mL and incubated for 24 h. Cells were then incubated with RhB-labeled GOx/EC@Fe3O4@CCM nanoplatforms at intervals of (0, 15, 30, 60, 120, 240 min). Cells were washed three times with PBS and then fixed in 4% formaldehyde for 30 min before staining the nuclei with DAPI. Finally, the images were imaged under a fluorescence microscope with the red channel excited at 561 nm and collected between 590 and 640 nm, and the purple channel was excited at 350 nm and collected at 461 nm. Alternatively, cells were seeded at a density of 1×10⁵ cells /mL in 12-well plates and incubated with the same RhB-labeled GOx/EC@Fe3O4@CCM nanoplatforms. Subsequently, the cells in each group were digested with trypsin, centrifuged (1000 rpm, 5 min), and resuspended in PBS for further use. Finally, cells treated with drugs at different time points were analyzed by means of flow cytometer (Beckman Coulter, USA).
Determination of Intracellular Fe2+ Content
FerroOrange was used as a probe to measure the amount of Fe2+ in the cells. Huh7 and Hepa1-6 cells were seeded in 2.0 cm confocal dishes (2.0×10⁵ cells per dish) and incubated for 24 h. Five groups (Control, GOx@Fe3O4, EC@Fe3O4, GOx/EC@Fe3O4, GOx/EC@Fe3O4@CCM) were set and treated with drugs for 24 h. Nuclei were first stained with DAPI and intracellular Fe2+ was stained 15 min later with a FerroOrange fluorescent probe. Finally, cells were photographed by a fluorescence microscope with the red channel excited at 561 nm and collected between 590 and 640 nm, and the purple channel was excited at 350 nm and collected at 461 nm. Fe2+ was combined with the probe in cell ferrous colorimetry kit. The resulting substance had a strong absorption peak at 593 nm wavelength, and its optical density was linearly related to Fe2+ concentration within a certain range. Huh7 and Hepa1-6 cells were seeded in 6-well plates at a density of 1×10⁵ cells /mL and incubated for 24 h. Then, after the same drug treatment for 24 h, the collected cells were collected and the Fe2+ content in the cells was detected by the cell ferrous colorimetry test box. Finally, the absorbance of each sample was measured at 593 nm in the microplate reader, and the standard fitting curve of Fe2+ was made. Finally, the optical density (OD) value of each sample was substituted into the standard curve, which was the detection result.
EdU Incorporation and Staining
Huh7 and Hepa1-6 cells were seeded in 48-well plates at a density of 2×10⁴ cells /mL, respectively. After the cells were cultured overnight to adhere to the wall and return to the normal state, five groups were set (Control, GOx@Fe3O4, EC@Fe3O4, GOx/EC@Fe3O4, GOx/EC@Fe3O4@CCM), and the drug was incubated for 12 h. Then the cells in each group were stained according to the method of EdU cell proliferation assay kit, and finally, the proliferation of cells was observed under a fluorescence microscope. The red channel was excited at 561 nm and collected between 590 and 640 nm. The excitation wavelength of the purple channel was 350 nm and the acquisition wavelength was 461 nm.
Calcein-AM/PI Staining Analysis
Huh7 and Hepa1-6 cells were seeded in 12-well plates at a density of 1×10⁵ cells /mL, respectively. Five groups were set up (Control, GOx@Fe3O4, EC@Fe3O4, GOx/EC@Fe3O4, GOx/EC@Fe3O4@CCM) and treated with corresponding drugs for 24 h. Then 1 μL of Calcein-AM and 1 μL of propidium iodide (PI) were added directly into the culture medium. After incubation at 37°C for 30 min, cells were imaged under a fluorescence microscope. The green channel was excited at 488 nm and collected between 500 and 550 nm. The red channel was excited at 561 nm and collected between 590 and 640 nm.
MTT Cytotoxicity Assay
The cytotoxicity of Huh7 and Hepa1-6 cells in vitro was detected by MTT assay. Huh7, Hepa1-6 and THLE-2 cells were seeded uniformly in 96-well plates at a density of 5×10³ cells/well, respectively. The Control group and different concentrations of GOx@Fe3O4, EC@Fe3O4, GOx/EC@Fe3O4, GOx/EC@Fe3O4@CCM nanoplatforms (20, 40, 60, 80, 100, 120 μg/mL) were set up in DMEM medium and deposited in an incubator. After 24 h, the original medium was all removed, and 100 μL MTT assay solution (980 μL complete medium: 20 μL MTT) was added to each well to set up the blank group, which was then cultured in the incubator for 2 h. Finally, the absorbance at 490 nm was measured in a UV spectrophotometer. Relative cell viability was calculated as follows:

Where A is the absorbance of the experimental group, B is the absorbance of the Control group, and C is the absorbance of the blank group.
Annexin V-FITC/PI Apoptosis Assay
Huh7 and Hepa1-6 cells were seeded in 6-well plates at a density of 1×10⁵ cells /mL and cultured for 24 h. Five groups (Control, GOx@Fe3O4, EC@FFe3O4, GOx/EC@Fe3O4, GOx/EC@Fe3O4@CCM) were set and cultured for another 24 h. The culture medium of each group was collected, the washing solution was collected after washing with PBS, trypsinized, centrifuged, stained with Annexin V-FITC/PI double staining apoptosis detection kit in 1× binding buffer, and detected by flow cytometer.
Measurement of Intracellular Glucose Content
Huh7 and Hepa1-6 cells were seeded in 6-well plates at a density of 2×10⁵ cells /mL, respectively. Five groups were set up (Control, GOx@Fe3O4, EC@Fe3O4, GOx/EC@Fe3O4, GOx/EC@Fe3O4@CCM) and incubated for 24 h. The culture was continued for 24 h after drug treatment. The culture medium was removed and washed three times with an appropriate amount of PBS. 200 μL of lysate was added to each well, and after full lysis, the mixture was centrifuged at 12,000×g for 5 min in a centrifuge, and the supernatant was used as the sample to be tested. The concentration of protein in each sample was detected, and 120 μL of each sample was used to detect the concentration of glucose in cells using the glucose content detection kit. Finally, the content of glucose per mg protein was calculated.
Intracellular ROS Determination
The Fenton reaction produces a large amount of ROS. Huh7 and Hepa1-6 cells were seeded in 12-well plates at a density of 1×10⁵ cells /mL, and five groups were set up (Control, GOx@Fe3O4, EC@Fe3O4, GOx/EC@Fe3O4, GOx/EC@Fe3O4@CCM) and incubated for 24 h. Then, the cells were treated with the drugs of each group for 24 h, washed 3 times with PBS, added serum-free medium and stained with DCFH-DA for 30 min. Next, cells were washed three times with PBS to remove excess dye, nuclei were stained with 500 uL of 1×Hoechst33342 configured in PBS, and excess dye was removed with PBS after 15 min. Finally, cells were imaged under a fluorescence microscope with an excitation wavelength of 488 nm and an acquisition wave of 500 to 550 nm for the green channel and an excitation wavelength of 350 nm and an acquisition wave of 461 nm for the purple channel. Flow cytometric analysis of ROS levels was performed using flow cytometer.
Intracellular ·OH Determination
·OH is one of the important components of ROS. Huh7 and Hepa1-6 cells were seeded in 12-well plates at a density of 1×10⁵ cells /mL, and five groups (Control, GOx@Fe3O4, EC@Fe3O4, GOx/EC@Fe3O4, GOx/EC@Fe3O4@CCM) were set up and treated with different treatments. After 24 h, the medium was replaced with serum-free medium and stained with ·OH fluorescent probe for 30 min. Then, the cells were washed three times with PBS, 500 uL of 1×Hoechst33342 was added to stain the nuclei, and 15 min later, the cells were washed with PBS. Cells were imaged under a fluorescence microscope with the red channel excited at 561 nm and collected between 590 and 640 nm and the purple channel excited at 350 nm and collected at 461 nm.
Intracellular ATP Content Was Measured
Changes in ATP levels can affect the function of cells and indirectly reflect the state of cells. Huh7 and Hepa1-6 cells were seeded in 6-well plates at a density of 1×10⁵ cells /mL, respectively. After the cells were cultured overnight to adhere to the wall and return to the normal state, five groups (Control, GOx@Fe3O4, EC@Fe3O4, GOx/EC@Fe3O4, GOx/EC@Fe3O4@CCM) were set and treated with drugs for 24 h. Then, the cells were washed three times with PBS and lysed by adding 200 μL of lysate to each well. After complete lysis, the cells were centrifuged at 12000 g for 5 min at 4°C in a centrifuge, and the supernatant was removed and used for subsequent determinations. The ATP standard and samples were prepared by ATP detection kit, and the RLU values of the standard and samples were measured by chemiluminescence instrument, and the concentration standard curve of ATP standard was made. At the same time, the protein concentration of each sample was detected, and the amount of ATP per mg protein in the sample was calculated.
Assessment of Mitochondrial Damage
Huh7 and Hepa1-6 cells were seeded in 6-well plates at a density of 1×10⁵ cells /mL, respectively, and incubated for 24 h to make the cells adhere to the wall. Five groups (Control, GOx@Fe3O4, EC@Fe3O4, GOx/EC@Fe3O4, GOx/EC@Fe3O4@CCM) were set up. After 24 h of drug incubation, the cells were washed once with PBS, and 1 mL JC-1 staining working solution was added to each well and mixed thoroughly. The cells were incubated for 20 min at 37°C in a cell incubator. At the end of the incubation period, the cells were washed twice with JC-1 staining buffer (1×), and 2 mL of serum-free medium was added. The excitation wavelength of the green channel was 488 nm, the acquisition wave was 500–550 nm, and the red channel was excited at 561 nm and collected at 590–640 nm.
Western Blot
Huh7 and Hepa1-6 cells were seeded in 6-well plates (2×10⁵ per well) and incubated for 24 h. Five groups (Control, GOx@Fe3O4, EC@Fe3O4, GOx/EC@Fe3O4, GOx/EC@Fe3O4@CCM) were set and incubated for 24 h with drugs. The cells were then washed three times with PBS and lysed using RIPA lysis buffer on ice. Protein concentration after cleavage was measured. Proteins were separated by 10% SDS-PAGE and transferred to PVDF membranes. PVDF membranes were treated with blocking buffer for 1h on a shaker, followed by three washes with washing buffer. They were then incubated with anti-Nrf2, HMOX1, NQO1, GPX4 and β-actin antibodies overnight at 4°C on a shaker. After that, PVDF membranes were washed three times and incubated for 1 h with fluorescent secondary antibodies. Finally, it was placed in a gel imaging system for detection.
Lipid Oxidation Determination
C11-BODIPY was used as a probe to measure the accumulation of LPO in the cells. Huh7 and Hepa1-6 cells were seeded in 12-well plates at a density of 1×10⁵ cells /mL, respectively, and incubated for 24 h to make the cells adhere to the wall. Five groups (Control, GOx@Fe3O4, EC@Fe3O4, GOx/EC@Fe3O4, GOx/EC@Fe3O4@CCM) were set up, and after 24 h of drug incubation, the cells were washed three times with PBS. 1 mL of serum-free medium was added, stained with C11-BODIPY for 30 min in the dark, and again washed three times with PBS. Finally, cells were imaged under a fluorescence microscope with excitation wavelength of 488 nm and acquisition wave between 500 and 550 nm for the green channel and excitation at 561 nm and acquisition between 590 and 640 nm for the red channel.
Determination of MDA Content
In the experiment, Huh7 and Hepa1-6 cells were seeded in 6-well plates at a density of 1×10⁵ cells /mL, respectively, and incubated for 24 h to make the cells adhere to the wall. Five groups (Control, GOx@Fe3O4, EC@Fe3O4, GOx/EC@Fe3O4, GOx/EC@Fe3O4@CCM) were set up, and after 24 h of drug incubation, the cells were washed three times with PBS. The cells of each group were collected, and the content of lipid oxidation (MDA) in each group was detected by MDA detection kit. Protein concentrations were measured for each sample, and MDA per mg of protein was calculated separately.
Intracellular GSH and GSSG Content
Huh7 and Hepa1-6 cells were seeded in 24-well plates at a density of 1×10⁵ cells /mL, respectively. After the cells were cultured overnight to return to the normal state, five groups (Control, GOx@Fe3O4, EC@Fe3O4, GOx/EC@Fe3O4, GOx/EC@Fe3O4@CCM) were set and incubated for 24 h with drugs. Next, the cells were washed three times with PBS and serum-free medium was added. Then, GSH fluorescent detection probe was added and incubated in the dark for 20 min. Cells were again washed 3 times with PBS and serum-free medium was added to maintain viability. The consumption of GSH in each group was observed under a fluorescence microscope. The excitation wavelength of the purple channel was 350 nm, and the acquisition wavelength was 461 nm. Similarly, Huh7 and Hepa1-6 cells were seeded in 6-well plates at a density of 1×10⁵ cells /mL, respectively, and incubated for 24 h, and then treated with the same drugs for 24 h. The cells were washed three times with PBS, and the intracellular GSH content was measured by GSH and GSSG detection kits.
In vivo Fluorescence Imaging
1 mg Cy5.5 was fully dissolved in 1 mL PBS, and 1 mg GOx/EC@Fe3O4@CCM or GOx/EC@Fe3O4 nanoplatforms were added and stirred overnight in the dark. Cy5.5-labeled GOx/EC@Fe3O4@CCM or GOx/EC@Fe3O4 was purified by centrifugation (10000 rpm, 10 min). All animal experiments were approved by the Ethics Committee of the Animal Laboratory of Guilin Medical College under the approval number GLMC201903208. The ethical review of laboratory animals was in accordance with the Guiding Opinions on the Good Treatment of Laboratory Animals issued by the Ministry of Science and Technology of the People’s Republic of China and the national standard GB/T35892-2018 Laboratory animal - Guideline for ethical review of animal welfare. Firstly, a large number of cells were cultured for subcutaneous tumor formation to establish Hepa1-6 hepatocellular carcinoma model in BALB/c nude mice. The age was 4 weeks. After the subcutaneous tumor model was successfully established, 100 μL Cy5.5-labeled GOx/EC@Fe3O4@CCM nanoplatforms (1 mg/mL) were injected into the tail vein. After various time points (0, 0.5, 1, 2, 4, 8, 16, and 24 h), mice were anesthetized and imaged by a small animal in vivo imaging system (PerkinElmerIVIS instrument Waltham, MA, USA). After 24 h, mice were euthanized, and tumors and major organs (including: heart, liver, spleen, lung, kidney) were dissected and removed, washed with PBS, and then fluorescent images were acquired by an in vivo imaging system.
Bioluminescence Imaging
Firstly, Luciferase labeled Hepa1-6 cells were cultured and a subcutaneous tumor model was constructed to investigate the anti-tumor ability of GOx/EC@Fe3O4@CCM nanoplatforms in vivo. In this part, 1×10⁶ Hepa1-6 cells were injected into the right buttock of each male BALB/c nude mouse, and the age was 4 weeks. After 7 days, uniform tumors were formed under the skin of the mice, and 25 nude mice were randomly divided into 5 groups (5 mice in each group): Control, GOx@Fe3O4, EC@Fe3O4, GOx/EC@Fe3O4, GOx/EC@Fe3O4@CCM group. The mice in each experimental group were treated with 100 uL (1 mg/mL) of the corresponding drug each time, and the mice were anesthetized the next day for imaging in the bioluminescence imaging system.
In vivo Tumor Treatment Evaluation
During the treatment of the mice, the tumor volume and the body weight of the mice were promptly recorded. After 14 days of treatment, all mice were euthanized and tumors and major organs (including heart, liver, spleen, lung, and kidney) were collected. Tumors were weighed and photographed for H&E staining, Nrf2 immunohistochemistry, and Ki67 and GPX4 fluorescence analysis. At the same time, the venous blood of mice was collected, and the blood cells and serum were separated timely after centrifugation. The serum was collected for liver and kidney function analysis.
Statistical Analysis
Statistical analysis was performed using a Student’s t- test, and differences between test and control groups were judged to be significant at 0.01 < *P < 0.05 and extremely significant at **P < 0.01, ***P < 0.001 and ****P < 0.0001. There was no difference between two groups if P > 0.05.
Results and Discussion
Preparation and Characterization of GOx/EC@Fe3O4@CCM Nanoplatforms
Firstly, mesoporous Fe3O4 was synthesized by hydrothermal method and used as the carrier of nanoplatforms (Figure 1A). Secondly, Fe3O4-loaded GOx and EC nanoplatforms were prepared. Mesoporous Fe3O4 has a unique and abundant mesoporous structure, which makes it have very superior adsorption and drug release ability. The method used here is a one-pot synthesis method, in simple terms, appropriate amount of GOx and EC is taken, fully dissolved with PBS, and fully stirred with Fe3O4, so that GOx and EC can enter the Fe3O4-rich mesopores as much as possible to realize the combination of carrier and drug.
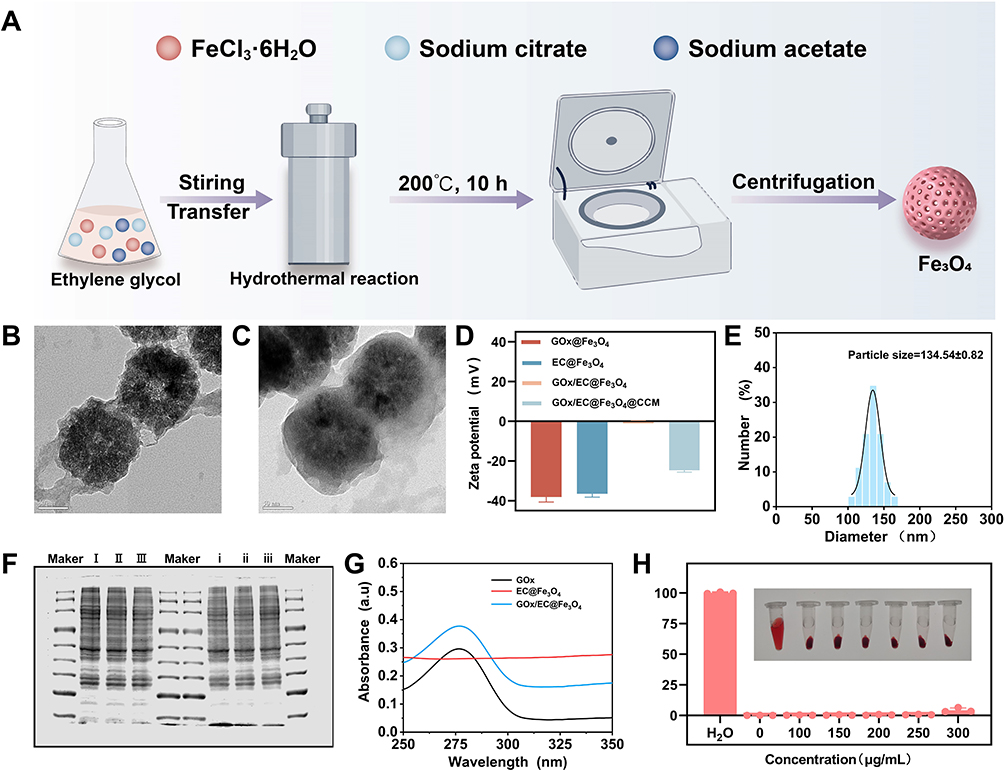 |
Figure 1 Characterization of GOx/EC@Fe3O4 nanoplatforms. Schematic representation of mesoporous Fe3O4 synthesis (A). TEM image of GOx/EC@Fe3O4 nanoplatforms (B). TEM image of GOx/EC@Fe3O4@CCM nanoplatforms (C). Zeta potential of GOx/EC@Fe3O4@CCM nanoplatforms (D). Size distribution of GOx/EC@Fe3O4@CCM nanoplatforms (E). SDS-PAGE analysis of GOx/EC@Fe3O4@CCM nanoplatforms modified with Heap1-6 as well as Huh7 cell membranes (F). UV-vis absorption spectrum of GOx/EC@Fe3O4@CCM nanoplatforms (G). Hemolysis assay analysis of GOx/EC@Fe3O4@CCM nanoplatforms (H). Scale bar: 50 nm. I: Hepa1-6, II: Hepa1-6 cell membrane, III: GOx/EC@Fe3O4@CCM (Hepa1-6), i: Huh7, ii: Huh7 cell membrane, iii: GOx/EC@Fe3O4@CCM (Huh7). |
To coat the GOx/EC@Fe3O4 surface with cancer cell membranes, we extracted membranes from Hepa1-6 and Huh7 cells, respectively, and coated GOx/EC@Fe3O4 nanoplatforms with these membranes. In the method of cell membrane modification on the surface of nanoplatforms, the use of co-extrusion technology can well wrap the cell membrane on the surface of nanoplatforms.27 Cell membrane-derived vesicles were mechanically extruded to fuse with nanoplatforms several times through pores with a diameter of 200 nm. The mechanical force applied during extrusion promotes the fusion of cell membrane vesicles on the nanoplatforms to achieve the encapsulation and modification of the nanoplatforms. Using TEM, we compared the TEM images of GOx/EC@Fe3O4 and GOx/EC@Fe3O4@CCM nanoplatforms and found that GOx/EC@Fe3O4 successfully fused with the cancer cell membrane, showing a clear core-shell structure, indicating the existence of a monolayer of cancer cell membrane on the GOx/EC@Fe3O4 nanoplatforms. This proved the successful synthesis of GOx/EC@Fe3O4@CCM nanoplatforms (Figure 1B and C). After coating the cell membrane, the Zeta potential of the GOx/EC@Fe3O4@CCM nanoplatforms was altered, reaching −24.67 mV, which may be related to the surface charge of the cell membrane, indicating that the nanoplatforms successfully coated the cell membrane (Figure 1D). The particle size of the nanoplatforms was measured to be 134.54±0.82nm (Figure 1E). SDS-PAGE was used to verify whether the protein on the membrane of tumor cells remained intact after coating GOx/EC@Fe3O4@CCM nanoplatforms. The results showed that the protein bands of Hepa1-6 and Huh7 membrane-coated GOx/EC@Fe3O4@CCM nanoplatforms were consistent with those of Hepa1-6 and Huh7 cell membranes, respectively, indicating that the nanoplatforms did not destroy membrane proteins during the preparation process (Figure 1F). The composition of the original membrane protein of Hepa1-6 and Huh7 cell membrane was retained. Because of the homology of the components between the cell membrane and the cell membrane, the cancer cell membrane provided the potential homologous targeting effect for the prepared nanoplatforms, and the nanoplatforms were well fused and engulfed when they contacted with the corresponding cancer cell membrane.28 This potential advantage may lead to new directions for clinical research in the future. GOx has strong light absorption characteristics in the UV region, and its absorption peak is located at 276 nm. A characteristic absorption peak at 276 nm was detected by the UV spectrophotometer, so it can be inferred that the Fe3O4 carrier successfully carried GOx (Figure 1G). In addition, the supernatant obtained by centrifugation during nanoparticle preparation was collected and the EC content was determined by LCMS. From the test results (Figure S1), we found that the content of free EC in the solution of preparing nanoplatforms was less than before, and we knew that a part of EC was carried in the mesopores of Fe3O4.
Blood compatibility is one of the important indicators to evaluate whether nanoplatforms have biological safety, which provides a reference for in vivo drug experiments.29 To test the blood compatibility of GOx/EC@Fe3O4@CCM nanoplatforms, we extracted venous blood from mice with different concentrations of GOx/EC@Fe3O4@CCM nanoplatforms from low to high. After treatment, no obvious hemolysis occurred in the blood of each group (Figure 1H). These results indicate that even high concentration of nanoplatforms does not cause obvious hemolysis of red blood cells, which indicates that the nanoplatforms have good biological safety and can be safely used for intravenous injection in mice.
Performance Testing of Nanoplatforms
In the presence of H2O2 as well as Fe2+, a large amount of ·OH was produced. In short, it is caused by Fenton reaction. Iron ions released by GOx/EC@Fe3O4@CCM nanoplatforms react with H2O2 under acidic conditions, resulting in a large amount of ·OH, which further combines with TMB substrate to form blue dimer. A UV spectrophotometer was used to observe the characteristic absorption peak of the dimer at 652 nm (Figure 2A).30 In essence, the peroxidase-like activity of nanoplatforms can consume H2O2 to produce ·OH. Through this experiment, the GOx/EC@Fe3O4@CCM nanoplatforms were verified to have peroxidase-like activity in acidic environment. Moreover, with the continuous decrease of pH in the reaction environment, the production of ·OH also increases, which simulates that more ·OH can be produced under acidic TME. In addition, we also examined ·OH production in the environment of different concentrations of GOx/EC@Fe3O4@CCM nanoplatforms. According to the detection and analysis, with the increase of the concentration of GOx/EC@Fe3O4@CCM nanoplatforms in the reaction environment, the characteristic absorption peak of the solution is constantly rising under the detection of the UV spectrophotometer, and the content of ·OH is constantly increasing (Figure 2B). ·OH is one of the important components of ROS, which has a strong ability to remove organic matter, affect the metabolism and genetics of cells, and then kill cells, providing the basis for tumor therapy.
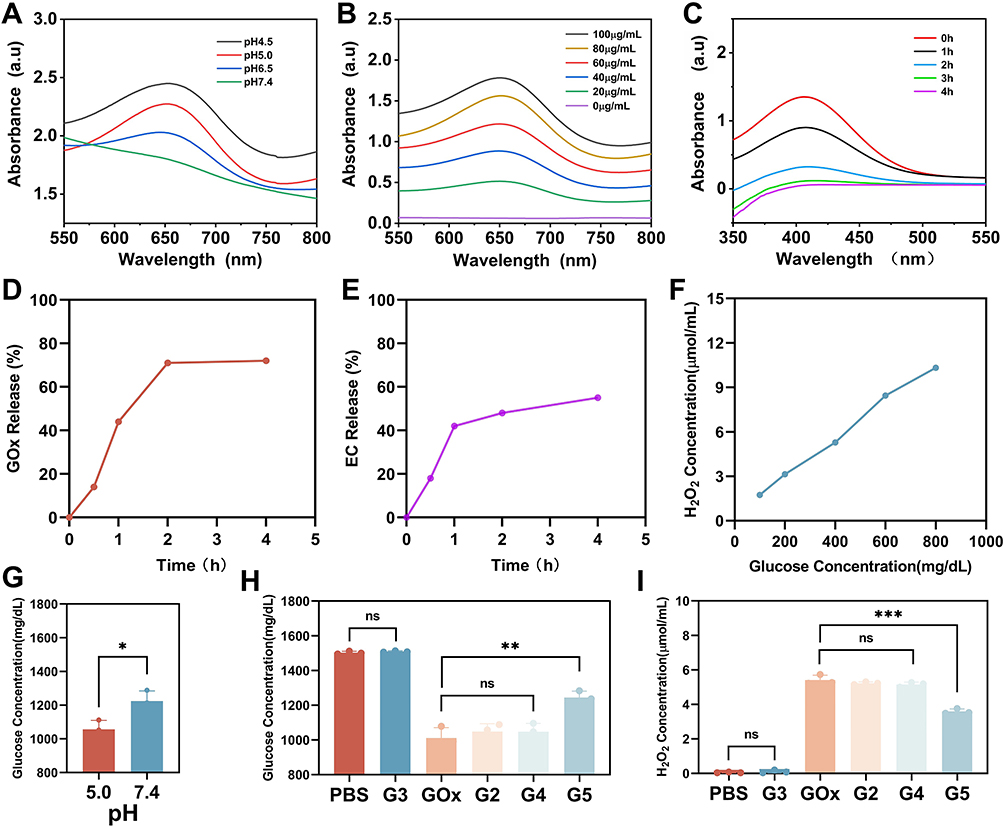 |
Figure 2 Performance testing of nanoplatforms. POD-like activity of GOx/EC@Fe3O4@CCM nanoplatforms in different pH solutions (A). POD-like activity test of GOx/EC@Fe3O4@CCM nanoplatforms at different concentrations (B). GSH-OXD-like activity test of GOx/EC@Fe3O4@CCM nanoplatforms at different time points (C). Release test of GOx from GOx/EC@Fe3O4@CCM nanoplatforms (D). Release test of EC from GOx/EC@Fe3O4@CCM nanoplatforms (E). H2O2 production by GOx/EC@Fe3O4@CCM nanoplatforms in different concentrations of glucose solution (F). Test of glucose consumption by GOx/EC@Fe3O4@CCM nanoplatforms in glucose solutions of different pH (G). Glucose consumption by different particles was tested (H). Testing of H2O2 production from glucose catalyzed by different particles (I). n=3, ***p < 0.001, **p < 0.01, *p < 0.05. G2: GOx@Fe3O4, G3: EC@Fe3O4, G4: GOx/EC@Fe3O4, G5: GOx/EC@Fe3O4@CCM. |
GSH is a very important link in the cellular antioxidant system. We also tested whether GOx/EC@Fe3O4@CCM nanoplatforms have GSH-like oxidase activity. GSH reacts with DTNB to produce yellow 2-nitro-5-mercolobinic acid and glutathione disulfide (GSSG). 2-nitro-5-mercolobinic acid has a characteristic absorption peak at 412 nm, and the content of reduced GSH can be detected by detecting the change of its absorbance value by ultraviolet spectrophotometer.31 We found that the characteristic absorption peak in the system decreased with the increase of reaction time, indicating that GSH can be consumed by GOx/EC@Fe3O4@CCM nanoplatforms (Figure 2C). In summary, GOx/EC@Fe3O4@CCM nanoplatforms have GSH oxidase-like activity and GSH consumption is time-dependent.
The GOx/EC@Fe3O4@CCM nanoplatforms were placed in a dialysis bag to mimic the release of GOx and EC from the carrier in tumor cells. The release of GOx is shown in Figure 2D. Before 2 h, GOx is rapidly released from the carrier, while after 2 h, the concentration of released GOx has tended to the horizontal state, reaching 71%. At the subsequent time point of 4 h, the concentration of GOx released was almost identical to that of 2 h, reaching 72%. Thus, we learned that most of the GOx could be released from the carrier. As shown in Figure 2E, EC was rapidly released from the carrier before 1 h, while after 1 h, the rate of EC release was significantly slowed down, and the release rate of 2 h and 4 h was about 50%, and about half of EC was released from the carrier. The release of GOx and EC reflected that mesoporous Fe3O4 had a rich mesoporous structure to carry drugs, and it could also release drugs from the mesoporous, which verified the drug loading ability of mesoporous Fe3O4. In addition, we extended the release time and found that Fe2+ was slowly released from Fe3O4 (Figure S2), which provides an important condition for promoting the Fenton reaction.
According to the reaction equation of GOx, we learned that H2O2 was produced in the process of glucose catalyzed by GOx, which is an important substance required for this study.32 Therefore, we studied the generation of H2O2 by GOx/EC@Fe3O4@CCM and other nanoplatforms. As the amount of glucose in the reaction solution increased, the generation of H2O2 by GOx/EC@Fe3O4@CCM nanoplatforms also increased continuously (Figure 2F), which is a typical dose dependence in chemical reactions, that is, the first-order reaction in enzymatic reactions. Under constant other conditions, the pH of the environment in which the enzyme reacts can affect the degree of dissociation of the enzyme molecules, especially the essential groups of the active center, the degree of dissociation of the substrate and the coenzyme, and the combination of the enzyme and the substrate, so as to affect the reaction rate of the enzyme. Therefore, we know that each enzyme has its own unique optimal reaction pH, which is one of the important conditions to give full play to the catalytic effect of the enzyme. Relevant studies have shown that GOx can play a better catalytic performance in an appropriate acidic environment.33 We configured glucose solution with pH 5.0 and 7.4 respectively to simulate the glucose catalysis of GOx carried by GOx/EC@Fe3O4@CCM nanoplatforms in acidic TME and normal environment, and further studied the optimal pH required for its reaction environment. By comparing the amount of glucose left in the solution of GOx/EC@Fe3O4@CCM nanoplatforms after reaction at different pH, we found that GOx/EC@Fe3O4@CCM nanoplatforms consumed more glucose in acidic solution than in neutral solution. This indicates that acidic conditions are more favorable for GOx in GOx/EC@Fe3O4@CCM nanoplatforms to play the role of glucose consumption (Figure 2G). In addition, when GOx uses glucose to produce H2O2, gluconic acid will also be produced. On the one hand, this will further reduce the pH value of the reaction environment, thus promoting the continuous and effective progress of the catalytic reaction. On the other hand, Fenton reaction is usually carried out in an acidic environment, which provides a favorable basis for Fenton reaction.
GOx was successfully carried by GOx@Fe3O4, GOx/EC@Fe3O4, and GOx/EC@Fe3O4@CCM nanoplatforms. Therefore, we investigated whether the catalytic properties of GOx were changed after being carried in each group of nanoplatforms. Under the same experimental conditions, the GOx@Fe3O4 and GOx/EC@Fe3O4 nanoplatforms showed the same glucose catalysis and consumption as pure GOx, so the catalytic performance of GOx was not changed even when loaded in nanoplatforms, and its performance was reliable. However, the GOx/EC@Fe3O4@CCM nanoparticle group did not catalyze and consume glucose as much as the GOx group, possibly because the outer covering cell membrane prevented the release of GOx from the carrier (Figure 2H). In addition to this, we also investigated the catalytic effect of EC@Fe3O4 nanoplatforms on glucose to exclude the catalytic effect of EC on glucose. It was found that EC@Fe3O4 nanoplatforms did not catalyze glucose, which was similar to PBS in this respect. Based on the above results, we know that among all the nanoplatforms, only the GOX-loaded nanoplatforms have the catalytic and consumption effects on glucose.
In the above experiments, we investigated the catalytic activity of each group of nanoplatforms on glucose. Next, we tested the ability of each group of nanoplatforms to generate H2O2 in the catalytic reaction. Under the same conditions, the pure GOx group, GOx@Fe3O4 and GOx/EC@Fe3O4 nanoplatforms produced the same amount of H2O2 after reacting with glucose (Figure 2I), which further verified that the catalytic performance of GOx could still be guaranteed even when loaded in nanoplatforms. The same GOx/EC@Fe3O4@CCM group produced a lower level of H2O2 than the GOx group, a result similar to the glucose-consuming capacity test described above, mainly due to the effect of the outer layer of the nanoparticle coating on the cell membrane. Moreover, EC@Fe3O4 nanoplatforms cannot generate H2O2 in glucose solution because they do not catalyze glucose.
Role of Nanoplatforms in Cells
The homology between cell membranes of the same cells has unique advantages in targeting. Inspired by this, firstly, we will label the GOx/EC@Fe3O4@CCM nanoplatforms encapsulated in Huh7 and Hepa1-6 cell membranes with red RhB, respectively. Next, we incubated Huh7 and Hepa1-6 cells with these fluorescently labeled nanoplatforms and observed them using fluorescence microscopy. The results showed that around the blue DAPI-stained nuclei, there were red fluorescence signals from RhB, and these signals were time-dependent. At 2 h, the endocytosis of GOx/EC@Fe3O4@CCM nanoplatforms was saturated, and at 4h, the red fluorescence signal in the cells almost did not increase, indicating that the cells had a good endocytosis of the nanoplatforms wrapped in the cell membrane (Figures 3A and S3A). The cellular targeting and uptake of the GOx/EC@Fe3O4@CCM nanoplatforms were further assessed by means of flow cytometry, and the results were consistent with those of the fluorescence experiments described above (Figures 3B and S3B).
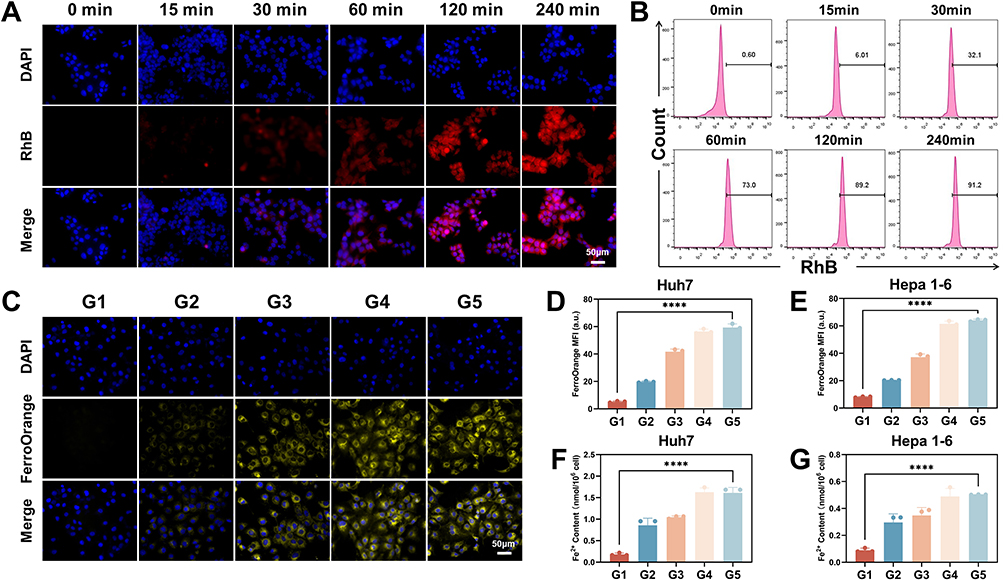 |
Figure 3 Role of nanoplatforms in cells. Fluorescence images of the uptake of RhB-labeled GOx/EC@Fe3O4@CCM nanoplatforms by Huh7 cells at different time points (A), as well as flow cytometry (B). Intracellular FerroOrange fluorescence staining images of Huh7 cells after different treatments (C). Quantitative analysis of the corresponding FerroOrange fluorescence intensity of Huh7 and Hepa1-6 cells after different treatments (D and E). Intracellular ferrous ion content of Huh7 and Hepa1-6 cells after different treatments (F and G). Scale bar: 50 μm. n=3, ****p < 0.0001. G1: Control, G2: GOx@Fe3O4, G3: EC@Fe3O4, G4: GOx/EC@Fe3O4, G5: GOx/EC@Fe3O4@CCM. |
Fe2+ is one of the important indicators of ferroptosis, and overloading Fe2+ can cause cell function loss or even cell death.34 The Fe2+ content of the GOx/EC@Fe3O4@CCM group was the highest, and was significantly higher than that of the control group (Figures 3C–E and S4), as observed by fluorescence microscopy after staining with FerroOrange, a Fe2+ fluorescent probe. This was also observed by measuring the amount of Fe2+ in the cells (Figure 3F and G), and cellular endocytosis of nanoplatforms increased intracellular Fe2+. From the results, we inferred that the addition of GOx@Fe3O4 and EC@Fe3O4 could significantly increase the degree of ferroptosis, and the cascade of GOx with EC and Fe3O4 could further effectively trigger ferroptosis in Huh7 and Hepa1-6 cells.
Antitumor Effect in vitro
We hypothesized that the intracellular overload of Fe2+ and the reduction of energy and the formation of OS would affect the proliferative behavior of cancer cells. EdU can be incorporated into the newly synthesized DNA instead of thymidine during DNA synthesis. The newly synthesized DNA will be labeled with the corresponding fluorescent probe, and the red fluorescence represents the proliferation signal. In the experiment, we found that the fluorescence signal of the group treated with GOx/EC@Fe3O4@CCM nanoplatforms was the weakest among all groups by fluorescence microscopy (Figures 4A–C and S5A), which indicated that the proliferation of cancer cells in this group was strictly limited, which verified our conclusion. Secondly, the distribution of live cells and dead cells in each experimental group can be observed more intuitively and compared by using fluorescent dyes and fluorescence microscope. Huh7 and Hepa1-6 cells were treated with different drugs and then stained with Calcein-AM and PI. Under the action of the dye, the live cells showed green fluorescence, while the dead cells showed red fluorescence as observed by the fluorescence microscope. The results showed that cells without any treatment (control group) grew very well, while cells treated with GOx@Fe3O4 nanoplatforms showed a small amount of damage, and dead cells treated with EC@Fe3O4 showed a further increase (Figures 4D and S5B). Remarkably, almost all of the cells died after treatment with GOx/EC@Fe3O4 or GOx/EC@Fe3O4@CCM. The glucose oxidation triggered by GOx during the reaction not only cuts off the vital energy supply of cancer cells and starves them, but also provides abundant H2O2 for the subsequent Fenton reaction, which causes damage to cancer cells. The in vitro cytotoxicity of the GOx/EC@Fe3O4@CCM nanoplatforms was determined by MTT assay on Huh7 and Hepa1-6 cells, respectively (Figures 4E and F), and the cascade effect of these factors made the GOX /EC@Fe3O4@CCM nanoplatforms the most toxic in each group. Increasing the concentration of the drug further increased the apoptosis rate of Huh7 and Hepa1-6 cells. At the same time, we found that normal hepatocyte THLE-2 was safer for these nanoparticles compared to Hepa1-6 and Huh7 cells (Figure S6). Flow cytometry combined with Annexin-V647/PI double staining was used to analyze the apoptosis of Huh7 and Hepa1-6 cells after drug treatment. For Huh7 cells, when the concentration of drug was 52.7 μg/mL, the apoptosis rate of GOx@Fe3O4 nanoplatforms was 16.03%. Group EC@Fe3O4 (19.58%), GOx/EC@Fe3O4 (56.9%), and GOx/EC@Fe3O4@CCM (56.1%). For Hepa1-6 cells, when the concentration of drug was 55.88 μg/mL, the apoptosis rate of GOx@Fe3O4 nanoplatforms was 23.61%. EC@Fe3O4 group (35.96%), GOx/EC@Fe3O4 group (47.6%) and GOx/EC@Fe3O4@CCM group (56.3%) (Figures 4G–J).
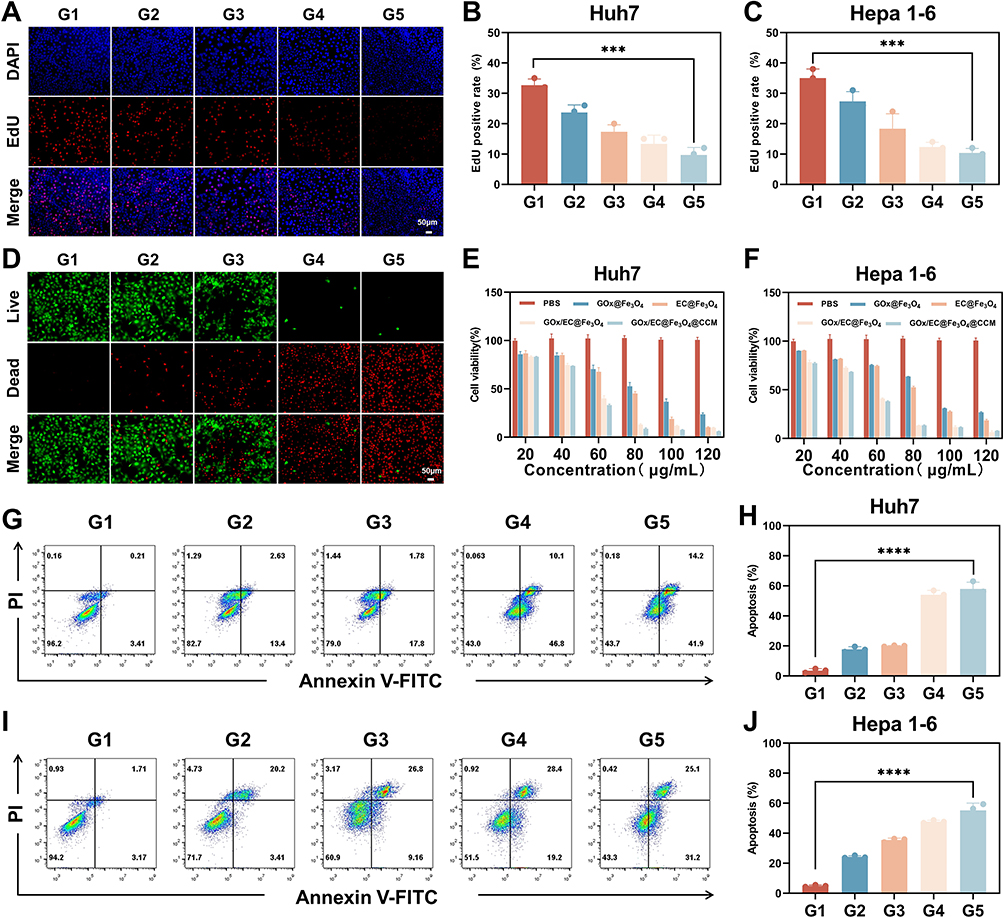 |
Figure 4 Cytotoxicity assays. Images of intracellular EdU staining of Huh7 cells after different treatments (A). Quantitative analysis of corresponding EdU fluorescence intensity in Huh7 and Hepa1-6 cells (B and C). Calcein AM/PI staining images of Huh7 cells after different treatments (D). In vitro cytotoxicity of Huh7 and Hepa1-6 cells under incubation conditions at various concentrations of PBS, GOx@Fe3O4, EC@Fe3O4, GOx/EC@Fe3O4, and GOx/EC@Fe3O4@CCM (E and F). Flow cytometry was used to analyze Huh7 and Hepa1-6 cells after different treatments (G–J). Scale bar: 200 μm. n=3, ****p < 0.0001, ***p < 0.001. G1: Control, G2: GOx@Fe3O4, G3: EC@Fe3O4, G4: GOx/EC@Fe3O4, G5: GOx/EC@Fe3O4@CCM. |
Taken together, we hypothesized that the ·OH produced by GOx/EC@Fe3O4@CCM nanoplatforms induced and maintained high levels of OS in cells, which, coupled with starvation effect and Fenton reaction, enhanced CDT induced by cancer combination therapy, ultimately contributed to its enhanced cytotoxicity and induction of apoptosis.
Intracellular ROS Analysis
GOx carried in GOx@Fe3O4, GOx/EC@Fe3O4, and GOx/EC@Fe3O4@CCM nanoplatforms all showed good catalytic performance on glucose, which provided an important basis for the Fenton reaction (Figure 5A). Therefore, we tested whether they had the same effect at the cellular level by treating Hepa1-6 and Huh7 cells with each drug group. Subsequently, we detected the intracellular glucose content. We found that the intracellular glucose level of cells treated with GOx@Fe3O4, GOx/EC@Fe3O4, and GOx/EC@Fe3O4@CCM nanoplatforms was significantly lower than that of the control group (Figures 5B and S7). The GOX-containing nanoplatforms still maintained the catalytic effect on glucose and were well released into the cells. In addition, we saw that the EC@Fe3O4 nanoparticle group could also reduce the intracellular glucose content in the Huh7 cell experiments. This result should be attributed to the fact that EC@Fe3O4 nanoplatforms cause OS to a certain extent in cells. Under this stress state, the way of energy metabolism in cells changes, so that glucose is metabolized more through other pathways, and therefore, the level of glucose in cells can also be reduced.35 However, the overall effect of EC@Fe3O4 nanoplatforms on intracellular glucose levels was slight and far less effective than other experimental groups. Taken together, the decrease of intracellular glucose level was mainly due to the GOx carried in the nanoplatforms. In addition, we hypothesized that GOx catalysis on glucose, which is an important raw material for intracellular ATP production, would fundamentally reduce ATP production. By testing the content of intracellular ATP, we found that the level of ATP in the cells of each treatment group decreased, and the content of GOx@Fe3O4 was lower than that of EC@Fe3O4. Among them, the decreasing trend after GOx/EC@Fe3O4@CCM nanoparticle treatment was the most significant, which was significantly lower than that of the untreated group (Figures 5C and S8). Thus, the presence of GOx clearly reduced intracellular ATP production, and the cascade of EC and GOx and Fe3O4 further reduced intracellular ATP content.
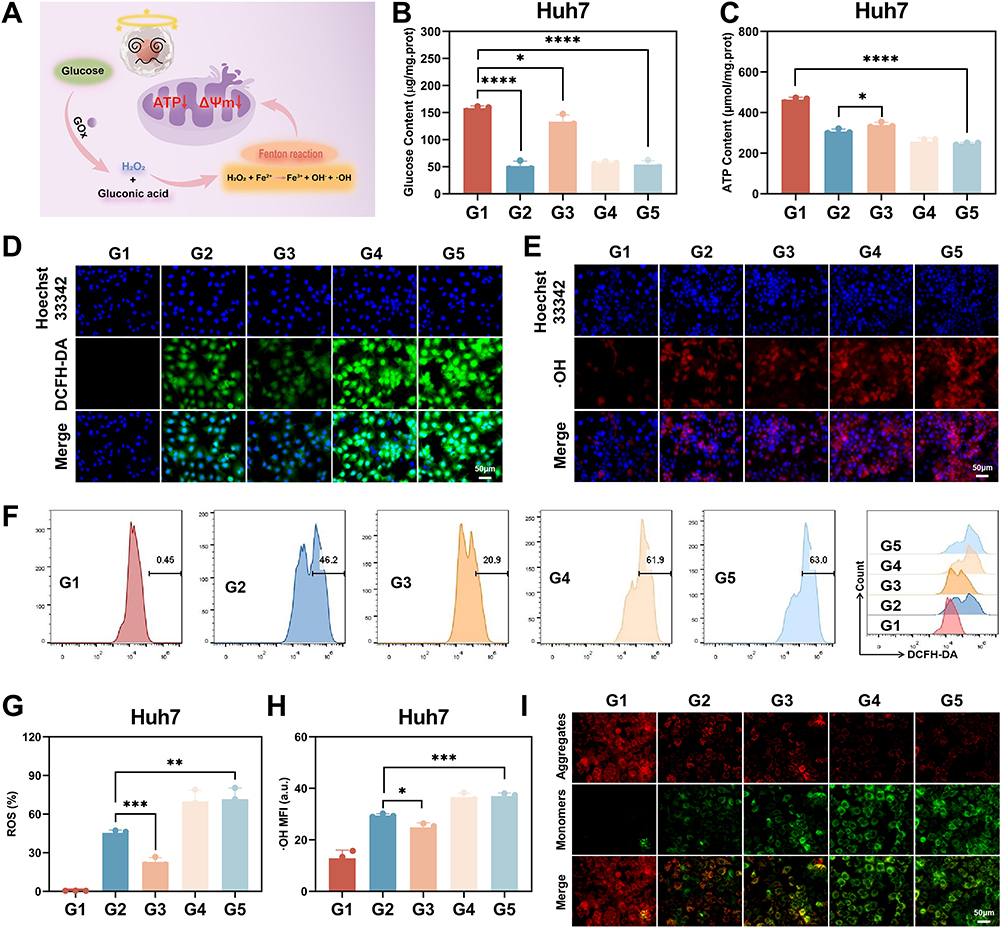 |
Figure 5 Intracellular reactive oxygen species analysis. The role of GOx in cells (A). Measurement of intracellular glucose content in Huh7 cells (B). Relative ATP content of Huh7 cells after different treatments (C). Intracellular DCFH-DA staining images of Huh7 cells after different treatments (D). Huh7 cells after different treatment of hydroxyl radicals dyeing images in the cell (E). Intracellular DCFH-DA flow cytometry images and corresponding fluorescence intensity quantitative analysis of Huh7 cells after different treatments (F and G). Quantitative analysis of fluorescence intensity of intracellular hydroxyl radical staining in Huh7 cells after different treatments (H). Mitochondrial membrane potential of Huh7 cells after different treatments was shown by JC-1 fluorescent probe (I). Scale bar: 50 μm. n=3, ****p < 0.0001, ***p < 0.001, **p < 0.01, *p < 0.05. G1: Control, G2: GOx@Fe3O4, G3: EC@Fe3O4, G4: GOx/EC@Fe3O4, G5: GOx/EC@Fe3O4@CCM. |
The synergistic effect of multiple drugs in GOx/EC@Fe3O4@CCM nanoplatforms clearly improves the efficiency of CDT, and the Fenton reaction is enhanced, which can lead to an increase in the overall ROS level of the cell. ROS levels in Hepa1-6 and Huh7 cells treated with different drugs were evaluated using ROS fluorescent probes. In the experiment, we observed that the green fluorescence signal of the GOx@Fe3O4 treatment group was stronger than that of the EC@Fe3O4 treatment group, which was due to the oxidation of glucose by GOx in GOx@Fe3O4 nanoplatforms and the production of a large amount of ROS (Figures 5D and S9A–C). Although the EC@Fe3O4 treatment group could inhibit the cellular antioxidant mechanism to a certain extent and increase the intracellular ROS level, it was not the main factor in ROS production. In each group, the group treated with GOx/EC@Fe3O4@CCM nanoplatforms had the strongest green fluorescence, which indicated that the synergistic effect of GOx with EC and Fe3O4 resulted in the highest ROS content in cells, thus causing the greatest damage to cells. Moreover, the fluorescence signal of ROS can reflect its fluorescence level, so we also detected the fluorescence signal of intracellular ROS by flow cytometry. In the detected results, the fluorescence signals of ROS in each group were consistent with the results of fluorescence microscopy (Figures 5F, G and S9D–F), so our conclusion was further verified. It is well known that ·OH is also included in ROS. In the Fenton reaction, the reaction of Fe2+ with H2O2 can produce ·OH, for this purpose, we used a ·OH fluorescent probe to detect it. In Hepa1-6 and Huh7 cells, after drug treatment, GOx in the nanoplatforms utilized the intracellular glucose to continuously generate H2O2, and had a strong Fenton reaction with Fe2+. Through the staining of fluorescent probe and observation under fluorescence microscope, we found that the fluorescence signal of GOx@Fe3O4, GOx/EC@Fe3O4, GOx/EC@Fe3O4@CCM nanoparticle treatment groups was more significant, among which the fluorescence signal of GOx/EC@Fe3O4@CCM group was the most obvious. It also shows that the nanoplatforms, in the presence of GOx, produced a large amount of H2O2, which was eventually converted to ·OH (Figures 5E, H and S10A, B). The results of ·OH fluorescence experiment were consistent with those of ROS fluorescence experiment, which indicated that the ROS produced in this study were mainly ·OH, which verified our conjecture above.
Generally speaking, mitochondria are important organelles for the energy source of cells, and the energy generated is mainly ATP.36 Usually cell apoptosis, necrosis or toxicity of some conditions, the level of ATP in the cell will decline, and indicates that the function of mitochondrial damage or fall, in the experiments we found through the GOx/EC@Fe3O4@CCM nanoplatforms treatment, a significant reduction in the content of ATP in the cell. At the same time, in the above studies, we found that GOx/EC@Fe3O4@CCM nanoplatforms can increase the intracellular Fe2+ and H2O2 levels, and promote the conversion of H2O2 to ·OH through the Fenton reaction, thereby inducing intracellular OS, which is likely to lead to mitochondrial dysfunction in cancer cells. Taking these factors together, we suspect that significant mitochondrial damage may have occurred. Normally JC-1 forms J-polymers in the mitochondrial matrix and emits red fluorescence. When mitochondrial function is impaired, the integrity of the mitochondrial membrane is disrupted, in which case JC-1 forms monomers that emit green fluorescence. The decrease of mitochondrial membrane potential is a hallmark event in the early stage of apoptosis, which can be easily detected by the transition of JC-1 dye from red to green fluorescence, indicating that mitochondria are damaged.37 To this end, after co-incubation of cells with the corresponding drugs for 24 h, we found that the mitochondrial membrane potential showed a progressive decrease, manifested as enhanced green fluorescence and weakened red fluorescence, with the strongest red fluorescence in the Control group and the strongest green fluorescence in the GOx/EC@Fe3O4@CCM nanoparticle treatment (Figures 5I and S11). Therefore, mitochondria were damaged to varying degrees after drug treatment, and the most obvious damage was observed after GOx/EC@Fe3O4@CCM nanoparticle treatment.
Intracellular Effects of EC
The addition of EC will affect the action of the intracellular Nrf2 antioxidant system, and eventually lead to ferroptosis of cells (Figure 6A). To this end, the protein expression of Nrf2 and its downstream gene products, HMOX1 and NQO1, was detected by Western blot. As shown in Figures 6B and S12, the expression of Nrf2, HMOX1, and NQO1 proteins was significantly down-regulated in the GOx/EC@Fe3O4@CCM nanoparticle group in all experimental groups. We also examined the expression of GPX4 protein, which was significantly downregulated in the GOx/EC@Fe3O4@CCM nanoparticle group in all experimental groups. Taken together, these results further confirmed that the cascade effect of EC, GOx and Fe3O4 successfully induced ferroptosis, which enhanced the anti-tumor activity of the nanoplatforms at the cellular level.
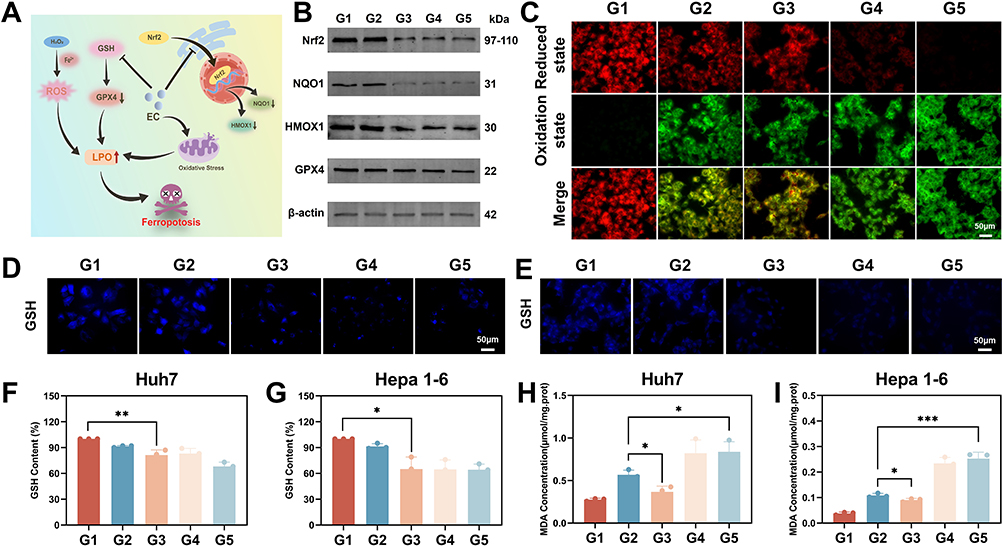 |
Figure 6 Intracellular effects of EC. Role of EC in cells (A). Western Blot was used to detect the expression of Nrf2, HMOX1, NQO1, GPX4, and β-actin in Huh7 cells (B). Intracellular C11-BODIPY fluorescent probe staining images of Huh7 cells after different treatments (C). Corresponding ThiolTracker™ Violet fluorescent probe staining images of Huh7 and Hepa1-6 cells after different treatments (D and E). Relative intracellular GSH content of Huh7 and Hepa1-6 cells after different treatments (F and G). MDA content of Huh7 and Hepa1-6 cells after different treatments (H and I). Scale bar: 50 μm. n=3, ***p < 0.001, **p < 0.01, *p < 0.05. G1: Control, G2: GOx@Fe3O4, G3: EC@Fe3O4, G4: GOx/EC@Fe3O4, G5: GOx/EC@Fe3O4@CCM. |
Due to the large presence of ROS, it usually leads to the production and accumulation of intracellular LPO inevitably.28 Therefore, with the LPO fluorescent probe, we found that the green fluorescence representing the oxidized state of the C11-BODIPY probe gradually increased, while the red fluorescence representing the reduced state of the C11-BODIPY probe gradually decreased (Figures 6C and S13). This is because the oxidized LPO is continuously formed from the reduced lipid due to the oxidation of ROS. In the final analysis, it is mainly under the action of GOx that leads to the generation and accumulation of intracellular peroxide, so the results of LPO experiments are similar to those of ROS. In summary, through the above experiments, it is not difficult to see that GOx/EC@Fe3O4@CCM nanoplatforms produce a large amount of ROS in cells, which causes severe OS in cells.
When the iron-dependent accumulation of lipid peroxidation in cells reaches a lethal level, intracellular GSH will be depleted, eventually leading to the inactivation of GPX4 and further accumulation of LPO, to a certain extent, cell death can be induced. GSH consumption levels in test cell, produce iron indirectly reflects the cell death. EC dissociated from the GOx/EC@Fe3O4@CCM nanoplatforms prepared in this study, on the one hand, inhibits the effect of Nrf2, on the other hand, it can oxidize GSH to GSSG in TME, so the dual combined effect can effectively destroy the antioxidant mechanism of cancer cells.15,16 In order to evaluate a GOx/EC@Fe3O4@CCM nanoplatforms of intracellular GSH consumption ability, respectively Hepa1-6 and Huh7 cells through the different drugs incubation, after using GSH fluorescent staining on each cell. By fluorescence microscopy observation, we found that the addition of EC significantly reduced the fluorescence signal of GSH in cells (Figures 6D, E and S14). The same results were obtained by detecting intracellular GSH content using GSH and GSSG content detection kits (Figure 6F and G). In summary, this is because EC can significantly reduce the GSH content in cells and convert it to GSSG, which ultimately reduces the antioxidant capacity of cancer cells.
Through the above experiments, we know that the content of LPO increases significantly after drug treatment. In addition, MDA, as an important degradation product of LPO, is often used as an important indicator to evaluate ferroptosis.38 This substance can cause cross-linking and polymerization of proteins, nucleic acids and other macromolecules, and its production can also aggravate the damage of cell membrane. So now we also studied the MDA content in each cell after drug treatment. As shown in Figure 6H and I, among the groups of Hepa1-6 and Huh7 cells, the MDA content of the GOx/EC@Fe3O4@CCM treatment group was the highest, which was significantly higher than that of the control group, indicating that the GOx/EC@Fe3O4@CCM treatment group induced significant ferroptosis of cells.
Antitumor Effect in vivo
Based on the in vitro results, the anti-tumor effect of different nanoplatforms in vivo was further investigated. In order to exclude the influence of the immune system in the mice, we used immunodeficient Balb/c nude mice to establish human hepatoma-related animal models. Hepa1-6 cells were injected into the right buttocks of the mice, and the tumor model was successfully constructed 1 week later. Firstly, we tested the targeting and enrichment effects of GOx/EC@Fe3O4 and GOx/EC@Fe3O4@CCM nanoplatforms in tumors and major organs (heart, liver, spleen, lung, kidney) before drug treatment. The GOx/EC@Fe3O4 and GOx/EC@Fe3O4@CCM nanoplatforms were labeled with Cy5.5, and the mice in the two groups were imaged at the same time points (0, 0.5, 1, 2, 4, 8, 16, 24 h) by in vivo imaging system after injection of the respective drugs. The imaging results showed that the fluorescence signal of the GOx/EC@Fe3O4@CCM nanoparticle group was stronger than that of the GOx/EC@Fe3O4 nanoparticle group at the tumor site, and a little fluorescence was also observed in the liver and lung at the later stage (Figure 7A). This result is closely related to the cancer cell membrane covered by the surface of GOx/EC@Fe3O4@CCM nanoplatforms, which improves the tumor targeting of the nanoplatforms in mice. In the GOx/EC@Fe3O4 nanoplatforms group, fluorescence signals were mainly concentrated in the liver and lung, indicating that nanoplatforms were enriched in the liver and lung, and metabolized through the liver, which is usually the general pathway of drug metabolism.39 However, the drug is enriched in the lung, which is mainly related to the abundant capillaries in the lung, which prolongs the retention time of the drug. Finally, the mice were euthanized, and then the tumors and major organs (including: heart, liver, spleen, lung, kidney) were dissected and removed for imaging in the imaging system. Consistent with these results, the fluorescence signal was strongest in the tumor site for the GOx/EC@Fe3O4@CCM nanoparticle group and was most pronounced in the lung and liver for the GOx/EC@Fe3O4 nanoparticle group (Figure 7B).
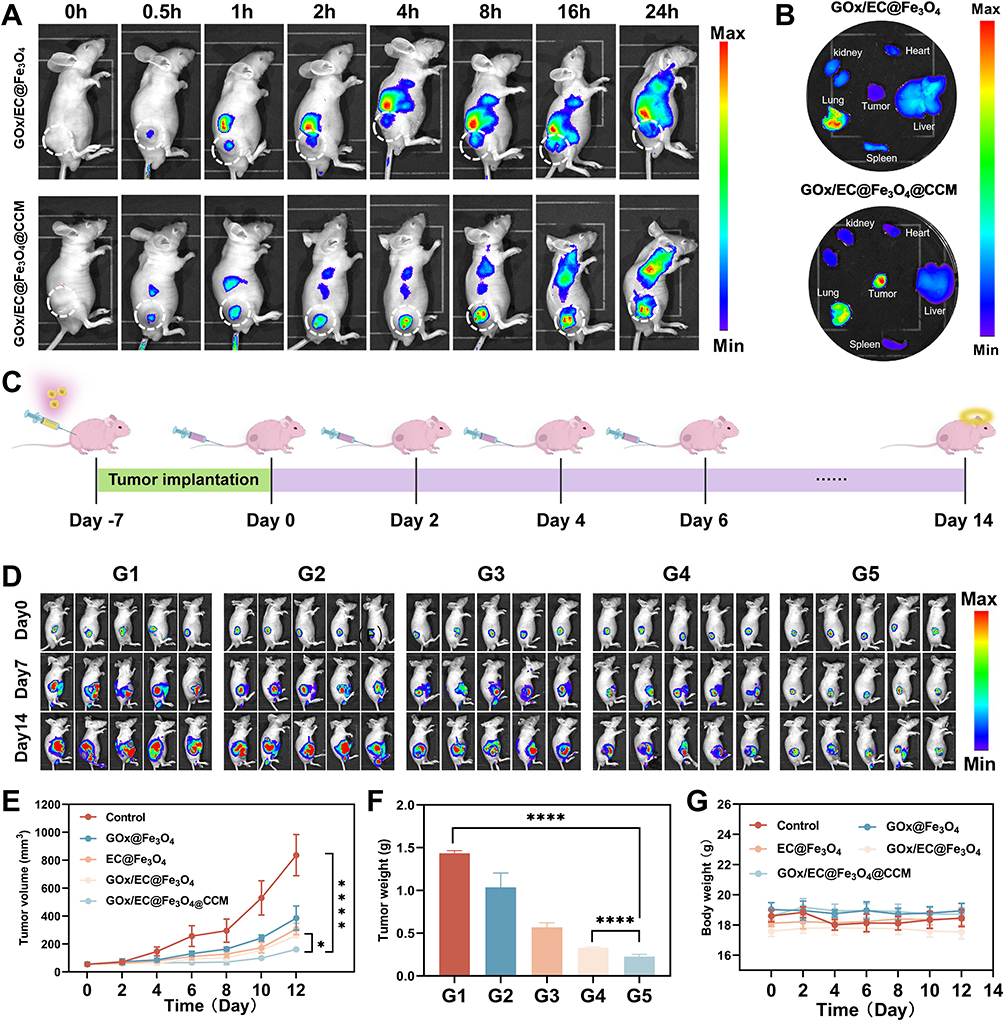 |
Figure 7 Antitumor effects of nanoplatforms in vivo. The distribution of Cy5.5-labeled GOx/EC@Fe3O4 or GOx/EC@Fe3O4@CCM in vivo can be observed using an in vivo imaging system after intravenous administration (A). Representative fluorescence images of dissected organs and tumors 24h after injection of Cy5.5-labeled GOx/EC@Fe3O4 or GOx/EC@Fe3O4 @ccm (B). Treatment flow chart (C). Bioluminescence images of mice receiving different treatments (n = 5) (D). Volume of the tumor during treatment (n = 5) (E). Weight measurement of the tumor mass (n=5) (F). Body weight of mice during treatment (n = 5) (G). n=3, ****p < 0.0001, *p < 0.05. G1: Control, G2: GOx@Fe3O4, G3: EC@Fe3O4, G4: GOx/EC@Fe3O4, G5: GOx/EC@Fe3O4@CCM. |
Next, Luciferase labeled Hepa1-6 cells were injected into the right hip of the mice for bioluminescence imaging, and the tumor model was successfully established 1 week later, and the mice were treated immediately (Figure 7C). The trend of tumor size changes during treatment was visually observed by the bioluminescence images of the mice (Figure 7D). Both the fluorescence intensity, and the fluorescence range, the GOx/EC@Fe3O4@CCM nanoparticle group was the smallest among the groups. The analysis of tumor volume, which was closely monitored during treatment (Figures 7E and S15), showed that after the end of treatment, tumor volumes were smaller in each treatment group than in the control group, indicating that each agent had varying degrees of tumor inhibition, with the GOx/EC@Fe3O4@CCM nanoparticle having the most significant effect. At the end of treatment, we euthanized the mice and removed the tumor from each mouse. After photographing and weighing the tumors in each group, we found that the tumor weight of the GOx/EC@Fe3O4@CCM nanoparticle group was the lowest among all groups (Figures 7F and S16), which further proved that the nanoparticle had a good tumor inhibition effect.
The situation of tumor cell necrosis can be better understood from the cellular level. As can be seen in the H&E staining diagram (Figure S17), the cells of the control group still maintained a good nuclear structure and a complete cell membrane, which indicated that the tumors of the mice in this group maintained a high activity and invasiveness. The H&E stained tumor sections of the mice treated with each drug showed different degrees of cell membrane rupture, nuclear pyknosis, nuclear fragmentation, and nuclear lysis. Among them, the GOx/EC@Fe3O4@CCM nanoparticle group had the most extensive and complete degree of tumor cell necrosis. So the GOx/EC@Fe3O4@CCM nanoplatforms effect on tumor destruction is most significantly, the treatment effect was the best. Moreover, we performed H&E staining of the major organs (including heart, liver, spleen, lung, and kidney) in each group of mice, and no obvious histological changes were observed, indicating that the systemic toxicity of each drug to mice was low, which further indicated that this study not only ensured good efficacy in the treatment of tumors in mice, but also ensured the biosafety and histocompatibility of the drugs in mice. We assessed the proliferative capacity of tumors by detecting Ki67 fluorescence in tumor sections. Under the fluorescence microscope (Figure S18), we observed that the Ki67 fluorescence signal of tumor cells in the GOx/EC@Fe3O4@CCM nanoparticle group was the weakest, indicating that the proliferation ability of tumor cells in this group was significantly inhibited. In the results of immunohistochemistry and immunofluorescence (Figures S19 and S20), we found that the expression of Nrf2 and GPX4 was also significantly down-regulated. In addition, there was no significant change in the body weight of the mice throughout the treatment (Figure 7G). At the end of the experiment, we also collected the blood of the mice for liver and kidney function examination, and the examination results showed that the liver and kidney function indexes of the mice in each group were within the safe range (Figure S21). In conclusion, the treatment regimen in this study has good tumor suppression effect and good biosafety.
Limitations
In this study, GOx/EC@Fe3O4@CCM nanoplatforms were developed using mesoporous Fe3O4 as a carrier, and although they significantly promoted hepatocellular carcinoma cell regression from the ferroptosis pathway, the effect was single if combined with other treatment options, such as: Immunotherapy or activation of the cGAS-STING pathway may eventually make the anti-HCC effect more obvious.40,41
Conclusion
In summary, this study has developed a nanoplatform to promote ferroptosis in HCC cells through a cascade effect. In this study, we prepared mesoporous Fe3O4 as the carrier of the nano platform, loaded with GOx and EC in the mesoporous, and coated the HCC cell membrane on the surface of nanoplatforms to prepare GOx/EC@Fe3O4@CCM nanoplatforms for targeted therapy of HCC. GOx produced a large amount of H2O2 by consuming glucose in the TME, and the gluconic acid produced was also beneficial to maintain the acidic environment of the TME. In addition, the decrease of glucose content also achieved starvation treatment of cancer cells. In an acidic environment, Fe3O4 provides abundant iron ions, which stimulate ·OH generation through an efficient Fenton reaction with H2O2 produced by GOx. The release of EC inhibits Nrf2 and consumes GSH, limiting the role of intracellular antioxidant system, avoiding the removal of ROS such as H2O2 and ·OH by cells, and effectively maintaining a high level of OS in cells. In summary, the multiple cascade effects of GOx, EC and Fe3O4 lead to a strong intracellular Fenton reaction and OS, which effectively induces ferroptosis in liver cancer cells and leads to regression of liver cancer cells. This study provides a new treatment strategy for promoting ferroptosis in liver cancer cells.
Acknowledgments
The authors would like to acknowledge the National Natural Science Foundation of China (NO. 82173010 and NO. 81960531) for the support.
Disclosure
The authors declare that they have no known competing financial interests or personal relationships that could have appeared to influence the work reported in this paper.
References
1. Rumgay H, Arnold M, Ferlay J, et al. Global burden of primary liver cancer in 2020 and predictions to 2040. J Hepatol. 2022;77(6):1598–1606. doi:10.1016/j.jhep.2022.08.021
2. Wang D, Qiu G, Zhu X, et al. Macrophage-inherited exosome excise tumor immunosuppression to expedite immune-activated ferroptosis. J Immunother Cancer. 2023;11(5):e006516. doi:10.1136/jitc-2022-006516
3. Tian H, Zhao S, Nice EC, et al. A cascaded copper-based nanocatalyst by modulating glutathione and cyclooxygenase-2 for hepatocellular carcinoma therapy. J Colloid Interface Sci. 2022;607(Pt 2):1516–1526. doi:10.1016/j.jcis.2021.09.049
4. Khan S, Sharifi M, Hasan A, et al. Magnetic nanocatalysts as multifunctional platforms in cancer therapy through the synthesis of anticancer drugs and facilitated Fenton reaction. J Adv Res. 2021;30:171–184. doi:10.1016/j.jare.2020.12.001
5. Qian X, Zhang J, Gu Z, Chen Y. Nanocatalysts-augmented Fenton chemical reaction for nanocatalytic tumor therapy. Biomaterials. 2019;211:1–13. doi:10.1016/j.biomaterials.2019.04.023
6. Wang D, Zhang M, Zhang Y, et al. Intraparticle double-scattering-decoded sonogenetics for augmenting immune checkpoint blockade and CAR-T therapy. Adv Sci. 2022;9(32):e2203106. doi:10.1002/advs.202203106
7. Zhang S, Zhang Y, Feng Y, et al. Biomineralized two-enzyme nanoparticles regulate tumor glycometabolism inducing tumor cell pyroptosis and robust antitumor immunotherapy. Adv Mater. 2022;34(50):e2206851. doi:10.1002/adma.202206851
8. Kajarabille N, Latunde-Dada G. Programmed cell-death by ferroptosis: antioxidants as mitigators. Int J Mol Sci. 2019;20(19):4968. doi:10.3390/ijms20194968
9. He F, Ru X, Wen T. NRF2, a transcription factor for stress response and beyond. Int J Mol Sci. 2020;21(13):4777. doi:10.3390/ijms21134777
10. Yan R, Lin B, Jin W, Tang L, Hu S, Cai R. NRF2, a superstar of ferroptosis. Antioxidants. 2023;12(9):1739. doi:10.3390/antiox12091739
11. Sajadimajd S, Khazaei M. Oxidative stress and cancer: the role of Nrf2. Curr Cancer Drug Targets. 2018;18(6):538–557. doi:10.2174/1568009617666171002144228
12. Guerrero-Escalera D, Alarcón-Sánchez BR, Arellanes-Robledo J, et al. Comparative subcellular localization of NRF2 and KEAP1 during the hepatocellular carcinoma development in vivo. Biochim Biophys Acta Mol Cell Res. 2022;1869(5):119222. doi:10.1016/j.bbamcr.2022.119222
13. Wang D, Zhu X, Wang X, et al. Multichannel sonocatalysis amplifiers target IDH1‐mutated tumor plasticity and attenuate ros tolerance to repress malignant cholangiocarcinoma. Adv Funct Mater. 2023;33(48):2303869. doi:10.1002/adfm.202303869.
14. Dodson M, Castro-Portuguez R, Zhang DD. NRF2 plays a critical role in mitigating lipid peroxidation and ferroptosis. Redox Biol. 2019;23:101107. doi:10.1016/j.redox.2019.101107
15. Xu Y, Li Y, Li J, Chen W. Ethyl carbamate triggers ferroptosis in liver through inhibiting GSH synthesis and suppressing Nrf2 activation. Redox Biol. 2022;53:102349. doi:10.1016/j.redox.2022.102349
16. Du B, Deng G, Zaman F, et al. Antioxidant cuttlefish collagen hydrolysate against ethyl carbamate-induced oxidative damage. RSC Adv. 2021;11(4):2337–2345. doi:10.1039/d0ra08487e
17. Chen J, Li X, Ge C, Min J, Wang F. The multifaceted role of ferroptosis in liver disease. Cell Death Differ. 2022;29(3):467–480. doi:10.1038/s41418-022-00941-0
18. Feng W, Shi W, Wang Z, et al. Enhancing tumor therapy of Fe(III)-Shikonin supramolecular nanomedicine via triple ferroptosis amplification. ACS Appl Mater Interfaces. 2022;14(33):37540–37552. doi:10.1021/acsami.2c11130
19. Ding Y, Xu H, Xu C, et al. A nanomedicine fabricated from gold nanoparticles-decorated metal-organic framework for cascade chemo/chemodynamic cancer therapy. Adv Sci. 2020;7(17):2001060. doi:10.1002/advs.202001060
20. He R, Yang P, Liu A, et al. Cascade strategy for glucose oxidase-based synergistic cancer therapy using nanomaterials. J Mater Chem B. 2023;11(41):9798–9839. doi:10.1039/d3tb01325a
21. Wang D, Feng C, Xiao Z, et al. Therapeutic hydrogel for enhanced immunotherapy: a powerful combination of MnO2 nanosheets and vascular disruption. Nano Today. 2022;47:101673. doi:10.1016/j.nantod.2022.101673
22. Albinali KE, Zagho MM, Deng Y, Elzatahry AA. A perspective on magnetic core-shell carriers for responsive and targeted drug delivery systems. Int J Nanomed. 2019;14:1707–1723. doi:10.2147/IJN.S193981
23. Wang D, Zhou J, Fang W, et al. A multifunctional nanotheranostic agent potentiates erlotinib to EGFR wild-type non-small cell lung cancer. Bioact Mater. 2022;13:312–323. doi:10.1016/j.bioactmat.2021.10.046
24. Xie W, Gan Y, Wang L, et al. Tumor microenvironment-activated nanostructure to enhance MRI capability and nanozyme activity for highly tumor-specific multimodal theranostics. Small. 2024;20(14):e2306446. doi:10.1002/smll.202306446
25. Yu W, Jia F, Fu J, et al. Enhanced transcutaneous chemodynamic therapy for melanoma treatment through cascaded fenton-like reactions and nitric oxide delivery. ACS Nano. 2023;17(16):15713–15723. doi:10.1021/acsnano.3c02964
26. Wang Y, Wang D, Zhang Y, et al. Tumor microenvironment-adaptive nanoplatform synergistically enhances cascaded chemodynamic therapy. Bioact Mater. 2023;22:239–253. doi:10.1016/j.bioactmat.2022.09.025
27. Zhen X, Cheng P, Pu K. Recent advances in cell membrane-camouflaged nanoparticles for cancer phototherapy. Small. 2019;15(1):e1804105. doi:10.1002/smll.201804105
28. Xie W, Deng WW, Zan M, et al. Cancer cell membrane camouflaged nanoparticles to realize starvation therapy together with checkpoint blockades for enhancing cancer therapy. ACS Nano. 2019;13(3):2849–2857. doi:10.1021/acsnano.8b03788
29. Han M, Ji X, Li J, et al. Lipoprotein-inspired nanocarrier composed of folic acid-modified protein and lipids: preparation and evaluation of tumor-targeting effect. Int J Nanomed. 2020;15:3433–3445. doi:10.2147/IJN.S241448
30. Iron-coordinated L-Lysine-based nanozymes with high peroxidase-like activity for sensitive hydrogen peroxide and glucose detection-pubmed. Available from: https://pubmed.ncbi.nlm.nih.gov/37514392/.
31. Rahman I, Kode A, Biswas SK. Assay for quantitative determination of glutathione and glutathione disulfide levels using enzymatic recycling method. Nat Protoc. 2006;1(6):3159–3165. doi:10.1038/nprot.2006.378
32. Fan X, Lim J, Li Z, et al. GOX-hemin nanogels with enhanced cascade activity for sensitive one-step glucose detection. J Mater Chem B. 2021;9(16):3509–3514. doi:10.1039/d1tb00191d
33. Buchhaupt M, Lintz K, Hüttmann S, Schrader J. Partial secretome analysis of Caldariomyces fumago reveals extracellular production of the CPO co-substrate H2O2 and provides a coproduction concept for CPO and glucose oxidase. World J Microbiol Biotechnol. 2018;34(2):24. doi:10.1007/s11274-017-2407-2
34. Chen Q, Zheng W, Guan J, et al. SOCS2-enhanced ubiquitination of SLC7A11 promotes ferroptosis and radiosensitization in hepatocellular carcinoma. Cell Death Differ. 2023;30(1):137–151. doi:10.1038/s41418-022-01051-7
35. Lactate and pyruvate promote oxidative stress resistance through hormetic ROS signaling-PubMed. Available from: https://pubmed.ncbi.nlm.nih.gov/31506428/.
36. Roger AJ, Muñoz-Gómez SA, Kamikawa R. The origin and diversification of Mitochondria. Curr Biol. 2017;27(21):R1177–R1192. doi:10.1016/j.cub.2017.09.015
37. Zeng C, Lin J, Zhang K, et al. SHARPIN promotes cell proliferation of cholangiocarcinoma and inhibits ferroptosis via p53/SLC7A11/GPX4 signaling. Cancer Sci. 2022;113(11):3766–3775. doi:10.1111/cas.15531
38. Yuan S, Wei C, Liu G, et al. Sorafenib attenuates liver fibrosis by triggering hepatic stellate cell ferroptosis via HIF-1α/SLC7A11 pathway. Cell Prolif. 2022;55(1):e13158. doi:10.1111/cpr.13158
39. Qian H, Chao X, Williams J, et al. Autophagy in liver diseases: a review. Mol Aspects Med. 2021;82:100973. doi:10.1016/j.mam.2021.100973
40. Wang D, Zhang M, Qiu G, et al. Extracellular matrix viscosity reprogramming by in situ Au bioreactor-boosted microwavegenetics disables tumor escape in CAR-T immunotherapy. ACS Nano. 2023;17(6):5503–5516. doi:10.1021/acsnano.2c10845
41. Wang D, Nie T, Huang C, et al. Metal-cyclic dinucleotide nanomodulator-stimulated STING signaling for strengthened radioimmunotherapy of large tumor. Small. 2022;18(41):e2203227. doi:10.1002/smll.202203227
 © 2024 The Author(s). This work is published and licensed by Dove Medical Press Limited. The
full terms of this license are available at https://www.dovepress.com/terms.php
and incorporate the Creative Commons Attribution
- Non Commercial (unported, 3.0) License.
By accessing the work you hereby accept the Terms. Non-commercial uses of the work are permitted
without any further permission from Dove Medical Press Limited, provided the work is properly
attributed. For permission for commercial use of this work, please see paragraphs 4.2 and 5 of our Terms.
© 2024 The Author(s). This work is published and licensed by Dove Medical Press Limited. The
full terms of this license are available at https://www.dovepress.com/terms.php
and incorporate the Creative Commons Attribution
- Non Commercial (unported, 3.0) License.
By accessing the work you hereby accept the Terms. Non-commercial uses of the work are permitted
without any further permission from Dove Medical Press Limited, provided the work is properly
attributed. For permission for commercial use of this work, please see paragraphs 4.2 and 5 of our Terms.