")
Back to Journals » Cancer Management and Research » Volume 16
Key Cell-in-Cell Related Genes are Identified by Bioinformatics and Experiments in Glioblastoma
Authors Zhang F, Ye J, Zhu J, Qian W, Wang H, Luo C
Received 25 April 2024
Accepted for publication 27 August 2024
Published 5 September 2024 Volume 2024:16 Pages 1109—1130
DOI https://doi.org/10.2147/CMAR.S475513
Checked for plagiarism Yes
Review by Single anonymous peer review
Peer reviewer comments 2
Editor who approved publication: Professor Harikrishna Nakshatri
Fenglin Zhang,* Jingliang Ye,* Junle Zhu, Wenbo Qian, Haoheng Wang, Chun Luo
Department of Neurosurgery, Tongji Hospital, School of Medicine, Tongji University, Shanghai, People’s Republic of China
*These authors contributed equally to this work
Correspondence: Chun Luo, Email [email protected]
Purpose: This study aimed to explore the roles of cell-in-cell (CIC)-related genes in glioblastoma (GBM) using bioinformatics and experimental strategies.
Patients and Methods: The ssGSEA algorithm was used to calculate the CIC score for each patient. Subsequently, differentially expressed genes (DEGs) between the CIClow and CIChigh groups and between the tumor and control samples were screened using the limma R package. Key CIC-related genes (CICRGs) were further filtered using univariate Cox and LASSO analyses, followed by the construction of a CIC-related risk score model. The performance of the risk score model in predicting GBM prognosis was evaluated using ROC curves and an external validation cohort. Moreover, their location and differentiation trajectory in GBM were analyzed at the single-cell level using the Seurat R package. Finally, the expression of key CICRGs in clinical samples was examined by qPCR.
Results: In the current study, we found that CIC scorelow group had a significantly better survival in the TCGA-GBM cohort, supporting the important role of CICRGs in GBM. Using univariate Cox and LASSO analyses, PTX3, TIMP1, IGFBP2, SNCAIP, LOXL1, SLC47A2, and LGALS3 were identified as key CICRGs. Based on this data, a CIC-related prognostic risk score model was built using the TCGA-GBM cohort and validated in the CGGA-GBM cohort. Further mechanistic analyses showed that the CIC-related risk score is closely related to immune and inflammatory responses. Interestingly, at the single-cell level, key CICRGs were expressed in the neurons and myeloids of tumor tissues and exhibited unique temporal dynamics of expression changes. Finally, the expression of key CICRGs was validated by qPCR using clinical samples from GBM patients.
Conclusion: We identified novel CIC-related genes and built a reliable prognostic prediction model for GBM, which will provide further basic clues for studying the exact molecular mechanisms of GBM pathogenesis from a CIC perspective.
Keywords: glioblastoma, bioinformatics, cell-in-cell, prognosis
Introduction
Glioblastoma (GBM) is a primary intracranial malignancy in adults.1 The standard clinical approach for newly diagnosed GBM patients involves surgical intervention followed by postoperative chemo- and radio-therapy.2 Despite recent progress in surgical techniques and clinical treatments for glioma,3–5 the survival rate for GBM patients over 5 years is less than 5%, with a median survival of approximately 15 months after diagnosis.6 The heterogeneity and complex neuro-cancer interactions in GBM pose a significant challenge in managing GBM patients. Therefore, identifying new molecular markers that can impact the onset and progression of GBM has become a key focus in the current study, aiming to lay the groundwork for personalized and precise treatment of GBM patients.
Cell-in-cell structures (CICs) are characterized by one or more cells found in the cytoplasm of other cells.7 CICs have multiple effects on cell behaviors and functions of both external and internal cells, such as cell death, cell proliferation, and immune regulation.8,9 These structures have been observed in multiple human cancers as reviewed by Fais and Overholtzer.10 Su et al found that in-cell killing mediated by CIC could offer a promising approach for immunotherapy by altering CD44 signaling.11 Furthermore, studies have highlighted the prognostic value of CIC and CIC-related genes in breast cancer and pancreatic cancer.12,13 Nevertheless, the specific role and potential mechanisms of CIC-related genes in determining the prognosis of GBM patients are still unknown.
Therefore, the primary objective of this study was to pinpoint the core CIC genes that impact the survival of GBM patients through a thorough analysis involving bioinformatics and experimental validation. The illustrative workflow of this process is outlined in Figure 1. We aim to provide insightful findings that could be instrumental in enhancing the diagnosis, treatment, and prognosis prediction of GBM.
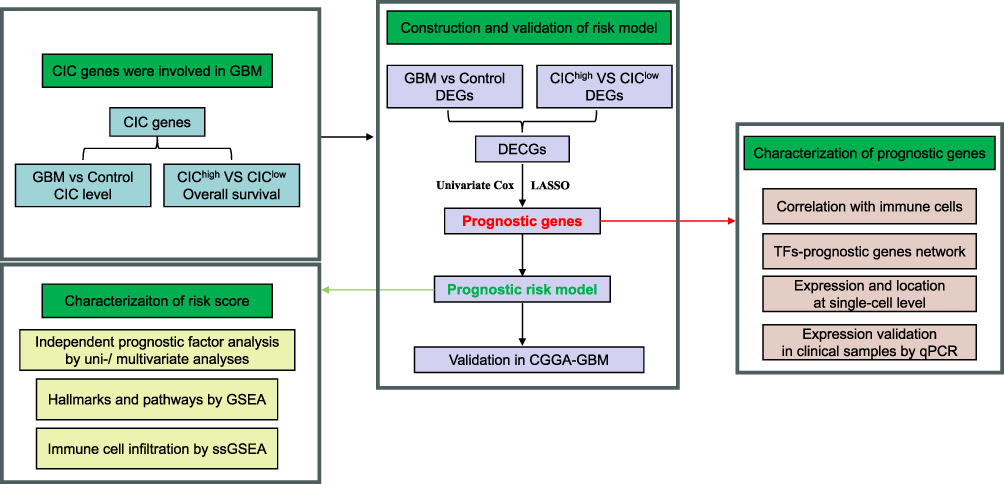 |
Figure 1 The schematic workflow of the current study. Abbreviations: CIC, cell-in-cell; GBM, glioblastoma; GSEA, gene set enrichment analysis; ssGSEA, single-sample gene set enrichment analysis; DEG, differentially expressed gene; TF, transcription factor. |
Materials and Methods
Data Source
Level 3 gene expression profiles of GBM and corresponding control samples were sourced from TCGA (http://xena.ucsc.edu/) and CGGA database (http://www.cgga.org.cn/), respectively. Both datasets are second-generation high-throughput sequencing data using the Illumina HiSeq 2000 sequencing platform. Also, same processing pipeline was applied to these two datasets, and finally the read count matrix in two datasets were converted into FPKM matrix as detailed described in the previous study.14 Specifically, 157 GBM samples having both expression data and overall survival information from TCGA were used to identify prognostic CIC genes and to construct the risk model to predict GBM prognosis, and 85 GBM samples from CGGA having both expression data and overall survival information were used to validate the accuracy of the prognosis risk model. To show the expression patterns of differentially expressed transcription factors, expression data of GBM (N = 167) and control samples (N = 5) in TCGA and GBM (N = 325) and control samples (N = 85) in CGGA were utilized. In addition, 101 CIC genes were obtained from the published literature.13
CIC Score of GBM Patients
In the TCGA-GBM dataset, the CIC scores of GBM patients were calculated based on CIC genes by single-sample gene set enrichment analysis (ssGSEA) using the GSVA package.15,16 Then, the difference in CIC score between GBM and normal samples was compared by rank sum test, and the box diagram was drawn by R package “ggPlot2”. Then, R package “survminer” was used to calculate the optimal threshold of CIC score, and GBM patients were assigned into CIChigh and CIClow groups according to the optimal threshold. The optimal threshold was obtained by using surv_cutpoint function with specific parameters: time = “time”, event = “event”, variables, minprop = 0.1, progressbar = TRUE. The survival probabilities of the two groups were compared using the Kaplan-Meier survival” R package and a Kaplan-Meier (K-M) curve was drawn.
Identification of Differentially Expressed CIC Related Genes (DECGs) in GBM Patients
In the TCGA-GBM dataset, to obtain more CIC-related candidate genes, differentially expressed genes (DEGs) between CIChigh and CIClow were screened by limma R package using |log2FC| > 0.5 and p-value < 0.05 as criteria. Given that the original significance threshold did not undergo multiple testing correction, the result may contain some error due to the contingency. Thus, the DEGs between control and GBM samples in the TCGA-GBM dataset were obtained by limma R package using |log2FC| > 1 and adjusted p-value < 0.05 by Benjamini & Hochberg method to avoid false positives. The results are shown in the volcano diagram and heatmap plotted using R package ggplot2 and heatmap, respectively. Finally, to obtain CIC-related DEGs involved in the development of GBM, DEGs between between CIChigh and CIClow group were overlapped with DEGs between GBM and control group using the R language VennDiagram package. Those overlapped DEGs were defined as DECGs in the current study. Furthermore, Gene Ontology (GO) and Kyoto Encyclopedia of Genes and Genomes (KEGG) analyses were performed to investigate the functions of DECGs using the clusterProfiler package of R software. Bar charts generated by the R language “Enrichplot” were displayed to show the results. GO terms and KEGG pathways with a p-value <0.05 were considered as significantly enriched.
Constitution of the Prognostic Model
In the TCGA-GBM dataset (N = 157), univariate Cox analysis was applied first to detect the survival related genes from DECGs with the “survival” R package using p-value <0.05. Then, the survival related genes were further screened by the least absolute shrinkage and selection operator (LASSO) regression through the “glmnet” R package to build the risk model of GBM patients. The random seed was determined by firstly calculating the analysis results of 2000 random seeds separately to ensure the stability of the model performance, and then subsequently determining the value of the random seed. The parameter in the LASSO regression analysis was set to Cox, and 10-fold cross-validation was performed to verify the LASSO regression model. Patients with GBM were assigned to two risk groups (low and high) according to the median risk score. Overall survival (OS) curves were drawn using the “survminer” R package, and the survival differences between the two risk groups were compared. Through the “survivalROC” R package, the ROC curves were plotted to assess the efficacy of the risk model. The risk model was validated using the external CGGA-GBM (N = 85) set.
Establishment and Assessment of the Nomogram
In both TCGA-GBM and CGGA-GBM datasets, clinical factors, such as MGMT status, age, IDH status, sex, and Chr19/20 were included in the univariate Cox analysis together with the risk score. Factors with p-value <0.05, were selected as key prognostic factors of GBM. The key factors were analyzed by multivariate Cox analysis, and factors with p-value <0.05 were selected as independent prognostic factors in GBM. In the TCGA-GBM dataset, based on independent prognostic factors, were drawn with R language “rms”, and the accuracy of the nomogram was assessed by calibration curves.
The Gene Set Enrichment Analysis (GSEA)
In the TCGA-GBM dataset, the expression of genes between the two risk groups was analyzed using the limma R package. Then, based on reference gene sets of Hallmarks and KEGG pathways, GSEA analysis was performed using R language “clusterProfiler” and org.Hs.eg.db.
Evaluation of Immune Cell Infiltration
In the TCGA-GBM dataset, we evaluated the levels of 24 types of immune cells in each TCGA-GBM sample by ssGSEA and compared the differences in immune cells between the two risk groups using the rank sum test and plotted violin charts using the R package vioplot to show the results. Spearman correlation analysis was performed between prognostic DECGs and immune cells.
Single-Cell RNA Sequencing (scRNA-Seq) Data Analysis
The scRNA-seq data of GBM was obtained from GSE84465 using Illumina NextSeq 500 GPL18573 platform, and then the data was filtered using the Seurat package CreateSeuratObject function, and the genes with expression data in at least 100 cells and the cells with more than 100 detected genes were retained (min.cells =100, min.features = 100), because it might be cellular fragmentation if the count of cells and features were too low. The PercentageFeatureSet function was used to retain cells with a mitochondrial gene ratio of less than 10% and an erythrocyte gene ratio of 0, because high expression levels of mitochondrial genes and erythrocyte genes may be indicative of poor sample quality, resulting in large numbers of apoptotic, lysed or contaminated cells. NormalizeData was used to standardize the scRNA-seq data, and the FindVariableFeatures function was used to identify highly variable genes. The default parameter, namely “vst” method, was used to select 2000 highly variable genes. Next, ScaleData was used to normalize the scRNA-seq data, and then principal component analysis (PCA) was performed. JackStraw and ScoreJackStraw were used for the linear dimension reduction. Additionally, we used the JackStrawPlot function to compare the distribution of p-values for each principal component. Combined with JackStraw function, the significance p-value of the top 30 principal components ranked by variance percentage of principal components were calculated, and the principal components whose p-value was less than 0.05 were selected. Unsupervised cluster analysis was carried out on 3586 cells by using FindNeighbors and FindClusters functions of Seurat package, and the resolution was determined. The UMAP and t-SNE algorithms were applied to visualize clustering. We then used FindAllMarkers and set the following parameters: min.pct = 0.2, only.pos = TRUE, logfc.threshold = 0.1, and performed the Wilcoxon test for differential analysis to identify the differential marker genes of various groups. The marker genes of each cluster were aligned with each cell type in the CellMarker database to annotate the GBM cell types. In addition, the SingleR algorithm was used to verify the identified cell types. The expression of prognostic DECGs in each cell subgroup was shown by UMAP, followed by pseudotime analysis of different cells and prognostic DECGs using a single-cell model. FindAllMarkers function was used to identify differential genes between cell subsets as characteristic genes for pseudotime developmental trajectories in different cell subpopulations. Furthermore, the plot_genes_in_pseudotime functions were used to view the dynamic expressions of prognostic DECGs along the pseudotime differentiation trajectory of all cells based on the sorting pseudotime values of each cell.
Construction of a Transcription Factors (TFs)-mRNA Network
NetworkAnalyst (https://www.networkanalyst.ca/) is a powerful web-based visual analytics platform for comprehensive analysis, including the prediction of TFs.17 Specifically, it utilized ChEA to predict TF-target interactions. In ChEA, TF-target gene set libraries are assembled by integrating ChIP-seq experiments from ENCODE, ReMap and individual publications. And site-specific DNA-binding TFs are included, while non-specific transcription factors, cofactors, and chromatin modifiers are excluded in ChEA. When uploading the query gene lists, those genes are compared to ChEA libraries of TF-target gene sets. Then Fisher’s Exact Test with a background size of 20,000 is used to compare the input gene sets to the TF-target gene sets to determine which TFs are most closely associated with the input gene lists.18 The above-mentioned integrating TF targets information from across libraries and associated TF rankings may improve the predictive performance. In the current study, the TFs of prognostic related DECGs were predicted through Network Analyst, and then the TFs obtained from the database were intersected with the DEGs to obtain the differentially expressed TFs. The expressions of differentially expressed TFs in GBM and normal samples were analyzed. A TF-prognostic-related DECGs network was constructed using Cytoscape. The expression of key differentially expressed TFs in each cell subgroup was displayed using a dot plot, followed by pseudotime analysis, which in GSE84465 was conducted as above to gain insights into the temporal regulation of these TFs.
Reverse Transcription-Polymerase Chain Reaction (RT-PCR)
Five normal human brain tissues and seven brain tissues from GBM patients were collected from Tongji Hospital. Total RNA was isolated using the TRIzol reagent (Ambion) according to the manufacturer’s instructions. Then, the total RNA was used for cDNA synthesis by the SureScript First strand cDNA synthesis kit according to the instructions (Servicebio). Primers were synthesized by Tsingke Biotechnology Co., Ltd. Primers used are listed in Supplementary Table 1. Next, qRT-PCR was carried out using the BIO-RAD RT-PCR system. Results were normalized to the GAPDH expression and calculated based on the 2−∆∆Ct method. For each sample, the experiments were repeated three times. To avoid variability caused by operations, all experiments were performed in strict accordance with standard experimental practice by the same person. All experiments have been approved by the ethical committee of Tongji Hospital affiliated with Tongji University (Shanghai, China), and individuals involved have signed the consent forms for the use of their tissues in the study.
Statistical Analysis
Statistical analysis and visualization were performed using R (version 3.6.3) and Graphpad Prism 9 software (version 9.4.1). Wilcoxon test was employed to compare the difference of CIC score between GBM and control group, immune cell infiltration between low and high risk group and the expressions of TFs between GBM and control group. Log rank test was performed to compare the difference of overall survival between two groups. Student’s t-test was applied to compare the expression difference of prognostic genes between GBM and control samples. A p-value <0.05 was considered as statistically significant unless specified.
Results
CIC Score Was Associated with the Prognosis of GBM Patients
In the TCGA-GBM dataset, the CIC score of each sample was calculated using ssGSEA, and the CIC score of GBM samples was found to be significantly lower than that of normal samples (Figure 2A), indicating the importance of CIC in GBM development. Furthermore, according to the CIC score, GBM patients were divided into CIChigh and CIClow groups, and the K-M analysis showed that the survival probability of the CIChigh group decreased significantly (Figure 2B), further supporting the role of CIC in GBM prognosis.
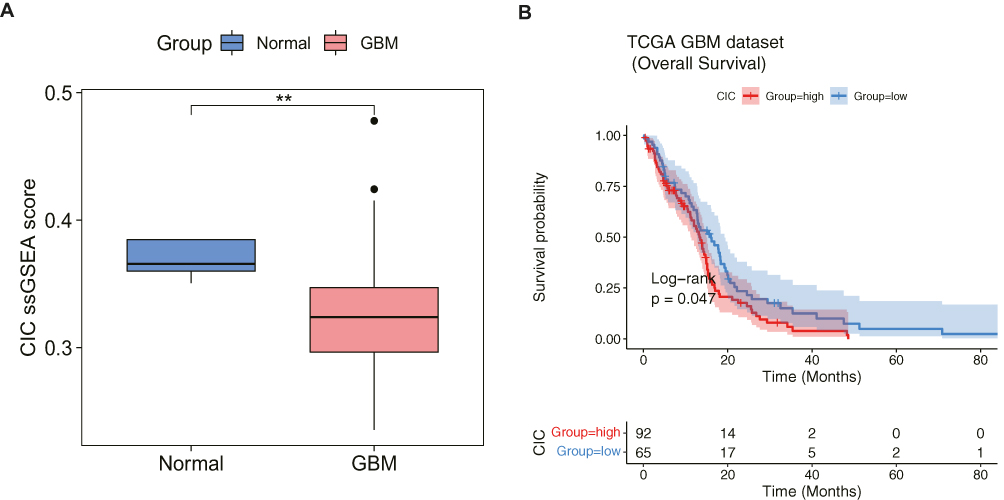 |
Figure 2 Cell-in-cell (CIC) genes were involved in glioblastoma (GBM). (A) Comparison of CIC score between normal and GBM group based on the expressions of CIC genes by single-sample gene set enrichment analysis (ssGSEA) algorithm. **p-value <0.01. (B) Kaplan-Meier curves of overall survival (OS) in CIChigh and CIClow score group from TCGA-GBM cohort. Log rank test was performed to detect the OS difference between two groups. |
DECGs Were Identified Between GBM and Normal Samples
In the TCGA-GBM dataset, through differential analysis, we identified 325 DEGs between the CIChigh and CIClow groups as CIC-related genes in GBM patients, of which 129 genes were upregulated and 196 genes were downregulated in the CIChigh group (Figure 3A). The expression of the top 50 CIC-related genes in the CIChigh and CIClow groups is presented in a heatmap (Figure 3B). Meanwhile, 5593 DEGs between GBM and normal samples were obtained, of which 2686 genes were upregulated and 2907 genes were downregulated in GBM samples (Figure 3C), indicating that those genes may be involved in the development of GBM. We also displayed the expression of the top 50 DEGs in the GBM and normal samples (Figure 3D). By overlapping those DEGs, a total of 136 DECGs were identified (Figure 3E) for subsequent analysis.
 |
Figure 3 Identification of 136 differentially expressed cell-in-cell (CIC) genes (DECGs). (A) Volcano plot of differentially expressed genes (DEGs) between CIChigh and CIClow score groups. The red and blue dots represent genes significantly up-regulated and down-regulated genes in CIChigh group, respectively. (B) Heatmap showing the expressions of top 50 DEGs between CIChigh and CIClow groups. Rows indicate genes with significant expression differences between two groups, and columns represent individual samples from two groups. High expression in CIChigh group is indicated in red color, and low expression is indicated in blue. (C) Volcano plot of DEGs between normal and glioblastoma (GBM) groups. The red and blue dots represent genes significantly up-regulated and down-regulated genes in GBM group, respectively. (D) Heatmap showing the expressions of top 50 DEGs in the normal and GBM groups. Rows indicate genes with significant expression differences between two groups, and columns represent individual samples from two groups. High expression in GBM group is indicated in red color, and low expression is indicated in blue. (E) Venn plot showing 136 overlapping genes of DEGs between GBM and controls and DEGs between CIChigh and CIClow groups. |
DECGs Were Mainly Involved in Immune and Inflammation and ECM
Next, we investigated the function of DECGs. Interestingly, these DECGs were found to mainly participate in GO terms related to ECM, such as ECM organization, regulation of membrane potential, collagen-containing ECM, receptor ligand activity, and signaling receptor activator activity (Figure 4A). In addition, DECGs were significantly enriched in cytokine-cytokine receptor interactions, leukocyte transendothelial migration, protein digestion and absorption, glycosaminoglycan biosynthesis-heparan sulfate/ heparin and various of N-glycan biosynthesis (Figure 4B). These results indicate that ECM, inflammation and glycan biosynthesis may be involved in CIC-mediated progression of GBM.
 |
Figure 4 Functional analysis of differentially expressed cell-in-cell genes (DECGs). (A) Gene ontology (GO) enrichment of DECGs. CC: cellular component; BP: biological process; MF: molecular function. (B) Kyoto encyclopedia of Genes and Genomes (KEGG) pathway enrichment of DECGs. The y-axis indicates the name of GO terms and KEGG pathways, and the x-axis indicates the gene counts enriched in the GO terms and KEGG pathways. The color bar indicates the p-value, the blue represents higher value, the red represents lower value. |
The CIC-Related Prognostic Model for GBM Patients Was Built and Validated
Thereafter, the value of DECGs in GBM prognosis was explored using TCGA-GBM dataset. First, 136 DECGs were screened using univariate Cox regression analysis, and 14 survival-related genes were identified (p < 0.05) (Figure 5A), including LOXL1, PTX3, TIMP1, IGFBP2, SLC47A2, PHLDA2, SNCAIP, POSTN, SLC22A18, ARSJ, RAB34, COL5A1, LGALS3, and CHST9. Among these, SNCAIP and CHST9 were protective factors, whereas the other genes were risk factors. LASSO regression analysis of 14 survival-related genes showed that the prognostic model was obtained when the lambda min was 0.01385, and seven prognosis-related DECGs of GBM were screened, including PTX3, TIMP1, IGFBP2, SLC47A2, SNCAIP, LGALS3, and LOXL1 (Figure 5B, C and Table 1). According to the median risk score value of 0.98 (Supplementary Table 2), GBM patients were divided into high-risk and low-risk groups, and the risk curve showed that GBM patients in the high-risk group had a worse survival (Figure 5D), and seven prognostic-related DECGs were highly expressed in the high-risk group (Supplementary Figure 1A). The OS curve of patients with GBM showed that the survival probability of patients in the high-risk group decreased significantly (p-value = 0.0012) (Figure 5E). Moreover, the AUC of the ROC curves for predicting the 1–5 year survival of GBM patients was greater than 0.65, indicating that the prediction efficiency of the risk model was good (Figure 5F). To validate the model, we used a different cohort from the CGGA-GBM and performed the same analyses. In addition, patients with GBM were divided into high- and low-risk groups, according to a median risk score of 0.057 (Supplementary Table 3). The results of the risk (Figure 5G) and OS curves (Figure 5H) also showed that the survival of patients in the high-risk group was worse (p-value = 0.024), and various prognostic related DECGs were highly expressed in the high-risk group (Supplementary Figure 1B). Moreover, the AUC of ROC curves in predicting 1–5 year survival of GBM patients were all greater than 0.6 (Figure 5I). These results were consistent with those of the training cohort, suggesting the reliability of the model.
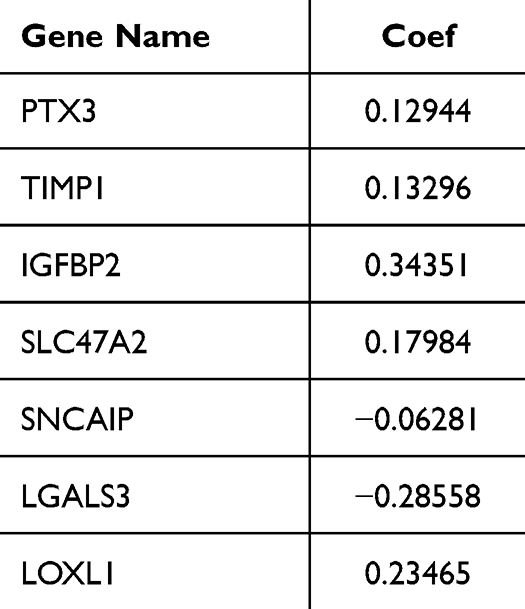 |
Table 1 The Coefficient of Each Prognostic Gene Signature in LASSO |
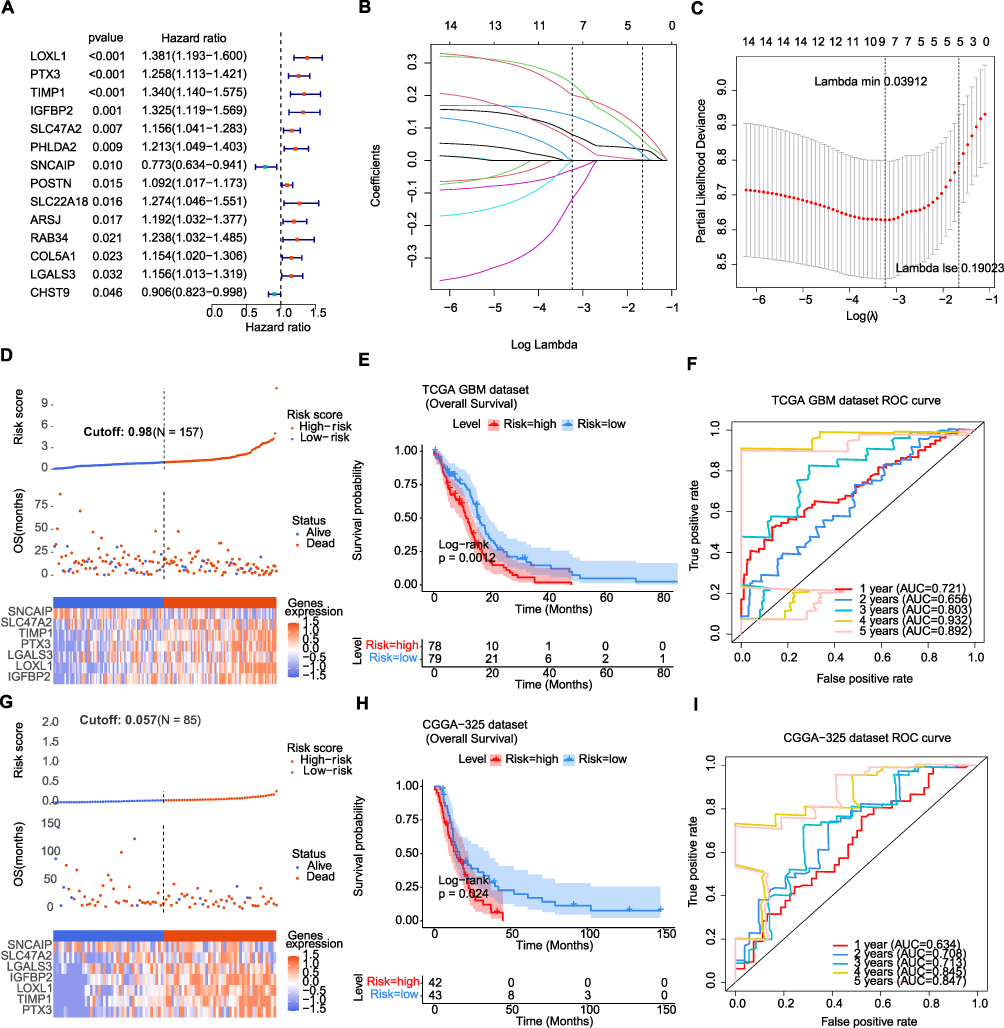 |
Figure 5 The cell-in-cell (CIC) related risk model was constructed and validated. (A) Forest plot showing the univariate Cox regression analysis of differentially expressed cell-in-cell genes (DECGs) associated with overall survival. Hazard ratios were estimated in a Cox proportional hazards regression model. (B) LASSO coefficient profiles of prognosis-related genes. Each curve represents a coefficient, and the x-axis represents the regularization penalty parameter. As lambda (λ) changes, a coefficient that becomes non-zero enters the LASSO regression model. (C) Cross-validation to select the optimal tuning parameter lambda in the LASSO model used 10-fold cross validation. The partial likelihood deviance curve was plotted versus log (λ). Dotted vertical lines were drawn at the optimal values using the minimum criteria and the l standard error (1se) of the minimum criteria. (D) The distribution of risk score and survival status and the expressions of prognostic CIC genes in the glioblastoma (GBM) cohort from The Cancer Genome Atlas (TCGA). (E) Kaplan-Meier curves showing the overall survival (OS) of low and high risk group from TCGA-GBM cohort. Log rank test was applied to compare the OS difference between two groups. (F) The 1-, 2-, 3-, 4- and 5-year receiver operating characteristic (ROC) curves of the risk model in TCGA-GBM cohort. AUC: area under the ROC curve. (G) The distribution of risk score and survival status and the expressions of prognostic CIC genes in GBM cohort from Chinese Glioma Genome Atlas (CGGA). (H) Kaplan-Meier curves showing the overall survival (OS) of low and high risk group from CGGA-GBM cohort. Log rank test was applied to compare the OS difference between two groups. (I) The 1-, 2-, 3-, 4- and 5-year ROC curves of the risk model in CGGA-GBM cohort. Abbreviation: AUC, area under the ROC curve. |
CIC-Related Risk Score Was an Independent Risk Factor for GBM Patients
To investigate the independent factors in GBM prognosis, we first included the CIC-related risk score and clinical features, such as age, sex, IDH status, MGMT status, and Chr19/20, of the TCGA-GBM cohort in the univariate Cox analysis. The results showed that the risk score, age, IDH status, and MGMT status were key factors affecting the prognosis of patients with GBM (p-value < 0.05) (Table 2). Furthermore, multivariate Cox independent prognostic analysis revealed that the risk score, age, and MGMT were independent prognostic factors of GBM patients with GBM (p-value < 0.05) (Table 3). Similarly, in the validation set CGGA-GBM, the risk score and clinical features of GBM patients were included in the univariate Cox analysis, and it was found that the risk score and age were key factors affecting the prognosis of GBM patients (p-value < 0.05) (Supplementary Table 4). Multivariate Cox analysis of the risk score and age of GBM patients showed that the risk score was an independent prognostic factor for GBM patients (p-value <0.05) (Supplementary Table 5). Thereafter, in the TCGA-GBM dataset, a nomogram with a C-index value of 0.6708 was established based on the risk score and age of GBM patients, indicating that the nomogram model was effective in predicting the 1–3 to year survival probability of GBM patients (Figure 6A). The calibration curves showed that the nomogram had high prediction accuracy for the 1–3 to year survival probability of patients with GBM, indicating that the nomogram we constructed can be used as an effective model (Figure 6B). In addition, CGGA-GBM database was applied to test the performance of nomogram (Supplementary Figure 2A), and we found that the nomogram also had high accuracy in predicting OS as evidenced by calibration curves (Figure 2B).
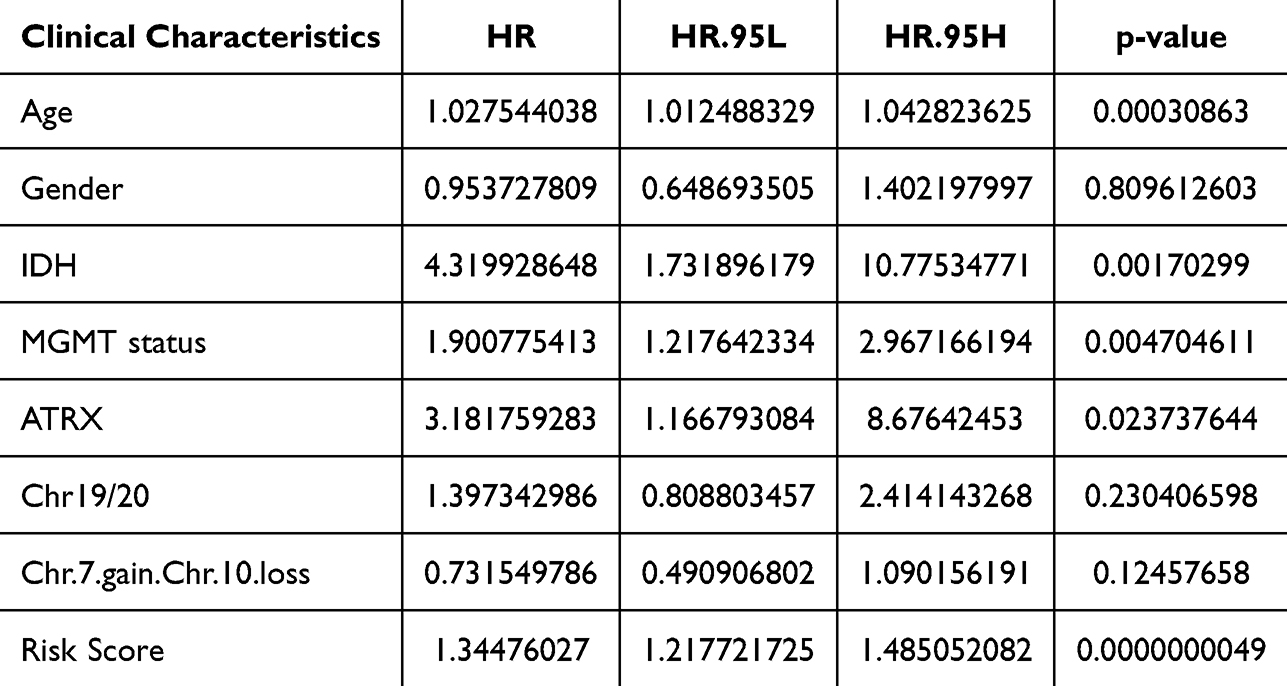 |
Table 2 Univariate Cox Regression Analyses on Risk Score and Clinical Parameters in TCGA-GBM Cohort |
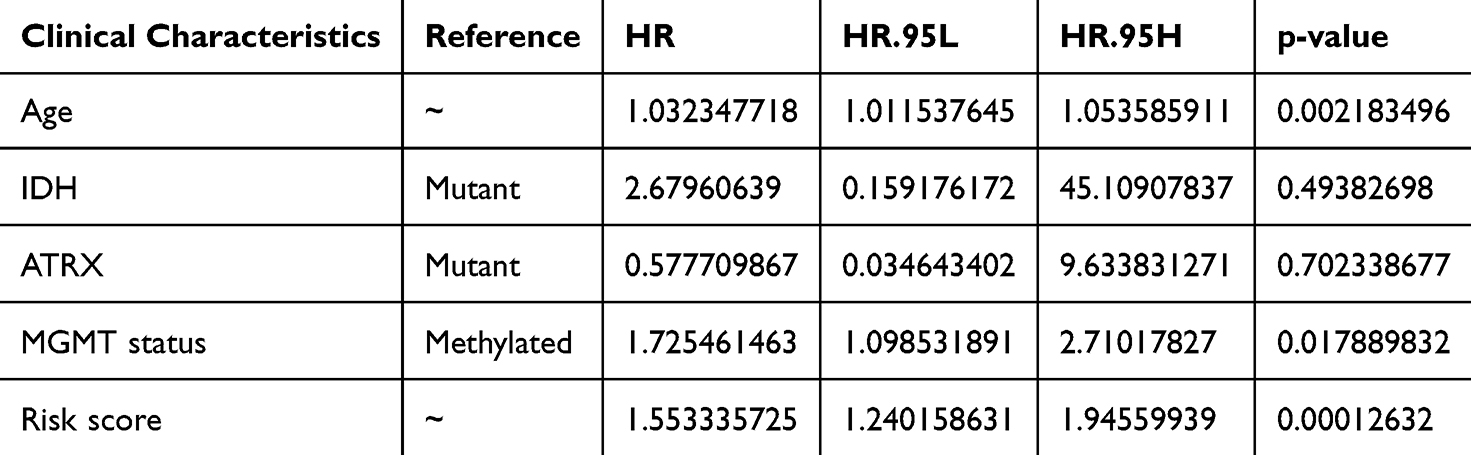 |
Table 3 Multivariate Cox Regression Analyses on Risk Score and Clinical Parameters in TCGA-GBM Cohort |
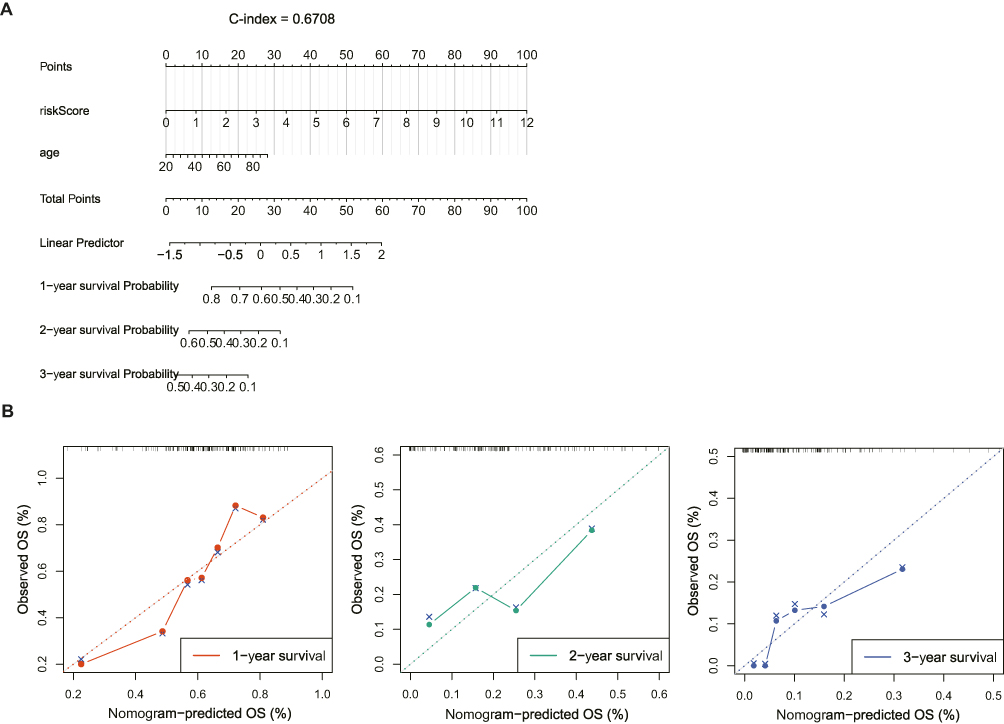 |
Figure 6 The cell-in-cell (CIC) related risk score were an independent prognostic factor in GBM. (A) Construction of the nomogram based on risk score and age using TCGA-GBM dataset. (B) Calibration curves of the nomogram for predicting 1-, 2-, 3-year overall survival (OS) using TCGA-GBM database. |
Immune and Inflammation-Related Pathways Were Enriched in High Risk Group Samples
To further investigate how DECGs regulate GBM prognosis, we performed GSEA in the TCGA-GBM cohort using reference gene sets of hallmarks and KEGG pathways. The top 10 hallmarks, including allograft rejection, IL2/STAT5 signaling, coagulation, complement, hypoxia, epithelial mesenchymal transition, inflammatory response, IL6/JAK/STAT3 signaling, TNF-alpha signaling via NFκB, and KRAS signaling, were significantly enriched in the high-risk groups (Figure 7A). The top 10 KEGG pathways, including complement and coagulation cascades, Staphylococcus aureus infection, focal adhesion, rheumatoid arthritis, hematopoietic cell lineage, cytokine-cytokine receptor interaction, IL-17 signaling pathway, viral protein interaction with cytokine and cytokine receptor, TNF signaling pathway, and tuberculosis, were also significantly enriched in the high-risk group (Figure 7B). These hallmarks and KEGG pathways have direct and/or indirect relationships with immunity and inflammation, which may contribute to the significant differences in survival between the two risk groups.
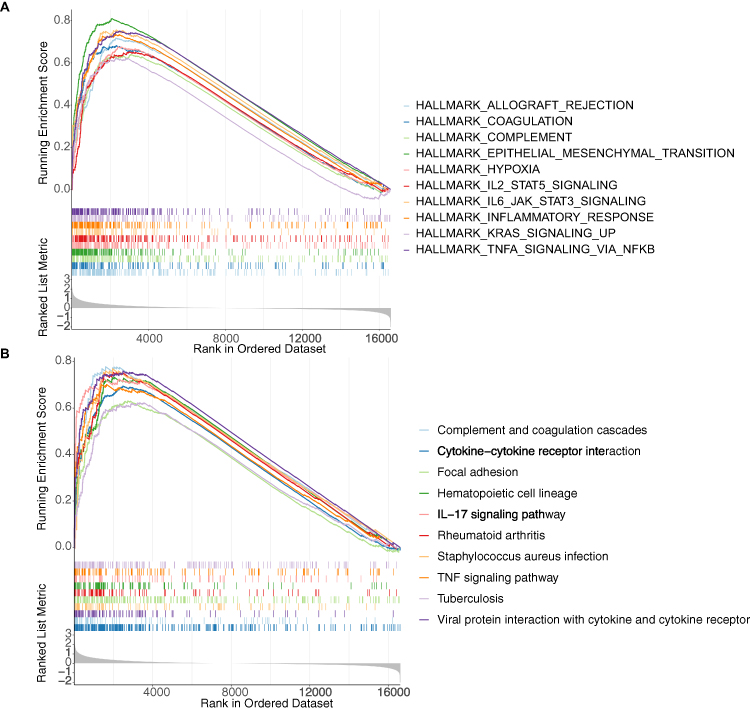 |
Figure 7 Gene set enrichment analysis. Top 10 hallmarks (A) and Kyoto encyclopedia of Genes and Genomes (KEGG) pathways (B) enriched in the high-risk group. Each short vertical line represents a gene. |
Prognostic DECGs May Be Potential Regulators of the Tumor Microenvironment
Given the above results, we wondered whether prognostic DECGs would affect the tumor microenvironment of GBM TME. In the TCGA-GBM dataset, immune cell infiltration analysis revealed four immune cells with significant differences between the high- and low-risk groups, namely DC, Th1 cells, T cells, and neutrophils (Figure 8A). Furthermore, correlation analysis showed that IGFBP2 was positively correlated with mast cells, LGALS3 was negatively correlated with NK CD56bright cells, LOXL1 was positively correlated with Th1 cells and DCs, PTX3 and TIMP1 were positively correlated with iDCs and DCs, SLC47A2 was negatively correlated with iDCs and macrophages, and SNCAIP was negatively correlated with iDCs and Th2 cells (|Cor| > 0.1 and p-value < 0.05) (Figure 8B-8H).
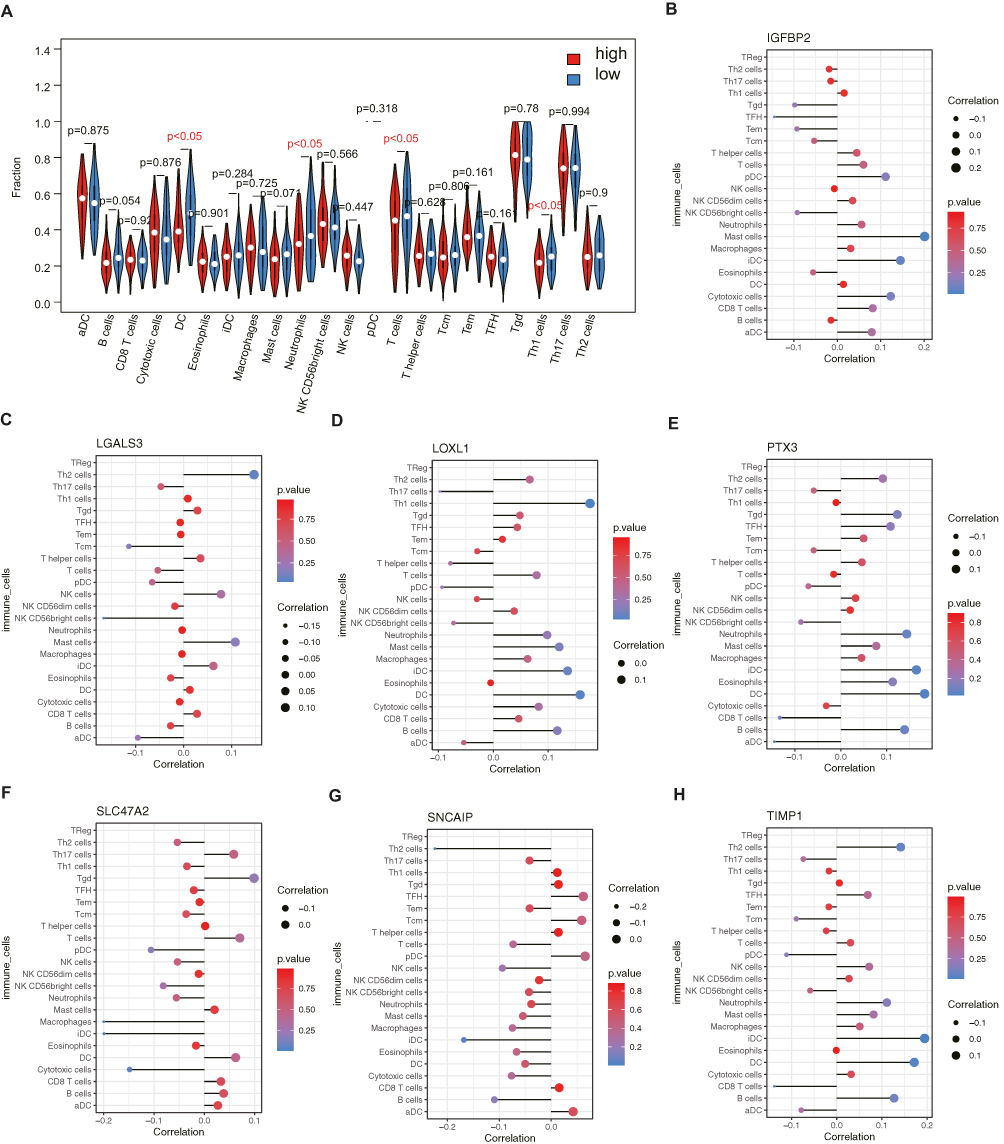 |
Figure 8 Prognostic CIC genes had close relationship with immune microenvironment. (A) The fractions of immune cells in each sample were calculated by single-sample gene set enrichment analysis (ssGSEA). The difference of immune infiltration between two groups were detected by rank sum test. (B-H) Spearman correlation analysis of insulin like growth factor binding protein 2 (IGFBP2), galectin 3 (LGALS3), lysyl oxidase like 1 (LOXL1), pentraxin 3 (PTX3), solute carrier family 47 member 2 (SLC47A2), synuclein alpha interacting protein (SNCAIP), TIMP metallopeptidase inhibitor 1 (TIMP1) with immune cells. |
Prognostic DECGs Were Expressed in Neurons and Myeloids
In the GSE84465 dataset, the quality control was performed as shown in Figure 9A. After normalizing the scRNA-seq data, 2000 highly variable genes were identified (Figure 9B). After PCA, the top 30 principal components were selected for subsequent analysis (p-value < 0.05) (Figure 9C). Unsupervised clustering analysis revealed that the best clustering was achieved at a resolution of 0.06, and the cells were divided into seven clusters (Figure 9D, Supplementary Figure 3). After annotation, these seven cell clusters were identified as myeloid cells, neurons, oligodendrocyte precursor cells (OPCs), NKT (Natural Killer T) cells, neoplastic cells, oligodendrocytes, and astrocytes (Figure 9E). Myeloid cells accounted for the highest proportion of cells, followed by neurons (Figure 9F). We also identified feature genes for myeloid cells (C1QA, C1QB, TYROBP, LAPTM5), neurons (CSRP2, PLS3), OPCs (SOX8, SOX10, OLIG2, LPPR1), neoplastic cells (KCNE1L, IL13RA2, HES1, and SOX11), NKT cells (OS9, TMBIM4, TSPAN31, LLPH), oligodendrocytes (MOG, ERMN, CNTN2, C11orf9, ENPP2, SH3GL3), and astrocytes (PPP1R1B, AGXT2L1, RANBP3L, GABRA2) (Figure 9G and Table 4).
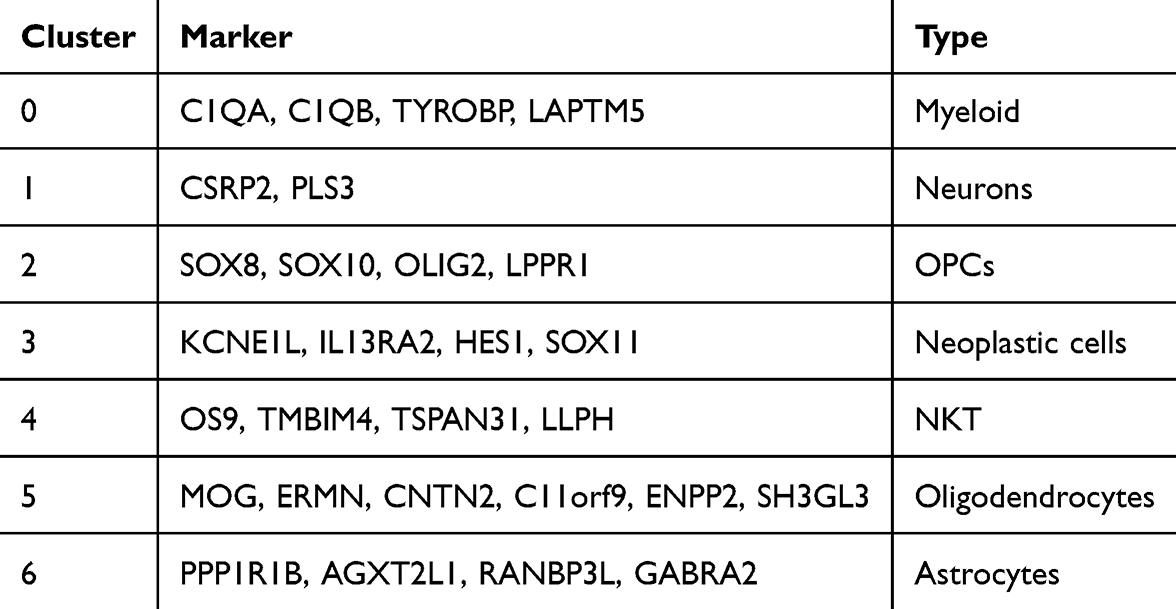 |
Table 4 Cell Type and Its Marker |
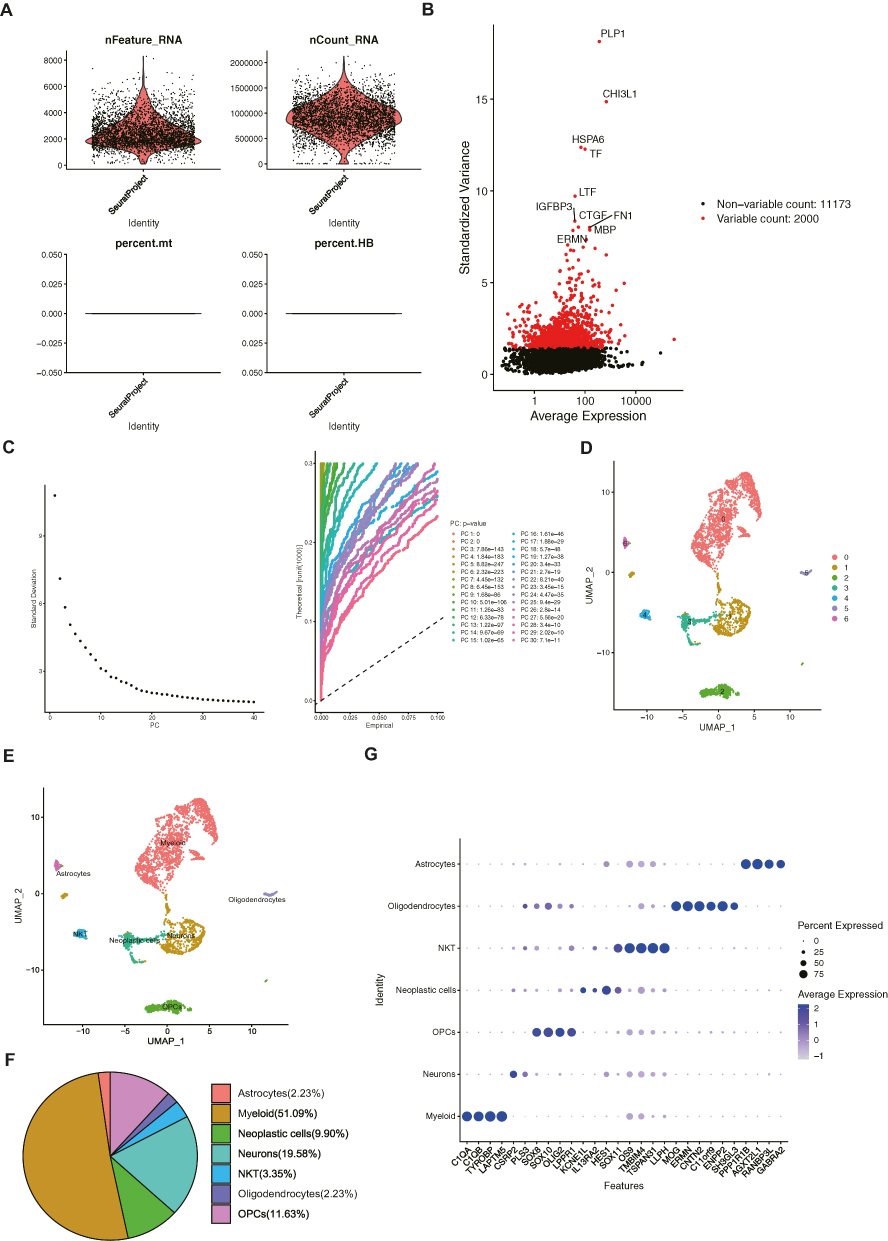 |
Figure 9 Glioblastoma (GBM) tissues were divided into seven cellular types at the single-cell level. (A) Quality control of single-cell sequencing (sc-seq) data. (B) The expression profile of all genes in the GBM samples in the characteristic variance graph. The top 10 variable genes, including PLP1 (proteolipid protein 1), CHI3L1 (chitinase 3 like 1), HSPA6 (heat shock protein family A member 6), TF (transferrin), IGFBP3 (insulin like growth factor binding protein 3), LTF (lactotransferrin), CTGF (cellular communication network factor 2), FN1 (fibronectin 1), MBP (myelin basic protein) and ERMN (ermin), were listed in the scatter plot. (C) The elbow plot visualizes the standard deviation of each principal component (PC), and the top 30 PCs were exhibited with p value. (D) The cellular distribution in GBM visualized in uniform manifold approximation and projection (UMAP). (E) Seven cell types were annotated and labeled in UMAP. (F) Proportions of identified cell types in GBM. (G) Feature genes in each cell type. |
Next, we found that prognosis-related DECGs were mainly expressed in myeloid cells (TIMP1 and LGALS3) and neurons (TIMP1, PTX3, IGFBP2, SLC47A2, SNCAIP, LGALS3, and LOXL1) (Figure 10A). Based on the pseudotime developmental trajectories of the identified cell subpopulations (Supplementary Figure 4), it was shown that with the development of cell differentiation, LGALS3 and TIMP1 continued to be expressed in the cells, whereas the expression of other prognostic-related DECGs gradually decreased (Figure 10B).
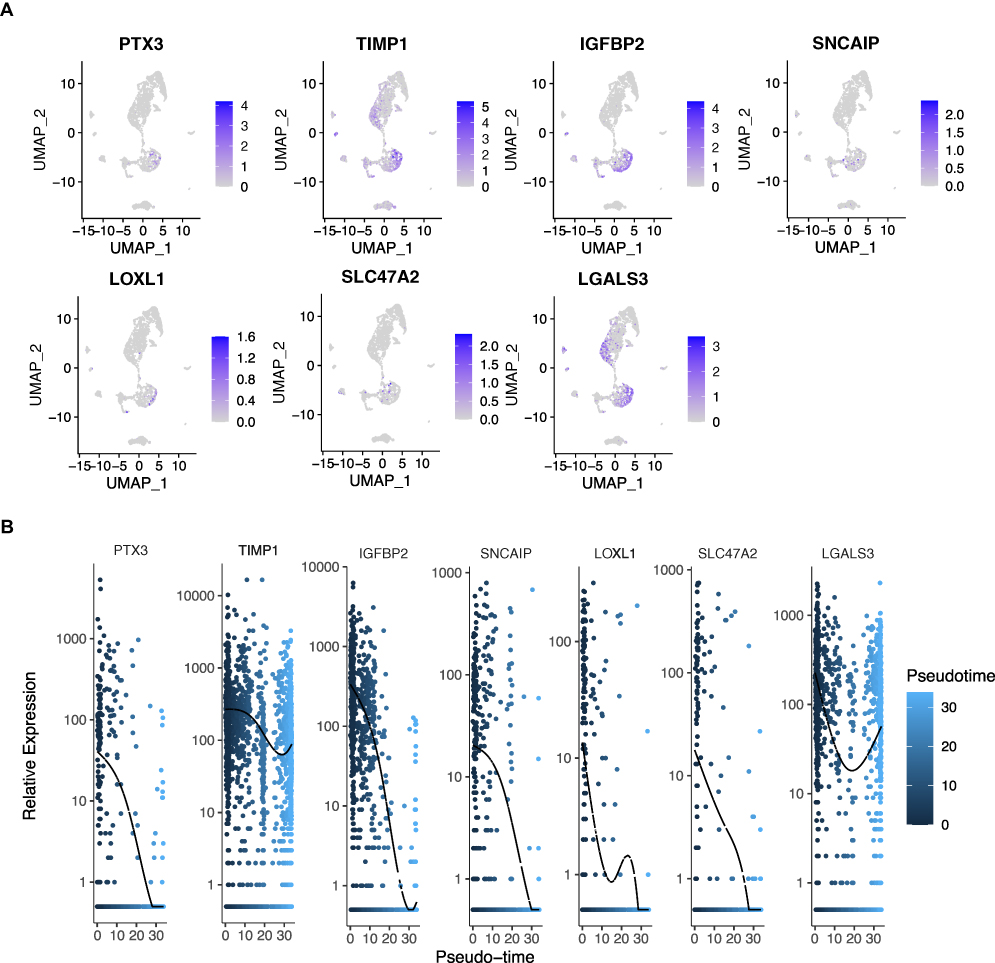 |
Figure 10 Analysis of prognostic cell-in-cell (CIC) genes in glioblastoma (GBM) single-cell sequencing data. (A) The expressions of prognostic CIC genes across cell types within GBM tissues. The blue bar indicates the abundance of prognostic CIC genes in cells. (B) The dynamic expressions of prognostic CIC genes along the pseudotime differentiation trajectory of GBM cells. The x-axis represents the pseudotime values, and the y-axis represents the gene expression levels. Abbreviations: PTX3, pentraxin 3; TIMP1, TIMP metallopeptidase inhibitor 1; IGFBP2, insulin like growth factor binding protein 2; SNCAIP, synuclein alpha interacting protein; LOXL1, lysyl oxidase like 1; SLC47A2, solute carrier family 47 member 2; LGALS3, galectin 3. |
A TFs-mRNA Network Based on Prognostic Related DECGs Was Constructed
We predicted 44 TFs from the Network Analyst database that targeted the expression of prognostic-related DECGs. Then, 44 TFs were intersected with DEGs to obtain 9 differentially expressed TFs (Figure 11A). The box plot for TFs expression in TCGA-GBM and CGGA-GBM cohorts is shown in Figure 11B, where the upregulation of EZH2, SMAD5, and TFDP1, and the downregulation of ZNF382, INSM2, and BCL11A was observed in both cohorts. Furthermore, a TF-mRNA network containing nine TFs and five prognostic-related DECGs was constructed (Figure 11C). In the network, we identified 11 TF gene regulatory pairs, including TFDP1-PTX3, GLIS2-SLC47A2, TBX21/EZH2-IGFBP2, ZNF501/SMAD5/GLIS2-TIMP1, and ZNF501/INSM2/BCL11A/ZNF382-LOX1. Furthermore, for scRNA-seq analysis, key TFs were mainly expressed in NKT (SMAD5, EZH2, and TFDP1), neoplastic cells (SMAD5, EZH2, and TFDP1), and neurons (SMAD5) (Figure 11D). Pseudotime analysis indicated that with the development of cell differentiation, the expression level of SMAD5 exhibited a fluctuating pattern, initially decreasing, followed by a sharp increase and subsequent decrease. The expression of other TFs was upregulated in these cells (Figure 11E). However, ChIP-qPCR using specific primers in future are needed to validate those TF-target interactions.
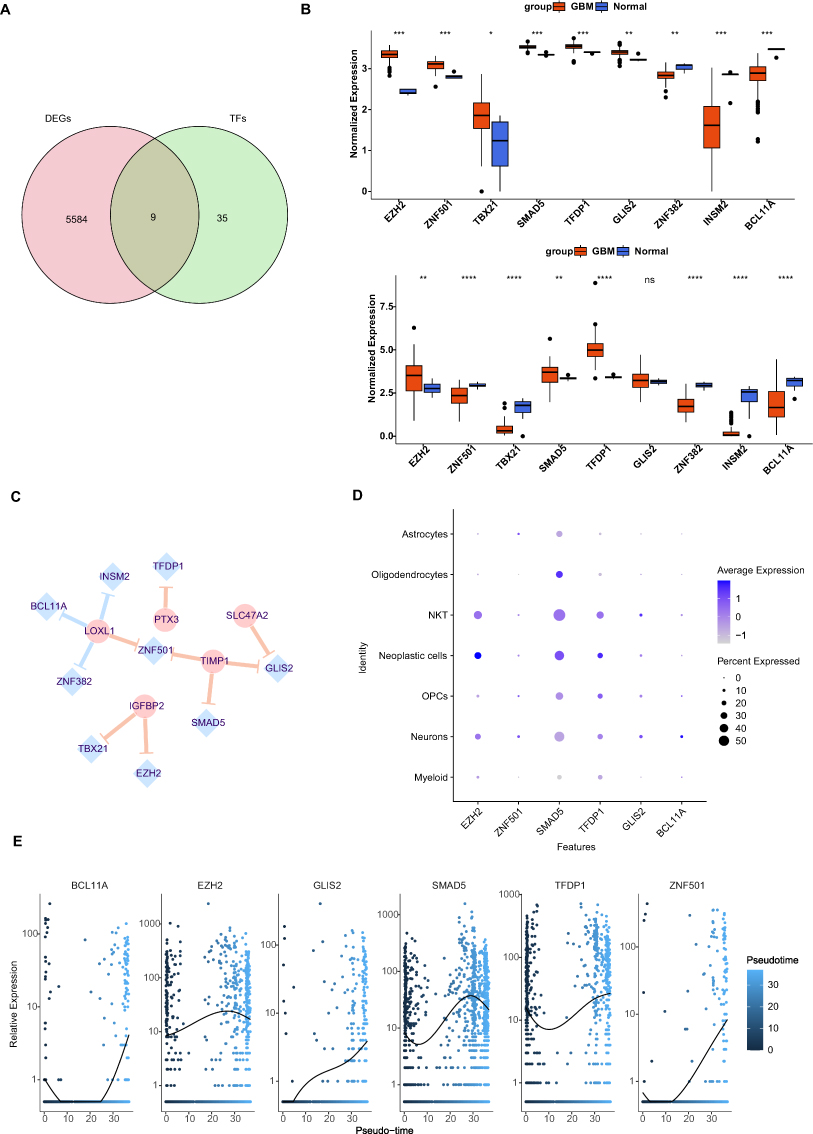 |
Figure 11 The transcription factor (TF)-prognostic cell-in-cell (CIC) genes network. (A) Venn plot showing the nine overlapping TFs involved in glioblastoma (GBM). (B) The expressions of TFs in GBM cohorts from The Cancer Genome Atlas (TCGA) and Chinese Glioma Genome Atlas (CGGA). *p-value <0.05, **p-value <0.01, ***p-value <0.001, ****p-value <0.0001, nsp-value >0.05. (C) The TFs targets binding to prognostic related differentially expressed cell-in-cell genes (DECGs) was predicted, where yellow line represents positive regulation, and blue line represents negative regulation. (D) The expressions of TFs in identified cell types. (E) The dynamic expressions of key TFs along the pseudotime differentiation trajectory of GBM cells. Abbreviations: EZH2, enhancer of zeste 2 polycomb repressive complex 2 subunit; ZNF501, zinc finger protein 501; TBX21, T-box transcription factor 21; SMAD5, SMAD family member 5; TFDP1, transcription factor Dp-1; GLIS2, GLIS family zinc finger 2; INSM2, INSM transcriptional repressor 2; BCL11A, BCL11 transcription factor A; PTX3, pentraxin 3; TIMP1, TIMP metallopeptidase inhibitor 1; IGFBP2, insulin like growth factor binding protein 2; LOXL1, lysyl oxidase like 1; SLC47A2, solute carrier family 47 member 2. |
Five Prognostic Related DECGs Were Validated in Clinical Samples
Finally, we validated the expression of prognostic-related DECGs in the clinical samples using qPCR. We found that the expression levels of PTX3, TIMP1, IGFBP2, SNCAIP, and LOXL1 were significantly higher in GBM samples, which was consistent with the sequencing results from the TCGA-GBM dataset (p<0.05) (Figure 12A–E). In contrast, the abundance of SLC47A2 was remarkably lower in GBM samples (Figure 12F), and no significant difference in LGALS3 expression was detected between control and GBM samples (Figure 12G).
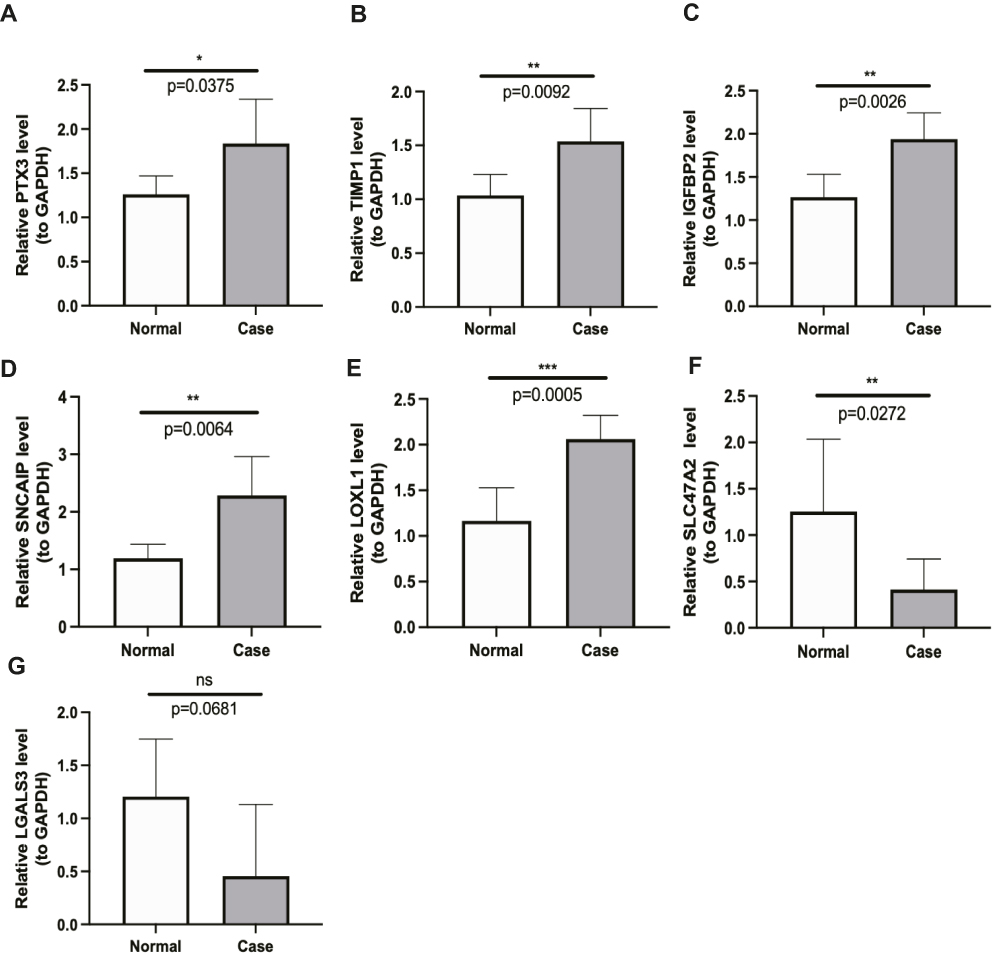 |
Figure 12 The verifying of the prognostic CIC genes using qPCR validation. The expressions of pentraxin (PTX3) (A), TIMP metallopeptidase inhibitor 1 (TIMP1) (B), insulin like growth factor binding protein 2 (IGFBP2) (C), synuclein alpha interacting protein (SNCAIP) (D), lysyl oxidase like 1 (LOXL1) (E), solute carrier family 47 member 2 (SLC47A2) (F) and galectin 3 (LGALS3) (G) estimated by unpaired t-test. Data was presented as mean ± SD (Normal = 5, Case = 6). *p-value <0.05, **p-value <0.01, ***p-value <0.001, nsp-value >0.05. |
Discussion
So far, multi-omics data and bioinformatics methods have helped us a lot to study the underlying mechanisms of a variety of cancers. Tran et al utilized data from RNA, protein and DNA methylation and found that lower expression of ALDH2 and corresponding deficit of stemness signalings were associated with prognosis of lung adenocarcinoma (LUAD).19 Dang et al employed multiple databases and bioinformatic methods and unveiled the important role of GPSM2 and GPSM3 in breast cancer.20 Xu et al used transcriptome data and identified prognostic ferroptosis related genes associated with immune microenvironment in breast cancer patients.21 Through reviewing multi-omics technologies including genomics, transcriptomics, epigenomics, proteomics, and metabolomics, analyses of brain tumor-related epilepsy (BTRE), Du et al presented biomarkers associated with BTRE, such as D2H2, FOXO4 and SV2A.22 Utilizing of multi-omics data also contributes to better understanding the pathogenesis and therapies of GBM. For example, Yoshimura et al successfully created a prognostic model that could reduce cost and time for image scanning for GBM using radiomics.23 Another study analyzed genome-wide DNA methylation of GBM and disclosed critical role of aberrant lncRNA methylation in the regulation of autophagy.24 Migliozzi et al integrated transcriptome, genome, proteome, metabolome data, and identified biomarkers and potential therapeutic targets for GBM subtypes.25 Those multiomics and bioinformatic studies provide fundamental information and further guidance for in vivo, in vitro and clinical trials.
In the current study, we utilized transcriptome data and multiple bioinformatic methods to study the role of CIC-related genes in GBM. The ssGSEA is an extension of GSEA method,15 compared with other gene set enrichment methods, ssGSEA works at the level of a single sample rather than a sample population.16 The score derived from ssGSEA reflects the degree to which the input gene signature is coordinately up- or downregulated within a sample. Thus, in the current study, based on the expression data of 101 existing CIC gene signatures, ssGSEA method was applied to quantify the CIC gene signature level in each sample. We found that the level of CIC gene signature is lower in GBM group and patients with lower CIC gene signature level had better, suggesting that CIC-related genes contribute to the outcome of GBM patients. Differential expression and functional analyses revealed that DECGs are mainly associated with ECM-related biological processes and pathways of inflammation and glycan biosynthesis. It has been reported that ECM has a close relationship with the response of GBM patients to immuno- and chemotherapy.26,27 Also, ECM remodeling could promote GBM progression via enhancing infiltration of GBM cells, and ECM proteins affect migration of T cells, phagocytosis and cell invasion in GBM.28–31 Besides, for cytokine-cytokine receptor interaction pathway, multiple cytokines in the tumor microenvironment participate in regulating tumor cell invasion, migration, metastasis and immune and inflammatory response via interacting with their receptors.32,33 For example, in GBM chemokine CCL2 recruits immunosuppressive Tregs, GAMs and MDSCs via its receptors CCR2 and CCR4, thus leading to impairment of the response of the effector T cells and further immune escape.34–38 Another chemokine IL6 can inhibit the function of T cells and promote autophagy and invasion in GBM via IL6R, which is expressed in GBM cells and GAMs.39–41 In addition, other chemokines, such as CCL5, CXCL12, TGF-beta, and CSF1, also play vital roles in GBM development and progression.41 For leukocyte transendothelial migration pathway, it is a process of interaction between leukocytes and endothelial cells and plays an important role in remodeling immune microenvironment and thus affecting the progression, therapeutic response and outcome of GBM.42–44 The importance of glycans and glycosylation in GBM has been highlighted in GBM in multiple studies. Pace et al reported that the interaction between glycan and lectin contribute to the immunosuppressive environment in GBM.45 Cheng et al found that inhibit N-glycosylation of SCAP suppressed the growth of GBM.46 Taken those studies together with our findings, it is hypothesized that CIC-related genes may regulate the development and progression via those biological processes and pathways.
To further screen for key CIC-related genes involved in GBM prognosis, we performed univariate and LASSO Cox regression analyses and identified seven CIC-related genes. Using these CIC-related genes, we established a risk model and nomogram, both of which showed good performance in predicting the survival of patients with GBM, further demonstrating the crucial role of these seven CIC-related genes in GBM. It has been reported that the expression of PTX3 was positively associated with tumor grade in GBM.47 Recent studies by different groups have revealed the importance of PTX3 in GBM. Wesley et al found that PTX3 over-expression in vivo increased angiogenesis, tumor growth and invasion via inflammatory signaling in GBM.48 Zhang et al reported that PTX3 could regulate the infiltration and polarization of macrophages in GBM.49 In addition, PTX3 over-expression contributed to the proliferation and migration of transformed dendritic cells in vitro and also increased transformed dendritic cells’ tumorigenicity in vivo in GBM.50 NFkappaB regulates GBM proliferation and growth by targeting the expression of TIMP1.51 In addition, bevacizumab (VEGF antibody), is administered with TOP1 inhibitor as a second line treatment for GBM patients, however, it was found that overexpression of TIMP1 reduced the efficacy of TOP1 inhibitor,52 suggesting that TIMP1 expression may be associated with the chemotherapeutic response of GBM patients. IGFBP2 al. reported that regulate the self-renewal, proliferation, and differentiation of neural stem cells, which leads to GBM.53 Chua et al reported that nuclear IGFBP2 affects the migration and invasion of GBM cells, possibly via EGFR/STAT3 signaling.54 Moreover, the knockdown of IGFBP2 impairs immunosuppression in GBM by affecting the abundance of T cells, B cells, and macrophages,55 suggesting its potential for immunotherapy in GBM patients. Two SNPs in LGALS3 are associated with an increased risk of GBM, and LGALS3 can protect U251 and T98G cells from ionizing radiation and temozolomide,56 which are used in the treatment of GBM. However, to the best of our knowledge, the functions of LOXL1, SLC47A2, and SNCAIP in GBM remain unclear. This study is the first to suggest prognostic value for GBM. Moreover, bioinformatic analysis of single-cell sequencing data of GBM revealed that these genes are important for cellular differentiation in the context of GBM heterogeneity. Furthermore, correlation analysis showed that the expressions of those prognostic genes were correlated with the infiltration of immune cells, such as DC, Th1 cells, Th2 cells, iDC and/ or macrophages, indicating that the aberrant expression of those genes might influence the immune microenvironment, and their interplay might have further effect on the outcome of GBM patients.
In addition, we predicted TFs targeting the expressions of prognostic genes and identified their distributions across different cell types within GBM tissues. The results of pseudotime analysis suggest that fluctuated expressions of BCL11A, EZH2, GLIS2, SMAD5, TFDP1 and ZNF501 may be important for GBM progression. BCL11A is an important player regulating differentiation, migration and function of neurons.57,58 EZH2 mediates cell growth, metastasis, stemness and immune invasion in GBM.59,60 Ke et al reported that GLIS2 might promote apoptosis of neurons,61 however, its role in GBM is unclear. SMAD5 has been shown to regulate migration and proliferation of GBM cells.62,63 TFDP1 is a key regulator of cell cycle,64 and may be involved in GBM via cell cycle pathway.65 By performing in vivo and in vitro experiments, Zheng et al found that ZNF501 promoted cell proliferation and tumor formation of GBM.66 However, to the best of knowledge, the predicted TF-prognostic gene regulatory network and their biological relevance in GBM remain unknown, thus needing further verifications.
Our study had some limitations. First, the CIC structure and subcellular location of the prognostic genes must be detected in GBM samples. Secondly, the exact molecular mechanisms by which SLC47A2, SNCAIP, and LOXL1 regulate GBM should be investigated in both in vitro and in vivo experiments. Third, the prognostic risk model and the difference of immune infiltration between different risk groups should be validated in the real world using a large sample size from different cohorts. In addition, we predicted nine TFs targeting the expressions of prognostic genes and compared their expressions between GBM and control samples using both TCGA and CGGA datasets. Although seven of them had similar expression patterns, there were two TFs exhibiting different expression patterns in TCGA and CGGA datasets. This may be caused by the imbalance of sample size of GBM and controls in two datasets. Thus, further qPCR validation on clinical samples is needed. Besides, how clinical factors, such as age, IDH status and MGMT status, interact with CIC score or risk model remain unclear. Clinical samples and traits are needed to be collected and recorded to investigate the effect of clinical factors on the expressions of CIC gene signatures or model gene signatures. Also, we identified cell types within GBM tissues and located the expressions of prognostic signature in those cell types. Those cell types and the location of prognostic signature need to be verified via multiplex immunofluorescence assays. Finally, the role of these genes in forming CIC in GBM, how they crosstalk with ECM, the immune microenvironment of GBM, and how they further affect the prognosis and therapeutic response of GBM patients needs to be explored by in vivo and in vitro experiments using gene editing and multi-omics technologies. In future studies, we will focus on these scientific questions to better understand the role of CIC in GBM progression.
Conclusion
To the best of our knowledge, this was the first study on exploring the prognostic potential of CIC-related genes in GBM. We have identified PTX3, TIMP1, IGFBP2, SNCAIP, and LOXL1 as key CIC-related prognostic biomarkers involved in the development of GBM. Additionally, we have developed a CIC-related model to predict high-risk GBM patients. Furthermore, we have pinpointed the expressions of these key genes at a single-cell resolution. Those findings provide next-step guidance to delve into molecular mechanisms of how CIC affect GBM cell behaviors and GBM microenvironment. Meanwhile, targeting these prognostic genes in specific cell types may lead to the development of novel therapeutic strategies for GBM patients.
Data Sharing Statement
GBM RNA-seq data and corresponding clinical information were obtained from the UCSC Xena (http://xena.ucsc.edu/) and cBioPortal (https://www.cbioportal.org/) databases. Gene expression and clinical data of GBM were downloaded from the Chinese Glioma Genome Atlas (CGGA) database(http://www.cgga.org.cn/). The analyzed data supporting the conclusions of this article are included within the article and its Supplementary Files.
Ethics Approval and Consent to Participate
All experiments were conducted in accordance with the Declaration of Helsinki and approved by the ethics committee of Tongji Hospital affiliated with Tongji University (Shanghai, China), and the participants provided signed consent forms for the use of their tissues in the study.
Acknowledgments
We thank TCGA and CCGA databases for sharing GBM sequencing data.
Author Contributions
All authors made a significant contribution to the work reported, whether that is in the conception, study design, execution, acquisition of data, analysis and interpretation, or in all these areas; took part in drafting, revising or critically reviewing the article; gave final approval of the version to be published; have agreed on the journal to which the article has been submitted; and agree to be accountable for all aspects of the work.
Funding
This research was funded by the National Natural Science Foundation of China (grant number 82371839).
Disclosure
The authors report no conflicts of interest in this work.
References
1. Venkataramani V, Yang Y, Schubert MC, et al. Glioblastoma hijacks neuronal mechanisms for brain invasion. Cell. 2022;185:2899–2917. doi:10.1016/j.cell.2022.06.054
2. Bikfalvi A, da Costa CA, Avril T, et al. Challenges in glioblastoma research: focus on the tumor microenvironment. Trends Cancer. 2023;9:9–27. doi:10.1016/j.trecan.2022.09.005
3. Roberts JW, Powlovich L, Sheybani N, et al. Focused ultrasound for the treatment of glioblastoma. J Neurooncol. 2022;157:237–247. doi:10.1007/s11060-022-03974-0
4. Pandey N, Anastasiadis P, Carney CP, et al. Nanotherapeutic treatment of the invasive glioblastoma tumor microenvironment. Adv Drug Deliv Rev. 2022;188:114415. doi:10.1016/j.addr.2022.114415
5. Aldoghachi AF, Aldoghachi AF, Breyne K, et al. Recent advances in the therapeutic strategies of glioblastoma multiforme. Neuroscience. 2022;491:240–270. doi:10.1016/j.neuroscience.2022.03.030
6. Molinaro AM, Taylor JW, Wiencke JK, et al. Genetic and molecular epidemiology of adult diffuse glioma. Nat Rev Neurol. 2019;15:405–417. doi:10.1038/s41582-019-0220-2
7. Gutwillig A, Santana-Magal N, Farhat-Younis L, et al. Transient cell-in-cell formation underlies tumor relapse and resistance to immunotherapy. Elife. 2022;11:e80315.
8. Mackay HL, Muller PAJ. Biological relevance of cell-in-cell in cancers. Biochem Soc Trans. 2019;47(2):725–732. doi:10.1042/BST20180618
9. Chen Q, Wang X, He M. Cell-in-cell: from cell biology to translational medicine. Biomed Res Int. 2022;2022:7608521. doi:10.1155/2022/7608521
10. Fais S, Overholtzer M. Cell-in-cell phenomena in cancer. Nat Rev Cancer. 2018;18:758–766. doi:10.1038/s41568-018-0073-9
11. Su Y, Huang H, Luo T, et al. Cell-in-cell structure mediates in-cell killing suppressed by CD44. Cell Discov. 2022;8:35. doi:10.1038/s41421-022-00387-1
12. Bauer MF, Hildebrand LS, Rosahl MC, et al. Cell-in-cell structures in early breast cancer are prognostically valuable. Cells. 2022;12:81. doi:10.3390/cells12010081
13. Song J, Ruze R, Chen Y, et al. Construction of a novel model based on cell-in-cell-related genes and validation of KRT7 as a biomarker for predicting survival and immune microenvironment in pancreatic cancer. BMC Cancer. 2022;22:894. doi:10.1186/s12885-022-09983-6
14. Zhao Z, Meng F, Wang W, et al. Comprehensive RNA-seq transcriptomic profiling in the malignant progression of gliomas. Sci Data. 2017;4:170024. doi:10.1038/sdata.2017.24
15. Subramanian A, Tamayo P, Mootha VK, et al. Gene set enrichment analysis: a knowledge-based approach for interpreting genome-wide expression profiles. Proc Natl Acad Sci U S A. 2005;102(43):15545–15550. doi:10.1073/pnas.0506580102
16. Yi M, Nissley DV, McCormick F, et al. ssGSEA score-based Ras dependency indexes derived from gene expression data reveal potential Ras addiction mechanisms with possible clinical implications. Sci Rep. 2020;10(1):10258. doi:10.1038/s41598-020-66986-8
17. Zhou G, Soufan O, Ewald J, et al. NetworkAnalyst 3.0: a visual analytics platform for comprehensive gene expression profiling and meta-analysis. Nucleic Acids Res. 2019;47(W1):W234–W241. doi:10.1093/nar/gkz240
18. Keenan AB, Torre D, Lachmann A, et al. ChEA3: transcription factor enrichment analysis by orthogonal omics integration. Nucleic Acids Res. 2019;47(W1):W212–W224. doi:10.1093/nar/gkz446
19. Tran TO, Vo TH, Lam LHT, et al. ALDH2 as a potential stem cell-related biomarker in lung adenocarcinoma: comprehensive multi-omics analysis. Comput Struct Biotechnol J. 2023;21:1921–1929. doi:10.1016/j.csbj.2023.02.045
20. Dang HH, Ta HD, Nguyen TTT, et al. Identifying GPSM family members as potential biomarkers in breast cancer: a comprehensive bioinformatics analysis. Biomedicines. 2021;9(9):1144. doi:10.3390/biomedicines9091144
21. Xu Y, Du Y, Zheng Q, et al. Identification of ferroptosis-related prognostic signature and subtypes related to the immune microenvironment for breast cancer patients receiving neoadjuvant chemotherapy. Front Immunol. 2022;13:895110. doi:10.3389/fimmu.2022.895110
22. Du Y, Li R, Fu D, et al. Multi-omics technologies and molecular biomarkers in brain tumor-related epilepsy. CNS Neurosci Ther. 2024;30(4):e14717. doi:10.1111/cns.14717
23. Yoshimura H, Kawahara D, Saito A, et al. Prediction of prognosis in glioblastoma with radiomics features extracted by synthetic MRI images using cycle-consistent GAN. Phys Eng Sci Med. 2024. doi:10.1007/s13246-024-01443-8
24. Zhao H, Liu Y, Fei M, et al. Genome-wide DNA methylome analysis reveals a critical role of methylation-dysregulated lncRNAs in autophagy regulation in glioblastoma. Genes Dis. 2023;11(5):101107. doi:10.1016/j.gendis.2023.101107
25. Migliozzi S, Oh YT, Hasanain M, et al. Integrative multi-omics networks identify PKCδ and DNA-PK as master kinases of glioblastoma subtypes and guide targeted cancer therapy. Nat Cancer. 2023;4(2):181–202. doi:10.1038/s43018-022-00510-x
26. Kiyokawa J, Kawamura Y, Ghouse SM, et al. Modification of extracellular matrix enhances oncolytic adenovirus immunotherapy in glioblastoma. Clin Cancer Res. 2021;27:889–902. doi:10.1158/1078-0432.CCR-20-2400
27. Xiao W, Wang S, Zhang R, et al. Bioengineered scaffolds for 3D culture demonstrate extracellular matrix-mediated mechanisms of chemotherapy resistance in glioblastoma. Matrix Biol. 2020;85–86:128–146. doi:10.1016/j.matbio.2019.04.003
28. Kim SM, Lim EJ, Yoo KC, et al. Glioblastoma-educated mesenchymal stem-like cells promote glioblastoma infiltration via extracellular matrix remodelling in the tumour microenvironment. Clin Transl Med. 2022;12:e997.
29. Huang JY, Cheng YJ, Lin YP, et al. Extracellular matrix of glioblastoma inhibits polarization and transmigration of T cells: the role of tenascin-C in immune suppression. J Immunol. 2010;185(3):1450–1459. doi:10.4049/jimmunol.0901352
30. Ma D, Liu S, Lal B, et al. Extracellular matrix protein tenascin C increases phagocytosis mediated by CD47 loss of function in glioblastoma. Cancer Res. 2019;79:2697–2708. doi:10.1158/0008-5472.CAN-18-3125
31. Kwiatkowska A, Symons M. Signaling determinants of glioma cell invasion. Adv Exp Med Biol. 2020;1202:129–149.
32. Li L, Yu R, Cai T, et al. Effects of immune cells and cytokines on inflammation and immunosuppression in the tumor microenvironment. Int Immunopharmacol. 2020;88:106939. doi:10.1016/j.intimp.2020.106939
33. Propper DJ, Balkwill FR. Harnessing cytokines and chemokines for cancer therapy. Nat Rev Clin Oncol. 2022;19:237–253. doi:10.1038/s41571-021-00588-9
34. Chang AL, Miska j, wainwright DA, et al. ccl2 produced by the glioma microenvironment is essential for the recruitment of regulatory T cells and myeloid-derived suppressor cells. Cancer Res. 2016;76(19):5671–5682. doi:10.1158/0008-5472.CAN-16-0144
35. Zhu X, Fujita M, Snyder LA, et al. Systemic delivery of neutralizing antibody targeting CCL2 for glioma therapy. J Neurooncol. 2011;104:83–92. doi:10.1007/s11060-010-0473-5
36. Platten M, Kretz A, Naumann U, et al. Monocyte chemoattractant protein-1 increases microglial infiltration and aggressiveness of gliomas. Ann Neurol. 2003;54:388–392. doi:10.1002/ana.10679
37. Felsenstein M, Blank A, Bungert AD, et al. CCR2 of tumor microenvironmental cells is a relevant modulator of glioma biology. Cancers. 2020;12:1882. doi:10.3390/cancers12071882
38. Flores-Toro JA, Luo D, Gopinath A, et al. CCR2 inhibition reduces tumor myeloid cells and unmasks a checkpoint inhibitor effect to slow progression of resistant murine gliomas. Proc Natl Acad Sci U S A. 2020;117:1129–1138. doi:10.1073/pnas.1910856117
39. Wang Q, He Z, Huang M, et al. Vascular niche IL-6 induces alternative macrophage activation in glioblastoma through HIF-2alpha. Nat Commun. 2018;9:559. doi:10.1038/s41467-018-03050-0
40. Wang H, Lathia JD, Wu Q, et al. Targeting interleukin 6 signaling suppresses glioma stem cell survival and tumor growth. Stem Cells. 2009;27:2393–2404. doi:10.1002/stem.188
41. Yeo ECF, Brown MP, Gargett T, et al. The role of cytokines and chemokines in shaping the immune microenvironment of glioblastoma: implications for immunotherapy. Cells. 2021;10:607. doi:10.3390/cells10030607
42. Da Ros M, De Gregorio V, Iorio AL, et al. Glioblastoma chemoresistance: the double play by microenvironment and blood-brain barrier. Int J Mol Sci. 2018;19(10):2879. doi:10.3390/ijms19102879
43. Chen Z, Soni N, Pinero G, et al. Monocyte depletion enhances neutrophil influx and proneural to mesenchymal transition in glioblastoma. Nat Commun. 2023;14(1):1839. doi:10.1038/s41467-023-37361-8
44. Singh K, Hotchkiss KM, Patel KK, et al. Enhancing T Cell Chemotaxis and Infiltration in Glioblastoma. Cancers (Basel). 2021;13(21):5367. doi:10.3390/cancers13215367
45. Pace A, Scirocchi F, Napoletano C, et al. Glycan-lectin interactions as novel immunosuppression drivers in glioblastoma. Int J Mol Sci. 2022;23(11):6312. doi:10.3390/ijms23116312
46. Cheng C, Ru P, Geng F, et al. Glucose-Mediated N-glycosylation of SCAP Is Essential for SREBP-1 activation and tumor growth. Cancer Cell. 2015;28(5):569–581. doi:10.1016/j.ccell.2015.09.021
47. Locatelli M, Ferrero S, Martinelli Boneschi F, et al. The long pentraxin PTX3 as a correlate of cancer-related inflammation and prognosis of malignancy in gliomas. J Neuroimmunol. 2013;260(1–2):99–106. doi:10.1016/j.jneuroim.2013.04.009
48. Wesley UV, Sutton I, Clark PA, et al. Enhanced expression of pentraxin-3 in glioblastoma cells correlates with increased invasion and IL8-VEGF signaling axis. Brain Res. 2022;1776:147752. doi:10.1016/j.brainres.2021.147752
49. Zhang H, Wang Y, Zhao Y, et al. PTX3 mediates the infiltration, migration, and inflammation-resolving-polarization of macrophages in glioblastoma. CNS Neurosci Ther. 2022;28:1748–1766. doi:10.1111/cns.13913
50. Cheng S, Liu L, Wang D, et al. Upregulation of the ZNF148/PTX3 axis promotes malignant transformation of dendritic cells in glioma stem-like cells microenvironment. CNS Neurosci Ther. 2023;29:2690–2704. doi:10.1111/cns.14213
51. Friedmann-Morvinski D, Narasimamurthy R, Xia Y, et al. Targeting NF-kappaB in glioblastoma: a therapeutic approach. Sci Adv. 2016;2:e1501292. doi:10.1126/sciadv.1501292
52. Aaberg-Jessen C, Fogh L, Sorensen MD, et al. Overexpression of TIMP-1 and Sensitivity to Topoisomerase Inhibitors in Glioblastoma Cell Lines. Pathol Oncol Res. 2019;25:59–69. doi:10.1007/s12253-017-0312-5
53. Shen F, Song C, Liu Y, et al. IGFBP2 promotes neural stem cell maintenance and proliferation differentially associated with glioblastoma subtypes. Brain Res. 2019;1704:174–186. doi:10.1016/j.brainres.2018.10.018
54. Chua CY, Liu Y, Granberg KJ, et al. IGFBP2 potentiates nuclear EGFR-STAT3 signaling. Oncogene. 2016;35:738–747. doi:10.1038/onc.2015.131
55. Liu Y, Song C, Shen F, et al. IGFBP2 promotes immunosuppression associated with its mesenchymal induction and FcgammaRIIB phosphorylation in glioblastoma. PLoS One. 2019;14:e0222999. doi:10.1371/journal.pone.0222999
56. Wang H, Song X, Huang Q, et al. LGALS3 promotes treatment resistance in glioblastoma and is associated with tumor risk and prognosis. Cancer Epidemiol Biomarkers Prev. 2019;28(4):760–769. doi:10.1158/1055-9965.EPI-18-0638
57. Wiegreffe C, Simon R, Peschkes K, et al. Bcl11a (Ctip1) controls migration of cortical projection neurons through regulation of Sema3c. Neuron. 2015;87(2):311–325. doi:10.1016/j.neuron.2015.06.023
58. Simon R, Wiegreffe C, Britsch S. Bcl11 Transcription Factors Regulate Cortical Development and Function. Front Mol Neurosci. 2020;13:51. doi:10.3389/fnmol.2020.00051
59. El Baba R, Pasquereau S, Haidar Ahmad S, et al. EZH2-Myc driven glioblastoma elicited by cytomegalovirus infection of human astrocytes. Oncogene. 2023;42(24):2031–2045. doi:10.1038/s41388-023-02709-3
60. Zhong J, Yang X, Chen J, et al. Circular EZH2-encoded EZH2-92aa mediates immune evasion in glioblastoma via inhibition of surface NKG2D ligands. Nat Commun. 2022;13(1):4795. doi:10.1038/s41467-022-32311-2
61. Ke K, Song Y, Shen J, et al. Up-regulation of Glis2 involves in neuronal apoptosis after intracerebral hemorrhage in adult rats. Cell Mol Neurobiol. 2015;35(3):345–354. doi:10.1007/s10571-014-0130-1
62. Wang TC, Luo SJ, Chang SF. Bone morphogenetic protein 7 effect on human glioblastoma cell transmigration and migration. Life. 2021;11(7):708. doi:10.3390/life11070708
63. Seystahl K, Tritschler I, Szabo E, et al. Differential regulation of TGF-β-induced, ALK-5-mediated VEGF release by SMAD2/3 versus SMAD1/5/8 signaling in glioblastoma. Neuro Oncol. 2015;17(2):254–265. doi:10.1093/neuonc/nou218
64. Lastra D, Escoll M, Cuadrado A. Transcription Factor NRF2 participates in cell cycle progression at the level of G1/S and mitotic checkpoints. Antioxidants (Basel). 2022;11(5):946. doi:10.3390/antiox11050946
65. Lu X, Lv XD, Ren YH, et al. Dysregulation of TFDP1 and of the cell cycle pathway in high-grade glioblastoma multiforme: a bioinformatic analysis. Genet Mol Res. 2016;15(2). doi:10.4238/gmr.15027646
66. Zheng H, Wu L, Fan J, et al. Zinc finger protein 501 maintains glioblastoma cell growth through enhancing Frizzled-6 expression. Neurosci Res. 2022;182:15–24. doi:10.1016/j.neures.2022.06.003
 © 2024 The Author(s). This work is published and licensed by Dove Medical Press Limited. The
full terms of this license are available at https://www.dovepress.com/terms.php
and incorporate the Creative Commons Attribution
- Non Commercial (unported, 3.0) License.
By accessing the work you hereby accept the Terms. Non-commercial uses of the work are permitted
without any further permission from Dove Medical Press Limited, provided the work is properly
attributed. For permission for commercial use of this work, please see paragraphs 4.2 and 5 of our Terms.
© 2024 The Author(s). This work is published and licensed by Dove Medical Press Limited. The
full terms of this license are available at https://www.dovepress.com/terms.php
and incorporate the Creative Commons Attribution
- Non Commercial (unported, 3.0) License.
By accessing the work you hereby accept the Terms. Non-commercial uses of the work are permitted
without any further permission from Dove Medical Press Limited, provided the work is properly
attributed. For permission for commercial use of this work, please see paragraphs 4.2 and 5 of our Terms.