")
Back to Journals » International Journal of Nanomedicine » Volume 20
Liposomal Nanoparticle Delivery of Ginkgo Flavone Glycosides Enhances SIRT1 Activation and Improves Diabetic Cardiomyopathy
Authors Gao W, Chen R, Tong H, Wang Y, Liang L, Li Y, Yu H
Received 30 August 2024
Accepted for publication 28 April 2025
Published 9 June 2025 Volume 2025:20 Pages 7295—7321
DOI https://doi.org/10.2147/IJN.S493862
Checked for plagiarism Yes
Review by Single anonymous peer review
Peer reviewer comments 3
Editor who approved publication: Prof. Dr. RDK Misra
Wei Gao, Ruoran Chen, Huixin Tong, Yu Wang, Linlang Liang, Yiyao Li, Hao Yu
Department of Endocrinology, General Hospital of Northern Theater Command, Shenyang, 110016, People’s Republic of China
Correspondence: Hao Yu, Department of Endocrinology, General Hospital of Northern Theater Command, No. 83, Wenhua Road, Shenhe District, Shenyang, Liaoning Province, 110016, People’s Republic of China, Tel +86 024 28851153, Email [email protected]
Purpose: This study aims to explore the therapeutic mechanisms of Ginkgo Flavone Glycosides (GFGs) delivered via liposomal nanoparticles in treating Diabetic Cardiomyopathy (DCM) by upregulating Sirtuin 1 (SIRT1) to restore energy metabolism and autophagy homeostasis.
Methods: A DCM mouse model was employed, with groups treated with different doses of GFGs. Various evaluations, including body weight, blood glucose levels, and cardiac function, were performed. Network pharmacology, transcriptomic analysis, and molecular docking studies were conducted to elucidate the key role of SIRT1 in inhibiting DCM progression. In vitro experiments and proteomic sequencing were utilized to validate the regulatory effects of SIRT1.
Results: The in vivo animal experiment results demonstrated that treatment with Ginkgo Flavone Glycosides (GFGs) significantly improved cardiac function in diabetic cardiomyopathy mice. Specifically, GFG treatment increased the left ventricular ejection fraction (LVEF) by approximately 81.3% compared to the Model+Lipo group, reduced the left ventricular internal diameter in systole (LVIDs) by approximately 69.2%, and decreased the left ventricular internal diameter in diastole (LVIDd) thickness by approximately 56.1%. Additionally, GFGs alleviated cardiomyocyte apoptosis, further supporting their therapeutic potential for diabetic cardiomyopathy. Bioinformatics analysis supported the regulation of DCM through the SIRT1/FOSL1/TSPAN4 axis. Proteomic data confirmed the beneficial effects of GFGs on diabetic cardiac energy metabolism and autophagy. Liposomal nanoparticles loaded with GFGs significantly extended drug release to 72 hours. In vitro experiments highlighted the role of SIRT1 in modulating FOSL1 and TSPAN4 expression. Proteomic sequencing further validated the regulatory role of the SIRT1/FOSL1/TSPAN4 signaling pathway in DCM and suggested that GFGs might enhance energy metabolism and autophagy in diabetic hearts by activating SIRT1.
Conclusion: Liposomal nanoparticle delivery of GFGs was shown to enhance SIRT1 activation, leading to the deacetylation of FOSL1 and suppression of TSPAN4, ultimately improving energy metabolism and autophagy in DCM. This study introduces a novel potential strategy for the treatment of DCM.
Keywords: liposomal nanoparticles, Ginkgo Flavone Glycosides, Sirtuin 1, diabetic cardiomyopathy, energy metabolism, autophagy homeostasis
Introduction
Diabetic Cardiomyopathy (DCM) is a common complication of long-term diabetes, increasingly recognized as a significant public health issue worldwide due to its rising incidence.1,2 Recent epidemiological surveys have identified DCM as one of the leading cardiovascular diseases contributing to mortality and playing a pivotal role in the progression of DCM.3–5 Although various treatment strategies exist, they mainly focus on controlling blood glucose and lipids, lacking effective options to address myocardial damage. Consequently, a substantial proportion of DCM patients inevitably progress to heart failure. Currently, there is no specific therapy for DCM. The development of cardioprotective antidiabetic drugs will not only aid in preventing diabetes-associated heart failure but also meet the urgent need for precise treatments targeting DCM among the global diabetic population.6 Consequently, exploring effective treatments to improve cardiac function in diabetic patients has become a major challenge in current medical research.7
In recent years, rapid advancements in biotechnology have brought GFGs into the spotlight due to their exceptional antioxidative, anti-inflammatory, and cardiovascular protective properties, particularly for diabetic patients.8–10 Extracted from ginkgo leaves, these natural mixed flavonoid compounds exhibit unique bioactivities and hold promising therapeutic potential in various cutting-edge medical fields.11,12 Particularly in the prevention and treatment of cardiovascular diseases, GFGs have demonstrated capabilities to alleviate myocardial ischemia, inhibit cardiomyocyte apoptosis, and enhance myocardial energy metabolism.13,14 The primary pathological features of DCM include cardiomyocyte apoptosis, myocardial fibrosis, and severe disturbances in cardiac energy metabolism. These pathological changes not only lead to progressive myocardial dysfunction but also exacerbate structural and functional cardiac disorders.13,14 Furthermore, increased oxidative stress within cardiomyocytes, active inflammatory responses, and abnormal autophagy play critical roles in the progression of DCM.
Research has demonstrated that ginkgo flavonol exhibits a concentration-dependent vasodilatory effect, with rat aortic rings contracting strongly upon initial application of 5 μM norepinephrine. Pharmacokinetic studies using radiolabeled Ginkgo biloba extract (14C-labeled) in rats showed a two-compartment model, with a first-order elimination rate and a half-life of approximately 4.5 hours. Following oral administration, Ginkgo biloba is absorbed via the gastrointestinal tract with an absorption rate exceeding 60%. Within 72 hours, 38% of the dose was exhaled as 14C-CO2, while 22% and 29% were excreted via urine and feces, respectively.15 The pharmacokinetics and metabolic pathways in the liver and gut microbiota enable GFGs to reach target organs and exert their therapeutic effects.13
Recent studies have identified sirtuin 1 (SIRT1), a deacetylase, as a critical regulator in DCM progression. SIRT1 plays a vital role in glucose and lipid metabolism, inflammation control, and other BP, making it a potential therapeutic target for DCM.16 SIRT1 expression is significantly reduced in the cardiomyocytes of diabetic patients and is associated with multiple signaling pathways, such as AMPK/SIRT1, FoxO3a/SIRT1, NF-κB/SIRT1, and eNOS/SIRT1. Activating these pathways to upregulate SIRT1 expression has been shown to improve DCM in vivo and in vitro models.17 Novel therapeutics, including the prodrug azilsartan, alleviate oxidative stress and inflammation in DCM through the SIRT1/Nrf2/NF-κB pathway, improving cardiac function.18 Additionally, compounds like betulinic acid protect against DCM via the SIRT1/NLRP3/NF-κB pathway,19 while curcumin and rosmarinic acid enhance SIRT1 activity, mitigating oxidative stress and apoptosis in DCM.20,21 These findings establish a theoretical foundation for developing new SIRT1-targeted therapies for DCM.
However, despite their broad biological functions, GFGs face certain limitations in clinical application, primarily due to low bioavailability and poor target specificity in the body.22,23 To overcome these challenges, researchers have begun exploring nanotechnology to optimize drug delivery systems. The current carrier technologies mainly include lipid nanoparticles (LNP), extracellular vesicles (EV), biomimetic nanocarriers, and metal-organic frameworks. Among them, lipid nanoparticles (LNP) integrate the advantages of traditional colloids while eliminating some associated drawbacks in the fields of mRNA and deoxyribonucleic acid (DNA) antigens, oligonucleotides, and CRISPR. LNPs are generally used for: 1) improving biocompatibility; 2) optimizing drug EE%; 3) coordinated co-encapsulation of hydrophilic and hydrophobic drugs; 4) reducing toxicity; and 5) controlled or targeted delivery of therapeutics.24 Liposomal nanoparticles, as an efficient drug carrier, exhibit excellent biocompatibility and controllable drug release properties, significantly enhancing drug stability and targeting. Encapsulating GFGs in liposomal nanoparticles effectively protects the active ingredients, increases their accumulation in cardiomyocytes, and thereby improves therapeutic outcomes.
This study utilizes liposomal nanoparticles as carriers for GFGs, exploring their mechanism of action in treating DCM through in vivo animal experimental models. By conducting detailed bioinformatics analyses and cellular experiments, this research aims to validate that GFGs enhance the expression of SIRT1, promote the deacetylation of the transcription factor FOSL1, and thereby inhibit the TSPAN4, improving myocardial cell energy metabolism and autophagy homeostasis. We anticipate that this innovative nanomedical delivery approach could provide a novel strategy for DCM treatment, thereby improving patients’ cardiac function and quality of life.
In summary, this study not only presents a new design and application of a nanomedical delivery system but also proposes potential new pathways for DCM treatment through in-depth mechanistic research. The findings of this study contribute significantly to our understanding of the pathophysiological mechanisms of DCM and could profoundly impact the formulation of clinical treatment strategies, particularly in enhancing therapeutic efficacy and patient quality of life.
Materials and Methods
Liposome Preparation
Liposomes were composed of 1,2-distearoyl-sn-glycero-3-phosphocholine (P1138, Sigma), cholesterol (PHR1533, Sigma), and distearoyl-phosphatidylethanolamine-mPEG 2000 (HY-142979, MCE) at a molar ratio of 6:3:1. Liposome groups were categorized as follows: the GFGs Lipo group contained Ginkgo Flavone Glycosides (GFGs) (Shanghai Spectrum Biotechnology, 481–46-9) at a drug-to-lipid ratio of 1 mg/40 mg total lipids, while the Lipo group contained no GFGs. Liposomes were primarily prepared using the thin-film hydration method.25 In brief, lipids were dissolved in an organic solvent mixture (chloroform and methanol), and the solvent was removed by vacuum deposition to form a thin film. After complete solvent evaporation, the lipid residue was hydrated with an aqueous buffer solution, leading to spontaneous swelling and liposome formation. This method produced multilamellar vesicles of heterogeneous sizes exceeding 1 µm. Ultrasonication was subsequently employed to reduce particle size.26 Specifically, the selected lipids, with or without GFGs, were dissolved in chloroform/methanol (2:1 v/v) in a round-bottom flask. A lipid film was generated using a Rotavapor R-300 system (55 °C, 50 rpm, 250 kPa, 1 h). The dried lipid film was hydrated with saline (1 mL/20 mg total lipids) under vigorous vortexing at 55 °C for 1 hour. Homogeneous unilamellar liposomes were obtained by extruding the suspension through polycarbonate membranes of three sizes (400, 200, and 100 nm) using an extruder (610000, Avanti).
Dynamic Light Scattering (DLS)
CharacterizationThe physicochemical parameters of the liposomes were characterized using a Malvern Zetasizer Nano Serie DTS 1060 (Malvern Instruments, UK). In DLS analysis, a laser beam illuminates the sample, and scattered light is collected by the instrument. The intensity distribution of the scattered light provides the particle size distribution curve and dynamic information, such as diffusion coefficients and aggregation state.27 For each analysis, the hydrodynamic diameter (nm), polydispersity index (PDI), and zeta potential were measured.28 Liposomes were diluted 1/30 (v/v) in MilliQ-purified water, and measurements were performed at 25 °C in triplicate. Results were reported as the average particle size (nm) and intensity-based size distribution.
Transmission Electron Microscopy (TEM)
The morphology of the liposomes was determined using a transmission electron microscope (HT7800, HITACHI). Each sample was diluted in a buffer (20 mm Hepes, 150 mm NaCl) and supplemented with cryoprotectant. A drop of the sample was deposited onto a copper grid (consisting of a copper framework, a Formvar film, and a carbon film with micron-sized pores), and excess liquid was removed. The grid was then immersed in liquid ethane for freezing and stored in liquid nitrogen. Before imaging, the samples were dried for 10 minutes. Images were acquired using a JEOL JEM-1230 transmission electron microscope operating at 120 kV. Each dataset was divided into multiple subsets, and particles were sorted for 2D-level analysis and data generation.29
Encapsulation Efficiency (EE%) Determination
EE of GFGs in liposomes was indirectly determined using centrifugal ultrafiltration. Free GFGs were removed using Amicon Ultra-2 centrifugal filters with a 100 kDa MWCO at 7,500 × g, followed by UV analysis for 10 minutes. The absorbance of free GFGs in the filtrate was measured at 330 nm using UV spectroscopy. The amount of GFGs encapsulated in liposomes was calculated as the difference between the total drug amount added during hydration and the free drug in the supernatant. EE% was calculated using the formula: EE% = [(DrugTotal - DrugFree) / DrugTotal] × 100%.
Drug Release Study
The release profile of GFGs from liposomes was evaluated using the dialysis bag method (FDM314, Beyotime). Dialysis bags were activated with pH 7.4 PBS prior to the study. A 50 µL liposome solution (50 nM concentration) was placed into the dialysis bag, which was immersed in 40 mL of pH 7.4 PBS containing 10% ethanol. The system was maintained at 37 ± 0.5 °C with 100 rpm shaking. At predetermined time points, 1 mL samples were withdrawn and replaced with fresh PBS. Samples were analyzed for GFG release, and a parallel study was conducted for free GFGs under identical conditions.
Long-Term Stability Study
Liposomes were stored at 4 ± 2 °C in the dark. Particle size was measured at specific time points using DLS characterization.
Construction of DCM Model
Male C57BL/6 wild-type mice (aged 6–8 weeks) were obtained from Shanghai SLAC Laboratory Animal Co., Ltd. (C57BL/6Slac, Shanghai SLAC Laboratory Animal Co., Ltd). All mice were housed under standard laboratory conditions (temperature 20–24°C, humidity 60%, 12-hour light/dark cycle) and had free access to food and water. To minimize variability, animals were individually numbered, and randomization was performed using a random number table to assign mice to experimental groups. This study adhered to the Guidelines for the Care and Use of Laboratory Animals published by the National Research Council (NRC). Diabetes was induced in the mice by intraperitoneal injection of Streptozotocin (STZ, 60 mg/kg/day) (S0130, Merck) for six consecutive days, while the control group received an equivalent volume of citrate buffer (S5770, Merck). Mice with fasting blood glucose levels >16.7 mmol/L seven days after STZ injection were considered diabetic. Eight weeks after diabetes establishment, mice were randomly selected for histological examination using hematoxylin and eosin (H&E) staining and Masson’s trichrome staining. The presence of increased myocardial collagen content, disorganized and thickened collagen fibers, muscle fiber disruption, and inflammatory cell infiltration confirmed the successful establishment of the model.30
For the GFGs treatment groups, the following were established: CTR (control mice treated with citrate buffer); Model (DCM model mice induced with STZ); GFGs 25 mg/kg (low dose GFGs treated DCM model mice); GFGs 50 mg/kg (medium dose GFGs treated DCM model mice); GFGs 100 mg/kg (high dose GFGs treated DCM model mice). After the DCM model was established, mice were injected intraperitoneally with GFGs daily at group-specific doses and were euthanized after 28 days of treatment.31 The doses of GFGs were referenced from various studies.32–34
For the GFGs liposomal treatment groups, the following were set up: CTR (control mice treated with citrate buffer); Model (DCM model mice induced with STZ); Model+lipo (DCM model mice treated with liposomes); Model+GFGs lipo (DCM model mice treated with GFGs liposomes); Model+shNC+GFGs lipo (DCM model mice treated with control lentivirus and GFGs liposomes); Model+shSIRT1+GFGs lipo (DCM model mice treated with knockdown SIRT1 lentivirus and GFGs liposomes). After the model construction, the viral treatment groups received a tail vein injection of 50 μL of 2.5×10¹⁰ virus. The shNC sequence was 5′-CCGGGAGGGTAATCAATACCTGTTTCTCGAGAAACAGGTATTGATTACCCTCTTTTTG-3′, and the mouse shSIRT1 sequence was 5′-CCGGAGTGAGACCAGTAGCATAATCTCGAGATTAGTGCTACTGGTCTCACTTTTTTG-3′. Concurrently, 0.2 mL of liposomes were injected intraperitoneally every three days for a duration of 30 days.35–37
Blood Glucose
Measurement Blood glucose levels were measured using the LabAssay™ Glucose kit (FUJIFILM Wako Pure Chemical Co., Ltd). Seven days post-STZ injection, diabetes was confirmed by hyperglycemia, with only mice exhibiting blood glucose levels >16.7 mmol/L included in the study. Blood glucose levels were assessed again after the treatment with GFGs or liposomes.
Cardiac Function
Assessment Echocardiography was performed in M-mode using the VEVO 2100 system (VisualSonics Inc., Toronto, Canada). During the procedure, mice were anesthetized with 2.5% isoflurane (792632, Merck) and maintained on 2% isoflurane. Heart rate was monitored under awake or anesthetized conditions using a continuous electrocardiogram system. M-mode echocardiograms documented the characteristics of left ventricular systolic and diastolic movements. Left ventricular internal diameter in systole (LVIDs) and left ventricular internal diameter in diastole (LVIDd) were measured. Left ventricular end-diastolic volume (LVEDV) and left ventricular end-systolic volume (LVESV) were calculated using a computer algorithm. The left ventricular ejection fraction (LVEF) was calculated as LVEF (%) = (LVEDV-LVESV)/LVEDV × 100.
H&E Staining
After euthanasia, mouse heart tissues were collected and fixed in a 4% formaldehyde solution. The tissues were then embedded in paraffin, sectioned at 4 μm thickness, and stained using the H&E reagent (C0105M, Beyotime). The sections were then cut into 4 µm slices and stained with H&E using the staining reagent (C0105M, Beyotime). They were incubated for one minute and then rinsed with tap water until the water ran clear. Then counterstained with eosin for 15 seconds. After counterstaining, the sections were transferred to 95% ethanol and further dehydrated in 100% ethanol and xylene. Before imaging, slides were mounted using a neutral resin mounting medium (C1795, Sigma) and air-dried. Microscopic imaging was conducted thereafter.
Masson Staining
After dehydration, the cardiac tissue was embedded in paraffin and sectioned into 5 µm thick slices. The paraffin-embedded slices were then dewaxed and rehydrated for subsequent experiments. Staining was performed using a Masson staining kit (C0189S, Beyotime), and images were captured using a microscope.
TUNEL Assay
Cardiac tissue was assessed using a TUNEL assay kit (C1088, Beyotime). In brief, after dewaxing, the paraffin-embedded cardiac tissue slices were treated with proteinase K (ST533, Beyotime) to remove proteins from the cell nuclei. The slices were then incubated in 3% hydrogen peroxide for 10 minutes, followed by incubation with terminal deoxynucleotidyl transferase (EP0161, Thermo Scientific) at 37°C for 1 hour. Subsequently, the slices were incubated with streptavidin-FITC (S3762, Merck) at 37°C for 30 minutes. Finally, apoptosis in the cardiac tissue was detected using a confocal microscope (LMS710, ZEISS).
Screening of GFGs Active Components and DCM-Related Targets
Seven active components of GFGs (Quercetin, Kaempferol, Myricetin, Apigenin, Isorhamnetin, Luteolin, and Tamarixetin) were identified through literature mining.38 The molecular structures of these compounds were obtained from the PubChem Compound Database (https://pubchem.ncbi.nlm.nih.gov/). Potential targets of the active components were screened using the STITCH database (http://stitch.embl.de/) with the organism set to “Homo sapiens” and “max number of interactors to show” limited to 50. Potential DCM-related targets were identified by searching “Diabetic cardiomyopathy” in the DisGeNET database (https://www.disgenet.org/home/).
Construction of GFGs Component-Target Network
The intersection of GFGs-related genes and DCM-related genes was obtained using the “VennDiagram” R package. GFGs active components and their target information were imported into Cytoscape software to construct a component-target interaction network, where nodes represented herbs, active components, or targets, and edges indicated interactions.
GO and KEGG Functional Enrichment Analysis
Overlapping target genes were subjected to Gene Ontology (GO) and Kyoto Encyclopedia of Genes and Genomes (KEGG) enrichment analyses using the “ClusterProfiler” R package. GO analysis included biological processes (BP), cellular components (CC), and molecular functions (MF). Statistical significance was set at p < 0.05.
Transcriptomic Data Collection and Analysis
Transcriptomic datasets related to DCM were retrieved from the GEO database (https://www.ncbi.nlm.nih.gov/geo/) using keywords such as “diabetic cardiomyopathy” and “transcriptome.” Criteria included studies using mouse models, appropriate sample sizes, and clear experimental designs. Five datasets (GSE4616, GSE144796, GSE161827, GSE161931, GSE241166) were selected. Batch effects were removed using the ComBat algorithm in the “sva” R package, and differential expression gene (DEG) analysis was conducted with the “limma” R package, setting p < 0.01 as the threshold. Dataset details are shown in Table S1. This study utilized de-identified publicly available data, complying with ethical guidelines (PRC National Health Commission Order No. 11). Ethical review exemption was confirmed by the Northern Theater General Hospital.
Weighted Gene Co-Expression Network Analysis (WGCNA)
The “WGCNA” R package was used to construct gene co-expression networks. Genes with minimal expression fluctuations were removed, and outlier detection and data filtering were performed. An optimal soft-thresholding power (power) was selected to construct a weighted adjacency matrix, which was transformed into a topological overlap matrix (TOM). Gene modules were identified through dynamic tree cutting, and the correlation between modules and clinical traits was calculated to identify key DCM-related modules.
Molecular Docking Analysis
Three-dimensional structures of GFGs components were downloaded from the PubChem database and converted to Mol2 format using Open Babel (v3.1.1). The SIRT1 protein structure (PDB ID: 4if6) was obtained from the RCSB PDB database (https://www.rcsb.org/), and water molecules and small molecule receptors were removed using PyMOL (v2.4.0). Molecular docking was performed using AutoDockTools (v1.5.6) and AutoDock Vina (v1.1.2). Binding free energy (kcal/mol) was recorded, and results were visualized with PyMOL.
Correlation Analysis and Transcription Factor Prediction
DCM samples were divided into SIRT1 high-expression and low-expression groups, and differential expression analysis was performed (p < 0.01). Genes correlated with SIRT1 expression were identified using Pearson correlation analysis (|R| > 0.3, p < 0.01). Transcription factors were predicted using the hTFtarget database (http://bioinfo.life.hust.edu.cn/hTFtarget#!/), and transcription factor binding sites were analyzed using the JASPAR database.
LC-MS/MS Proteomics Analysis
Tryptic peptides were separated on a C18 PepMap100 column (3 μm, 100 Å, 25 cm) via reverse-phase nano-LC and analyzed on an LTQ Orbitrap XL mass spectrometer (Thermo Fisher Scientific). Spectra were acquired in full ion scan mode over m/z 300–2000, with dynamic exclusion for dependent MS/MS scans. SEQUEST (v.28) and X! Tandem were used for peptide identification against the UniProt/SwissProt mouse database. Results were validated using Scaffold (v2.0) with peptide and protein probabilities set at >95% and >99%, respectively, including at least two identified peptides. Differential expression analysis of myocardial tissue samples classified by SIRT1 expression was conducted (p < 0.01), followed by GO and KEGG enrichment analysis.
Cell Culture, Lentiviral Infection, and Grouping
H9c2 cells were purchased from ATCC (CRL-1446, ATCC) and cultured in high-glucose DMEM (C0891, Beyotime) supplemented with 10% fetal bovine serum (FBS; 12483020, Gibco), 100 U/mL penicillin, and 100 μg/mL streptomycin (C0222, Beyotime).
To establish a diabetic cell model, H9c2 cells were cultured under normal glucose (5.5 mmol/L; PHR1000, Merck) or high glucose (33 mmol/L) conditions for 72 hours.
H9c2 cells in the logarithmic growth phase were collected for SIRT1 knockdown or overexpression via lentiviral infection. The shNC sequence was:
5′-CCGGGAGGGTAATCAATACCTGTTTCTCGAGAAACAGGTATTGATTACCCTCTTTTTG-3′, and the human shSIRT1 sequence was: 5′-CCGGGCGGCTTGATGGTAATCAGTACTCGAGTACTGATTACCATCAAGCCGCTTTTT-3′.
Recombinant lentiviruses were provided by Sangon Biotech (Shanghai). The infection protocol was as follows: H9c2 cells in the logarithmic growth phase were prepared into a cell suspension (5 × 10⁴ cells/mL) and seeded into 6-well plates (2 mL per well). After overnight incubation at 37 °C, recombinant lentivirus was added at a final concentration of 1 × 10⁸ TU/mL. Cells were incubated for 48 hours post-infection before conducting subsequent experiments. Grouping for the Regulation Mechanisms of SIRT1, FOSL1, and TSPAN4; H9c2 cells were divided into the following groups: CTR group: Control group cultured under normal glucose conditions; HG group: High-glucose model group; HG+shNC group: High-glucose model group treated with shNC lentivirus; HG+shSIRT1 group: High-glucose model group treated with SIRT1 knockdown lentivirus; HG+oe-NC group: High-glucose model group treated with oe-NC lentivirus; HG+oe-SIRT1 group: High-glucose model group treated with SIRT1 overexpression lentivirus.
Grouping for Liposome Treatment in High-Glucose H9c2 Cells H9c2 cells were divided into the following groups: Lipo group: High-glucose model group treated with liposomes; GFGs Lipo group: High-glucose model group treated with GFGs-loaded liposomes (GFGs, Shanghai Spectrum Biotechnology, 481–46-9); shNC+GFGs Lipo group: High-glucose model group with shNC knockdown treated with GFGs-loaded liposomes; shSIRT1+GFGs Lipo group: High-glucose model group with SIRT1 knockdown treated with GFGs-loaded liposomes; Liposomes were added to the culture medium at a volume of 50 μL and a concentration of 50 nM, followed by 24-hour treatment.
Western Blot (WB) Analysis
WB analysis was performed using RIPA lysis buffer containing phenylmethylsulfonyl fluoride (PMSF) (P0013B, Beyotime, Shanghai) to extract total protein from cells. Protein quantification was carried out using a BCA protein assay kit (23225, Thermo Fisher Scientific, Rockford, IL, USA). Fifty μg of protein was dissolved in 2× SDS sample buffer, boiled at 100°C for 5 minutes, and then subjected to SDS-PAGE electrophoresis. Proteins were transferred to a PVDF membrane using a wet transfer method. The membrane was blocked with 5% non-fat milk at room temperature for 1 hour and then incubated overnight at 4°C with diluted primary antibodies: LC3A/B (A5618, Abclonal), caspase 3 (A19654, Abclonal), p62 (A19700, Abclonal), SIRT1 (ab110304, ABCAM, Creative Diagnostics), FOSL1 (ARP31377_P050, AVIVA), acetylated lysine (05–515, Sigma). After washing with TBST three times, 10 minutes each, the membrane was incubated with HRP-conjugated secondary antibody, goat anti-rabbit IgG H&L (HRP) (ab97051, 1:2000, Abcam, Cambridge, UK) for 1 hour. After TBST washing, the membrane was placed on a clean glass plate. Equal volumes of solution A and B from the Pierce™ ECL detection kit (32209, Thermo) were mixed in the darkroom and applied to the membrane. Imaging was performed using the Bio-Rad imaging system (ChemiDoc™ XRS+, BIO-RAD).
Immunofluorescence Staining
H9c2 cells were fixed in 4% paraformaldehyde (P0099, Abclonal) for 15 minutes and then washed three times with phosphate-buffered saline (PBS). Cell membranes were permeabilized at room temperature with PBS containing 0.5% Triton X-100 (P0096, Abclonal) for 15 minutes. Non-specific binding sites were blocked with 5% bovine serum albumin (ST2254, Abclonal) in PBS for 1 hour, followed by three washes, each for 5 minutes. Cells were then stained with primary antibodies: MitoTracker® Green FM (#9074, CST), SIRT1 (ab110304, ABCAM), FOSL1 (ARP31377_P050, AVIVA), and LC3 (A5618, Abclonal) to mark autophagy. After washing, cells were incubated at room temperature for 1 hour with secondary antibodies, either Alexa Fluor 488 goat anti-rabbit IgG (ab150077, Abcam) or Alexa Fluor 647 goat anti-mouse IgG (ab150115, Abcam). DNA was counterstained with DAPI (C1002, Abclonal) in the dark. Finally, cells were washed with PBS. Images were captured using a Nikon microscope (Az100; Nikon, Tokyo, Japan) equipped with a fluorescence illuminator (L200/D; Prior Scientific, Rockland, MA, USA) and a digital camera (DS-Vi1; Nikon) connected to a computer for further analysis.
Immunoprecipitation (IP)
For endogenous Co-IP analysis of acetylation, H9c2 cells were lysed with IP lysis buffer. Cell lysis was performed using IP cell lysis buffer (P0013, Beyotime, which also contained 1% protease inhibitor (P1005, Beyotime). The lysis was carried out at 4°C for 30 minutes. After centrifugation at 12,000 g for 10 minutes at 4°C, the supernatant was collected. The lysates were incubated with 20 μL of magnetic beads and FOSL1 (ARP31377_P050, AVIVA) at 4°C for 12 hours. The beads were then centrifuged at 1,500 rpm for 5 minutes at 4°C, and the pellet was washed five times with TBST. Protein samples were analyzed using WB.
CHIP
Cells were fixed with 1% formaldehyde for 10 minutes, and the reaction was terminated with 125 mm glycine. The cells were then collected and washed twice with cold PBS. Subsequently, the cells (>107) were resuspended in 1 mL of lysis buffer (150 mm NaCl, 50 mm Tris-HCl [pH 7.5], 5 mm EDTA, 0.5% NP-40, 1% Triton X-100, 1 mm PMSF, and 1× protease inhibitor cocktail) and incubated on ice for 10 minutes. The lysates were subjected to sonication under the following conditions: power level 75%, sonication for 5 seconds, followed by a 10-second pause, for a total of 15 minutes, performed on ice. The lysates were then centrifuged at 12,000 g for 10 minutes at 4°C. Pre-cleared lysates were incubated overnight at 4°C with FOSL1 antibody (ab252421, ABCAM), and the complexes were then incubated with Protein G-agarose beads at 4°C for 4 hours. The immunoprecipitated complexes were washed five times and eluted with 150 μL of Tris-EDTA buffer containing 1% SDS. The cross-linked complexes were digested overnight at 65°C with 25 μg/mL proteinase K. DNA was then extracted and analyzed by real-time PCR using ChIP-qPCR primers: F: TGCAGTGGCGTGATCTTGGC; R: AGATGGGATTTCGCCATGTTGGC.
Luciferase Assay
H9c2 cells were cultured in six-well plates and transfected with 2 μg of plasmid DNA containing the TSPAN4 promoter sequence along with the pRL-TK Renilla luciferase control reporter vector (test vector/control vector ratio of 10:1) using the Transporter™ 5 transfection reagent (Polysciences, Warrington, 26008–5) when cells reached approximately 60% confluence. After 72 hours, luciferase activity was measured using the Dual-Luciferase® Reporter Assay System (Promega) with a Mithras LB 940 multimode plate reader (Berthold Technologies, Bad Wildbad, Germany).
CCK-8
Cell toxicity was assessed using the CCK-8 assay (C0037, Beyotime). Cells were seeded at 4×10³ cells per well in 96-well plates with 100 μL of culture medium. After 24 hours of incubation, the liposome treatment was added. Following 20 hours of incubation at 37°C, 10 μL of CCK-8 solution was added to each well. After 120 minutes of incubation, the optical density at 450 nm was measured.
Cell Cycle Analysis
Cell cycle phases were determined by staining DNA with propidium iodide (PI, ST1569, Beyotime) and analyzing the samples using flow cytometry. Cells were prepared as a single-cell suspension, fixed with ice-cold 70% ethanol (1.00983, Merck) at 4°C for at least 1 hour, and then treated with 100 µg/mL RNase A (Thermo-Fisher, #EN0531) at 37°C for 30 minutes. The cells were subsequently incubated with 50 µg/mL PI at room temperature for 5 minutes. DNA content was analyzed using a BD Fortessa LSRII flow cytometer (BD Biosciences), and at least 300,000 events per sample were collected. Data were analyzed using FlowJo V10 software.
ATP Assay
In vitro ATP Measurement: Cells were seeded at 80% confluence in 6-well plates containing growth medium. ATP content in the cells was quantified using a colorimetric/fluorometric ATP assay kit (Abcam, ab83355). Before ATP quantification, each well was treated with fresh serum-free medium for 3–6 hours. After treatment, cell lysates were prepared using a protein extraction reagent (Abcam, ab204708). The ATP content in the lysates was measured by the generation of a product detectable by fluorescence or absorbance, resulting from glycerol phosphate formation. Briefly, 50 μL of reagent was mixed with 50 μL of lysate in a clear-bottom 96-well plate and incubated in the dark at room temperature for 30 minutes. ATP concentration was determined by measuring the absorbance at 570 nm.
In vivo ATP Measurement: Mice were pretreated with saline (0.9% NaCl) via tail vein injection for 15 minutes. Subsequently, 5 µL of tail blood was mixed with 45 µL of saline to minimize platelet activation. ATP baseline levels in the diluted blood samples were measured immediately using a luciferin-luciferase assay. ATP was quantified by mixing 50 µL of assay reagent with 50 µL of diluted blood in a white 96-well plate. Quantification was performed using a Glomax 96 microplate luminometer (Promega).
NAD+/NADH Assay
In vitro NAD+/NADH Extraction: After aspirating the culture medium from 24-well plates, 200 μL of 0.6 M perchloric acid (50439, Merck) was added for NAD+ determination, and 50% ethanol (1.00983, Merck) was used for NADH extraction. The extract was collected in 0.5 mL centrifuge tubes. The samples were heated with potassium hydroxide (06103, Merck) at 55°C for 10 minutes and then centrifuged at 15,000 g for 10 minutes at 4°C. The clear supernatant was diluted 1:10 in ice-cold 100 mm phosphate-buffered saline (pH 8.0). The precipitate from the perchloric acid extraction was used for protein concentration quantification.
In vivo NAD+/NADH Extraction: NAD was extracted from heart tissue using 0.6 M perchloric acid with a tissue grinder (Qiagen) and metal beads at 20 hz for 2 minutes at 4°C. The resulting mixture was centrifuged at 16,000 g for 10 minutes at 4°C to pellet the insoluble material, and the protein concentration was determined using the BCA method. The supernatant was diluted 1:100 in ice-cold 100 mm phosphate-buffered saline (pH 8.0) for NAD measurement. NADH was extracted from cardiac tissue using nitrogen-purged ice-cold extraction buffer (25 mm ammonium acetate (238074, Merck), 25 mm sodium hydroxide (415413, Merck), and 50% (v/v) acetonitrile (34851, Merck)). The lysate was mixed with ethanol-potassium hydroxide extraction buffer (250 mm potassium hydroxide, 50% (v/v) ethanol-potassium hydroxide) at a 1:1 (v/v) ratio and heated at 55°C for 10 minutes. The supernatant was diluted 1:50 in pre-cooled 100 mm phosphate buffer (pH 8.0) for NADH measurement.
NAD+ and NADH were immediately quantified after extraction using an enzyme cycling assay in a 96-well plate format. Briefly, 5 μL of NAD+ standard or diluted cell extract was mixed with 95 μL of cycling mixture (2% ethanol, 100 μg/mL ethanol dehydrogenase (49641, Merck), 10 μg/mL diaphorase (D5540, Merck), 20 μM resazurin (R7017, Merck), 10 μM flavin mononucleotide (F2253, Merck), 10 mm niacinamide (72340, Merck), and 0.1% bovine serum albumin in 100 mm phosphate-buffered saline pH 8.0). The cycling reaction was carried out at room temperature for 30 minutes. Resazurin accumulation was measured by excitation at 544 nm and emission at 590 nm, with quantification performed using a Glomax 96 microplate luminometer (Promega).
Reactive Oxygen Species (ROS) Detection
In vitro ROS Detection: Cells (2.5 × 10⁴) were seeded in black, clear-bottom 96-well plates and cultured overnight at 37°C. The medium was removed, and cells were gently washed with 1× buffer. The buffer was aspirated, and 100 μL of diluted DCFDA solution (HY-D0940, MCE) was added to each well. Cells were incubated with the diluted DCFDA solution for 45 minutes at 37°C in the dark. After removing the DCFDA solution, 100 μL of 1× buffer was added to each well. Samples were immediately read using a multimode microplate reader (Infinite 200, TECAN) with an excitation wavelength of 485 nm and an emission wavelength of 535 nm.
In vivo ROS Detection: Heart tissue homogenates were diluted 1:20 in ice-cold Locke’s buffer (FNN0071, Thermo Fisher) to maintain a final concentration of 2.5 mg tissue/500 mL. The reaction mixture included Locke’s buffer (1 mL, pH 7.4), 0.2 mL homogenate, and 10 mL DCFH-DA (5 mm), incubated at room temperature for 15 minutes to convert DCFH-DA into the fluorescent product DCF. The conversion was quantified using a spectrofluorometer with excitation at 484 nm and emission at 530 nm, and the results were measured using a Glomax 96 microplate luminometer (Promega).
Statistical Analysis
Data were derived from at least three independent experiments and are presented as mean ± standard deviation (SD). Comparisons between the two groups were performed using an independent samples t-test. For comparisons among three or more groups, one-way analysis of variance (ANOVA) was used, followed by Tukey’s HSD post-hoc test if significant differences were found. For non-normally distributed data or those with unequal variances, the Mann–Whitney U-test or Kruskal–Wallis H-test was applied. In bioinformatics analysis, outlier gene filtering was performed using metrics such as mean, variance, median, and median absolute deviation (MAD) to remove low-expression or minimally variable genes between samples. A systematic clustering dendrogram of the samples was plotted, and any significant outliers were excluded. Optimal power soft-threshold analysis was conducted to determine the adjacency function using a scale-free topology fit index (R2 > 0.9). The adjacency matrix aij= power(Sij, β)=ISijIβ was derived using the power function β, and continuous transformation of correlation coefficients provided the optimal soft threshold. Statistical analyses were conducted using GraphPad Prism 9 (GraphPad Software, Inc.) and R. A significance level of 0.05 was set for all tests, with a two-tailed p-value less than 0.05 considered statistically significant.
Results
GFGs Inhibit Myocardial Fibrosis and Cell Apoptosis in DCM Mice
Numerous studies have indicated the significant efficacy of ginkgo extract in alleviating DCM.39 Building on this, our study further investigates whether GFGs exhibit similar therapeutic effects. In a STZ-induced DCM mouse model, mice treated with GFGs (low, medium, high doses) showed a dose-dependent therapeutic effect. Compared to the control group (CTR), the model group (Model) mice exhibited elevated blood glucose levels and reduced body weight. However, all GFG-treated groups demonstrated effective blood glucose reduction and body weight gain compared to the model group (Figure 1A and B). Cardiac function was evaluated using echocardiography and electrocardiography. The model group showed increased LVIDd and LVIDs, with decreased ejection fraction (EF). In contrast, the GFG-treated groups displayed improved EF and reduced LVIDs and LVIDd (Figure 1C). Masson staining revealed significant collagen accumulation in the cardiac interstitium and around blood vessels in the model group compared to CTR, while GFG treatment significantly reduced this accumulation (Figure 1D). H&E staining indicated notable pathological changes in the cross-sectional and longitudinal sections of the model group’s hearts, with prominent myocardial cell hypertrophy and rupture. These pathological damages were markedly alleviated in the GFG-treated groups (Figure 1E). TUNEL assay further demonstrated a significant increase in apoptosis in the heart tissues of the model group compared to CTR, whereas GFG treatment significantly inhibited apoptosis (Figure 1F). These results suggest that GFGs effectively restore cardiac function and inhibit cell apoptosis in DCM mice.
 |
Figure 1 Improvement of Cardiac Function by GFG Treatment in Diabetic Mice. Notes: (A) Blood glucose levels were measured in all mouse groups using a glucometer. (B) The body weights of the mice were recorded across all groups. (C) Cardiac function was assessed using an echocardiogram to measure the LVIDs and LVIDd, and LVEF was calculated. (D) Masson’s trichrome staining was used to examine myocardial tissue lesions, with quantitative analysis of myocardial fibrosis extent (scale bar: 25μM). (E) H&E staining was conducted to assess myocardial tissue lesions (scale bar: 25μM). (F) TUNEL staining was performed to evaluate apoptosis in cardiac tissues (scale bar: 25μM). Data are presented as mean ± SD (n = 6; *p < 0.05, analyzed by ANOVA and Tukey’s multiple comparison test). |
GFGs May Inhibit DCM by Upregulating SIRT1
Ginkgo leaf extract is one of the most common and historically significant industrial herbal preparations, with its primary bioactive components, GFGs, widely recognized for their significant therapeutic effects on cardiovascular and cerebrovascular diseases. The identified active ingredients of GFGs include Quercetin, Kaempferol, Myricetin, Apigenin, Isorhamnetin, Luteolin, and Tamarixetin. Their molecular structures are detailed in Figure S1.38 Using the STITCH database, we identified 171 genes associated with the seven active ingredients of GFGs (Table S2). Further searching the DisGeNET database, we identified 220 genes related to DCM (Table S3). Matching GFGs-related genes with DCM-related genes, we identified 41 overlapping genes (Figure 2A). Utilizing Cytoscape software, we constructed an interaction network of GFGs’ active ingredients and these 41 overlapping target genes, comprising 49 nodes and 120 edges, encompassing 41 targets, 6 compounds, 1 drug, and 1 disease (Figure 2B). GO and KEGG enrichment analyses of the DCM-related targets of GFGs revealed that these target genes are primarily involved in BP, such as oxidative stress, apoptosis, and diabetic complications (Figure 2C and D).
 |
Figure 2 Identification and Validation of Key Molecular Targets of GFGs for Treating DCM. Notes: (A) Venn diagram showing the overlap between GFGs-related genes and DCM-related genes. (B) Component-target network diagram of GFGs, with red diamonds representing disease nodes, purple circles representing drug nodes, green V-shapes representing active component nodes, and blue rectangles representing target nodes. (C) GO enrichment analysis results for GFG targets. (D) KEGG enrichment analysis results for GFG targets. |
Next, we downloaded five DCM-related transcriptome datasets from the GEO database and processed the data using the “sva” R package to eliminate batch effects (Figure 3A and B). Differential expression analysis showed 547 genes were significantly differentially expressed in the DCM group compared to the control group, with 289 genes upregulated and 258 genes downregulated (Figure 3C and D). We then constructed a gene co-expression network using WGCNA, first removing outlier samples (Figure 4A) and constructing a sample dendrogram and trait heatmap (Figure 4B). Subsequently, an optimal soft threshold β=6 (R2=0.9) was used to establish a scale-free network (Figure 4C), and the validity test result was positive (Figure 4D). Merging highly correlated characteristic genes with phenotypes, we identified seven modules (Figure 4E). Figure 4F shows the TOM of genes used in the WGCNA analysis. Module-trait relationship analysis indicated that the red module had the highest correlation with DCM (Figure 4G), suggesting that the 358 genes in this module may be closely related to the development and progression of DCM.
 |
Figure 3 Analysis of DEGs from GEO Datasets for Critical Gene Expression Patterns in DCM. Notes: (A and B) Box plots of GEO data distribution before and after batch effect removal. (C) Volcano plot of DEGs between control and DCM samples. (D) Heatmap of DEGs between control and DCM samples. Control: n=23; DCM: n=21. |
 |
Figure 4 WGCNA of GEO Datasets for DCM. Notes: (A) Identification of abnormal samples; (B) Dendrogram of samples (top) and corresponding clinical features (bottom); (C) Selection of the optimal soft-thresholding power β, with β = 6 chosen to achieve both approximate scale-free topology fitting index (R² > 0.9) and optimal average connectivity; (D) Histogram of connectivity distribution (left) and scale-free topology (right) at β = 5; (E) Dendrogram of co-expressed modules, where each branch represents a gene and different colors indicate different co-expression modules; (F) Heatmap visualization of the co-expression network, with lighter colors representing lower co-expression connectivity and darker colors indicating higher co-expression connectivity; (G) Gene importance scores for different modules. Control: n=23, DCM: n=21. |
Further analysis of the intersections among GFGs active ingredient targets, Differentially Expressed Genes (DEGs), and WGCNA module genes revealed a single overlapping gene, SIRT1 (Figure 5A), whose expression is reduced in DCM tissues (Figure 5B). ROC analysis indicated that SIRT1 could serve as a potential predictive biomarker for DCM (Figure 5C). Previous studies have demonstrated that SIRT1 can mitigate the pathological progression of DCM by reducing ferroptosis.40 Moreover, our network analysis identified Myricetin and Quercetin as key regulators of SIRT1 activity. Molecular docking analysis using AutoDock software showed binding energies of −7.9 kcal/mol for Myricetin and −9.4 kcal/mol for Quercetin with SIRT1 (Figure 5D), suggesting that these compounds can stably bind to the active site of SIRT1 through hydrogen bonding and hydrophobic interactions.
 |
Figure 5 Potential targets of GFGs for treating DCM. Notes: (A) Venn diagram showing the overlap between targets of GFGs’ active components, DEGs, and WGCNA module genes; (B) Expression of SIRT1 in control and DCM groups; (C) ROC curve of SIRT1 in DCM samples; (D) Docking results of GFGs’ active components Myricetin and Quercetin with SIRT1, with active components shown in green. Control: n=23, DCM: n=21. |
In summary, these results suggest that GFGs may inhibit the progression of DCM by upregulating SIRT1 expression and modulating its deacetylation activity.
GFGs Improve DCM Energy Metabolism and Autophagy by Activating SIRT1
In our previous research, network pharmacology identified SIRT1 as a potential target for GFGs in the treatment of DCM. To screen for genes regulated by SIRT1, we first divided DCM samples from the GEO dataset into high and low SIRT1 expression groups and identified 74 DEGs through differential analysis (Figure 6A). Further correlation analysis with a threshold of |R| > 0.3 and p < 0.01 identified 322 genes related to SIRT1 expression (Figure 6B). Intersection analysis of these genes with DEGs between control and DCM groups from previous studies revealed two candidate genes: PRPSAP2 and TSPAN4 (Figure 6C). Correlation analysis showed that PRPSAP2 and TSPAN4 were significantly negatively correlated with SIRT1 expression in DCM samples (Figure 6D). Compared to control and high SIRT1 expression samples, TSPAN4 was significantly upregulated in DCM and low SIRT1 expression samples, while PRPSAP2 was downregulated in DCM samples but upregulated in low SIRT1 expression samples (Figure 6E). TSPAN4 upregulation has been reported in both spontaneous and induced myocardial infarction mouse models, leading us to select TSPAN4 for further study as a SIRT1 target.41
 |
Figure 6 Pathway Enrichment and Correlation Analyses of Biological Pathways Associated with SIRT1. Notes: (A) Volcano plot showing gene expression differences between high and low SIRT1 expression groups across five merged GEO datasets; (B) Heatmap of SIRT1 correlation analysis in DCM samples from the five merged GEO datasets; (C) Venn diagram illustrating the overlap among DEGs between high and low SIRT1 expression groups, DEGs between control and DCM groups, and SIRT1-related genes; (D) Correlation of PRPSAP2 and TSPAN4 expression with SIRT1 levels in DCM samples; (E) Expression levels of PRPSAP2 and TSPAN4 in high and low SIRT1 expression groups compared to control and DCM groups; (F) Venn diagram showing the intersection of transcription factors predicted to bind the TSPAN4 promoter by hTFtarget with genes that are lowly expressed in high SIRT1 samples; (G) Binding sites of transcription factor FOSL1 on the TSPAN4 promoter. Control: n=23, DCM: n=21. Low-SIRT1: n=11, High-SIRT1: n=10. |
We then investigated the molecular mechanism by which SIRT1 inhibits TSPAN4 expression. Previous studies have shown that SIRT1 can influence its target genes’ expression by deacetylating and regulating transcription factors’ activity.42 Using hTFtarget, we predicted potential transcription factors binding to the TSPAN4 promoter and identified FOSL1 as a candidate by intersecting with genes downregulated in high SIRT1 expression samples (Figure 6F). JASPAR database analysis confirmed potential binding sites for FOSL1 on the TSPAN4 promoter (Figure 6G). FOSL1 is known to act as a transcriptional activator and is upregulated in diabetes.43,44 Therefore, we aimed to elucidate whether FOSL1 is involved in the SIRT1-mediated regulation of TSPAN4 transcription.
Proteomic analysis of myocardial tissue from GFGs-treated DCM mice showed significant upregulation of SIRT1 and downregulation of FOSL1 and TSPAN4 (Figure 7A and B). When GFGs-treated DCM samples were grouped by high and low SIRT1 expression, differential protein analysis revealed 78 proteins significantly upregulated and 84 proteins significantly downregulated in the high SIRT1 expression group. Both FOSL1 and TSPAN4 were markedly downregulated in the high SIRT1 expression group, further validating the SIRT1/FOSL1/TSPAN4 signaling axis (Figure 7C and D). GO and KEGG functional enrichment analyses indicated that these differentially expressed proteins were primarily involved in BP such as energy metabolism, autophagy, and apoptosis (Figure 7E and F). These results support the hypothesis that GFGs promote the deacetylation of transcription factor FOSL1 by upregulating SIRT1, thereby inhibiting TSPAN4 transcriptional activation. They also highlight the critical role of the SIRT1/FOSL1/TSPAN4 signaling axis in improving energy metabolism and autophagy homeostasis in DCM.
 |
Figure 7 Pathway Enrichment and Correlation Analyses for SIRT1-Associated Biological Pathways. Notes: (A) Volcano plot showing differential protein expression in myocardial tissues of DCM mice treated with and without GFGs, highlighting significant upregulation of SIRT1 and notable downregulation of FOSL1 and TSPAN4 after GFGs treatment; (B) Heatmap of the top 50 upregulated or downregulated proteins in myocardial tissues of DCM mice with and without GFGs treatment; (C) Volcano plot of differential protein expression between high and low SIRT1 expression groups in myocardial tissues of GFGs-treated DCM mice, showing significant downregulation of FOSL1 and TSPAN4 in the high SIRT1 expression group; (D) Heatmap of the top 50 upregulated or downregulated proteins between high and low SIRT1 expression groups in myocardial tissues of GFGs-treated DCM mice; (E) GO enrichment analysis of differentially expressed proteins between high and low SIRT1 expression groups; (F) KEGG enrichment analysis of differentially expressed proteins between high and low SIRT1 expression groups. Low-SIRT1: n=3, High-SIRT1: n=3. |
SIRT1 Deacetylates FOSL1 to Inhibit TSPAN4 Transcription
To further validate the bioinformatics analysis results, we investigated the regulatory mechanism among SIRT1, FOSL1, and TSPAN4 using a high-glucose-induced DCM H9c2 cell model. We successfully established SIRT1 overexpression and knockdown cell lines using lentiviral technology (Figure 8A). WB analysis revealed that, compared to the control group (CTR), the high-glucose-treated group (HG) showed increased protein expression of TSPAN4 and FOSL1, while SIRT1 expression was decreased. Compared to the high-glucose-treated control group (HG+shNC), the SIRT1 knockdown group (HG+shSIRT1) exhibited significantly increased TSPAN4 and FOSL1 protein levels and decreased SIRT1 expression. Conversely, in the SIRT1 overexpression group (HG+OE-SIRT1), TSPAN4 and FOSL1 protein levels were significantly reduced, and SIRT1 expression was significantly increased compared to the corresponding control (HG+OE-NC) (Figure 8B).
 |
Figure 8 Inhibition of TSPAN4 Transcriptional Activity by SIRT1. Notes: (A) WB analysis of SIRT1 protein levels in H9c2 cells; (B) WB analysis of SIRT1, TSPAN4, and FOSL1 protein levels; (C) Immunofluorescence staining showing intracellular localization of FOSL1 and SIRT1 (scale bar: 25 μm); (D) Acetylation analysis of FOSL1 in H9c2 cells; (E) Chromatin IP assay assessing the binding ability of transcription factor FOSL1 to TSPAN4 DNA; (F) Luciferase assay measuring TSPAN4 promoter activity. Data are presented as mean ± SD (cell experiments performed in triplicate; *p < 0.05, **p < 0.01, analyzed using ANOVA and Tukey’s multiple comparison test). |
Immunofluorescence detection showed that SIRT1 and FOSL1 co-localized in the cell nucleus (Figure 8C). Further, IP analysis revealed that, compared to the CTR group, the acetylation level of FOSL1 was increased in the high-glucose-treated group (HG). In the SIRT1 knockdown group (HG+shSIRT1), FOSL1 acetylation levels were significantly higher than in the HG+shNC group, whereas in the SIRT1 overexpression group (HG+OE-SIRT1), FOSL1 acetylation levels were significantly lower than in the HG+OE-NC group (Figure 8D).
Chromatin IP assays indicated that the binding rate of FOSL1 to the TSPAN4 promoter was increased in the HG group compared to the CTR group. In the SIRT1 knockdown group (HG+shSIRT1), the binding rate was significantly higher than in the HG+shNC group, while in the SIRT1 overexpression group (HG+OE-SIRT1), the binding rate was significantly lower than in the HG+OE-NC group (Figure 8E). Fluorescent promoter activity assays further confirmed that, compared to the CTR group, the luminescence values were increased in the HG group. In the SIRT1 knockdown group (HG+shSIRT1), luminescence values were significantly higher than in the HG+shNC group, while in the SIRT1 overexpression group (HG+OE-SIRT1), luminescence values were significantly lower than in the HG+OE-NC group (Figure 8F). These results indicate that SIRT1 inhibits TSPAN4 transcription by deacetylating the transcription factor FOSL1, thereby reducing its binding to the TSPAN4 promoter and suppressing TSPAN4 transcriptional activity.
Characterization of Nanoliposomes Loaded with GFGs
Previous studies have demonstrated that GFGs effectively alleviate symptoms of diabetic myocarditis in mice. Liposomes, as efficient drug delivery carriers, have been widely utilized in drug delivery.45 To achieve effective in vivo delivery of GFGs, this study prepared and characterized nanoliposomes Loaded with GFGs. GFGs-loaded liposomes (GFGs Lipo) were produced using the thin-film hydration method and extruded through polycarbonate membranes of various sizes. DLS analysis revealed that the hydrodynamic diameter of GFGs Lipo was approximately 142.0 nm (Figure 9A), while the diameter of drug-free Lipo was about 134.3 nm (Figure 9A). The zeta potential values of GFGs Lipo and Lipo were −3.8 mV and −8.2 mV, respectively (Figure 9B). Additionally, TEM was used to determine the morphology and structure of GFGs Lipo and Lipo. TEM images showed that Lipo particles were typical hollow spherical structures, whereas GFGs Lipo particles contained nanomaterial, indicating successful encapsulation of GFGs by the liposomes (Figure 9C). EE% testing showed that the encapsulation rate of GFGs Lipo reached 82% (Figure 9D). Release kinetics studies demonstrated that 87% of free GFGs were released within 72 hours, whereas the release rate of liposome-encapsulated GFGs was 49% over the same period (Figure 9E). Stability testing indicated that after one month of storage at 4 ± 2°C, the particle size of the liposomes showed minimal variation (Figure 9F). These results suggest that GFGs-loaded nanoliposomes possess excellent physical stability and outstanding drug carrier capabilities.
 |
Figure 9 Preparation and characterization of GFGs liposomal nanovesicles. Notes: (A and B) Measurement of the hydrodynamic diameter and zeta potential of GFGs Lipo and Lipo using DLS; (C) TEM images of GFGs Lipo and Lipo, scale bar represents 100 nm; (D) EE% of butyrate in GFGs Lipo and Lipo; (E) In vitro release of free GFGs and GFGs-loaded liposomes in PBS at pH 7.4 and 37 ± 0.5°C; (F) Storage stability of liposomes stored at 4°C for an extended period. Data are presented as mean ± SD (cell experiments performed in triplicate; *p < 0.05, analyzed using ANOVA and Tukey’s multiple comparison test). |
GFGs Liposomes Modulate SIRT1 to Enhance Cardiomyocyte Energy Metabolism and Autophagic Homeostasis
In evaluating the therapeutic effects of GFGs Lipo using the DCM H9c2 cell model, WB analysis showed that, compared to plain Lipo, treatment with GFGs Lipo significantly increased SIRT1 protein expression, while FOSL1 and TSPAN4 expressions were significantly reduced. However, in the SIRT1 knockdown GFGs Lipo group (shSIRT1+GFGs Lipo), SIRT1 protein expression was lower, and FOSL1 and TSPAN4 expressions were increased compared to the control group treated only with GFGs Lipo (shNC+GFGs Lipo) (Figure 10A). Cell viability, assessed using the CCK-8 assay, was higher in the GFGs Lipo group compared to the Lipo group. Conversely, cell viability was lower in the shSIRT1+GFGs Lipo group compared to the shNC+GFGs Lipo group (Figure 10B). Cell cycle analysis revealed an increased proportion of H9c2 cells in the S phase and a decreased proportion in the G0/G1 phase in the GFGs Lipo group compared to the Lipo group. In contrast, the S phase proportion decreased and the G0/G1 phase proportion increased in the shSIRT1+GFGs Lipo group compared to the shNC+GFGs Lipo group (Figure 10C). Immunofluorescence detection showed an increase in the number of mitochondria and autophagosomes in H9c2 cells treated with GFGs Lipo compared to those treated with Lipo. However, these numbers decreased in the shSIRT1+GFGs Lipo group compared to the shNC+GFGs Lipo group (Figure 10D). Further analysis by WB revealed that the LC3II/I ratio was higher and P62 expression was lower in the GFGs Lipo group compared to the Lipo group; the opposite was observed in the shSIRT1+GFGs Lipo group compared to the shNC+GFGs Lipo group (Figure 10E). Energy metabolism measurements indicated that ATP and NAD+/NADH ratios were higher and ROS levels were lower in the GFGs Lipo group compared to the Lipo group. Conversely, ATP and NAD+/NADH ratios were lower and ROS levels were higher in the shSIRT1+GFGs Lipo group compared to the shNC+GFGs Lipo group (Figure 10F–H). These results suggest that GFGs liposomes improve cardiomyocyte energy metabolism and autophagic homeostasis by upregulating SIRT1, which in turn inhibits FOSL1 and TSPAN4. Moreover, knocking down SIRT1 can reverse the therapeutic effects of GFGs liposomes.
 |
Figure 10 Mechanism of SIRT1 Upregulation by GFGs-Loaded Liposomes. Notes: (A) WB analysis of SIRT1, TSPAN4, and FOSL1 protein levels; (B) CCK-8 assay measuring H9c2 cell viability; (C) Flow cytometry analysis of H9c2 cell changes; (D) Immunofluorescence staining showing autophagosome and mitochondria morphology; (E) WB analysis of key autophagy proteins LC3 and P62; (F–H) Enzyme-linked immunosorbent assay (ELISA) measuring ATP, NAD+/NADH, and ROS levels in H9c2 cells. Data are presented as mean ± SD (cell experiments performed in triplicate; *p < 0.05, ** p < 0.01, analyzed using ANOVA and Tukey’s multiple comparison test). |
Liposomal Nanoparticles Loaded with GFGs Enhance Cardiac Function in Diabetic Mice by Activating SIRT1
In the DCM model, the therapeutic effects of GFGs Lipo were assessed. Compared to the control group (CTR), the model group (Model) exhibited elevated blood glucose levels and reduced body weight. Treatment with GFGs Lipo significantly lowered blood glucose and increased body weight compared to the model group treated only with liposomes (Model+Lipo). When SIRT1 was knocked down (Model+shSIRT1+GFGs Lipo), blood glucose increased and body weight decreased compared to the control group treated with GFGs Lipo (Model+shNC+GFGs Lipo) (Figure 11A and B). Cardiac function was assessed using echocardiography, which showed a decrease in ejection fraction and an increase in LVIDd and LVIDs in the Model group compared to the control group (CTR). Compared to the Model+Lipo group, treatment with Model+GFGs Lipo significantly increased the ejection fraction and reduced LVIDs and LVIDd; in contrast, the Model+shSIRT1+GFGs Lipo group showed a decrease in ejection fraction and an increase in LVIDs and LVIDd compared to the Model+shNC+GFGs Lipo group (Figure 11C). Using Masson’s trichrome staining to analyze cardiac tissues, there was a significant increase in interstitial and perivascular collagen in the Model group compared to the control group (CTR). Compared to the Model+Lipo group, the Model+GFGs Lipo treatment significantly reduced collagen in the cardiac interstitium; in contrast, the collagen in the cardiac interstitium increased in the Model+shSIRT1+GFGs Lipo group compared to the Model+shNC+GFGs Lipo group (Figure 11D). H&E staining showed significant pathological structural changes and pronounced myocardial cell and hypertrophic myocardium rupture in the Model group. These pathological changes were significantly mitigated in the Model+GFGs Lipo group but exacerbated in the Model+shSIRT1+GFGs Lipo group (Figure 11E). TUNEL assays indicated increased apoptosis in the cardiac tissue of the Model group compared to CTR. Apoptosis was significantly reduced in the Model+GFGs Lipo group and increased in the Model+shSIRT1+GFGs Lipo group (Figure 11F). Further analysis showed a decrease in SIRT1 protein expression and an increase in FOSL1 and TSPAN4 expressions in the Model group compared to CTR. In the Model+GFGs Lipo group, SIRT1 expression increased, FOSL1 and TSPAN4 expressions decreased, the LC3II/I ratio increased, and P62 expression decreased compared to the Model+Lipo group. These changes were reversed in the Model+shNC+GFGs Lipo group, where SIRT1 expression decreased, and FOSL1 and TSPAN4 expressions increased (Figure 11G). Metabolic analysis showed that ATP and NAD+/NADH ratios were lower and ROS levels were higher in the Model group compared to CTR. In contrast, ATP and NAD+/NADH ratios increased and ROS levels decreased in the Model+GFGs Lipo group. These effects were reversed in the Model+shSIRT1+GFGs Lipo group (Figure 11H–J). These results indicate that GFG liposomes significantly improve cardiac function in diabetic mice by activating SIRT1, modulating key autophagy proteins, and altering metabolic profiles.
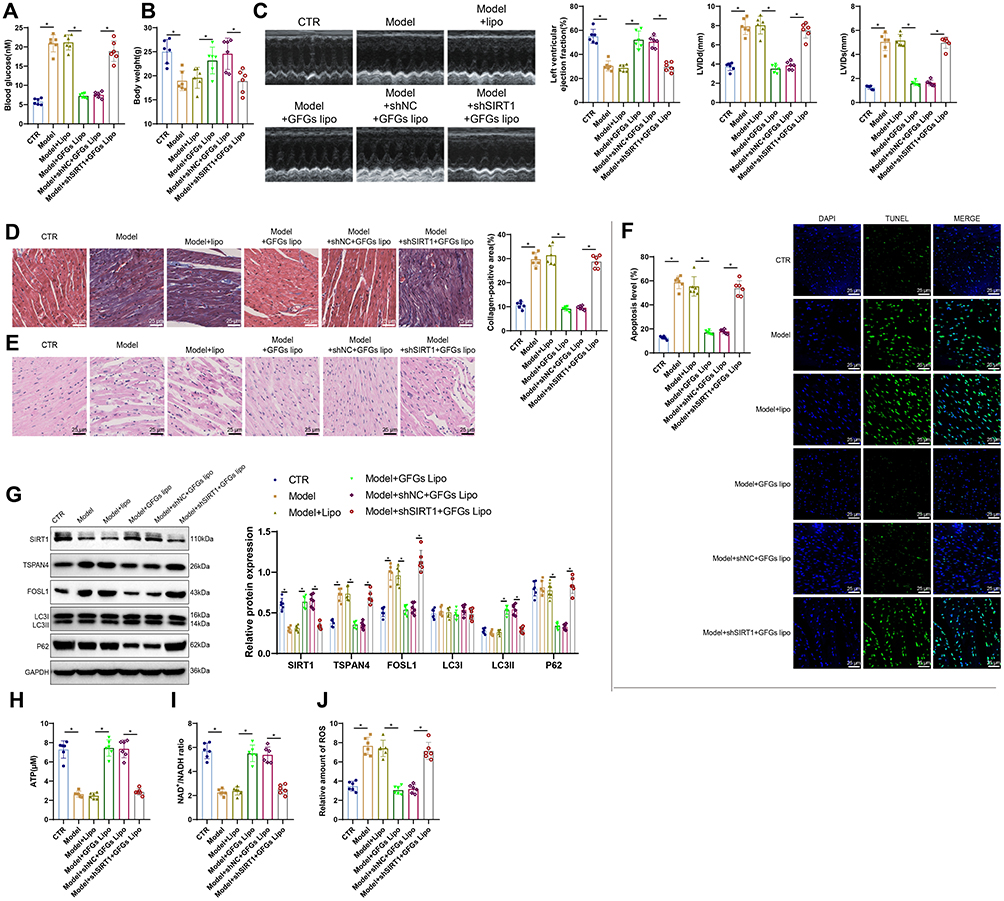 |
Figure 11 Improvement of Myocardial Function in Diabetic Mice by GFGs-Loaded Liposomes. Notes: (A) Blood glucose levels measured using a glucometer for each group of mice; (B) Body weight measurements of mice for each group; (C) Cardiac ultrasound imaging used to measure LVIDs and LVIDd, and to calculate LVEF; (D) Masson staining to assess cardiac tissue pathology in each group of mice, with quantification of cardiac fibrosis (scale bar: 25 μm); (E) H&E staining to evaluate cardiac tissue pathology (scale bar: 25 μm); (F) TUNEL staining to detect apoptosis in cardiac tissue (scale bar: 25 μm); (G) WB analysis of key autophagy proteins LC3 and P62; (H–J) ELISA measurements of ATP, NAD+/NADH, and ROS levels in H9c2 cells. Data are presented as mean ± SD (n = 6; *p < 0.05, analyzed using ANOVA and Tukey’s multiple comparison test). |
Discussion
Developing effective strategies for treating DCM, particularly those that regulate myocardial metabolism and cell survival at the molecular level, is critical for improving the prognosis of diabetic patients.46–48 In this study, GFGs delivered via liposomal nanoparticles successfully upregulated SIRT1 expression. This promoted deacetylation of the transcription factor FOSL1, subsequently suppressing TSPAN4 transcription, and effectively improved energy metabolism and autophagic imbalance in DCM. This discovery not only provides new insights into the treatment of DCM but also highlights the potential of nanotechnology in drug delivery. Consistency between cellular and animal experiment results (Table S4) underscores the reliability and efficacy of the GFG nanoparticle treatment strategy. Notably, these findings were validated in animal models, where significant improvements in cardiac function and reductions in cardiomyocyte apoptosis were observed. This consistency from in vitro to in vivo results supports the scientific basis of GFG nanoparticles as a promising therapeutic strategy and enhances the translational potential of the study, offering valuable insights for future clinical trial design.
GFGs, known for their pleiotropic effects, have been extensively reported in various disease models.49 However, reports on their mechanisms in DCM are relatively sparse. Previous studies have focused on their antioxidant and anti-inflammatory effects. Research has identified SIRT1, a NAD+-dependent deacetylase, as a regulator of energy metabolism and cellular survival through the deacetylation of multiple target proteins like FOXO and p53.50,51 SIRT1-related molecular pathways play critical roles in regulating cardiac metabolism and autophagy.52 This study revealed that GFGs significantly upregulate SIRT1 expression, enhancing myocardial survival signaling via SIRT1-mediated deacetylase activity. Moreover, we report for the first time that GFGs regulate the SIRT1/FOSL1/TSPAN4 axis, improving myocardial energy metabolism and autophagic balance. Despite the beneficial effects of SIRT1 upregulation in DCM, potential nonspecific effects may pose challenges in clinical applications. Future investigations will focus on the safety of this regulatory pathway.
The application of nanotechnology in drug delivery has made significant progress.53–55 Particularly liposomal nanoparticles, which are favored for their excellent biocompatibility and controllable release characteristics. These have been utilized to optimize the delivery of various drugs.56–58 These nanoparticles leverage their unique structural and physicochemical properties to enhance drug stability, reduce nonspecific distribution, and increase drug concentration at disease targets through targeted delivery systems.59 In this study, liposomal nanoparticles not only effectively encapsulated GFGs but also ensured efficient release and action in myocardial cells, a rarely reported phenomenon in previous research. Nanotechnology significantly enhanced the bioavailability and targeting of GFGs, overcoming challenges like poor solubility and low bioavailability encountered in conventional drug administration. This study demonstrates a novel strategy for activating SIRT1 through a nano delivery system, laying the foundation for future clinical applications. The results emphasize the potential of nanotechnology to enhance cardiovascular disease treatment strategies and provide new perspectives for optimizing cardiac metabolism and protection through drug interventions. These results underscore the substantial potential and applicative value of nanotechnology in enhancing treatment strategies for cardiovascular diseases.
In conclusion, this study demonstrates that the delivery of GFGs via liposomal nanoparticles effectively upregulates SIRT1, improving cardiac function and cellular metabolism in DCM by regulating the FOSL1/TSPAN4 axis. This innovative therapeutic strategy not only provides a new direction for DCM treatment but also showcases the potential of nanotechnology in traditional drug therapy applications. Future research should further explore the clinical application prospects of these nanoparticles and evaluate their safety and efficacy in treating other types of cardiovascular diseases (Figure 12).
 |
Figure 12 Upregulation of SIRT1 and Suppression of the FOSL1/TSPAN4 Axis by Liposomal Nanoparticles Delivering GFGs. |
Although this study achieved positive results, it also has some limitations. For example, while liposomal nanoparticles have improved drug targeting and bioavailability, their long-term biosafety and potential immunogenicity still need further evaluation in more comprehensive preclinical studies. Research has shown that “stealth” liposomal drugs, such as Doxil, which encapsulates doxorubicin in PEG liposomes, can be clinically used for the treatment of ovarian cancer, metastatic breast cancer, and various forms of multiple myeloma, significantly reducing the side effects of free doxorubicin (including chronic cardiomyopathy and congestive heart failure).60 However, the limited stability, toxicity, low drug-loading capacity, and complex manufacturing process of liposomes may result in long-term biosafety concerns. Particularly for chronic diseases requiring long-term treatment, such as DCM, the biodegradability and immunocompatibility of nanoparticles are key factors. Further in-depth evaluations of toxicity and immunogenicity will enhance the clinical relevance of this research. Long-term studies are also of great value in further confirming the therapeutic efficacy of GFG-loaded liposomes in treating DCM. Future research should explore the long-term effects of GFGs in DCM therapy.
Secondly, this study utilized the traditional thin-film hydration method for liposome preparation. Currently, there are many advanced techniques available, such as electrospray technology, which can offer advantages in liposome preparation and thereby enhance drug delivery efficiency.61 Existing studies have shown that polymeric excipients also hold potential advantages in many drug delivery systems. For example, polymer-based drug particle systems composed of natural polymers are non-toxic, allow repeated drug administration, and better protect the drug from degradation. This can improve drug EE% and extend drug release from the formulation.62 Therefore, subsequent studies will continue optimization by attempting to use natural polymer excipients, such as sodium alginate, as alternatives to lipids.
In addition, this study primarily relied on animal models. Although these models are quite reliable in simulating human diseases, they cannot completely replicate human physiological and pathological conditions. Addressing the limitations of the translational relevance of animal models to human physiology will provide a more balanced perspective. Therefore, the results of this study need to be further validated in animal models with high genetic similarity to humans, such as rhesus monkeys, or through clinical trials, to confirm their applicability and safety in humans. Especially considering that the effects may vary across different populations, it is necessary to include more diverse clinical trials in future studies to ensure the broad applicability of new treatment strategies and their eventual clinical implementation.
Conclusion
This study demonstrated that the delivery of GFGs via liposomal nanoparticles significantly upregulates SIRT1 expression and, through the regulation of the FOSL1/TSPAN4 signaling axis, successfully improves the pathological state of DCM. The results showed that GFG effectively inhibits cardiomyocyte apoptosis, improves energy metabolism and autophagy function, and significantly enhances cardiac function in diabetic mice, both in vitro and in vivo. This study is the first to reveal the SIRT1-mediated molecular mechanism of GFGs and demonstrates the great potential of nanotechnology in enhancing drug bioavailability and therapeutic efficacy. Although liposomal nanoparticles improve drug targeting and bioavailability, their long-term biosafety and potential immune responses require further evaluation in broader preclinical studies. Future research should further explore the clinical application value of this therapeutic strategy and assess its effects and safety in other types of cardiovascular diseases.
Abbreviations
ANOVA, Analysis of Variance; BP, Biological Process; CC, Cellular Component; DCM, Diabetic Cardiomyopathy; DEGs, Differentially Expressed Genes; DLS, Dynamic Light Scattering; EE%, Encapsulation Efficiency; EF, Ejection Fraction; FOSL1, FOS-like Antigen 1; GFGs, Ginkgo Flavone Glycosides; GO, Gene Ontology; H&E, Hematoxylin and Eosin; IP, Immunoprecipitation; KEGG, Kyoto Encyclopedia of Genes and Genomes; LVEDV, Left Ventricular End-diastolic Volume; LVEF, Left Ventricular Ejection Fraction; LVESV, Left Ventricular End-systolic Volume; LVIDd, Left Ventricular Internal Diameters in Diastole; LVIDs, Left Ventricular Internal Diameters in Systole; MF, Molecular Function; PBS, Phosphate-buffered Saline; PDI, Polydispersity Index; ROS, Reactive Oxygen Species; SIRT1, Sirtuin 1; STZ, Streptozotocin; SD, Standard Deviation; TEM, Transmission Electron Microscopy; TOM, Topological Overlap Matrix; TSPAN4, Tetraspanin 4; WB, Western Blot; WGCNA, Weighted Gene Co-Expression Network Analysis.
Data Sharing Statement
The datasets used or analyzed during the current study are available from the corresponding author on reasonable request.
Ethics Approval and Consent to Participate
All animal experiments were approved by the Animal Ethics Committee of General Hospital of Northern Theater Command.
Author Contributions
All authors made significant contributions to the reported work, whether in the conception, study design, execution, data acquisition, analysis, or interpretation; participated in drafting, revising, or critically reviewing the article; gave final approval of the version to be published; agreed on the journal to which the article has been submitted; and agreed to be accountable for all aspects of the work.
Funding
This study was supported by 2023 Provincial Joint Program - Applied Basic Research Project (2023JH2/101700122).
Disclosure
The authors declare no conflicts of interest in this work.
References
1. Fan Y, Yan Z, Li T, et al. Primordial drivers of diabetes heart disease: comprehensive insights into insulin resistance. Diabetes Metab J. 2024;48(1):19–36. doi:10.4093/dmj.2023.0110
2. Pedreanez A, Mosquera J, Munoz N, Robalino J, Tene D. Diabetes, heart damage, and angiotensin II. What is the relationship link between them? A minireview. Endocr Regul. 2022;56(1):55–65. doi:10.2478/enr-2022-0007
3. Tang Y, Feng M, Su Y, et al. Jmjd4 facilitates Pkm2 degradation in cardiomyocytes and is protective against dilated cardiomyopathy [published correction appears in Circulation. 2024 Jul 9;150(2):e64. doi: 10.1161/CIR.0000000000001268]. Circulation. 2023;147(22):1684–1704. doi:10.1161/CIRCULATIONAHA.123.064121
4. Wong NR, Mohan J, Kopecky BJ, et al. Resident cardiac macrophages mediate adaptive myocardial remodeling. Immunity. 2021;54(9):2072–2088.e7. doi:10.1016/j.immuni.2021.07.003
5. Hill MC, Kadow ZA, Long H, et al. Integrated multi-omic characterization of congenital heart disease. Nature. 2022;608(7921):181–191. doi:10.1038/s41586-022-04989-3
6. Ke J, Pan J, Lin H, Gu J. Diabetic cardiomyopathy: a brief summary on lipid toxicity. ESC Heart Fail. 2023;10(2):776–790. doi:10.1002/ehf2.14224
7. Boas R, Sappler N, von Stülpnagel L, et al. Periodic repolarization dynamics identifies ICD responders in nonischemic cardiomyopathy: a DANISH substudy. Circulation. 2022;145(10):754–764. doi:10.1161/CIRCULATIONAHA.121.056464
8. Abdellatif M, Sedej S, Kroemer G. NAD+ metabolism in cardiac health, aging, and disease. Circulation. 2021;144(22):1795–1817. doi:10.1161/CIRCULATIONAHA.121.056589
9. Chen R, Zhang H, Tang B, et al. Macrophages in cardiovascular diseases: molecular mechanisms and therapeutic targets. Signal Transduct Target Ther. 2024;9(1):130. doi:10.1038/s41392-024-01840-1
10. Surina S, Fontanella RA, Scisciola L, Marfella R, Paolisso G, Barbieri M. miR-21 in Human Cardiomyopathies [published correction appears in Front Cardiovasc Med. 2022 Apr 25;9:913429. doi: 10.3389/fcvm.2022.913429]. Front Cardiovasc Med. 2021;8:767064. doi:10.3389/fcvm.2021.767064
11. Kulić Ž, Ritter T, Röck B, Elsäßer J, Schneider H, Germer S. A detailed view on the proanthocyanidins in Ginkgo extract EGb 761. Planta Med. 2022;88(5):398–404. doi:10.1055/a-1379-4553
12. Bampali E, Germer S, Bauer R, Kulić Ž. HPLC-UV/HRMS methods for the unambiguous detection of adulterations of Ginkgo biloba leaves with Sophora japonica fruits on an extract level. Pharm Biol. 2021;59(1):438–443. doi:10.1080/13880209.2021.1910717
13. Tao Y, Zhu F, Pan M, Liu Q, Wang P. Pharmacokinetic, metabolism, and metabolomic strategies provide deep insight into the underlying mechanism of Ginkgo biloba Flavonoids in the treatment of cardiovascular disease. Front Nutr. 2022;9:857370. doi:10.3389/fnut.2022.857370
14. Luo G, Yang Y, Wang L. Driving rural industry revitalization in the digital economy era: exploring strategies and pathways in China. PLoS One. 2023;18(9):e0292241. doi:10.1371/journal.pone.0292241
15. Moreau JP, Eck CR, McCabe J, Skinner S. Absorption, distribution et élimination de l’extrait marqué de feuilles de Ginkgo biloba chez le rat [Absorption, distribution and elimination of a labelled extract of Ginkgo biloba leaves in the rat]. Presse Med. 1986;15(31):1458–1461.
16. Costantino S, Mengozzi A, Velagapudi S, et al. Treatment with recombinant Sirt1 rewires the cardiac lipidome and rescues diabetes-related metabolic cardiomyopathy. Cardiovasc Diabetol. 2023;22(1):312. doi:10.1186/s12933-023-02057-2
17. Wang AJ, Wang S, Wang BJ, et al. Epigenetic regulation associated with Sirtuin 1 in complications of diabetes mellitus. Front Endocrinol. 2021;11:598012. doi:10.3389/fendo.2020.598012
18. Jin Q, Zhu Q, Wang K, Chen M, Li X. Allisartan isoproxil attenuates oxidative stress and inflammation through the SIRT1/Nrf2/NF‑κB signalling pathway in diabetic cardiomyopathy rats. Mol Med Rep. 2021;23(3):215. doi:10.3892/mmr.2021.11854
19. Wen Y, Geng L, Zhou L, Pei X, Yang Z, Ding Z. Betulin alleviates on myocardial inflammation in diabetes mice via regulating Siti1/NLRP3/NF-κB pathway. Int Immunopharmacol. 2020;85:106653. doi:10.1016/j.intimp.2020.106653
20. Ren BC, Zhang YF, Liu SS, et al. Curcumin alleviates oxidative stress and inhibits apoptosis in diabetic cardiomyopathy via Sirt1-Foxo1 and PI3K-Akt signalling pathways. J Cell Mol Med. 2020;24(21):12355–12367. doi:10.1111/jcmm.15725
21. Diao J, Zhao H, You P, et al. Rosmarinic acid ameliorated cardiac dysfunction and mitochondrial injury in diabetic cardiomyopathy mice via activation of the SIRT1/PGC-1α pathway. Biochem Biophys Res Commun. 2021;546:29–34. doi:10.1016/j.bbrc.2021.01.086
22. Wang H, Chen L, Yang B, et al. Structures, sources, identification/quantification methods, health benefits, bioaccessibility, and products of isorhamnetin glycosides as phytonutrients. Nutrients. 2023;15(8):1947. doi:10.3390/nu15081947
23. Han H, Dong L, Zhang W, et al. Ginkgo biloba GbbZIP08 transcription factor is involved in the regulation of flavonoid biosynthesis. J Plant Physiol. 2023;287:154054. doi:10.1016/j.jplph.2023.154054
24. Liu Q, Zou J, Chen Z, He W, Wu W. Current research trends of nanomedicines. Acta Pharm Sin B. 2023;13(11):4391–4416. doi:10.1016/j.apsb.2023.05.018
25. Bangham AD, Standish MM, Watkins JC. Diffusion of univalent ions across the lamellae of swollen phospholipids. J mol Biol. 1965;13(1):238–252. doi:10.1016/s0022-2836(65)80093-6
26. Ghanbarzadeh S, Valizadeh H, Zakeri-Milani P. Application of response surface methodology in development of sirolimus liposomes prepared by thin film hydration technique. Bioimpacts. 2013;3(2):75–81. doi:10.5681/bi.2013.016
27. Ashizawa K. Nanosize particle analysis by dynamic light scattering (DLS). Yakugaku Zasshi. 2019;139(2):237–248. doi:10.1248/yakushi.18-00171-1
28. Hirbod S, Nafisi S, Maibach HI. RNA loading on nano-structured hyperbranched β-Cyclodextrin. Avicenna J Med Biotechnol. 2018;10(1):15–21.
29. Gao N, Gai Y, Meng L, et al. Development of neutralization breadth against diverse HIV-1 by increasing Ab-Ag interface on V2. Adv Sci. 2022;9(15):e2200063. doi:10.1002/advs.202200063
30. Zhang X, Ke PX, Yuan X, Zhang GP, Chen WL, Zhang GS. Forskolin protected against streptozotocin-induced diabetic cardiomyopathy via inhibition of oxidative stress and cardiac fibrosis in mice. Biomed Res Int. 2021;2021:8881843. doi:10.1155/2021/8881843
31. Pan L, Lu Y, Li Z, et al. Ginkgo biloba extract EGb761 attenuates bleomycin-induced experimental pulmonary fibrosis in mice by regulating the balance of M1/M2 macrophages and nuclear factor Kappa B (NF-κB)-mediated cellular apoptosis. Med Sci Monit. 2020;26:e922634. doi:10.12659/MSM.922634
32. Yu T, Xing Y, Gao Q, et al. Ginkgo biloba extract drives gut flora and microbial metabolism variation in a mouse model of Alzheimer’s disease. Pharmaceutics. 2023;15(12):2746. doi:10.3390/pharmaceutics15122746
33. Chen J, Ou Z, Gao T, et al. Ginkgolide B alleviates oxidative stress and ferroptosis by inhibiting GPX4 ubiquitination to improve diabetic nephropathy. Biomed Pharmacother. 2022;156:113953. doi:10.1016/j.biopha.2022.113953
34. Lee B, Roh JS, Jeong H, et al. Ginkgo biloba extract ameliorates skin fibrosis in a bleomycin-induced mouse model of systemic sclerosis. Anim Cells Syst. 2024;28(1):152–160. doi:10.1080/19768354.2024.2337761
35. Zhu N, Zhu L, Huang B, Xiang W, Zhao X. Galectin-3 inhibition ameliorates streptozotocin-induced diabetic cardiomyopathy in mice. Front Cardiovasc Med. 2022;9:868372. doi:10.3389/fcvm.2022.868372
36. Abdesselem H, Madani A, Hani A, et al. SIRT1 limits adipocyte hyperplasia through c-Myc inhibition. J Biol Chem. 2016;291(5):2119–2135. doi:10.1074/jbc.M115.675645
37. Han S, Zhang X, Li Z, et al. A ginsenoside G-Rg3 PEGylated long-circulating liposome for hyperglycemia and insulin resistance therapy in streptozotocin-induced type 2 diabetes mice. Eur J Pharm Biopharm. 2024;201:114350. doi:10.1016/j.ejpb.2024.114350
38. Xiao G, Lyu M, Wang Y, et al. Ginkgo Flavonol Glycosides or Ginkgolides tend to differentially protect myocardial or cerebral ischemia-reperfusion injury via regulation of TWEAK-Fn14 signaling in heart and brain. Front Pharmacol. 2019;10:735. doi:10.3389/fphar.2019.00735
39. Yang X, Zhao X, Liu Y, et al. Ginkgo biloba extract protects against diabetic cardiomyopathy by restoring autophagy via adenosine monophosphate-activated protein kinase/mammalian target of the rapamycin pathway modulation. Phytother Res. 2023;37(4):1377–1390. doi:10.1002/ptr.7746
40. Tang YJ, Zhang Z, Yan T, et al. Irisin attenuates type 1 diabetic cardiomyopathy by anti-ferroptosis via SIRT1-mediated deacetylation of p53. Cardiovasc Diabetol. 2024;23(1):116. doi:10.1186/s12933-024-02183-5
41. Zheng Y, Lang Y, Qi B, Li T. TSPAN4 and migrasomes in atherosclerosis regression correlated to myocardial infarction and pan-cancer progression. Cell Adh Migr. 2023;17(1):14–19. doi:10.1080/19336918.2022.2155337
42. Dong G, Wang B, An Y, et al. SIRT1 suppresses the migration and invasion of gastric cancer by regulating ARHGAP5 expression. Cell Death Dis. 2018;9(10):977. doi:10.1038/s41419-018-1033-8
43. Zhang M, Hoyle RG, Ma Z, et al. FOSL1 promotes metastasis of head and neck squamous cell carcinoma through super-enhancer-driven transcription program. Mol Ther. 2021;29(8):2583–2600. doi:10.1016/j.ymthe.2021.03.024
44. Zhou C, Wang F, Ma H, et al. Silencing of FOS-like antigen 1 represses restenosis via the ERK/AP-1 pathway in type 2 diabetic mice. Diab Vasc Dis Res. 2021;18(6):14791641211058855. doi:10.1177/14791641211058855
45. Brody LP, Sahuri-Arisoylu M, Parkinson JR, et al. Cationic lipid-based nanoparticles mediate functional delivery of acetate to tumor cells in vivo leading to significant anticancer effects. Int J Nanomed. 2017;12:6677–6685. doi:10.2147/IJN.S135968
46. Lopaschuk GD, Karwi QG, Tian R, Wende AR, Abel ED. Cardiac energy metabolism in heart failure. Circ Res. 2021;128(10):1487–1513. doi:10.1161/CIRCRESAHA.121.318241
47. Fang X, Ardehali H, Min J, Wang F. The molecular and metabolic landscape of iron and ferroptosis in cardiovascular disease. Nat Rev Cardiol. 2023;20(1):7–23. doi:10.1038/s41569-022-00735-4
48. Huo S, Wang Q, Shi W, et al. ATF3/SPI1/SLC31A1 signaling promotes Cuproptosis induced by advanced glycosylation end products in diabetic myocardial injury. Int J mol Sci. 2023;24(2):1667. doi:10.3390/ijms24021667
49. Guo J, Tang W, Tang W, et al. Research progress on the types, functions, biosynthesis, and metabolic regulation of ginkgo terpenoids. Plant Physiol Biochem. 2024;212:108754. doi:10.1016/j.plaphy.2024.108754
50. Wang W, Li Y, Zhang Y, et al. SIRT1 mediates the inhibitory effect of Dapagliflozin on EndMT by inhibiting the acetylation of endothelium Notch1. Cardiovasc Diabetol. 2023;22(1):331. doi:10.1186/s12933-023-02040-x
51. Patra S, Singh A, Praharaj PP, et al. SIRT1 inhibits mitochondrial hyperfusion associated mito-bulb formation to sensitize oral cancer cells for apoptosis in a mtROS-dependent signalling pathway. Cell Death Dis. 2023;14(11):732. doi:10.1038/s41419-023-06232-x
52. Li W, Shen X, Feng S, et al. BRD4 inhibition by JQ1 protects against LPS-induced cardiac dysfunction by inhibiting activation of NLRP3 inflammasomes. Mol Biol Rep. 2022;49(9):8197–8207. doi:10.1007/s11033-022-07377-2
53. Duan H, Liu Y, Gao Z, Huang W. Recent advances in drug delivery systems for targeting cancer stem cells. Acta Pharm Sin B. 2021;11(1):55–70. doi:10.1016/j.apsb.2020.09.016
54. Manescu Paltanea V, Paltanea G, Antoniac I, Vasilescu M. Magnetic nanoparticles used in oncology. Materials. 2021;14(20):5948. doi:10.3390/ma14205948
55. Xiang J, Zhao R, Wang B, et al. Advanced nano-carriers for anti-tumor drug loading. Front Oncol. 2021;11:758143. doi:10.3389/fonc.2021.758143
56. Tenchov R, Bird R, Curtze AE, Zhou Q. Lipid nanoparticles─from liposomes to mRNA vaccine delivery, a landscape of research diversity and advancement. ACS Nano. 2021;15(11):16982–17015. doi:10.1021/acsnano.1c04996
57. Sun L, Liu H, Ye Y, et al. Smart nanoparticles for cancer therapy. Signal Transduct Target Ther. 2023;8(1):418. doi:10.1038/s41392-023-01642-x
58. Nasir A, Khan A, Li J, et al. Nanotechnology, A tool for diagnostics and treatment of cancer. Curr Top Med Chem. 2021;21(15):1360–1376. doi:10.2174/1568026621666210701144124
59. Deng S, Gu J, Jiang Z, et al. Application of nanotechnology in the early diagnosis and comprehensive treatment of gastrointestinal cancer. J Nanobiotechnology. 2022;20(1):415. doi:10.1186/s12951-022-01613-4
60. Barenholz Y. Doxil®--the first FDA-approved nano-drug: lessons learned. J Control Release. 2012;160(2):117–134. doi:10.1016/j.jconrel.2012.03.020
61. Ji Y, Zhao H, Liu H, Zhao P, Yu DG. Electrosprayed stearic-acid-coated ethylcellulose microparticles for an improved sustained release of anticancer drug. Gels. 2023;9(9):700. doi:10.3390/gels9090700
62. Frent OD, Vicas LG, Duteanu N, et al. Sodium alginate-natural microencapsulation material of polymeric microparticles. Int J mol Sci. 2022;23(20):12108. doi:10.3390/ijms232012108
 © 2025 The Author(s). This work is published and licensed by Dove Medical Press Limited. The
full terms of this license are available at https://www.dovepress.com/terms.php
and incorporate the Creative Commons Attribution
- Non Commercial (unported, 4.0) License.
By accessing the work you hereby accept the Terms. Non-commercial uses of the work are permitted
without any further permission from Dove Medical Press Limited, provided the work is properly
attributed. For permission for commercial use of this work, please see paragraphs 4.2 and 5 of our Terms.
© 2025 The Author(s). This work is published and licensed by Dove Medical Press Limited. The
full terms of this license are available at https://www.dovepress.com/terms.php
and incorporate the Creative Commons Attribution
- Non Commercial (unported, 4.0) License.
By accessing the work you hereby accept the Terms. Non-commercial uses of the work are permitted
without any further permission from Dove Medical Press Limited, provided the work is properly
attributed. For permission for commercial use of this work, please see paragraphs 4.2 and 5 of our Terms.