")
Back to Journals » Journal of Pain Research » Volume 18
Local Structural Indices Changes During Different Periods of Postherpetic Neuralgia: A Graphical Study in Structural Covariance Networks
Authors Xiong J , Gu L, Jiang X, Kuang H, Lv H, Li Z, Xie Y, Luo Q, Jiang J
Received 9 January 2025
Accepted for publication 28 February 2025
Published 11 March 2025 Volume 2025:18 Pages 1175—1187
DOI https://doi.org/10.2147/JPR.S515047
Checked for plagiarism Yes
Review by Single anonymous peer review
Peer reviewer comments 2
Editor who approved publication: Professor King Hei Stanley Lam
Jiaxin Xiong,1,* Lili Gu,2,* Xiaofeng Jiang,1 Hongmei Kuang,1 Huiting Lv,1 Zihan Li,1 Yangyang Xie,1 Qing Luo,1 Jian Jiang1
1Department of Radiology, The 1st Affiliated Hospital, Jiangxi Medical College, Nanchang University, Nanchang, Jiangxi, People’s Republic of China; 2Department of Pain, The 1st Affiliated Hospital, Jiangxi Medical College, Nanchang University, Nanchang, Jiangxi, People’s Republic of China
*These authors contributed equally to this work
Correspondence: Jian Jiang, Department of Radiology, The 1 st Affiliated Hospital, Jiangxi Medical College, Nanchang University, 17 Yongwaizheng Street, Nanchang, Jiangxi, 330006, People’s Republic of China, Tel +86 13576129759, Email [email protected]
Purpose: In this study, we aim to explore the changes in network graph theory indices of structural covariance networks (SCNs) in PHN patients with different disease durations.
Patients and Methods: High-resolution T1 magnetic resonance images were collected from 109 subjects. We constructed SCNs based on cortical thickness data and analyzed the changes in global and regional network measures of PHN patients and herpes zoster (HZ) patients, and get hubs of each group.
Results: (1) PHN patients with a disease duration > 6 months had reduced global efficiency (P=0.035) and increased characteristic shortest path length (P=0.028). (2) Nodal efficiency of the right pars opercularis was greater in both HZ and PHN patients with a disease duration of 1 to 3 months (P< 0.001); in PHN patients with a disease duration > 6 months, the nodal degree of the left pars triangularis and nodal efficiency of the right middle temporal gyrus were greater (P< 0.001). (3) The right supramarginal gyrus was the common hub of healthy controls (HCs) and HZ patients, the right pars opercularis was the common hub of HZ patients and PHN patients with a disease duration of 1 to 3 months, and the bilateral superior frontal gyrus was the common hub of HZ patients and PHN patients with a disease duration > 6 months.
Conclusion: There have changes in SCN indices in PHN patients with different disease durations. PHN patients with a disease duration > 6 months had increased SCN integration and diminished information transfer capability between nodes, which complemented the topological properties of previous PHN networks. Eglobal and Lp can be considered as potential imaging markers for future clinical restaging of PHN.
Keywords: herpes zoster, postherpetic neuralgia, structural covariance network, graph theory, small world, cortical thickness
Introduction
Herpes zoster (HZ) is an infectious skin disease caused by reactivation of the varicella-zoster virus (vzv).1 Postherpetic neuralgia (PHN), one of the most common and serious complications of HZ, is defined as pain that lasts for 1 month or more after the HZ rash has healed.2 With high prevalence3 and multiple burdens such as physical pain and psychological unhappiness,4 There is no treatment that can cure PHN. Neuroplasticity underlies the production of PHN and may involve both peripheral and central mechanisms.5
Magnetic resonance imaging (MRI) is a technique can be used to study the central pathogenesis. PHN-related brain MRI studies have found that the some indices such as amplitude of low-frequency fluctuation, gray matter volume and cortical thickness changed in some regions such as medial prefrontal cortical, frontal lobe and middle temporal gyrus.6–8These brain regions are associated with cognitive and emotion regulation.9,10 The above studies mainly focused on the brain regions rather than the interconnectedness of brain regions throughout the brain.
Graph theory is a mathematical tool for calculating the topological properties of networks and helps in the quantitative analysis of changes in human brain networks. Mainly using resting-state functional MRI to statistically analyze the brain networks of patients with PHN and HZ recently, researchers have found that there were abnormal changes in the network properties such as global and local efficiency,11,12 which suggests abnormalities in brain connectivity at the network level. However, PHN is a chronic pain disorder. According to the International Association for the Study of Pain (IASP), chronic pain is defined as “pain that persists or recurs for longer than three months.”13 In order to study the properties of brain networks in a large time scale, we can get more stable results by analyzing networks constructed on the basis of structural metrics. Structural covariance network (SCN) is such a network construction methodology. SCN is a method used to explore the interconnectivity of indicators of brain structure (eg, cortical thickness or gray matter volume between brain regions) at the group level14 and can reflect synchronization between brain regions in structural development.15 It is based on stable measurements and structural image data collected over a long time, so it is very suitable for measuring the properties of brain networks reflecting large-scale neural events.
In previous studies, there were few brain regions where PHN patients had consistent findings in terms of structure.16–18 Furthermore, one study of the functional network in PHN patients found that its local efficiency was reduced,11 but it was not observed in another similar study.12 These results suggested that there may be structural or functional differences in PHN patients with different disease durations. In contrast to the previously mentioned definition of PHN more than 1 month after healing of the HZ, the World Health Organization and the International Association for the Study of Pain Special Interest Group on Neuropathic Pain define PHN as pain that starts in the HZ period or lasts ≥3 months after healing.19 For therapy, short-term spinal cord stimulation is more effective for patients with PHN in the early stages (<6 months) or even with a disease duration of less than 3 months.20 Based on the findings of these studies, we hypothesized that there may be differences in the structural properties of the brain in patients with PHN of different disease duration.
Therefore, in this study, we constructed SCNs for three populations —— HC, PHN and HZ patients. Based on some of the previous studies suggesting that certain clinical manifestations and outcomes differ between PHN patients at the 3 and 6 months disease duration, PHN patients were further divided into three groups with disease durations of 1, 3, and 6 months. We analyzed whether there were any differences in network topology attributes between these groups. We hypothesized that at least there were differences in global topological properties between the PHN patients with a disease duration greater than 6 months and HC. In particular, significant changes in SCN properties may occur in brain regions associated with cognitive and emotional control.
Methods
Participants
The study subjects were patients with HZ and PHN attending the pain department of the First Affiliated Hospital of Nanchang University. Sex, age, disease duration, admission visual analog scale (VAS) score, and site of onset were collected on the first day of patient admission. The Hamilton Depression Scale (HAMD)21 and Hamilton Anxiety Scale (HAMA)22 were used to assess subjects for depression and anxiety separately, and high-resolution T1 structural MRI scans were subsequently performed on the patients.
Inclusion criteria for patients with HZ and PHN were as follows: (1) right-handed; (2) HZ was identified as the presence of herpes within 2 weeks of the onset of herpes and the herpes outbreak had not subsided; PHN was identified as the presence of herpes lesions that had healed and lasted longer than 1 month (3) diagnosis determined by two experienced clinicians in the pain department according to the International Association for the Study of Pain criteria;23 and (4) VAS score≥5. Exclusion criteria were as follows: (1) other types of chronic pain or neurological disorders; (2) diagnosis of mental or psychological illness; (3) presence of substantial brain lesions; and (4) MRI contraindications (ferromagnetic implants in the body, claustrophobia). Inclusion criteria for HCs were as follows: (1) right-handed; (2) age matched to included HZ and PHN (50–80 years); (3) no chronic pain or neurological disorders; (4) conventional MRI sequences did not reveal parenchymal brain lesions. After excluding subjects with poor image quality, 63 PHN patients, 25 hZ patients and 21 hCs were eventually included. The 63 PHN patients were divided into 3 subgroups with disease durations of 1, 3, and 6 months and with 27, 14 and 22 patients, respectively, in the groups.
MRI Data Acquisition and Processing
MRI data were collected on a 3.0 T Siemens TIM Trio scanner (Erlangen, Bavaria, Germany) in the radiology department of the First Affiliated Hospital of Nanchang University. Three-dimensional high-resolution T1-weighted images of the brain were collected at 176 sagittal positions in each participant. The gradient-echo sequence had the following parameters: repetition time = 1900 ms, echo time = 2.26 ms, flip angle = 9°, matrix = 240 × 256, field of view = 215×230 ms, slice thickness = 1.0 mm, slice gap = 0 mm, and scanning time = 3:34 minutes. During the MRI scans, participants needed to close their eyes but remain awake. Earplugs were available for participants to use to reduce the noise from the machine that they heard. Conventional T2-weighted images were used to exclude visible brain structural abnormalities.
DPABIsurf (version 1.6; http://rfmri.org/dpabi), a resting-state fMRI data analysis toolbox that calculates cortical thickness from 3D T1-weighted imaging (T1WI) information, was used to reconstruct and estimate cortical thicknesses in each group of subjects.24 The software is an upgraded version based on fMRIPrep20.2.1 and FreeSurfer software. It integrates multiple functional interfaces for preprocessing, statistical analysis and results review. DPABIsurf is a mature and reliable tool for resting-state functional brain MRI research. In brief, the preprocessing procedure consisted of registering T1WI scans to Talairach space; performing offset field correction; removing the nonbrain structures by skull stripping; segmenting the brain tissue into white matter, gray matter and cerebrospinal fluid; identifying the boundary between gray matter and white matter in each cortical hemisphere; calculating the white matter/gray matter and gray matter/cerebrospinal fluid ratios; expanding and deforming the cortical surface into a sphere; and resampling onto the average surface. Cortical thickness was calculated by measuring the distance between the white matter/gray matter boundary and the gray matter/pia mater boundary. Then, we simultaneously calculated the estimated total intracranial volume for each subject for subsequent inclusion as a covariate in the statistical analysis.
Construction of SCNs
We used the Desikan-Killiany atlas25 to delineate the cerebral cortex. In each group, Pearson’s correlation coefficients of cortical thickness between any node pairings were calculated to produce a 68-by-68 matrix. Sex, age and total intracranial volume were added as covariates. Studies have shown that cortical thickness decreases with age,26 increases with increasing total intracranial volume,27 and differs between sexes.28 Negative weighted edges were set to zero after excluding self-connections.29 The correlation coefficients greater than the threshold were retained, and the rest were set to 0 according to the predefined threshold sparsity (S = 0.05, 0.01, 0.40). Figure 1 depicts each group’s correlation matrix and binary matrix.
 |
Figure 1 Correlation matrix of the cortex thicknesses in each group. The upper row shows the cortical thickness correlation matrices of the HC, HZ, and PHN groups after excluding self-connections. The color bar indicates the strength of the correlation coefficients. The lower row is the binary matrix for each group. Abbreviations: HC, healthy control; HZ, herpes zoster; PHN, postherpetic neuralgia; m: month(s). |
Network Attribute Calculation
The different topological properties at the global and regional levels, with specific calculations and meanings shown in Table 1 30 were as follows: the (1) global topological properties were local efficiency (Elocal), global efficiency (Eglobal), clustering coefficient (C), characteristic shortest path length (Lp), normalized clustering coefficient (γ), normalized characteristic shortest path length (λ) and small-worldness (σ). To examine the topological characteristics of brain networks, we created one hundred null networks. The average clustering coefficient (Crand) and the characteristic shortest path length (Lrand) were calculated. Comparing the real network parameters (Creal, Lreal) with the random network parameters, γ (γ = Creal/Crand) and λ (λ = Lreal/Lrand) were obtained.(2) The regional topological properties were degree centrality, nodal efficiency and betweenness centrality. Each network index was calculated repeatedly within the selected density, and a graph was formed with density as the abscissa and with a certain network parameter as the ordinate. This curve reflected the change in specific network indicators with network density. The area under the curve (AUC) of each network indicator was summarized for further analysis.31
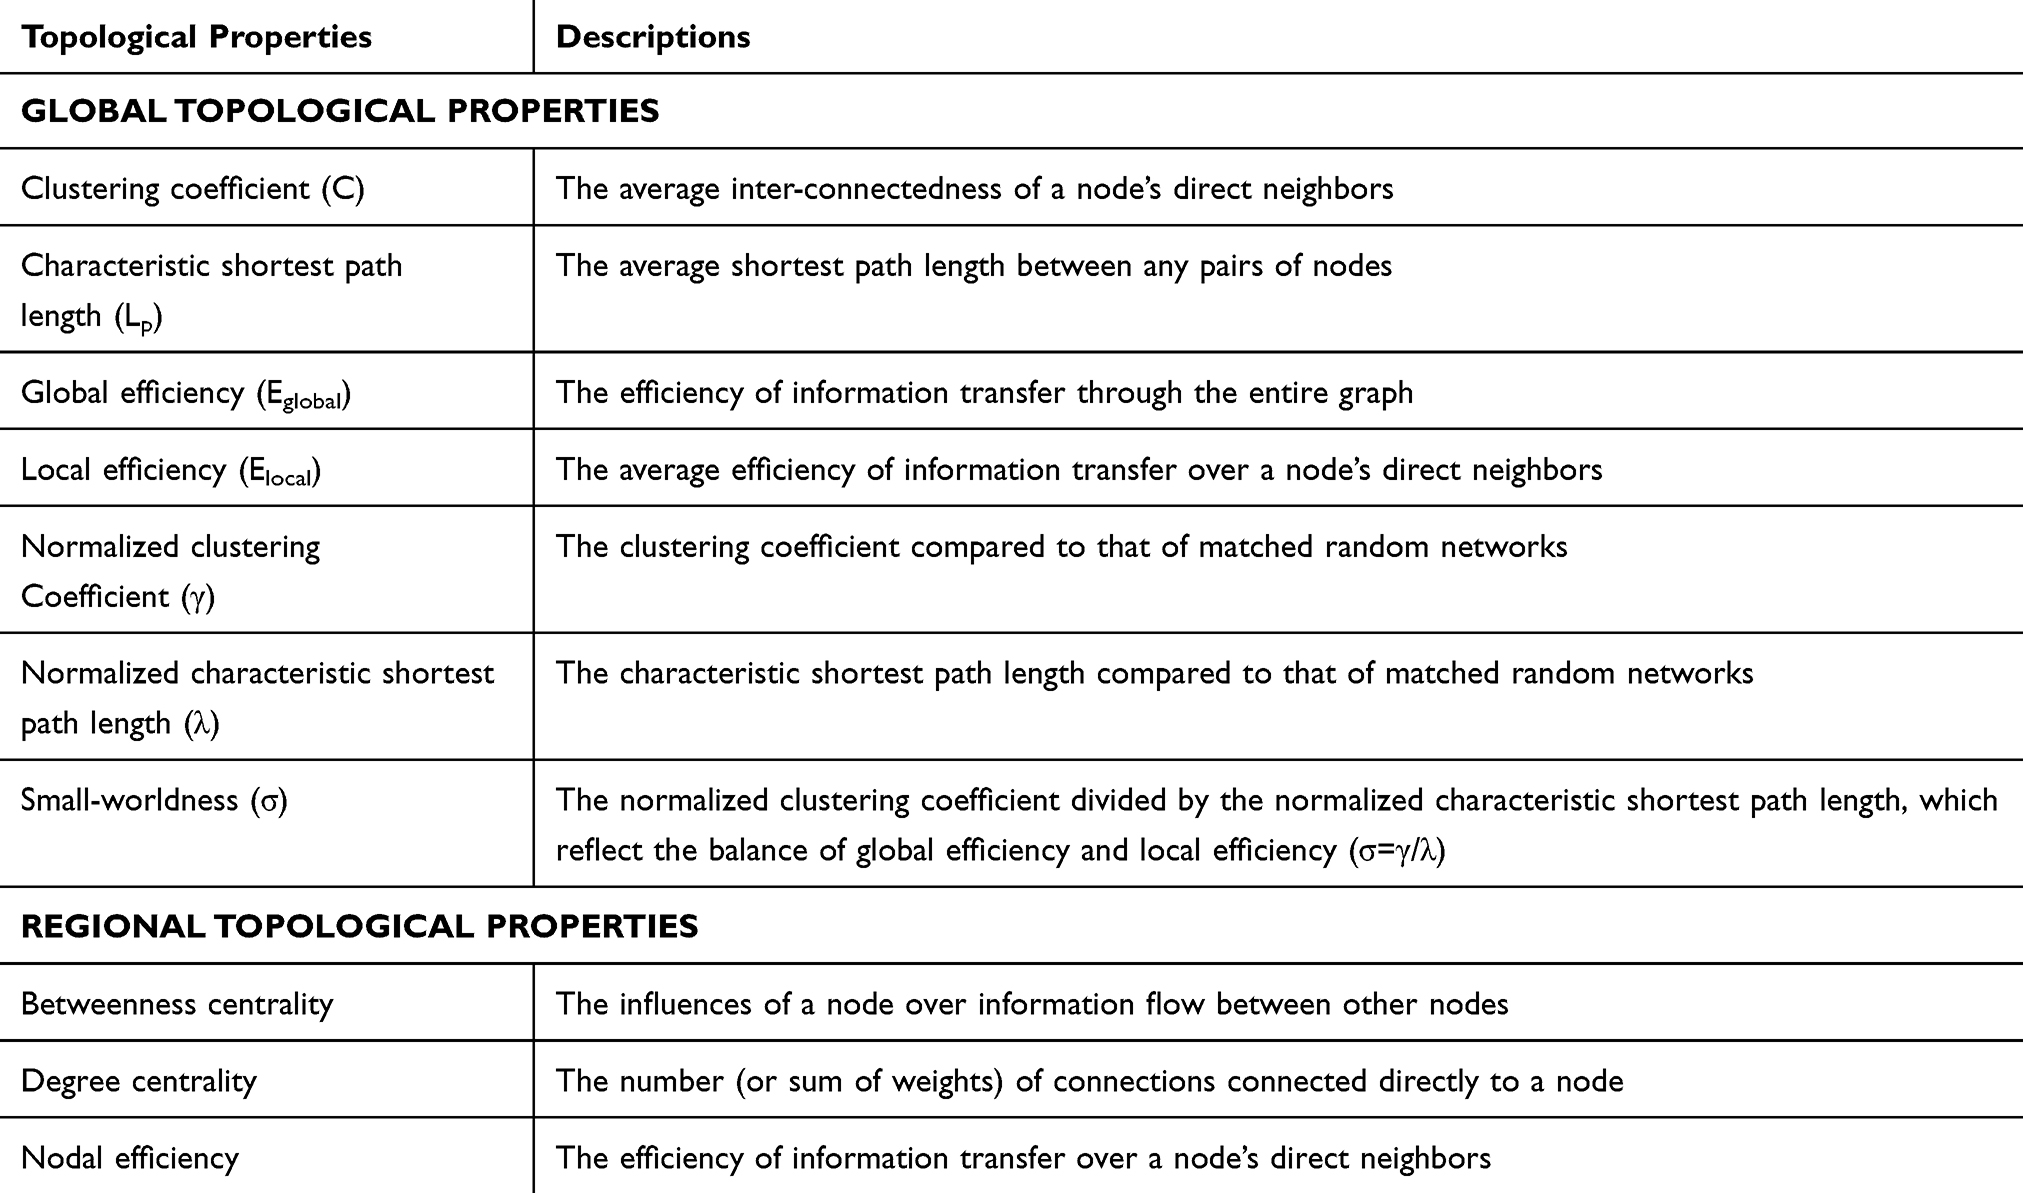 |
Table 1 Topological Properties of Brain Graphs Computed in the Study |
Statistical Analysis
SPSS 22.0 (SPSS Inc., Chicago, IL, USA) was used for statistical descriptive analysis of demographic and clinical data. The Shapiro–Wilk test was used to assess the normality of all measurement data. Measurement data conforming to a normal distribution were expressed as the mean ± standard deviation; ANOVA was used for comparisons between the groups, and the least significant difference (LSD) t test was used for further between-group comparisons. Otherwise, the median (interquartile spacing) was used for statistical description; the Kruskal‒Wallis test was used for comparisons between groups, and the Nemenyi test was used for further between-group comparisons. Sex ratios and skin lesions were compared by the chi-square test. Statistical estimates were two-tailed, and p values < 0.05 indicated that differences were statistically significant.
The nonparametric permutation test was used to explore the differences in network topologies between groups. First, the differences between groups in each network measure were calculated. The correlation matrices of the randomized group were then reconstructed after all individuals were mixed and randomly assigned. Based on these steps, the weight matrices were binarized, and the differences in network indicators between groups of the random network were calculated. Permutations were repeated 1000 times at each density to obtain the distribution of differences. P values were based on the percentile of the real network measures difference (P < 0.05). Multiple comparisons between nodes were achieved using false discovery rate (FDR) correction (P <0.05). In all statistical analyses, the Brain Connectivity Toolbox (https://sites.google.com/site/bctnet/)32 in MATLAB 2013b was used to construct and analyze the SCNs. BrainNet Viewer (http://www.nitrc.org/projects/bnv/) was used to present changes at the regional level.
A descriptive analysis of the spatial distribution of hubs in the networks of five groups was performed. A node was set as a hub if its betweenness centrality was at least two standard deviations higher than the mean nodal centrality.33 We used the AUC of each node’s betweenness centrality to identify a hub.
Results
Cohort Characteristics
Twenty-one HCs (Group A), twenty-five HZ patients (Group B), twenty-seven PHN patients with a disease duration of 1 to 3 months (Group C), 14 PHN patients with a disease duration of 3 to 6 months (Group D) and 22 PHN patients with a disease duration greater than 6 months (Group E) participated in the study (Table 2). There were no statistically significant differences in sex (χ²=1.509, P=0.825) or age (F=2.140, P=0.081) among the five groups. HAMA and HAMD scores were significantly higher in HZ and PHN patients than in HCs (P<0.001). HAMD scores were higher in Group E than in Group B (P=0.020). There was a significant difference in disease duration among Groups B-E (P<0.001). There were no significant differences in patients’ VAS scores (K= 0.765, P = 0.858) or skin lesions (χ²=0.844, P=0.233).
 |
Table 2 The Demographic and Clinical Scores of Five Groups |
Global Network Measures
The results of the global network measures of group-level SCNs are shown in Table 3, Figure 2A-2G and Figure 3A-3G. AUC analysis showed that (1) for the comparison of Group A vs E, the Eglobal of Group E was smaller than that of Group A (P=0.035). Moreover, the Lp of Group E was greater than that of Group A (P=0.028).(2) The differences in the seven global attributes (Elocal, Eglobal, C, Lp, γ, λ, and σ) were not statistically significant when Group A was compared to Groups B, C and D (P>0.050). (3) For the comparison of Group B vs E, none of the differences in the seven global attributes (Elocal, Eglobal, C, Lp, γ, λ, and σ) were statistically significant (P>0.050).
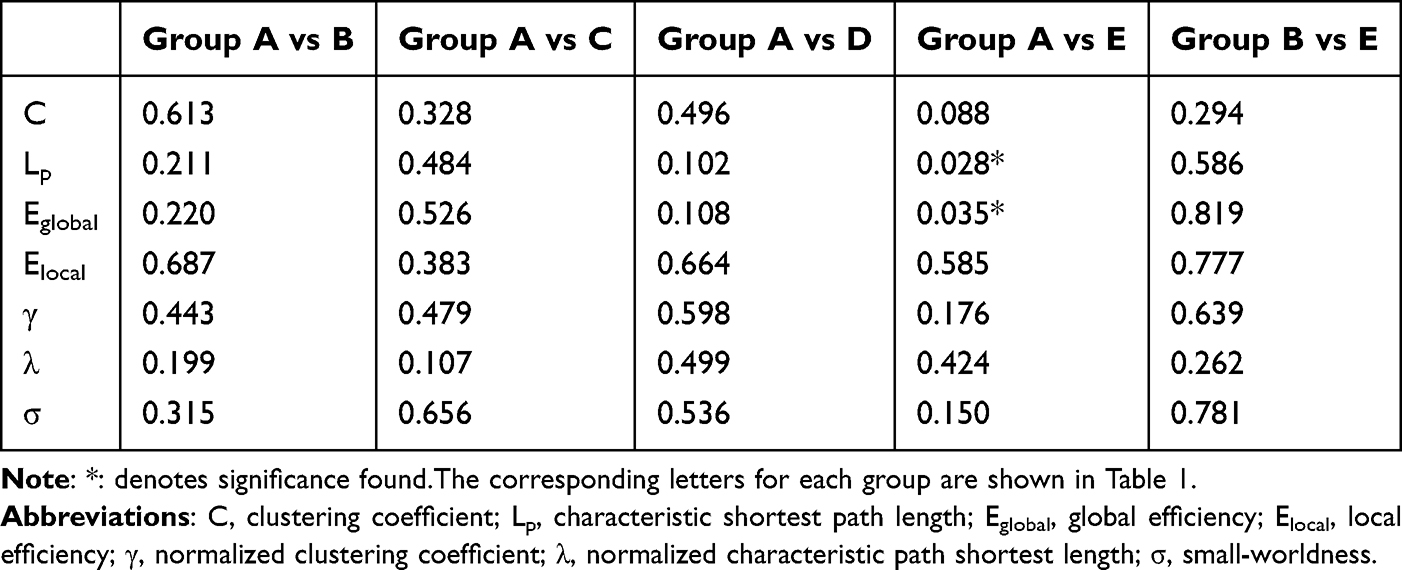 |
Table 3 Global Network Properties Between Groups |
 |
Figure 2 Changes in the global network properties with increasing network density. The changes in (A) clustering coefficient, (B) characteristic shortest path length, (C) global efficiency, (D) local efficiency, (E) normalized characteristic shortest path length (γ), (F) normalized clustering coefficient (γ) and (G) small-worldness (σ) with increasing network density. (Network density: ranging from 0.05 to 0.40). Abbreviations: HC, healthy control; PHN, postherpetic neuralgia; m: month(s). Note: *: denotes statistical significance. |
 |
Figure 3 Differences between PHN patients (>6 m) and HCs in global network parameters as a function of network density (0.05–0.40). (A) Clustering coefficient, (B) characteristic shortest path length, (C) global efficiency, (D) local efficiency, (E) normalized characteristic shortest path length (γ), (F) normalized clustering coefficient (γ) and (G) small-worldness (σ). The 95% confidence interval is represented by upper and lower blue lines, and the black line in the middle is the mean difference after 1000 permutations. The red line represents the true differences between groups, which fall outside the confidence interval and indicate significant differences between groups (p < 0.050) under the current threshold. Abbreviations: HC, healthy control; HZ, herpes zoster; PHN, postherpetic neuralgia; m: month(s). |
Intergroup Comparisons of Regional Network Measures
Intergroup comparisons of nodal attributes among the 5 groups revealed characteristic changes in certain nodes in PHN and HZ patients (Table 4, Figure 4A-4C). AUC analysis showed that (1) in the comparison of Group A vs B, the nodal efficiency of the right pars opercularis of HZ patients was greater than that of HCs (P<0.001). (2) The comparison of Group A vs C revealed that the nodal efficiency of the right pars opercularis of PHN patients (disease duration 1 to 3 months) was greater than that of HCs (P<0.001); (3) The comparison of Group A vs E showed that the nodal degree of the left pars triangularis of PHN patients (disease duration>6 months) was greater than that of HCs (P<0.001) and the nodal efficiency of the right middle temporal gyrus of PHN patients (disease duration>6 months) was greater than that of HCs (P<0.001). All the above results survived FDR correction.
 |
Table 4 The P value for Regions Exhibiting Significant Between-Group Differences in Nodal Centralities |
 |
Figure 4 Regions showing significant between-group differences in nodal centralities (P<0.050, corrected). (A) Nodes that differ between the HZ group and the HC group. (B) Nodes that differ between the 1–3 month PHN group and the HC group. (C) Nodes that differ between the PHN group with duration greater than 6 months and the HC group. Abbreviations: r, right; l, left; HC, healthy control; HZ, herpes zoster; PHN, postherpetic neuralgia; m, month(s). |
Network Hubs
The hub nodes of Group A were the left postcentral lobule, right paracentral lobule and right supramarginal gyrus. The hub nodes of Group B were the bilateral superior frontal gyrus, right lateral occipital gyrus, right pars opercularis and right supramarginal gyrus. The hub nodes of Group C were the left precentral lobule, left rostral middle frontal gyrus, and right pars opercularis. The hub nodes of Group D were the left bankssts and left lateral orbitofrontal gyrus. The hub nodes of Group E were the bilateral superior frontal gyrus. (Table 5, Figure 5A-5E).
 |
Table 5 Hub Regions in Five Groups |
 |
Figure 5 Network hubs of five groups. (A) HC group. (B) HZ group. (C) PHN group of 1 to 3 months. (D) PHN group of 3 to 6 months. (E) PHN group of greater than 6 months. Abbreviations: r, right; l, left; HC, healthy control; HZ, herpes zoster; PHN, postherpetic neuralgia; m: month(s). |
Discussion
In order to investigate whether there are abnormalities in the topological properties of brain networks of HZ and PHN patients, we constructed SCNs based on cortical thickness. This study is the first to use cortical thickness to construct SCNs and compute graph theoretical metrics to explore the changes in network topological characteristics of HZ and PHN patients. We found that PHN patients with a disease duration greater than 6 months differed from HCs in Eglobal and Lp. Differences in the properties of some nodes between HC and patient groups and between HZ and the PHN group with a disease duration greater than 6 months were found. There were differences in the properties of some nodes between HC and each patient group and between the HZ and PHN groups with a disease duration greater than 6 months.
Among all the groups, σ were greater than 1 within the chosen sparsity range, except for Group D, which had a σmin < 1 but a mean value > 1. The “small-world” network, first proposed by Watts et al34, describes the connection between regular and random networks and is locally and globally efficient; pertinently, the human brain network has this property.35 A brain network has a small-world property if its σ is > 1.36 The results suggested that the small-world attributes of patients with PHN still persist even with a longer course of disease except for PHN patients with disease duration>6 months. This may be related to the small sample size (only 14) of this group, which is also mentioned in the limitations. It suggested that PHN patients maintain the overall and local efficiency of information dissemination, which is consistent with a previous study showing that they retain small-world properties.11
Although small-world properties were retained across patient groups, Eglobal and Lp were altered in PHN patients with long-duration. Eglobal estimates the efficiency of network information transfer, reflecting the brain’s ability to exchange information and utilize resources.37 Lp reflects all possible channels of information transfer between two brain regions.38 They are both indicators of network integration, which ensures the rapid transfer of information between regions. The reduced global efficiency and increased Lp of PHN patients with a disease duration of >6 months suggested that there was an abnormally attenuated network integration, ie, reduced information transfer between brain regions in long-duration PHN. Furthermore, we found that patients with PHN showed alterations in global properties only at a disease duration of >6 months, suggesting that PHN patients also maintain the ability to transmit information more efficiently throughout the brain in the early stages of the disease. This has important implications for clinical decision-making regarding the need for further restaging of PHN. In the future, the use of the two global metrics can be considered to assist in the restaging of PHN.
In addition to the differences in global attributes, we also found differences in regional attributes between different groups. Furthermore, network hubs were present in all patients and HCs. A node with high betweenness centrality can control the flow of information because it is at the intersection of many short paths.32 Hubs are biologically expensive and vulnerable to disease-related processes.39 In this study, some hubs were also nodes with significant nodal attribute differences between two particular groups.
The right pars opercularis is the node that conforms to the above characteristics. It was the hub of both the HZ and PHN (1–3 months) groups, as well as the node of increased efficiency of the PHN with a disease duration of 1–3 months and HZ. Nodal efficiency is the ability of a particular node to transmit information in a network,30 which can reflect the centrality of a node. The above results suggested that the brain region is very important in patients with HZ and early PHN. A study exploring cortical morphology and motor inhibition in the pars opercularis found that the surface area of the right pars opercularis had a significant effect on the ability to inhibit movement,40 and disorders during motor response inhibition are associated with anxiety and mood disorders.41 It suggested that emotional problems occurring early in PHN may be related to this brain region.
The nodal degree of the left pars triangularis and the nodal efficiency of the right middle temporal gyrus in PHN patients with a disease duration of >6 months were greater than those of HCs. The nodal degree is the number of edges connected to that node,30 and an increase in degree reflects an increase in the centrality and importance of the node. The left pars triangularis is a part of Broca’s area. Previous studies found that Broca’s area was involved in a variety of cognitive activities, including cognitive control, and social cognition.42–44 The right middle temporal gyrus plays an important role in cognitive functioning.45 A previous PHN study also found reduced spontaneous brain activity in the middle temporal gyrus in patients with neuropathic pain.46 Pain is a multidimensional experience encompassing diverse and integrated brain functions, including emotional-affective and cognitive components.47 A number of previous PHN-related studies also found changes in many structural or functional indicators of brain regions related to cognition.6,7,17,48 The changes in the structural properties of the two brain regions related to cognition in this study were opposite to the trend of the changes, which may be a compensatory response of the brain structure in patients with long-duration PHN.
Notably, the inferior frontal gyrus, middle temporal gyrus, and one of the hubs of PHN (1–3 months)—the left precentral gyrus— all belong to the emotion regulation network (ERN),49 which involves emotional processing functions. This suggested that among all stages in PHN patients, the brain regions related to emotional control had changes in the structural properties, which may provide new insights into the neuropathological mechanisms underlying the development of emotional problems in patients with this disease.
In addition to finding differences in the regional properties and hubs of certain patient groups that are affiliated within the ERN, we also found other common hubs between some groups. The right supramarginal gyrus, which is a part of wernicke’s area,50 was the common hub in HZ patients and HCs. A study51 showed that the volume of this brain region was associated with the maintenance of emotion recognition, suggesting that it can serve as a more critical node during the HZ stage than in HCs and may help HZ patients maintain the normal recognition of emotions, which has a protective effect and is also in line with the fact that the disease is a gradual and chronic disease. Two longitudinal studies also found changes in functional indices of the right marginal supramarginal gyrus in patients with PHN after treatment.52,53 The bilateral superior frontal gyrus were the common hubs for HZ and PHN patients with a disease duration of >6 months, and the latter group had only these two hubs. The superior frontal gyrus is part of the prefrontal cortex (PFC), which is a regulatory center for emotion and cognition.54 This may be related to altered processing of negative emotions,55 which suggests that the brain regions that control negative emotions are predominant when PHN progresses to a long course of the disease and that the brain regions occupy a key position for transmitting information in the early stages. A longitudinal study found an increase in ReHo in the right superior frontal gyrus in patients with PHN following treatment.53 The above studies suggested that the changes in these brain regions are reversible, and in conjunction with the results of this study, early targeting of these brain regions may allow for timely intervention and treatment.
In addition to the aforementioned hubs, there are a number of hubs that exist only in a certain group that are equally worthy of our attention. The right lateral occipital gyrus was another hub in HZ patients, as well as a component of the visual cortex. Visual attention is controlled by two partially segregated neural systems: the dorsal frontoparietal network (DAN) and the ventral frontoparietal network (VAN).56 The left rostral middle frontal gyrus was a hub in PHN patients (1–3 months). This brain region is located in the control network,57 which is a key brain region for emotion regulation.58 The left bankssts and the left lateral orbitofrontal gyrus were the hubs in PHN patients (3–6 months). The left bankssts is an auditory speech center, also a part of wernicke’s area.50 The left lateral orbitofrontal gyrus belongs to the orbitofrontal cortex (OFC), which is involved in language, cognitive and emotional processing.59 These brain regions mentioned above belongs to different functional networks or systems, suggesting that the progression of the disease in patients with PHN may involve multiple aspects that need to be studied in an integrated manner.
Limitations
There Were Some limitations of This Study
(1) The sample size of this study was small. In the future, the functional and structural differences of PHN patients with different disease durations should be analyzed after more MRI data have been collected from patients with long-duration PHN.
(2) Information on educational attainment was not complete for some of the subjects, so it was not possible to include educational attainment in the demographic information for statistical analysis. In addition, cognition was not assessed in this study.
(3) Patients with PHN were likely to have had pretreatment prior to admission, and different treatments may have had an impact on the development of subsequent conditions in patients with PHN. In the future, a longitudinal study should be performed to compare how brain structure and function are altered in patients with PHN after different treatments.
(4) Different from the networks constructed based on BOLD sequences and DTI sequences, the present study evaluated group-level SCNs.60 Therefore, this study failed to correlate the network metrics of each group with the patients’ clinical data such as scales. In the future, the analysis of individualized SCNs can be performed with a sufficient sample size and combined with clinical features as well as machine learning to explore the neuroimaging markers of PHN in terms of brain structure.
(5) The mechanism of persistent pain in PHN patients is related to central sensitization. Brain multimodal MRI is an excellent non-invasive research method for studying the central pathogenesis of PHN. This paper mainly focuses on research and exploration in the structural aspect and does not conduct a comprehensive analysis in combination with functional indicators. In future research, we will analyze both functional and structural indicators to explore the connections between them.
Conclusions
We found that patients with long-duration PHN had enhanced integration of brain networks and diminished information transfer between nodes, which provided evidence of the emergence of different structural network properties in these patients and expanded the knowledge and understanding of HZ- and PHN-related neuroimaging. These findings may help in the clinical restaging of PHN patients, on the basis of which therapeutic strategies can be adapted for PHN of different disease durations in the future.
Data Sharing Statement
The datasets generated during this study are available from the corresponding author upon reasonable request.
Ethics Approval and Informed Consent
The study strictly adhered to the Declaration of Helsinki and was approved by the Ethics Committee of the First Affiliated Hospital of Nanchang University (ethics approval code:20200145).A full description of the study was provided to the participants, and written informed consent was obtained from all individuals prior to participation in the study.
Author Contributions
Jiaxin X and Lili G proposed the idea, Huiting Lv, Xiaofeng J and Hongmei K acquired the data. Zihan Li, Yangyang Xie and Qing L collected magnetic resonance data. Jiaxin X wrote the first draft; Lili G and Jian Jiang revised the draft. All authors made a significant contribution to the work reported, whether that is in the conception, study design, execution, acquisition of data, analysis and interpretation, or in all these areas; took part in drafting, revising or critically reviewing the article; gave final approval of the version to be published; have agreed on the journal to which the article has been submitted; and agree to be accountable for all aspects of the work.
Funding
This study was supported by the National Key Research and Development Program of China[2022YFC3602202], the National Natural Science Foundation of China [Grant No.81960313], the Clinical Research Center For Medical Imaging In Jiangxi Province [No.20223BCG74001] and the Key research and development plans of Jiangxi Provincial Department of Science and Technology [Grant No. S2020ZPYFB2343].
Disclosure
The authors report no conflicts of interest in this work. This paper has been uploaded to ResearchSquare as a preprint: [preprint https://www.researchsquare.com/article/rs-4887774/v1].
References
1. Schmader KHZ. Annals of internal medicine. Ann Int Med. 2018;169:Itc19–itc31. doi:10.7326/aitc201808070
2. Harbecke R, Cohen JI, Oxman MN. Herpes zoster vaccines. J Infect Dis. 2021;224:S429–s442. doi:10.1093/infdis/jiab387
3. Yang F, Yu S, Fan B, et al. The epidemiology of herpes zoster and postherpetic neuralgia in china: results from a cross-sectional study. Pain and Therapy. 2019;8:249–259. doi:10.1007/s40122-019-0127-z
4. Du J, Sun G, Ma H, et al. Prevalence and risk factors of anxiety and depression in patients with postherpetic neuralgia: a retrospective study. Dermatology. 2021;237:891–895. doi:10.1159/000512190
5. Sollie M, Jepsen P, Sørensen JA. Patient-reported quality of life in patients suffering from acute herpes zoster-a systematic review with meta-analysis. Br J Pain. 2022;16:404–419. doi:10.1177/20494637211073050
6. Dai H, Jiang C, Wu G. et al. A combined DTI and resting state functional MRI study in patients with postherpetic neuralgia. Jpn J Radiol. 2020;38:440–450. doi:10.1007/s11604-020-00926-4
7. Liu X, Gu L, Liu J. et al. MRI study of cerebral cortical thickness in patients with herpes zoster and postherpetic neuralgia. J Pain Res. 2022;15:623–632. doi:10.2147/jpr.S352105
8. Cao S, Qin B, Zhang Y, et al. Herpes zoster chronification to postherpetic neuralgia induces brain activity and grey matter volume change. Am J Transl Res. 2018;10:184–199.
9. Underwood R, Tolmeijer E, Wibroe J, Peters E, Mason L. Networks underpinning emotion: a systematic review and synthesis of functional and effective connectivity. NeuroImage. 2021;243:118486. doi:10.1016/j.neuroimage.2021.118486
10. Ziaei M, Arnold C, Thompson K, Reutens DC. Social cognition in temporal and frontal lobe epilepsy: systematic review, meta-analysis, and clinical recommendations. J Int Neuropsychol Soc. 2023;29:205–229. doi:10.1017/s1355617722000066
11. Zhang Y, Liu J, Li L, et al. A study on small-world brain functional networks altered by postherpetic neuralgia. Magn Reson Imaging. 2014;32:359–365. doi:10.1016/j.mri.2013.12.016
12. Li J, Gu L, Hong S, et al. Greater functional connectivity between the ventral frontal cortex and occipital cortex in herpes zoster patients than post-herpetic neuralgia patients. Brit J Radiol. 2023;96:20220762. doi:10.1259/bjr.20220762
13. Kang Y, Trewern L, Jackman J, McCartney D, Soni A. Chronic pain: definitions and diagnosis. BMJ. 2023;381:e076036. doi:10.1136/bmj-2023-076036
14. Prasad K, Rubin J, Mitra A, et al. Structural covariance networks in schizophrenia: a systematic review part I. Schizophr Res. 2022;240:1–21. doi:10.1016/j.schres.2021.11.035
15. Lai H, Zhao Y, Li J, Gong Q, Wang S. Neuroanatomical signatures associated with dispositional optimism predict COVID-19-related posttraumatic stress symptoms. Cereb. Cortex. 2023;33:9387–9398. doi:10.1093/cercor/bhad211
16. Liu J, Gu L, Huang Q, et al. Altered gray matter volume in patients with herpes zoster and postherpetic neuralgia. J Pain Res. 2019;12:605–616. doi:10.2147/jpr.S183561
17. Tang Y, Ren C, Wang M, et al. Altered gray matter volume and functional connectivity in patients with herpes zoster and postherpetic neuralgia. Brain Res. 2021;1769:147608. doi:10.1016/j.brainres.2021.147608
18. Li H, Li X, Feng Y, et al. Deficits in ascending and descending pain modulation pathways in patients with postherpetic neuralgia. NeuroImage. 2020;221:117186. doi:10.1016/j.neuroimage.2020.117186
19. Scholz J, Finnerup NB, Attal N, et al. The IASP classification of chronic pain for ICD-11: chronic neuropathic pain. Pain. 2019;160:53–59. doi:10.1097/j.pain.0000000000001365
20. Sun W, Jin Y, Liu H, et al. Short-term spinal cord stimulation is an effective therapeutic approach for herpetic-related neuralgia-A Chinese nationwide expert consensus. Front Aging Neurosci. 2022;14:939432. doi:10.3389/fnagi.2022.939432
21. Bech P, Allerup P, Gram LF, et al. The Hamilton Depression Scale: evaluation of objectivity using logistic models. Acta Psychiatr Scand. 1981;63:290–299. doi:10.1111/j.1600-0447.1981.tb00676.x
22. Beneke M. Methodological investigations of the Hamilton anxiety scale. Pharmacopsychiatry. 1987;20:249–255. doi:10.1055/s-2007-1017116
23. Treede RD, Jensen TS, Campbell JN, et al. Neuropathic pain: redefinition and a grading system for clinical and research purposes. Neurology. 2008;70:1630–1635. doi:10.1212/01.wnl.0000282763.29778.59
24. Yan CG, Wang XD, Lu B. DPABISurf: data processing & analysis for brain imaging on surface. Sci Bull. 2021;66:2453–2455. doi:10.1016/j.scib.2021.09.016
25. Desikan RS, Ségonne F, Fischl B, et al. An automated labeling system for subdividing the human cerebral cortex on MRI scans into gyral based regions of interest. NeuroImage. 2006;31:968–980. doi:10.1016/j.neuroimage.2006.01.021
26. Magnotta VA, Andreasen Nc, Schultz SK. et al. Quantitative in vivo measurement of gyrification in the human brain: changes associated with aging. Cereb. Cortex. 1999;9:151–160. doi:10.1093/cercor/9.2.151
27. Im K, Lee J-M, Lyttelton O, et al. Brain size and cortical structure in the adult human brain. Cereb. Cortex. 2008;18:2181–2191. doi:10.1093/cercor/bhm244
28. Sowell ER, Peterson BS, Kan E. et al. Sex differences in cortical thickness mapped in 176 healthy individuals between 7 and 87 years of age. Cereb. Cortex. 2007;17:1550–1560. doi:10.1093/cercor/bhl066
29. Sanabria-Diaz G, Melie-Garcia L, Draganski B, Demonet JF, Kherif F. Apolipoprotein E4 effects on topological brain network organization in mild cognitive impairment. Sci Rep. 2021;11:845. doi:10.1038/s41598-020-80909-7
30. Yan CG, Craddock RC, He Y, Milham MP. Addressing head motion dependencies for small-world topologies in functional connectomics. Front human neurosci. 2013;7:910. doi:10.3389/fnhum.2013.00910
31. Xu T, Chen F, Zhang L. et al. Study on the changes of structural covariance network in post-traumatic stress disorder. Brain Imaging and Behavior. 2022;16:1992–2000. doi:10.1007/s11682-022-00669-y
32. Rubinov M, Sporns O. Complex network measures of brain connectivity: uses and interpretations. NeuroImage. 2010;52:1059–1069. doi:10.1016/j.neuroimage.2009.10.003
33. Mak E, Colloby SJ, Thomas A, O’Brien JT. The segregated connectome of late-life depression: a combined cortical thickness and structural covariance analysis. Neurobiol Aging. 2016;48:212–221. doi:10.1016/j.neurobiolaging.2016.08.013
34. Watts DJ, Strogatz SH. Collective dynamics of ‘small-world’ networks. Nature. 1998;393:440–442. doi:10.1038/30918
35. Salvador R, Suckling J, Coleman MR, et al. Neurophysiological architecture of functional magnetic resonance images of human brain. Cereb. Cortex. 2005;15:1332–1342. doi:10.1093/cercor/bhi016
36. Joel D, Berman Z, Tavor I. et al. Sex beyond the genitalia: the human brain mosaic. Proc Natl Acad Sci USA. 2015;112:15468–15473. doi:10.1073/pnas.1509654112
37. Li X, Yang C, Xie P, et al. The diagnosis of amnestic mild cognitive impairment by combining the characteristics of brain functional network and support vector machine classifier. J Neurosci Methods. 2021;363:109334. doi:10.1016/j.jneumeth.2021.109334
38. Wang W, Mei M, Gao Y, et al. Changes of brain structural network connection in Parkinson’s disease patients with mild cognitive dysfunction: a study based on diffusion tensor imaging. J Neurol. 2020;267:933–943. doi:10.1007/s00415-019-09645-x
39. Crossley NA, Mechelli A, Scott J, et al. The hubs of the human connectome are generally implicated in the anatomy of brain disorders. Brain. 2014;137:2382–2395. doi:10.1093/brain/awu132
40. Curley LB, Newman E, Thompson WK, et al. Cortical morphology of the pars opercularis and its relationship to motor-inhibitory performance in a longitudinal, developing cohort. Brain Struct Funct. 2018;223:211–220. doi:10.1007/s00429-017-1480-5
41. Wright L, Lipszyc J, Dupuis A, Thayapararajah SW, Schachar R. Response inhibition and psychopathology: a meta-analysis of go/no-go task performance. J Abnormal Psychol. 2014;123:429–439. doi:10.1037/a0036295
42. Gallese V, Keysers C, Rizzolatti G. A unifying view of the basis of social cognition. Trends Cognitive Sci. 2004;8:396–403. doi:10.1016/j.tics.2004.07.002
43. Nishitani N, Schürmann M, Amunts K, Hari R. Broca’s region: from action to language. Physiology. 2005;20:60–69. doi:10.1152/physiol.00043.2004
44. Fedorenko E, Blank IA. Broca’s area is not a natural kind. Trends Cogn Sci. 2020;24:270–284. doi:10.1016/j.tics.2020.01.001
45. Wang Z, He D, Yang L, et al. Common and distinct patterns of task-related neural activation abnormalities in patients with remitted and current major depressive disorder: a systematic review and coordinate-based meta-analysis. Neurosci Biobehav Rev. 2023;152:105284. doi:10.1016/j.neubiorev.2023.105284
46. Huang J, Li Y, Xie H, et al. Abnormal intrinsic brain activity and neuroimaging-based fMRI classification in patients with herpes zoster and postherpetic neuralgia. Front Neurol. 2020;11:532110. doi:10.3389/fneur.2020.532110
47. Chen F, Chen F, Shang Z, et al. White matter microstructure degenerates in patients with postherpetic neuralgia. Neurosci Lett. 2017;656:152–157. doi:10.1016/j.neulet.2017.07.023
48. Li J, Huang X, Sang K. et al. Modulation of prefrontal connectivity in postherpetic neuralgia patients with chronic pain: a resting-state functional magnetic resonance-imaging study. J Pain Res. 2018;11:2131–2144. doi:10.2147/jpr.S166571
49. Kohn N, Eickhoff SB, Scheller M, et al. Neural network of cognitive emotion regulation--an ALE meta-analysis and MACM analysis. NeuroImage. 2014;87:345–355. doi:10.1016/j.neuroimage.2013.11.001
50. Binder JR. Current controversies on wernicke’s area and its role in language. Curr Neurol Neurosci Rep. 2017;17:58. doi:10.1007/s11910-017-0764-8
51. Wada S, Honma M, Masaoka Y, et al. Volume of the right supramarginal gyrus is associated with a maintenance of emotion recognition ability. PLoS One. 2021;16:e0254623. doi:10.1371/journal.pone.0254623
52. Zhang Y, Cao S, Yuan J. et al. Functional and structural changes in postherpetic neuralgia brain before and six months after pain relieving. J Pain Res. 2020;13:909–918. doi:10.2147/jpr.S246745
53. Fan X, Ren H, Bu C, et al. Alterations in local activity and functional connectivity in patients with postherpetic neuralgia after short-term spinal cord stimulation. Front Mol Neurosci. 2022;15:938280. doi:10.3389/fnmol.2022.938280
54. Friedman NP, Robbins TW. The role of prefrontal cortex in cognitive control and executive function. Neuropsychopharmacology. 2022;47:72–89. doi:10.1038/s41386-021-01132-0
55. Li L, Zhang Y, Zhao Y. et al. Cortical thickness abnormalities in patients with post-traumatic stress disorder: a vertex-based meta-analysis. Neurosci Biobehav Rev. 2022;134:104519. doi:10.1016/j.neubiorev.2021.104519
56. Corbetta M, Shulman GL. Control of goal-directed and stimulus-driven attention in the brain. Nat Rev Neurosci. 2002;3:201–215. doi:10.1038/nrn755
57. Yeo BT, Krienen FM, Sepulcre J, et al. The organization of the human cerebral cortex estimated by intrinsic functional connectivity. J Neurophysiol. 2011;106:1125–1165. doi:10.1152/jn.00338.2011
58. Song L, Zhou Z, Meng J, et al. Rostral middle frontal gyrus thickness mediates the relationship between genetic risk and neuroticism trait. Psychophysiology. 2021;58:e13728. doi:10.1111/psyp.13728
59. Ren H, Wang Q, Li C, et al. Differences in cortical thickness in schizophrenia patients with and without auditory verbal hallucinations. Front Mol Neurosci. 2022;15:845970. doi:10.3389/fnmol.2022.845970
60. Alexander-Bloch A, Giedd JN, Bullmore E. Imaging structural co-variance between human brain regions. Nat Rev Neurosci. 2013;14:322–336. doi:10.1038/nrn3465
 © 2025 The Author(s). This work is published and licensed by Dove Medical Press Limited. The
full terms of this license are available at https://www.dovepress.com/terms.php
and incorporate the Creative Commons Attribution
- Non Commercial (unported, 3.0) License.
By accessing the work you hereby accept the Terms. Non-commercial uses of the work are permitted
without any further permission from Dove Medical Press Limited, provided the work is properly
attributed. For permission for commercial use of this work, please see paragraphs 4.2 and 5 of our Terms.
© 2025 The Author(s). This work is published and licensed by Dove Medical Press Limited. The
full terms of this license are available at https://www.dovepress.com/terms.php
and incorporate the Creative Commons Attribution
- Non Commercial (unported, 3.0) License.
By accessing the work you hereby accept the Terms. Non-commercial uses of the work are permitted
without any further permission from Dove Medical Press Limited, provided the work is properly
attributed. For permission for commercial use of this work, please see paragraphs 4.2 and 5 of our Terms.
Recommended articles
Fire Needling Acupuncture for Adult Patients with Acute Herpes Zoster: Protocol of a Systematic Review and Meta-Analysis
Liu L, Chen Q, Yang J, Gang W, Zhao L, Lyu T, Jing X, Zhang CS, Li B
Journal of Pain Research 2022, 15:2161-2170
Published Date: 2 August 2022
Comparison of a One- versus Two-Week Treatment with Famciclovir Upon Reductions in Pain and Occurrence of Postherpetic Neuralgia in Herpes Zoster: A Randomized Open-Label Trial
Peng F, He H, Xia T, Lv S
Infection and Drug Resistance 2023, 16:721-726
Published Date: 2 February 2023
Effects of Intradermal Botulinum Toxin Injections on Herpes Zoster Related Neuralgia
Peng F, Xia TB
Infection and Drug Resistance 2023, 16:2159-2165
Published Date: 12 April 2023
The Effect of CT-Guided Pulsed Radiofrequency Combined with Ozone Injection on Zoster-Associated Pain: A Retrospective Study
Wang X, Yu J, Han CF, He JD, Yang WQ, Wang Q, Chen JP
Journal of Pain Research 2023, 16:1321-1332
Published Date: 20 April 2023
Effect of Preoperative Level of Glycemic Control with Pulsed Radiofrequency on the Incidence of Postherpetic Neuralgia in Patients with Herpes Zoster Combined with Type 2 Diabetes Mellitus: A Cohort Study
Hua B, An M, Chen L, Ni H, Ni C, Yao M
Diabetes, Metabolic Syndrome and Obesity 2024, 17:3975-3987
Published Date: 24 October 2024