")
Back to Journals » International Journal of Nanomedicine » Volume 19
Loratadine Loaded Chitosan Tannic Acid Nanoparticles as Anti-Proliferative Agent Against Breast Cancer: In-silico, in-vitro and Cell Studies
Authors Ali IH , Al-Tabakha MM , Khalil IA
Received 20 June 2024
Accepted for publication 10 November 2024
Published 22 November 2024 Volume 2024:19 Pages 12483—12504
DOI https://doi.org/10.2147/IJN.S483667
Checked for plagiarism Yes
Review by Single anonymous peer review
Peer reviewer comments 4
Editor who approved publication: Dr Krishna Nune
Isra H Ali,1,2 Moawia M Al-Tabakha,3,4 Islam A Khalil5
1Department of Pharmaceutics, Faculty of Pharmacy, University of Sadat City, Sadat City, Egypt; 2Nanomedicine Laboratory, Faculty of Pharmacy, University of Sadat City, Sadat City, Egypt; 3Department of Pharmaceutical Sciences, College of Pharmacy and Health Sciences, Ajman University, Ajman, United Arab Emirates; 4Centre of Medical and Bio-Allied Health Sciences Research Centre, Ajman University, Ajman, United Arab Emirates; 5Department of Pharmaceutics, College of Pharmaceutical Sciences and Drug Manufacturing, Misr University for Science and Technology, 6th of October City, Giza, Egypt
Correspondence: Islam A Khalil, Department of Pharmaceutics, College of Pharmaceutical Sciences and Drug Manufacturing, Misr University for Science and Technology, 6th of October City Giza, 12582, Egypt, Email [email protected]; [email protected] Moawia M Al-Tabakha, Department of Pharmaceutical Sciences, College of Pharmacy and Health Sciences, Ajman University, P.O. Box 346, Ajman, United Arab Emirates, Email [email protected]
Purpose: This study aims to prepare Loratadine-loaded chitosan/tannic acid nanoparticles (LOR-CS/TAN NPs) through ionic gelation to be used as an anti-proliferative agent to aid in overcoming breast cancer propagation.
Methods: First, in-silico virtual screening was carried out to select the most appropriate anti-histaminic drug based on its inhibitory effect on the H1-histamine receptor, resulting in the selection of Loratadine (LOR). Molecular interaction between LOR with chitosan (CS), a positively charged polymer, and hyaluronan, a negatively charged polymer, was investigated separately through molecular docking, leading to the selection of CS. Optimization was carried out using Box Behnken Design, with concentrations of CS, LOR, and tannic acid (TAN) as independent variables. The optimized nanoparticles were then examined through morphological and physicochemical studies. Cell studies against the MCF-7 breast cancer cell line were conducted to assess cytotoxicity, cell cycle, apoptosis, and necrosis.
Results: The optimum formulation was determined to be CS (0.2% w/v), LOR (1:2 weight ratio to CS), and TAN (1:30.6 weight ratio to CS). The optimized LOR-CS/TAN NPs exhibited a size of 283 nm, a polydispersity index (PDI) of 0.102, and an entrapment efficiency of 78%, along with sustained drug release for 24 hours. The results demonstrated that LOR-CS/TAN NPs possess higher anti-cancer activity compared to free LOR. This enhanced activity is attributed to the synergistic effect of the drug and the designed nanoparticle, particularly due to the presence of tannic acid.
Conclusion: In conclusion, Loratadine-loaded chitosan/tannic acid nanoparticles (LOR-CS/TAN NPs) demonstrated enhanced anti-cancer activity against the MCF-7 breast cancer cell line. The synergistic effect of Loratadine and the nanoparticle system, particularly due to the presence of tannic acid, resulted in higher cytotoxicity compared to free Loratadine. These findings suggest that LOR-CS/TAN NPs have significant potential as a novel anti-proliferative agent for breast cancer therapy.
Keywords: loratadine, chitosan, tannic acid, nanoparticles, breast cancer, in-silico
Graphical Abstract:

Introduction
Cancer is considered one of the major causes of death worldwide. Breast cancer is the first type of cancer reported in women, while the second type in both men and women globally. WHO reports show that around 13% of women worldwide are diagnosed with invasive breast cancer. Moreover, it is also reported that breast cancer is the leading cause of 3% of women’s deaths worldwide.1–3 For instance, it has been reported in Egypt that 35% of women cancer patients are diagnosed with breast cancer showing 29% mortality and incidence to mortality ratio of 3.7:1.4
Anti-histaminic drugs, commonly known for their activity to treat allergic conditions, have been reported for their anti-cancer activity to be used alone or as an adjunct therapy with other chemotherapeutic agents. They are classified into: (a) First generation, sedating causing cognitive impairment, such as carbinoxamine, clemastine and cyproheptadine, and (b) Second generation, non-sedating causing no cognitive impairment, such as astemizole, loratadine, and terfenadine. Anti-histaminic drugs compete with histamine in binding to H1-receptor leading to its blockage towards histamine.5 Consequently, anti-histaminic drugs can prevent the reported proliferative, differentiation as well as tumor progression activity of histamine. Therefore, anti-histaminic drugs can aid in enhancing cell death in cancer through blocking the H1 receptor.6,7
Loratadine has been examined as an anti-cancer and anti-proliferative agent through different studies. For instance, it has been proven that LOR causes G2/M phase cell cycle arrest in colon cancer through three different mechanisms: (a) checkpoint kinase 1 up-regulation, (b) cell division cycle Cdc25C down-regulation, and (c) anti-apoptotic protein inactivation. Consequently, all of these lead to caspase 9 mediated apoptosis.8 Another study showed that LOR is not only a promising anti-proliferative and anti-cancer agent but also a stimulating agent to enhance radiation responsiveness toward radiotherapy.9 Furthermore, through screening several anti-histaminic drugs such as loratadine, desloratadine, ebastine, terfenadine, etc. against different cancer cell lines eg breast, prostate and non-small cell lung cancer tissues, it was found that small amounts are sufficient to increase cell sensitization and consequently, decrease their resistance toward chemotherapeutic agents.10
The preparation of chitosan nanoparticles through the ionic gelation technique has been widely used as a promising approach for designing and developing a sustained and controlled release drug delivery system.11 Chitosan nanoparticles have the advantage of (a) enhancing both stability and solubility of the incorporated drug, (b) being highly biodegradable and biocompatible, (c) possessing high entrapment efficiency, (d) sustaining and controlled drug release profile owing to the high diffusion and slow polymer decomposition, (e) being highly permeable, (f) showing high swellability that is linked to the controlled release pattern, (g) having good stability, (h) possessing mucoadhesive that enhances the contact between the incorporated drug and the site of action, and (i) being positively charged that enhances cell membrane penetration.12–14
Chitosan (CS) is a naturally derived polysaccharide as it is obtained through the deacetylation of chitin, the second abundant polymer in nature after cellulose, that can be extracted from shells of crustaceans shells such as cockroaches, crabs, shrimps, fungal and yeast cell walls.15 CS is (poly—(1→4)(D-glucosamine), obtained from the deacetylation of (polyβ-(1→4)-N-acetyl-D-glucosamine), which is commonly known as chitin.15,16 CS is characterized by its facile formulation due to its flexible and highly functionalized structure. Therefore, it is considered to be a promising biopolymer that could be used in designing and preparing drug delivery systems for biomedical applications owing to its (a) highly biocompatibility, (b) low immunogenicity, (c) non-carcinogenicity, (d) highly biodegradability, (e) broad antimicrobial activity. Hence, CS is one of the most commonly used biopolymers in a wide range of biomedical applications including drug delivery, wound healing and regenerative medicine.17–23
Tannic acid (TAN) is a member of the hydrolyzable tannins. Its chemical structure is composed of pentagalloyl glucose core surrounded by gallic acid molecules through esterification bonds with hydroxyl groups of the core. In addition, due to the intense abundance of functionalities within the TAN structure, it has been used as a crosslinking agent with natural polymers such as collagen.24 Furthermore, TAN has been reported for its apoptotic activity against different cancer cells including the human breast cancer cell line (MCF-7).25–27 Interestingly, the reported studies revealed that TAN led to the deformation of MCF-7 cell morphology from spindle-shaped into round-shaped cells in addition to the formation of brown precipitate indicating the apoptosis of breast cancer cells. Moreover, it has been observed that MCF-7 cells were more sensitive to low concentrations of TAN compared to normal human epithelial breast cell lines (MCF10A) in a shorter duration that did not exceed 24 hours. This suggests that TAN-based nanoformulations can be used as targeting drug delivery systems for breast cancer cells. The study proved that the apoptotic activity of TAN is attributed to its role in activating caspase signaling cascades. Results of flow cytometry-based caspase activity assay showed that caspase 9 levels were significantly higher in TAN-treated MCF-7 when compared to TAN-treated normal breast cells confirming the potential targeting property of TAN.24 Moreover, further studies revealed that levels of both activated caspase 3 and caspase 7 were significantly elevated in TAN-treated MCF-7 cells compared to TAN-treated normal breast cells. This confirms that tannic acid possesses proapoptotic activity towards MCF-7 more than normal breast cells indicating the high sensitivity of MCF-7 cells towards it.28,29
In the current study, different anti-histaminic drugs including Loratadine were virtually screened through molecular docking to select with the highest interaction with the H1 histamine receptor. Afterward, LOR was selected and investigated in terms of virtual molecular docking with two different polymers; chitosan, a positively charged polymer, and hyaluronan, a negatively charged polymer to select the most appropriate polymer for nanocarrier preparation. Based on the in-Silico studies, chitosan was selected to prepare LOR-CS/TAN NPs through the ionic gelation method. Box Behnken Design (BBD) was followed to determine the optimum formula. The chosen independent variables were the concentration of chitosan as the formulating polymer, loratadine as the incorporated drug and tannic acid as the crosslinking agent. On the other hand, the studied responses were the nanoparticles size, PDI, zeta potential as well as entrapment efficiency. Afterward, then in-Vitro assessments were carried out to study the entrapment efficiency and drug release pattern before carrying out the in-Vitro cell line experiments including cytotoxicity to determine IC50 of free LOR, CS/TAN NPs, as well as Loratadine, loaded chitosan tannic acid nanoparticles. Finally, the cell cycle including necrosis and apoptosis was investigated to understand the mechanism of their anti-cancer activity.
Materials and Methods
Materials
Chitosan (low molecular weight) was purchased from Acros, Belgium. Tannic acid and absolute ethanol (99%) were purchased from Sigma Aldrich, Germany. Loratadine was obtained as a gift from Amoun pharmaceutical co., Egypt. Phosphate buffer saline (PBS 5.5), and cellulose dialysis membrane (cut-off 12,000 MW) were purchased from Sigma-Aldrich, Germany. The human breast adenocarcinoma cell lines (MCF-7, HTB-22) were obtained from ATCC, American Type Culture Collection, VA, USA.
In-silico Studies
Ligand Files Preparation
A series of anti-histaminic drugs (Astemizole, Cetirizine, Clemastine, Desloratadine, Ebastine, Loratadine, and Terfenadine) were downloaded in their minimized energy form as sdf files from PubChem database (https://pubchem.ncbi.nlm.nih.gov/). This step was carried out to determine the most proper anti-histaminic drug that will be selected for the current study.
Preparation of Enzyme and Polymers
H1 histamine (HSM1) receptor along with its co-crystal ligand (histamine) in addition to polymers; chitosan and hyaluronan were investigated and then downloaded from Swiss model (https://swissmodel.expasy.org/)30,31 and protein database bank (https://www.rcsb.org/) as pdb file. Afterward, the enzyme was refined and the co-crystal ligand was removed then the enzyme-only file was downloaded as pdb using PyMol software.
Molecular Docking
Molecular docking of the different anti-histaminic drugs into H1 histamine receptor using was carried out using a CB-Dock docking server (http://clab.labshare.cn/cb-dock/php/index.php).32,33 Drug-enzyme interaction files for each anti-histaminic drug were downloaded separately in mol2 format as recommended by the used server.
Interaction of Enzyme and Antihistaminic Drugs
The interaction between the receptor and each of the anti-histaminic drugs was visualized separately using Discovery Studio-19 software. The investigated interactions included H-bonding, hydrophobic interaction, aromatic ring center, covalent bond, charge center as well as parallel and perpendicular p-stacking, etc. The enzyme–antihistaminic drug-binding interaction was assessed by calculating the binding free energy (DG).
Interaction of Loratadine and Different Polymers
The molecular interaction between LOR and either chitosan, a positively charged polymer, or hyaluronan, a negatively charged polymer, was investigated separately in order to detect the most appropriate polymer to prepare the nanocarrier. CB-Dock docking server (http://clab.labshare.cn/cb-dock/php/index.php)32,33 was used to determine possible drug-polymer interactions including H-bonding, hydrophobic interaction, aromatic ring center, covalent bond, charge center as well as parallel and perpendicular p-stacking, etc. Drug – polymer interaction files for each polymer were downloaded separately in mol2 format as recommended by the used server to be visualized by Discovery Studio-19 software.
Nanoparticles Development
Screening of Stabilizers
According to the in-silico studies, LOR was selected to carry out this study. Preliminary five formulations were prepared to study the effect of using two different stabilizers separately “Tween 80” (surfactant) and PEG 400 (cosolvent) on the properties of the prepared nanoparticles. Tween 80 has been previously reported for its efficiency to stabilize chitosan nanoparticles by preventing their aggregation.34 A concentration of 0.001% w/v of Tween 80 was selected to be below the critical micelle concentration.35 Polyethylene glycol has also been reported for its ability to increase the stability of chitosan microparticles and nanoparticles for up to 28-days of storage. A concentration of 1% w/v was found to be sufficient to prevent the stored chitosan formulations.36 LOR-CS/TAN NPs were prepared through ionic gelation methods as reported previously, with some modifications.37,38 Briefly, chitosan was prepared by dissolving the proper amount in 1% acetic acid to prepare 0.1% w/v solution. Then LOR was added to an amount of 10 mL of chitosan solution so that the ratio of CS: LOR is adjusted to be 2:1. Loratadine was dissolved in the minimal amount of absolute ethanol before being added to the chitosan solution. Finally, tannic acid was used as the crosslinking agent to form CS/TAN NPs. The TAN amount was adjusted to be 1/10 of the amount of CS (weight ratio). The required amount of TAN was solubilized in 1 mL of distilled water and then slowly added dropwise to the CS and LOR solution while stirring on a magnetic stirrer. Afterward, the different formulations were assessed in terms of particle size, polydispersity index (PDI), and entrapment efficiency percentage (EE %) to determine the best surfactant and preparation conditions before starting optimization through Design Expert software.
Experimental Design
LOR-CS/TAN NPs were prepared through ionic gelation technique as previously reported with some modifications as previously discussed in 2.2.3. After selecting the optimum surfactant, different factors that are reported to significantly affect the properties of the developed nanoparticles were studied using Design Expert software (Version 13, Stat-Ease Inc., Suite 480 minneapolis, MN 55413) through Box-Behnken design (BBD) in order to detect the optimized formulation variables for preparation of LOR-CS/TAN NPs as shown in Table 1.
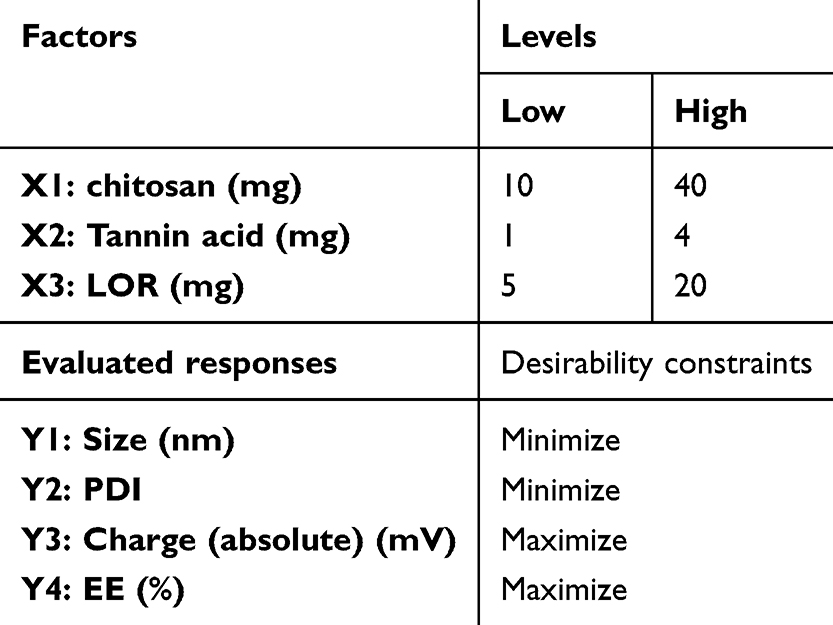 |
Table 1 Experimental Design for Optimization of LOR-CS/TAN NPs |
The concentration of CS solution, LOR amount, and amount of TAN as a crosslinking agent are suggested to be the most crucial parameters that should be studied to investigate their influence on nanoparticle properties. Hence, the independent variables were selected to be A(X1): CS amount (mg) dissolved in 20 mL of 1% acetic acid solution, B(X2): TAN amount (mg) dissolved in 1 mL distilled water, and C(X3): LOR amount (mg) dissolved in a minimal amount of absolute ethanol. The dependent variables (evaluated responses) were selected to be Y1: nanoparticles size (nm), Y2: PDI, Y3: zeta potential (ZP) and Y4: EE %. The low and high values for each factor as well as the preparation conditions were chosen according to the preliminary screening that has been carried out in section 2.3.1. For instance, PEG 400 (1% v/v) containing 1% acetic acid was used to solubilize CS solutions with concentrations of 0.05% w/v, 0.125% w/v and 0.2% w/v to represent the amounts of CS that will be used which are 10 mg, 25 mg and 40 mg, respectively, in each 20 mL solution. In addition, the values of amounts of TAN as a crosslinking agent were selected to be 1 mg, 2.5 mg and 4 mg to be solubilized in 1 mL of distilled water. Finally, the LOR amount chosen was 5 mg, 12.5 mg and 20 mg to be solubilized in a minimal amount of absolute ethanol. According to the designed BBD, 17 formulations were generated to be prepared as shown in Table 2.
 |
Table 2 Experimental Runs for Optimization of LOR-CS/TAN NPs |
All formulations were prepared through ionic gelation as previously explained, then both numerical and graphical optimization were followed to detect multiple goals with the highest desirability within the factor space and determine the design space of formulation variables according to the predetermined level of each response.39 Afterward, the setting of the factors and values as well as the predicting interval estimates40 were carried out. Then, the models were validated by calculating Bias % using equation (1).39

Design Responses
Dynamic light scattering technique was used to determine the particle size (Y1), PDI (Y1), and ZP (Y3) of the different prepared nanoparticles. This has been carried out using Malvern Zeta sizer Nano ZS (Malvern Instruments, Malvern, UK). All the samples were measured in triplicates at 25 ℃.
For the entrapment efficiency determination (Y4), A certain amount of LOR-CS/TAN NPs was re-suspended in absolute ethanol (3 mL), then left for 48 hours in a shaking incubator at 37 ℃ in order to ensure complete extraction of the whole incorporated amount of Loratadine. Afterward; Loratadine alcoholic extract was obtained through filtration of the suspension using a syringe filter. Then Loratadine concentration in the alcoholic extract was assessed using UV–Visible spectrophotometer (Evolution UV 600, Thermo Scientific, USA) at the absorbance of 275 nm. Finally, the entrapment efficiency of Loratadine was determined using equation (2).41

Morphology and Physicochemical Characterizations
Morphological examination of the optimized prepared LOR-CS/TAN NPs was carried out using Transmission Electron Microscope (TEM). A drop of the diluted nanosuspension of the developed nanoparticles was placed on a TEM copper grid and then stained with phosphotungstic acid dye before being micrographed using TEM (Jeol, USA).
Chemical characterization of both unloaded and Loratadine-loaded CS/TAN NPs was carried out using Fourier Transform Infrared (FTIR) spectroscopy (Thermoscientific, USA). It included the investigation of the chemical structures of free LOR, unloaded and loaded Loratadine CS/TAN NPs in the spectrum range of 600–4000 cm−1.
In-vitro Release Study
Loratadine release studies from the optimized LOR-CS/TAN NPs were carried out using the dialysis bag method, where a mixture of phosphate buffer saline/absolute ethanol (pH 7.0) at the ratio 7:3 was used to be the receptor medium to maintain sink. Briefly, 1 mL of LOR-CS/TAN NPs nanosuspension was placed into a dialysis bag (Spectra Por 7.10 Kd). Afterward; the dialysis bag was then inserted inside a 45 mL falcon tube incorporating 100 mL of the same previously prepared receptor medium. Afterward, the release setup was then put in a shaking incubator at 37 ℃ for a duration of 48 h in order to study the release profile of Loratadine incorporated inside the optimized NPs. At certain time points throughout the release study, 1 mL aliquot of the receptor medium was withdrawn at certain time points and replaced by a fresh medium. Then, the concentration of Loratadine in the withdrawn samples was measured at the wavelength of 275 nm using UV–Visible spectrophotometer. A sample containing an equivalent amount of free Loratadine was used in order to compare the release pattern of free Loratadine to the same amount incorporated within the optimized nanoparticles. Loratadine concentration was estimated at certain time points then calculations were carried out using equation (3). The drug release profile was evaluated in triplicate, and the results were presented in a graph, with the cumulative release percentage (%) plotted on the y-axis and time (hours) plotted on the x-axis.

where Cn is assigned for the nth sample expected concentration, while Cn means represents the measured concentration. A and V represent the withdrawn aliquot volume from the receptor medium and the dissolution medium volume, respectively. Finally, n-1 is the total volume, while Cs is the total concentration of all cumulative withdrawn aliquots at previous time points preceding the currently assessed sample.
LOR release profile data has been analyzed through different release kinetics models including zero order, first order, Higuchi, Korsmeyer–Peppas, Hixson-Crowell, Hopfenberg and Baker-Lonsdale.42
In-vitro Cell Studies
Cytotoxicity Assessment
Cytotoxicity study of free LOR, CS/TAN NPs and LOR-CS/TAN NPs were carried out in order to investigate the cytotoxic efficiency of each of them individually. A breast adenocarcinoma cell line; MCF-7 (HTB-22) obtained from the American Tissue Type Culture Collection (ATCC) was used under sterile conditions. To maintain the used cells in optimum conditions for the cell viability experiment, the cells were kept in a 5% (v/v) CO2 humidified atmosphere at 37°C inside DMEM media containing 100 units/mL of penicillin, 100 mg/mL of streptomycin, and 10% of fetal bovine serum. Cell viability assessment was carried out using Sulforhodamine B (SRB) assay. Briefly, 100 μL aliquots of cell suspension (5 X 10³ cells) were instilled into 96- well plates and then incubated for 72 hours in the used medium. Afterward, cells were then treated with another 100 μL aliquot of fresh medium containing free Loratadine, CS/TAN NPs, and LOR-CS/TAN NPs at different concentrations (0.01, 0.1, 1, 10, 100 ug/mL), each separately. The cells were left exposed to the treatment for 24 hours before being fixed by substituting the media with 150 μL of 10% TCA then left for incubation again for 1 h at 4°C. After that, the TCA solution was withdrawn, then the cells were washed 5 times using deionized water. Then, 70 μL SRB solution (0.4% w/v) was added and left for incubation for 10 min at room temperature in a dark place. Afterward, plates were washed using 1% acetic acid three times before being left in the air overnight to dry at room temperature. Then, the protein-bound SRB stain was solubilized by 10 mm of TRIS (150 μL). Finally, IC50, the half-maximal inhibitory concentration, for each sample was estimated using a BMG LABTECH- FLUOstar Omega microplate reader (Ortenberg, Germany) at the absorbance pf 540 nm using equation (4).43

Apoptosis/Necrosis Assay
Cell apoptosis and necrosis population was determined where the design of experiment involved three tested groups. The three tested groups were treated with free LOR, CS/TAN NPs and LOR-CS/TAN NPs, each separately. This was evaluated using Annexin V-FITC apoptosis detection kit (Abcam Inc., Cambridge Science Park, Cambridge, UK) and 2 fluorescent channels ACEA Novocyte TM flowcytometry (ACEA Biosciences Inc., San Diego, CA, USA). The experiments were carried out using samples that correspond to IC50 for 24 h. Cells incubated with medium only were used as a negative control. After the incubation period, cells (105 cells) have been trypsinized and washed twice using ice-cold PBS (pH 7.4). Afterward, the cells treated with each sample were incubated for 30 min with 0.5 mL of Annexin V-FITC/PI solution in dark at 25 °C. Afterward, cells were stained before being injected into a flow cytometer (ACEA Biosciences Inc., San Diego, CA, USA). Then, FITC and PI fluorescent signals were detected through FL1 and FL2 signal detectors, respectively (λex/em 488/ 530 nm for FITC and λex/em 535/617 nm for PI). In each sample, 12,000 events were considered and quadrant analyses were utilized for quantifying positive FITC and/or PI cells in order to estimate cell apoptosis, necrosis and viability occurred in each sample.9 The early (Q4) and late apoptosis (Q2) phases in addition to the necrotic phase (Q1) were analyzed then the normal cells left after treatment were detected and stated as the Q3 segment.
Cell Cycle Analysis
Breast cancer cells (MCF-7) were divided into four groups according to the treatments applied to the tested sample. For instance, the first group is the negative control (untreated cells) while the other three groups are those treated with free Loratadine, CS/TAN NPs, and LOR-CS/TAN NPs. Then, cell cycle distribution was analyzed and calculated in each group after 72-hour treatment. Cells were collected after being trypsinized and washed with ice-cold PBS of neutral pH (7.4). Afterward, the collected cells were fixed by being re-suspended in 60% cold ethanol (2 mL) and then incubated at 40 °C for 1 hour. After fixation, the cells were washed with PBS (pH 7.4) and then further re-incubated for 20 min in 1 mL of PBS containing 50 mg/mL RNAase A and 10 mg/mL propidium iodide (PI) in the dark at 37 °C in dark. This has been carried out to estimate the DNA content in these cells by using an FL2 (λex/em 535/617 nm) signal detector (ACEA Novocyte TM flowcytometer, ACEA Biosciences Inc., San Diego, CA, USA). Cell cycle distribution calculations have been conducted for 12,000 cells for each tested sample using ACEA Novo Express TM software (ACEA Biosciences Inc., San Diego, CA, USA). Detection of each cell cycle phase including G0/G1, S, and G2/M-phases has been carried out.43
Statistical Analysis
One-way analysis of variance (ANOVA) followed by Tukey’s posthoc tests was used to test the result’s significance (*p < 0.05, **p < 0.01, ***p < 0.001 and ****p < 0.0001) using the software GraphPad Prism Software version 6.
Results
In-silico Studies
Molecular Docking Between H1 histamine Receptor and Different Ligands
Gibbs free energy was calculated through CB-Dock docking server (http://clab.labshare.cn/cb-dock/php/index.php)32,33 to investigate the strength of interaction between H1 histamine receptor at a side and different ligands including histamine and various studied anti-histaminic drugs at the other side. Different sedating and non-sedating antihistamines have been selected as shown in Table 3. It is observed that the interaction of all of the studied anti-histamines with the enzyme receptor exhibits higher Gibbs free energy when compared to the interaction of Histamine itself with the receptor. This proves that all of them are promising candidates as competitors to Histamine causing the receptor blockage resulting in preventing cancer cell propagation.7,10
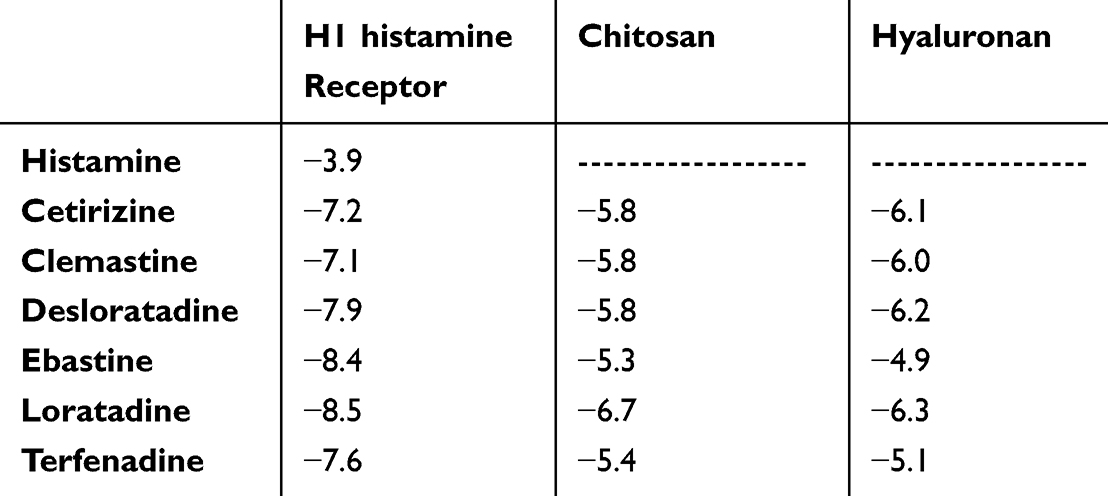 |
Table 3 Gibbs Free Energy Showing the Interaction Between Different Ligands with H1 histamine Receptor, Chitosan and Hyaluronan |
Visualization of Interaction Between H1 histamine Receptor and Histamine or Loratadine
Discovery Studio-19 software was used to visualize and investigate the interaction between either H1 histamine or LOR with H1 histamine receptor as shown in Table 4 and Figure 1. Both Table 4 and Figure 1a and b show the interaction between each of the two ligands with the receptor highlighting the amino acids involved as well as the bonds or interactions detected with their calculated distance.
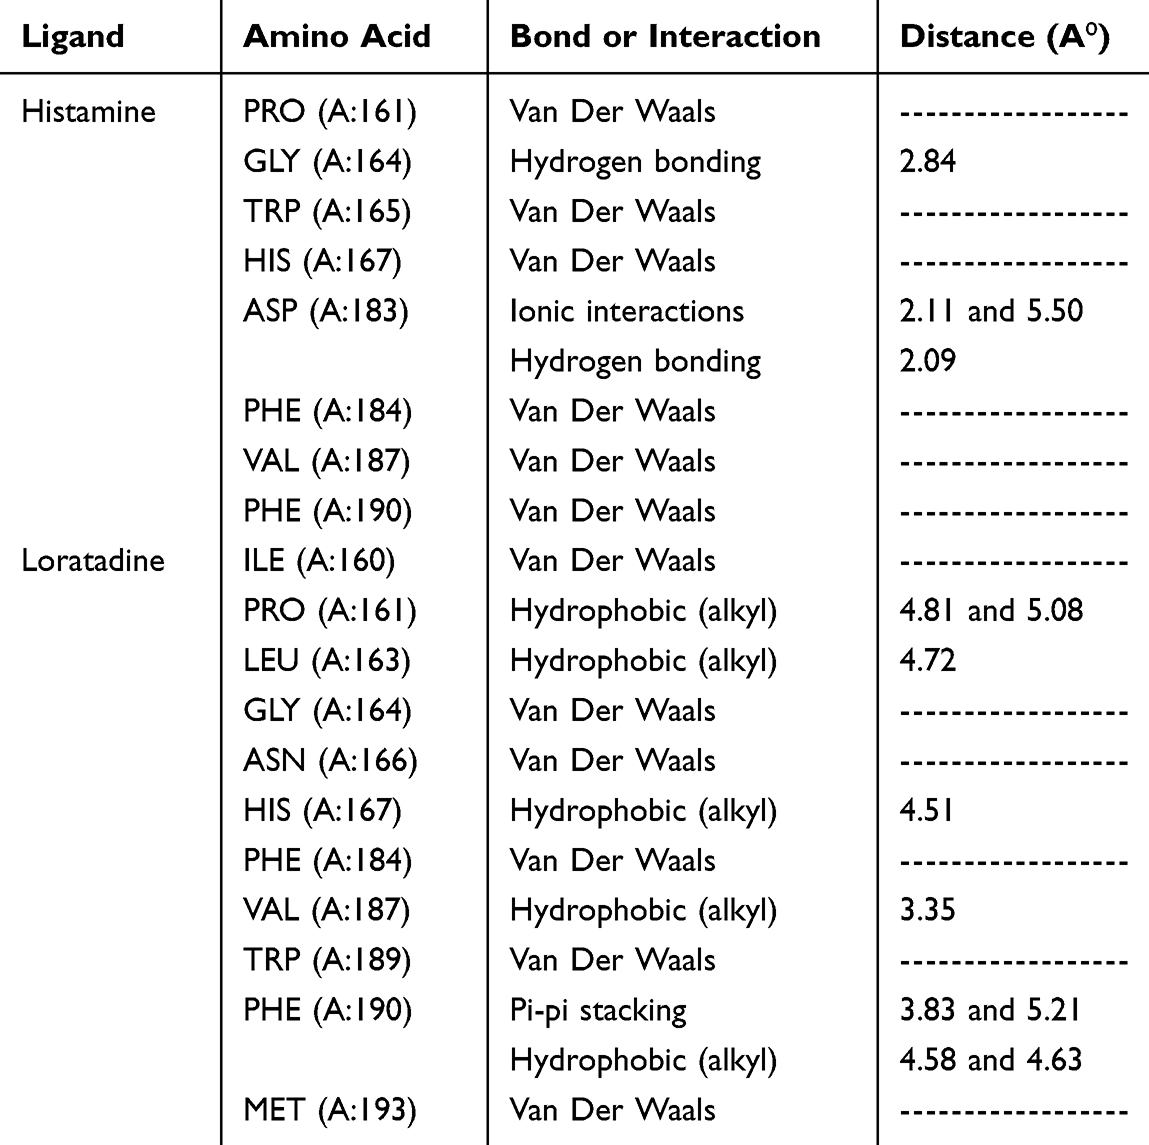 |
Table 4 A Summary of Types of Interactions Detected Between Either Histamine or Loratadine with H1 Receptor Showing the Involved Amino Acids, Types of Bonds or Interactions and Distances of Detected Bonds |
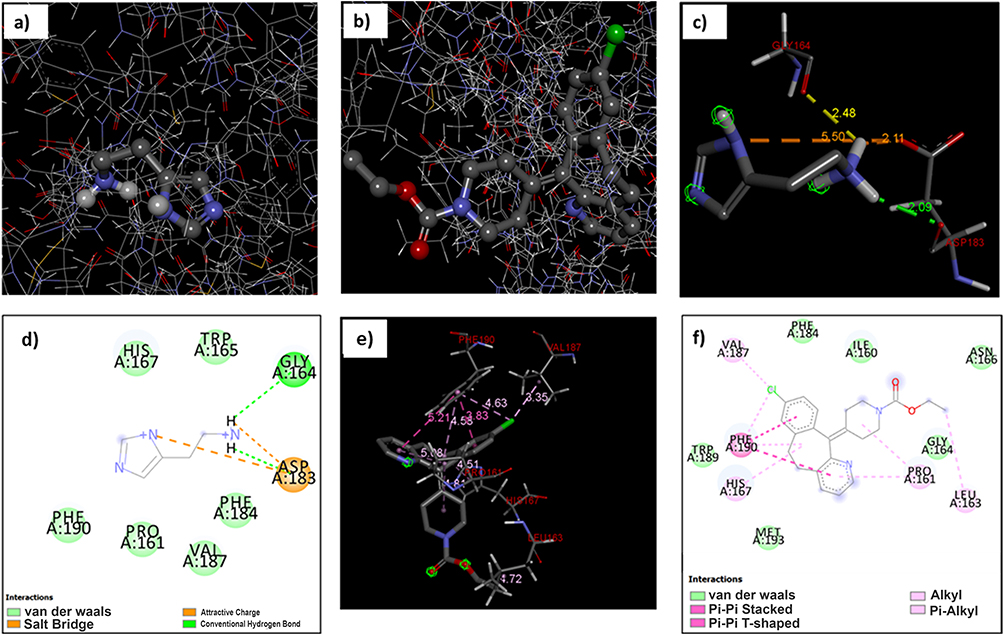 |
Figure 1 Overview for insertion of (a) histamine and (b) Loratadine in the active site of H1 receptor, 3D modeling for the interaction of H1 receptor with (c) histamine and (e) Loratadine, and a 2D diagram for the interaction of H1 receptor with (d) histamine and (f) Loratadine. |
Visualization of Interaction Between Loratadine and Different Polymers
Visualization of the interaction between Loratadine with chitosan and hyaluronan was carried out individually as shown in Table 5 and Figure 2. Figure 2a and b show the overview of the interaction between Loratadine with chitosan and hyaluronan each individually, respectively. In addition, the types of interaction as well as the distance of detected bonds are shown in Figure 2c and d for chitosan and in Figure 2e and f for hyaluronan.
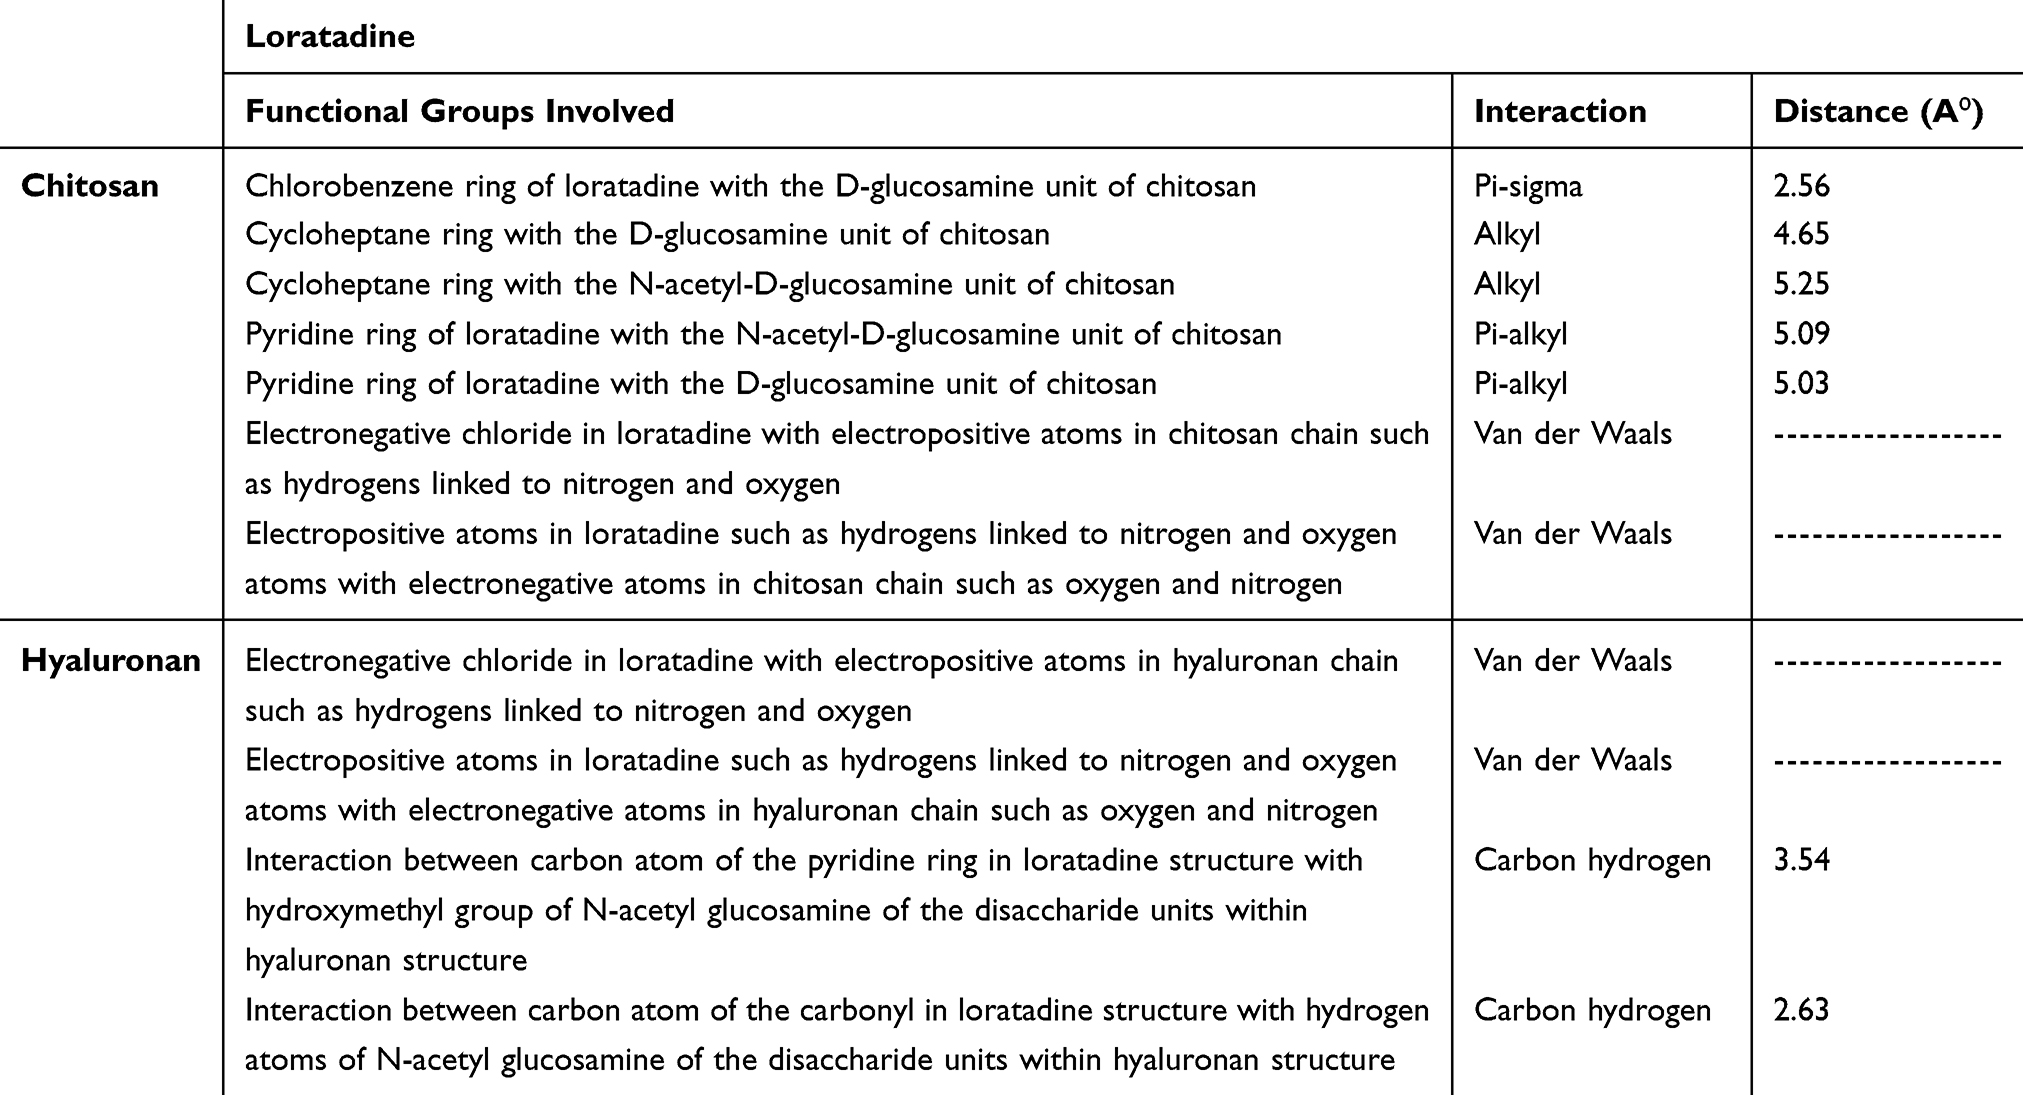 |
Table 5 A Summary of Types of Interactions Detected Between Either Histamine or Loratadine with H1 Receptor Showing the Involved Amino Acids, Types of Bonds or Interactions and Distances of Detected Bonds |
 |
Figure 2 Overview for the interaction of Loratadine with (a) chitosan and (b) hyaluronan, 3D modeling for the interaction of loratadine with (c) chitosan and (e) hyaluronan, and a 2D diagram for the interaction of loratadine with (d) chitosan and (f) hyaluronan. |
Nanoparticles Development
Screening of Stabilizers
After the virtual screening, experimental screening has been carried out to prepare LOR-CS/TAN NPs. Different formulations were prepared in different stabilizer conditions as shown in Table 6 in order to determine the best conditions for preparation. After preparation, an assessment of the prepared nanoformulations was performed in terms of size (nm), PDI, and EE%.
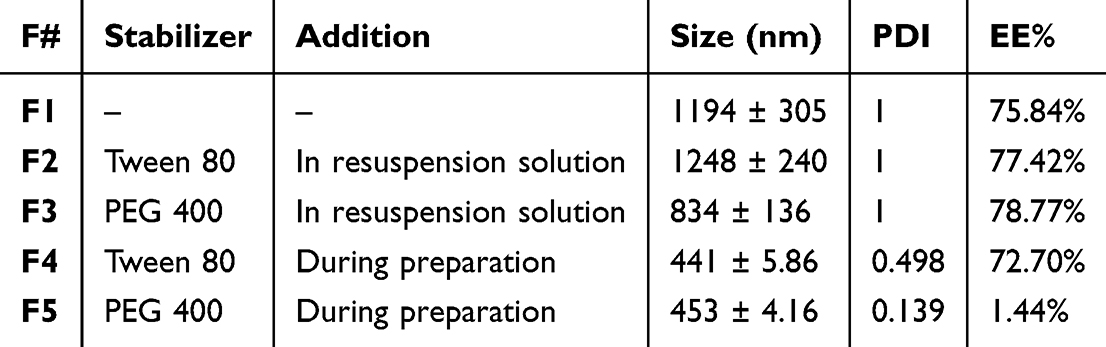 |
Table 6 Screening for Surfactant Conditions in the Preparation of LOR-CS/TAN NPs |
Experimental Design
Analysis of Box-Behnken Design Output
Preparation of different formulations was carried out according to Box-Behnken design created by Design Expert software. The design suggested 17 experimental runs as shown in Table 2 in order to consider the effect of different variables on different levels. It has been found that all of the tested dependent variables were represented by a quadratic model except charge was a linear model as shown in Table 7. Since all values of adequate precision exceed 4, then the suggested model is considered promising to fit the design space of the experiment. Moreover, it is found that values of both adjusted R2 and predicted R2 are comparable which reflects the reliability of the experimental design and the suggested model. The effect of each of the tested factors on the determined responses was studied where the results were plotted in 3D diagrams as shown in Figure 3 as well as correlation coefficients as shown in Table 8.
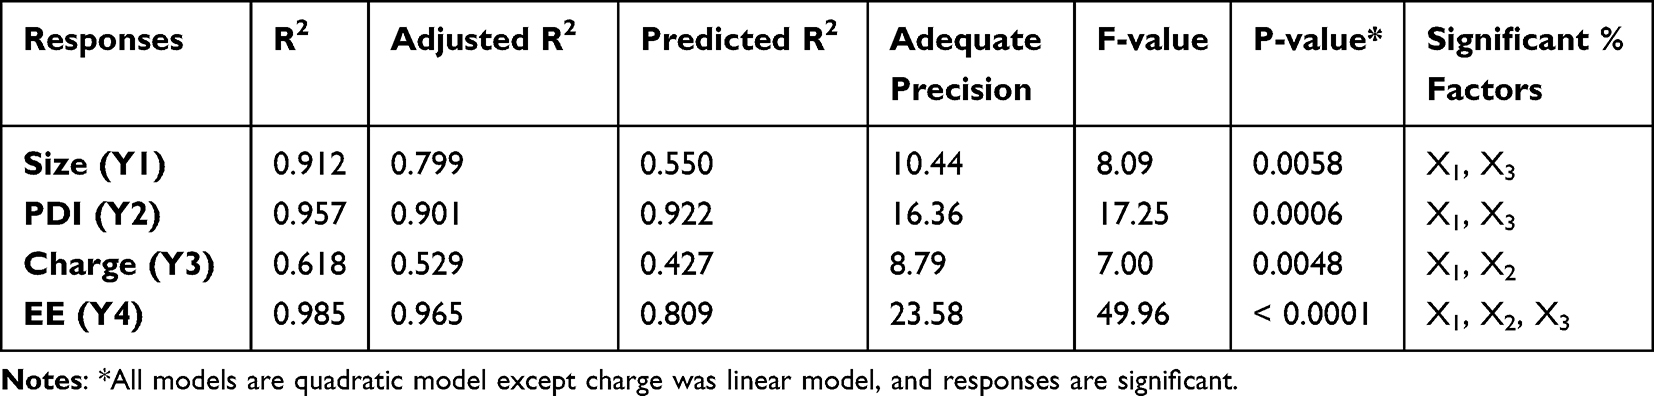 |
Table 7 Analysis of Box-Behnken Output Showing the Significance of the Tested Factors |
 |
Table 8 A Coefficient Table Highlighting the p-values of Tested Responses of the Different Formulations Showing the Correlations Between the Suggested Factors and Tested Responses |
 |
Figure 3 3D plots of tested responses for the design formulations: (a–c) Size, (d-f) PDI, (g–i) Charge and (j–l) Entrapment Efficiency. |
Particle Size
Particle size is an important factor in designing nanocarriers as the smaller the particle size, the larger the surface area to incorporate bioactive cargoes.20 The results show that the obtained nanoparticle size ranged from 258 up to 430 nm as shown in Figure 3a–c. It is also found that the obtained size of the different formulations has been influenced significantly by CS amount, and LOR amount as shown in Table 7, where they showed p-values of 0.0361 and 0.0035, respectively, as shown in Table 8.
Polydispersity Index (PDI)
The polydispersity index (PDI) is an important parameter to test the quality of the size range and size distribution of the prepared nanoparticle sample. All of the tested samples showed PDI ranging from 0.1375 up to 0.9375 indicating that some samples possess monodisperse nanoparticles while others possess nanoparticles having high polydispersity as shown in Figure 3d–f. Amount of both CS and LOR is found to significantly influence the PDI of the prepared nanoformulations compared to the TAN amount. Furthermore, the results show that the amount of both CS and LOR is inversely proportional to the PDI of the developed nanoformulations.
Surface Charge
Surface charge is an important parameter that reflects the physical stability of the prepared nanoformulations. It has been reported in the literature that increasing the surface charge of the prepared nanoparticles enhances their dispersibility. This is attributed to the abundance of intense electrostatic repulsion among the nanoparticles preventing their aggregation thus enhancing their physical stability.20,44,45 The surface charge of all of the tested formulations was found to range from −0.1 mV up to 50.1 mV as shown in Figure 3g–i. This suggests the high stability of the developed formulations. Surface charge of the developed nanoformulations was found to be more affected with concentrations of both CS and TAN when compared to LOR. IT has been found that the concentration of both is directly proportional to the surface charge of the formulations.
Entrapment Efficiency
Entrapment efficiency is a crucial parameter to investigate since it determines the amount of drug that can be incorporated within the designed nanocarrier system. The larger the amount of drug incorporated, the smaller the dose of nanoparticles that will be required for administration. The different tested formulations showed EE ranging from 45.7% up to 86.6% as shown in Figure 3j–l.
Optimization
Both numerical and graphical analyses have been carried out to determine the optimum formula possessing the highest possible EE% and surface charge while keeping the least possible size and PDI. Both optimizations shown in Figure 4a as a desirability plot and graphical optimization shown in Figure 4b as an overlay plot demonstrate quite similar results confirming the reliability of the chosen model. Both optimization approaches selected 30 possible formulations arranged descendingly according to the desirability of the tested responses. The best possible optimum possessing composed of the desirability of 0.726 was found to be composed of A: chitosan (40 mg), B: tannic acid (1 mg) and C: Loratadine (20 mg).
 |
Figure 4 Optimization of the design factors: (a) desirability plot obtained from numerical optimization and (b) overlay plot obtained from graphical optimization. |
Validation
The suggested optimum formula predicted by the software was prepared according to the previously mentioned procedures. Afterward, the obtained formulation was fully characterized in terms of size, PDI, charge and EE%. Then, the obtained results were demonstrated as the observed values and compared to the predicted values obtained from the software as shown in Table 9. Observed values for the characterization of the optimized LOR-CS/TAN NPs were found to be in high agreement with the predicted values as shown in Table 9. This confirms the high reliability of the designed and followed model generated by the software. Hence, the selected formula has been formulated for further characterization as well as experimental in-vitro assessments.
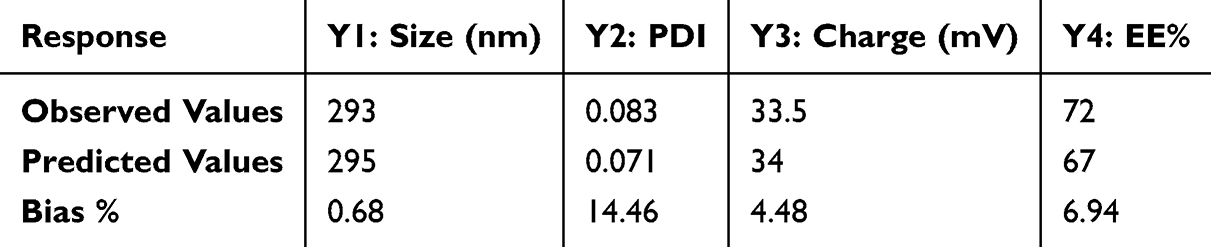 |
Table 9 The Observed and Predicted Values of Different Responses for the Optimized LOR-CS/TAN NPs Formula |
Morphology and Physicochemical Characterizations
Morphology of the optimized LOR-CS/TAN NPs was investigated through both TEM as shown in Figure 5a confirming the successful formation of the developed nanoparticles.
 |
Figure 5 Characterization of optimum loratadine loaded chitosan-based nanoparticles: (a) TEM image of optimum formulation, FTIR Spectrum for investigating the chemical structure of (b) unloaded nanoparticles, and (c) loratadine loaded nanoparticles, (d) Cumulative release of Loratadine as a free drug and from loratadine loaded nanoparticles. |
Figure 5b and c shows the FTIR spectra of CS/TAN NPs and LOR-CS/TAN NPs, respectively, indicating the successful formation of CS/TAN NPs as well as incorporation of LOR within the matrix.
In-vitro Release Study
The release study was carried out in a medium of pH 7.0 to mimic the natural environment of breast cancer tissues. The cumulative release was calculated at certain time points, then the results were plotted as shown in Figure 5d. As apparent below, it is observed that the free drug has been completely dissolved within 8 hours. However, LOR-CS/TAN NPs exhibited sustained release of Loratadine over a 24-hour duration.
In-vitro Cell Studies
Cytotoxicity Assessment
Cytotoxicity of free Loratadine, CS/TAN NPs and LOR-CS/TAN NPs were evaluated through SRB assay against MCF-7 breast cancer cell line. After 72 hours of using different concentrations (0.01–100 μg/mL) of the three treatments, the cell viability was assessed. As shown in Figure 6a, it is found that the cell viability percentage of MCF-7 breast cancer cells decreased significantly in a dose-dependent manner as a response to treatment by either free LOR or LOR-CS/TAN NPs.
 |
Figure 6 In-vitro cytotoxicity cell study: (a) Cell viability percentage and (b) IC50 of free Loratadine, CS/TAN NPs and LOR-CS/TAN NPs. (n=3, **p < 0.01, **** p < 0.0001). |
The IC50 was determined for each of the three treatments as shown in Figure 6b. It is observed that IC50 of free LOR, CS/TAN NPs and LOR-CS/TAN NPs were calculated to be 42.35 ± 3.14 μg/mL, 120 ± 4.64 μg/mL, and 22.84 ± 2.13 μg/mL, respectively.
Annexin V/Propidium Iodide Apoptosis/Necrosis Assay
Annexin V/propidium iodide assay kit was used in order to determine the mechanism of each treatment in inhibiting breast cancer cells proliferation, where the effect of each treatment was assessed in terms of early apoptosis (Q4), late apoptosis (Q2), necrosis (Q1) and cell viability (Q3) after 12-hour incubation period. Untreated breast cancer cells were used during the experiment as a control as shown in Figure 7a. Breast cancer cells were treated with free Loratadine, CS/TAN NPs and LOR-CS/TAN NPs as shown in Figure 7b–d. All of three treatments increased early apoptosis and late apoptosis significantly compared to the control as shown in Figure 7e. This is found to be in good agreement with what has been reported previously in the literature that confirms the anti-proliferative activity of both Loratadine and tannic acid.9,24
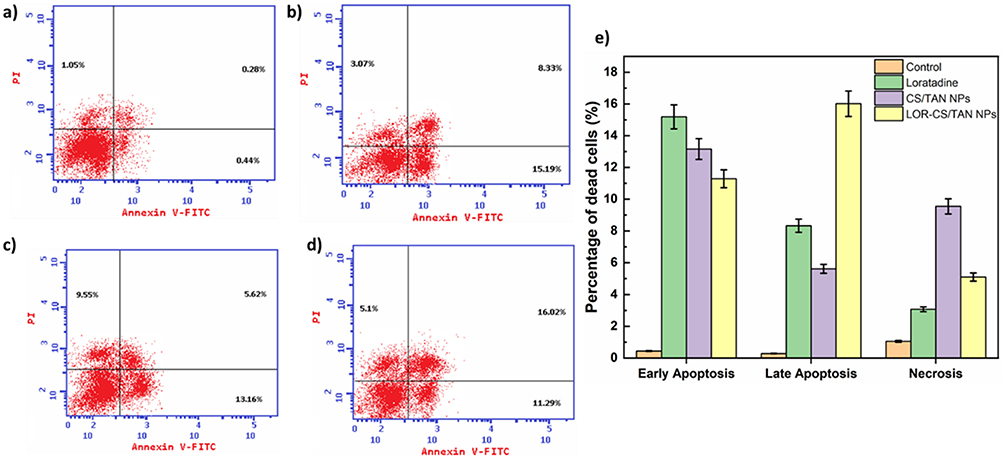 |
Figure 7 Annexin V/Propidium iodide apoptotic/necrotic assay analyzed by flow cytometry for breast cancer cells incubated with (a) untreated cells, (b) free Loratadine, (c) CS/TAN NPs, (d) LOR-CS/TAN NPs, (e) percentage of cells death of early apoptosis, late apoptosis, and necrosis for the different treatments. |
Cell Cycle Analysis
Different cell cycle phases were investigated including a) G0-G1 referring for apoptosis or non-dividing cells, b) the S phase representing the DNA synthesis phase, and finally G2-M cell demonstrating proliferation or mitosis. Untreated breast cancer cells were used as a control for the experiment as shown in Figure 8a. Cell cycle analysis of free Loratadine, CS/TAN NPs and LOR-CS/TAN NPs was measured using flow cytometry via nuclear propidium iodide staining as shown in Figure 8b–d. Figure 8e shows that breast cancer cells treated with free Loratadine mainly were suppressed in the apoptotic phase as 61.81% of these breast cancerous cells were accumulated at that phase.
 |
Figure 8 Cell cycle analyzed by flow cytometry for breast cancer cells incubated with (a) untreated cells, (b) free Loratadine, (c) CS/TAN NPs, (d) LOR-CS/TAN NPs, (e) percentage of cells cycle analysis. |
Discussion
Through in silico studies, it has been found that LOR shows the highest Gibbs free energy with the H1 histamine receptor which proves that it possesses the highest interaction with the enzyme receptor and, consequently, the highest inhibitory effect as well as anti-proliferative activity. Hence, LOR is considered a promising candidate for this study. Also, the strength of interaction between Loratadine with either chitosan, a positively charged polymer and hyaluronan, a negatively charged polymer was calculated as shown in Table 3. This step was carried out to predict the most suitable polymer for developing nanocarriers convenient for Loratadine. Results in Table 3 show that chitosan is more convenient as it possesses more interaction with LOR compared to hyaluronan.
Furthermore, visualization demonstrated that histamine and LOR interact with chain A of H1 receptor through eight and eleven amino acids, respectively. For instance, it is found that histamine interacts with the receptor through PRO (A:161), TRP (A:165), HIS (A:167), PHE (A:184), VAL (A:187), and PHE (A:190) via van der Waals interactions which are counted as very weak interactions, GLY (A:164) and ASP (A:183) through hydrogen bonding for each. Only two ionic interactions were detected between histamine and ASP (A:183) as shown in Table 4. The types of bonds and interactions detected between histamine and the receptor are shown also in Figure 1c and d. On the other hand, the interactions detected between LOR and the H1-receptor are presented in Table 4 and Figure 1e and f. For example, LOR interacts with the receptor through ILE (A:160), GLY (A:164), ASN (A:166), PHE (A:184), TRP (A:189) and MET (A:193) via van der Waals interactions. It is observed that the ratio of van der Waals interactions among histamine – H1 receptor interactions is higher than that of LOR – H1 receptor interactions which concludes that most of the abundant interactions in histamine – H1 receptors are weaker than that of LOR – H1 receptor interactions. Moreover, LOR – H1 receptor interactions showed more hydrophobic (alkyl) and pi-pi stacking interactions. For example, PRO (A:161), HIS (A:167), PHE (A:184), and VAL (A:187) interact with histamine via only van der Waals interactions. However, they interact also with LOR through hydrophobic interactions as shown in Table 4, Figure 1e and f. In addition, PHE (A:190) which interacts with histamine through van der Waals interactions only, was found to interact with LOR through both hydrophobic as well as pi-pi stacking interactions as shown in Table 4, Figure 1e and f. Furthermore, it has been found that LOR – H1 receptor interactions involve more interactions through ILE (A:160), ASN (A:166), TRP (A:189) and MET (A:193) via van der Waals interactions in addition to LEU (A:163) via hydrophobic interactions as shown in Table 4, Figure 1e and f. Finally, the distance of bonds and interactions calculated through computational modeling for both histamine and LOR with H1 receptor has been shown in Figure 1c–f, respectively, in addition to Table 4.
Therefore, it is found that Loratadine fits into the H1 receptor-binding pocket due to van der Waals forces and hydrophobic interactions as stabilizing forces. These interactions are important in blocking histamine from binding to the receptor, hence preventing histamine-mediated allergy responses. In the context of cancer, Loratadine will potentially inhibit histamine’s proliferative effect on tumor cells, thus aiding in cancer treatment.
This combination of weak molecular interactions leads to a strong overall binding affinity between Loratadine and the H1 receptor, contributing to its therapeutic effects.
As shown in Table 5, Figure 2c and d, chitosan – LOR interaction shows an abundance of pi-sigma interaction between the chlorobenzene ring of Loratadine and the D-glucosamine, the monomer of the chitosan chain. In addition, several alkyl interactions have been detected for the cycloheptane ring of Loratadine since it interacts with both D-glucosamine units as well as N-acetyl-D-glucosamine units of the chitosan chain. Furthermore, several pi-alkyl interactions have been also detected between the pyridine ring of Loratadine and both D-glucosamine units and N-acetyl-D-glucosamine units of the chitosan chain. Finally, numerous van der Waals interactions have been detected between chitosan and Loratadine. This returns back to the abundance of several electropositive atoms in both of them. For instance, each of chitosan and Loratadine have a number of electronegative atoms such as oxygen, nitrogen and chloride atoms in addition to several electropositive hydrogen atoms that create permanent dipoles resulting in the formation of dipole-dipole interactions.
Through investigation of interactions between Loratadine and hyaluronan, a negatively charged polymer, it has been observed that all of the detected interactions are van der Waals interactions and carbon-hydrogen bonds as shown in Table 5 and Figure 2e and f that demonstrate the types of interactions as well as the calculated distance of the detected bonds. For instance, a number of van der Waals interactions have been predicted owing to the abundance of electronegative chloride atoms within the Loratadine structure as well as electropositive atoms in the hyaluronan chain such as hydrogen atoms linked to nitrogen and oxygen. Furthermore, several van der Waals forces have also been observed owing to the abundance of electropositive atoms in the Loratadine structure such as hydrogen atoms linked to nitrogen and oxygen atoms along with the electronegative atoms in hyaluronan chain such as oxygen and nitrogen. In addition, two types of carbon-hydrogen bonds have been detected in the Loratadine – hyaluronan interactions. First, a carbon-hydrogen interaction is observed between the carbon atom of the pyridine ring within the Loratadine structure with the hydroxymethyl group of N-acetyl glucosamine of the disaccharide units within hyaluronan structure as shown in Figure 2e and f. The second one is detected between the carbon atom of the carbonyl in the Loratadine structure with the hydrogen atoms of N-acetyl glucosamine of the disaccharide units within the hyaluronan structure shown in Figure 2e and f. Finally, it is concluded that the overall interaction between loratadine with chitosan is stronger compared to that with hyaluronan. Therefore, chitosan will be selected to be used in order to develop the nanocarrier for incorporating Loratadine.
Preliminary studies revealed that using a stabilizer produced more monodisperse nanoparticles than preparation without using any surfactants. In addition, it was found that the preparation of nanoparticles in the presence of either PEG or tween 80 produced smaller size and monodisperse nanoparticles compared to using the same concentrations of the same surfactants for only washing and re-suspending the nanoparticles. Furthermore, it has been determined that 1% w/v PEG is much more efficient in preventing nanoparticle aggregation when compared to tween 80 (0.001%w/v). Therefore, the optimum stabilizer conditions were chosen to use 1% w/v PEG solution containing 1% acetic acid to solubilize chitosan for the purpose of preparation of chitosan nanoparticles. As shown in Table 6, F5 showed the most monodisperse nanoparticles possessing a PDI of 0.139 while keeping the best entrapment efficiency (79.44%) and considerable nanoparticles size with an average of 453 ± 4.16 nm.
Furthermore, particle size analysis as illustrated in Figure 3a–c showed that increasing nanoparticles size was detected with the increase of chitosan concentration while a decrease in LOR amount compared to polymer amount. This was inferred from the coefficient values which showed 19.39 and −32.39, respectively. This suggests that LOR interacts with chitosan chains forcing them to compact near each other resulting in minimizing the nanoparticle size. This is found to be in good agreement with the results of in silico studies summarized in Table 5 and Figure 2 as they showed the high interaction between LOR and CS owing to the abundance of various interactions including alkyl, pi-sigma, pi-alkyl and Van der Waals interactions. However, TAN concentration was the least significant towards particle size, where it showed p-value of 0.37 and a coefficient of 7.18.
Similar to the particle size results, it has been found that PDI has been affected significantly by both CS amount, and LOR amount as shown in Table 7, where they showed p-values of 0.0003 and 0.0337, respectively as shown in Table 8. However, unlike particle size results, it has been found that PDI results are inversely proportional to the amount of both CS and LOR as shown in Figure 3d–f and Table 8. This is confirmed by the coefficient values which showed −0.15 and - 0.059375, respectively. Like particle size results, it has been found that TAN concentration was the least significant factor towards PDI, where it showed p-value of 0.69 and a coefficient of 0.009375.
In addition, it has been inferred that most of the samples possess high positive charge on their surface proving their high physical stability through preventing their aggregation. It is found that the surface charge has been influenced significantly by both CS amount, and TAN amount as shown in Table 7, where they showed p-values of 0.0084 and 0.0117, respectively, as shown in Table 8. Furthermore, it is inferred from the results that the surface charge of the formulations is directly proportional to the amount of both chitosan and TAN as shown in Figure 3g–i and Table 8. This is confirmed by the coefficient values which showed 11.45 and 10.83, respectively. Finally, it has been observed that LOR concentration showed the least significance towards surface charge, where it possessed p-value of 0.1196 and a coefficient of 6.15.
It has been found that all three tested factors have a significant influence on the EE% results as shown in Table 7, where all of them showed p-value of < 0.0001 as shown in Table 8. Furthermore, Table 8 and Figure 3j–l showed that EE% is directly proportional to CS concentration, while inversely proportional to both TAN and LOR concentrations. This has also been confirmed through the coefficients where it was found that the coefficient of EE% with CS amount, TAN amount, and LOR amount were 7.4, −9.51, and −10.11, respectively. Finally, it is found that the order of factors influencing the EE% is CS amount, TAN amount, and LOR amount ascendingly.
According to the Design Expert analysis, this optimum formula should possess a size of 295 nm, PDI of 0.071, a charge of 34 mV and EE% of 67%. Hence, this formulation was selected in order to be prepared and characterized again in terms of size, PDI, charge and EE% to investigate the reliability of Design Expert predictions through experimental approaches.
TEM imaging demonstrated that the size of the obtained LOR-CS/TAN NPs range between 200 and 250 nm with almost spherical morphology. Furthermore, the obtained results showed that the developed nanoparticles are in good agreement with the particle size obtained from the experimental design results.
Furthermore, the successful formation of CS/TAN MPs as well as incorporation of LOR inside the developed nanoparticles was confirmed through FTIR analysis. In Figure 5b, the chitosan spectrum shows a broad characteristic peak at 3440 cm−1 attributing to the stretching of both O – H and NH2 groups. Furthermore, the amide I band, indicating C = O of the NHCOCH3 group, while the amide II band, indicating the C – O stretching along with N – H bending, are determined through the appearance of peaks at 1651 cm−1 and 1640 cm−1, respectively. In addition, peaks appearing at 2921 cm−1 show both the symmetric CH3 and asymmetric CH2 stretching.21,38,46,47 The spectrum of the tannic acid in Figure 6a shows two characteristic peaks at 3395 cm−1 and 1713 cm−1, accounting for O – H stretching and the C = O group of the carboxylic groups, respectively. Moreover, the aromatic rings of tannic acid are indicated by characteristic peaks of conjugated C = C bonds appearing at 1611 cm−1 and 1532 cm−1.48 The spectrum of CS/TAN NPs shown in Figure 5b and c a shows a broad peak at 3413 cm−1 (in between the NH2 peak of chitosan and carboxylic O – H of tannic acid) indicating the successful crosslinking between chitosan and tannic acid. This is also confirmed through the slight shift of the C = O group that appears at 1644 cm−1. On the other hand, the LOR spectrum in Figure 5c shows characteristic peaks at 1700 cm-1 and 1600 cm−1 attributing to C = O of the ester and the C = N (imine group) of the pyridine ring. Additionally, the C – N bond is denoted by an intense peak appearing at 1433 cm−1.49 Finally, the disappearance of the characteristic peaks of LOR in the spectrum of LOR-CS/TAN NPs proves the successful incorporation of LOR inside CS/TAN NPs.38
Cumulative release results showed that the designed nanoparticles showed burst release (~20% of the drug) within the first hour. Afterward, the nanoparticles showed controlled sustained release till releasing the rest of the incorporated drug was within 24 hours. LOR release kinetics from the LOR-CS/TAN NPs followed the Korsmeyer-Peppas model with r2 of 0.969. Korsmeyer-Peppas is a simple model explaining drug release from a polymeric system. Furthermore, the dissolution efficiency (DE) was 8.7 and 8.1 for free LOR and LOR-CS/TAN NPs, respectively. On the other hand, the mean dissolution time (MDT) was 1 h and 4.34 h for free LOR and LOR-CS/TAN NPs, respectively, which confirm the sustain release profile controlled by the polymeric matrix.
Cytotoxicity results on MCF-7 breast cancer cells demonstrated in Figure 6a showed that the cell viability percentage decrease in treatment with LOR-CS/TAN NPs is higher than the decrease in the case of treatment by free LOR. This can be attributed to the synergistic effect of LOR, CS and TAN together. This is found to be in good agreement with previously reported studies that confirm the anti-proliferative and apoptotic activities of Loratadine, chitosan as well as tannic acid in cancer treatment.9,24,48,50 Although the IC50 of CS/TAN NPs is relatively high, it is confirmed that the synergistic effect of both Loratadine and CS/TAN NPs led to a decrease in the IC50 significantly (Figure 6b). The results suggest that the required dose of LOR could be decreased almost to half when being incorporated within CS/TAN NPs instead of being administered as a free drug.
It is inferred from Figure 7b, that the cytotoxicity of free Loratadine is mainly attributed to the additive effect of early apoptosis (15.19%) and late apoptosis (8.33%), where necrosis shows only 3.07%. Similarly, CS/TAN NPs show the main cytotoxicity owing to the additive effect of early apoptosis (13.16%) and late apoptosis (5.62%) while necrosis showed only 9.55% as shown in Figure 7c. Figure 7d shows also that the cytotoxicity of LOR-CS/TAN NPs mainly returns back to the additive effect of early apoptosis (11.29%) and late apoptosis (16.02%), where necrosis contributed only with 5.1%. Interestingly, it is observed that apoptosis increased significantly in the case of LOR-CS/TAN NPs compared CS/TAN NPs, which suggests the synergistic effect of both Loratadine and tannic acid-containing nanoparticles. Moreover, a noticeable decrease in the necrotic activity of LOR-CA/TAN NPs was observed compared to that of unloaded CS/TAN NPs. This confirms the high ability of the designed nanoparticles to induce programmed death in cancer cells.43
Additionally, cell cycle analysis results in Figure 8 confirmed that Loratadine possesses the reasonable capability of suppressing breast cancer cells in the S and G2-M phases through an accumulation of 26.06% and 12.13%, respectively. This is found in good agreement with what has been reported previously for the capability of Loratadine to dysregulate cell cycle progression and caspase-9-mediated apoptosis.8,9 Similarly, CS/TAN NPs were found to suppress breast cancer cells through the G0-G1 phase, followed by the S phase and then the G2-M phase where 49.33%, 39.71%, and 10.96% of the cancerous cells were accumulated in the three phases, respectively. This can be attributed to the abundance of tannic acid within the nanocarrier structure that has been reported previously for its apoptotic activity when used as a crosslinking agent towards breast cancer cells through activation of caspase 3/7 enzymes.24 Interestingly, it is observed that LOR-CS/TAN NPs showed enhanced cell suppression of breast cancer cells in both G0-G1 and S phases owing to the synergistic effect of the abundance of both Loratadine and tannic acid within the nanocarrier structure. The results show that cell suppression in breast cancer cells treated with LOR-CS/TAN NPs is mainly due to the G0-G1 phase followed by the S phase and finally G2-M where 65.42%, 26.87% and 7.71% of cancerous cells were accumulated, respectively. The higher percentage of late apoptosis observed for LOR-CS/TAN NPs could be attributed to the sustained release of Loratadine from the nanoparticles, which might delay the induction of early apoptosis but lead to a more pronounced effect in late apoptosis.
Conclusion
This study involved the incorporation of Loratadine in chitosan tannic acid nanoparticles to be used as alone anti-proliferative agent in breast cancer either as an adjunct therapy to chemotherapeutic agents. This would allow for a decrease in the required doses of conventional chemotherapy and hence minimize their side effects. Tannic acid was used as a crosslinking agent to design the nanoparticles owing to its reported activity toward targeting breast cancer cells. Optimization of nanoparticles was carried out using Box-Behnken design through Design Expert software. The designed nanoparticles showed 293 nm size, 0.083 PDI, 33.5 mV zeta potential and 72% entrapment efficiency. The obtained results showed low Bias% compared to the predicted values indicating the high reliability of the followed design model. Furthermore, TEM showed the successful formation of spherical nanoparticles with size values similar to what has been obtained from the zeta sizer. FTIR confirmed the crosslinking of chitosan with tannic acid in addition to the incorporation of Loratadine within the designed nanoparticles. In addition, the designed LOR-CS/TAN NPs showed the successful release of the incorporated drug within 24 hours in a controlled manner compared to free Loratadine which completely dissolved within only 8 hours. Finally, in Vitro experiments using the breast cancer cell line MCF-7 showed that LOR-CS/TAN NPs are promising nanocarriers for the delivery of Loratadine owing to the synergistic apoptotic of tannic acid along with Loratadine. The efficiency of tannic acid was not limited only to being a crosslinking agent for nanoparticles stability but also contributed to the biological activity by inducing apoptosis, as confirmed through cell cycle and apoptosis/necrosis assays. These findings propose the efficiency of LOR-CS/TAN NPs as a promising potential novel therapeutic agent for breast cancer treatment owing to the combined therapeutic actions of Loratadine and tannic acid. Further detailed in vitro and in vivo studies are planned to explore the biological activity of LOR-CS/TAN NPs in breast cancer treatment.
Acknowledgment
The authors extend their appreciation to the Deanship of Graduate Studies at Ajman University, Ajman, United Arab Emirates, for publication charges support.
Author Contributions
All authors made a significant contribution to the work reported, whether that is in the conception, study design, execution, acquisition of data, analysis and interpretation, or in all these areas; took part in drafting, revising or critically reviewing the article; gave final approval of the version to be published; have agreed on the journal to which the article has been submitted; and agree to be accountable for all aspects of the work.
Funding
This research work was supported by Ajman University Internal Research Grant No. [DGSR Ref. 2021-IRG-PH-10]. The research findings presented in this paper are solely the authors responsibility.
Disclosure
The authors declare that they have no known competing financial interests or personal relationships that could have appeared to influence the work reported in this paper.
References
1. Siegel RL, Miller KD, Jemal A. Cancer statistics, 2020. CA Cancer J Clin. 2020;70(1):7–30. doi:10.3322/caac.21590
2. Grayson M. Breast cancer. Nature. 2012;485(7400):S49–S49. doi:10.1038/485S49a
3. Bray F, Ferlay J, Soerjomataram I, Siegel RL, Torre LA, Jemal A. Global cancer statistics 2018: GLOBOCAN estimates of incidence and mortality worldwide for 36 cancers in 185 countries. CA Cancer J Clin. 2018;68(6):394–424. doi:10.3322/caac.21492
4. Zeeneldin AA, Ramadan M, Elmashad N, Fakhr I, Diaa A, Mosaad E. Breast cancer laterality among Egyptian patients and its association with treatments and survival. J Egypt Natl Canc Inst. 2013;25(4):199–207. doi:10.1016/j.jnci.2013.09.003
5. Simon FER, Simons KJ. H1 antihistamines: current status and future directions. World Allergy Organ J. 2008;1(9):145–155. doi:10.1186/1939-4551-1-9-145/TABLES/10
6. Blaya B, Nicolau-Galmés F, Jangi SM, et al. Histamine and histamine receptor antagonists in cancer biology. Inflamm Allergy - Drug Targets. 2010;9(3):146–157. doi:10.2174/187152810792231869
7. Wang WT, Chen YH, Hsu JL, et al. Terfenadine induces anti-proliferative and apoptotic activities in human hormone-refractory prostate cancer through histamine receptor-independent Mcl-1 cleavage and Bak up-regulation. Naunyn Schmiedebergs Arch Pharmacol. 2014;387(1):33–45. doi:10.1007/s00210-013-0912-x
8. Chen J-S, Lin S-Y, Tso W-L, et al. Checkpoint kinase 1-mediated phosphorylation of Cdc25C and bad proteins are involved in antitumor effects of loratadine-induced G 2 /M phase cell-cycle arrest and apoptosis. Mol, Carcinog. 2006;45(7):461–478. doi:10.1002/mc.20165
9. Soule BP, Simone NL, DeGraff WG, Choudhuri R, Cook JA, Mitchell JB. Loratadine dysregulates cell cycle progression and enhances the effect of radiation in human tumor cell lines. Radiat Oncol. 2010;5(1):1–12. doi:10.1186/1748-717X-5-8/FIGURES/6
10. Ellegaard AM, Dehlendorff C, Vind AC, et al. Repurposing cationic amphiphilic antihistamines for cancer treatment. EBioMedicine. 2016;9:130–139. doi:10.1016/J.EBIOM.2016.06.013
11. Wang JJ, Zeng ZW, Xiao RZ, et al. Recent advances of chitosan nanoparticles as drug carriers. Int J Nanomed. 2011;6:765–774. doi:10.2147/IJN.S17296
12. Duceppe N, Tabrizian M. Advances in using chitosan-based nanoparticles for in vitro and in vivo drug and gene delivery. Expert Opin Drug Deliv. 2010;7(10):1191–1207. doi:10.1517/17425247.2010.514604
13. Elgadir MA, Uddin MS, Ferdosh S, Adam A, Chowdhury AJK, Sarker MZI. Impact of chitosan composites and chitosan nanoparticle composites on various drug delivery systems: a review. J Food Drug Anal. 2015;23(4):619–629. doi:10.1016/J.JFDA.2014.10.008
14. Ali A, Ahmed S. A review on chitosan and its nanocomposites in drug delivery. Int J Biol Macromol. 2018;109:273–286. doi:10.1016/j.ijbiomac.2017.12.078
15. Rinaudo M. Chitin and chitosan: properties and applications. Prog Polym Sci. 2006;31(7):603–632. doi:10.1016/j.progpolymsci.2006.06.001
16. Sun K, Li ZH. Preparations, properties and applications of chitosan based nanofibers fabricated by electrospinning. Polym Lett. 2011;5(4):342–361. doi:10.3144/expresspolymlett.2011.34
17. Dutta PK, Dutaa J, Tripathi VS. Chitin and chitosan: chemistry, properties and applications. J Sci Ind Res. 2009;63(1):20–31.
18. Rabea EI, Badawy ME-T, Stevens CV, Smagghe G, Steurbaut W. Chitosan as antimicrobial agent: applications and mode of action. Biomacromolecules. 2003;4(6):1457–1465. doi:10.1021/bm034130m
19. Angelova N, Manolova N, Rashkov I, Maximova V, Bogdanova S, Domard A. Preparation and properties of modified chitosan films for drug release. J Bioact Compat Polym. 1995;10(4):285–298. doi:10.1177/088391159501000401
20. Ali IH, Khalil IA, El-Sherbiny IM. Single-dose electrospun nanoparticles-in-nanofibers wound dressings with enhanced epithelialization, collagen deposition, and granulation properties. ACS Appl Mater Interfaces. 2016;8(23):14453–14469. doi:10.1021/acsami.6b04369
21. Ali IH, Ouf A, Elshishiny F, et al. Antimicrobial and wound-healing activities of graphene-reinforced electrospun chitosan/gelatin nanofibrous nanocomposite scaffolds. ACS Omega. 2022;7(2):1838–1850. doi:10.1021/ACSOMEGA.1C05095
22. Arida IA, Ali IH, Nasr M, El-Sherbiny IM. Electrospun polymer-based nanofiber scaffolds for skin regeneration. J Drug Deliv Sci Technol. 2021;64:102623. doi:10.1016/j.jddst.2021.102623
23. El-sherbiny IM, Ali IH. Eco-friendly electrospun polymeric nanofibers-based nanocomposites for wound healing and tissue engineering. In: Eco-Friendly Polymer Nanocomposites. Advanced Structured Materials. Vol. 75. India: Springer; 2015:399–431.
24. Booth BW, Inskeep BD, Shah H, Park JP, Hay EJ, Burg KJL. Tannic acid preferentially targets estrogen receptor-positive breast cancer. Int J Breast Cancer. 2013;2013:1–9. doi:10.1155/2013/369609
25. Losso JN, Bansode RR, Trappey A, Bawadi HA, Truax R. In vitro anti-proliferative activities of ellagic acid. J Nutr Biochem. 2004;15(11):672–678. doi:10.1016/J.JNUTBIO.2004.06.004
26. Boitier E, Gautier JC, Roberts R. Advances in understanding the regulation of apoptosis and mitosis by peroxisome-proliferator activated receptors in pre-clinical models: relevance for human health and disease. Comp Hepatol. 2003;2(1):3. doi:10.1186/1476-5926-2-3
27. Bawadi HA, Bansode RR, Trappey A, Truax RE, Losso JN. Inhibition of Caco-2 colon, MCF-7 and Hs578T breast, and DU 145 prostatic cancer cell proliferation by water-soluble black bean condensed tannins. Cancer Lett. 2005;218(2):153–162. doi:10.1016/J.CANLET.2004.06.021
28. Thornberry NA, Rano TA, Peterson EP, et al. A combinatorial approach defines specificities of members of the caspase family and granzyme B. Functional relationships established for key mediators of apoptosis. J Biol Chem. 1997;272(29):17907–17911. doi:10.1074/JBC.272.29.17907
29. Stennicke HR, Renatus M, Meldal M, Salvesen GS. Internally quenched fluorescent peptide substrates disclose the subsite preferences of human caspases 7 and 8. Biochem J. 2000;350(2):563–568. doi:10.1042/0264-6021:3500563
30. Waterhouse AL, Bertoni M, Bienert S, et al. SWISS-MODEL: homology modelling of protein structures and complexes. Nucleic Acids Res. 2018;46 46:W296–W303.
31. Bienert S, Waterhouse A, De Beer TAP, et al. The SWISS-MODEL repository-new features and functionality. Nucleic Acids Res. 2017;45 45:D313–D319.
32. Liu Y, Grimm M, Tao DW, Chun HM, Xiao ZX, Cao Y. CB-Dock: a web server for cavity detection-guided protein–ligand blind docking. Acta Pharmacol Sin. 2019;41(1):138–144. doi:10.1038/s41401-019-0228-6
33. Cao Y, Li L. Improved protein–ligand binding affinity prediction by using a curvature-dependent surface-area model. Bioinformatics. 2014;30(12):1674–1680. doi:10.1093/bioinformatics/btu104
34. Sukmawati A, Utami W, Yuliani R, Da’I M, Nafarin A. Effect of tween 80 on nanoparticle preparation of modified chitosan for targeted delivery of combination doxorubicin and curcumin analogue. IOP Conf Ser Mater Sci Eng. 2018;311(1):012024. doi:10.1088/1757-899X/311/1/012024
35. Mahmood ME, Al-koofee DA. Effect of temperature changes on critical micelle concentration for tween series surfactant. Glob J Sci Front Res Chem. 2013;13(4):1–7.
36. Luangtana-Anan M, Limmatvapirat S, Nunthanid J, Chalongsuk R, Yamamoto K. Polyethylene glycol on stability of chitosan microparticulate carrier for protein. AAPS Pharm Sci Tech. 2010;11(3):1376–1382. doi:10.1208/s12249-010-9512-y
37. Motawi TK, El-Maraghy SA, ElMeshad AN, Nady OM, Hammam OA. Cromolyn chitosan nanoparticles as a novel protective approach for colorectal cancer. Chem Biol Interact. 2017;275:1–12. doi:10.1016/J.CBI.2017.07.013
38. Delan WK, Zakaria M, Elsaadany B, ElMeshad AN, Mamdouh W, Fares AR. Formulation of simvastatin chitosan nanoparticles for controlled delivery in bone regeneration: optimization using Box-Behnken design, stability and in vivo study. Int J Pharm. 2020;577:119038. doi:10.1016/j.ijpharm.2020.119038
39. Abo-zalam HB, El-Denshary ES, Abdelsalam RM, Khalil IA, Khattab MM, Hamzawy MA. Therapeutic advancement of simvastatin-loaded solid lipid nanoparticles (SV-SLNs) in treatment of hyperlipidemia and attenuating hepatotoxicity, myopathy and apoptosis: comprehensive study. Biomed Pharmacother. 2021;139:111494. doi:10.1016/j.biopha.2021.111494
40. Shah M, Pathak K. Development and statistical optimization of solid lipid nanoparticles of Simvastatin by using 2 3 full-factorial design. AAPS Pharm Sci Tech. 2010;11(2):489–496. doi:10.1208/s12249-010-9414-z
41. Agnihotri SA, Jawalkar SS, Aminabhavi TM. Controlled release of cephalexin through gellan gum beads: effect of formulation parameters on entrapment efficiency, size, and drug release. Eur J Pharm Biopharm. 2006;63(3):249–261. doi:10.1016/j.ejpb.2005.12.008
42. Costa P, Sousa Lobo JM. Modeling and comparison of dissolution profiles. Eur J Pharm Sci. 2001;13(2):123–133. doi:10.1016/S0928-0987(01)00095-1
43. Ibrahim A, Khalil IA, El-Sherbiny IM. Development and evaluation of core-shell nanocarrier system for enhancing the cytotoxicity of doxorubicin/metformin combination against breast cancer cell line. J Pharm Sci. 2022;1–11. doi:10.1016/j.xphs.2022.05.018
44. Khalil IA, Ali IH, El-Sherbiny IM. Noninvasive biodegradable nanoparticles-in-nanofibers single-dose ocular insert: in vitro, ex vivo and in vivo evaluation. Nanomedicine. 2019;14(1):33–55. doi:10.2217/nnm-2018-0297
45. Betancourt T, Brown B, Brannon-Peppas L. Doxorubicin-loaded PLGA nanoparticles by nanoprecipitation: preparation, characterization, and in-vitro evaluation. Futur Med. 2007;2(2):219–232.
46. Mladenovska K, Cruaud O, Richomme P, et al. 5-ASA loaded chitosan–Ca–alginate microparticles: preparation and physicochemical characterization. Int J Pharm. 2007;345(1–2):59–69. doi:10.1016/j.ijpharm.2007.05.059
47. Qian Y-F, Zhang K-H, Chen F, Ke Q-F, Mo X-M. Cross-linking of gelatin and chitosan complex nanofibers for tissue-engineering scaffolds. J Biomater Sci Polym Ed. 2011;22(8):1099–1113. doi:10.1163/092050610X499447
48. Shabanian M, Khaleghi M, Allahyari F, et al. Tannic acid-modified tin oxide nanoparticle and aromatic polyamide: from synthesis to their application for preparation of safe p-PVC. Polym Bull. 2021;78(3):1331–1352. doi:10.1007/s00289-020-03160-0
49. Alatas F, Aprilliana M, Gozali D. The preparation and solubility of loratadine-fumaric acid binary mixture. Asian J Pharm Clin Res. 2017;10(1):331–334. doi:10.22159/ajpcr.2017.v10i1.15400
50. Sharan Adhikari H, Nath Yadav P. Anticancer activity of chitosan, chitosan derivatives, and their mechanism of action. Int J Biomater. 2018;2018:29. doi:10.1155/2018/2952085
 © 2024 The Author(s). This work is published and licensed by Dove Medical Press Limited. The
full terms of this license are available at https://www.dovepress.com/terms.php
and incorporate the Creative Commons Attribution
- Non Commercial (unported, 3.0) License.
By accessing the work you hereby accept the Terms. Non-commercial uses of the work are permitted
without any further permission from Dove Medical Press Limited, provided the work is properly
attributed. For permission for commercial use of this work, please see paragraphs 4.2 and 5 of our Terms.
© 2024 The Author(s). This work is published and licensed by Dove Medical Press Limited. The
full terms of this license are available at https://www.dovepress.com/terms.php
and incorporate the Creative Commons Attribution
- Non Commercial (unported, 3.0) License.
By accessing the work you hereby accept the Terms. Non-commercial uses of the work are permitted
without any further permission from Dove Medical Press Limited, provided the work is properly
attributed. For permission for commercial use of this work, please see paragraphs 4.2 and 5 of our Terms.
Recommended articles
Preparation of Betulinic Acid Galactosylated Chitosan Nanoparticles and Their Effect on Liver Fibrosis

Wu ZC, Liu XY, Liu JY, Piao JS, Piao MG
International Journal of Nanomedicine 2022, 17:4195-4210
Published Date: 14 September 2022
Gentiopicroside-Loaded Chitosan Nanoparticles Inhibit TNF-α-Induced Proliferation and Inflammatory Response in HaCaT Keratinocytes and Ameliorate Imiquimod-Induced Dermatitis Lesions in Mice
Zhao K, Pu S, Sun L, Zhou D
International Journal of Nanomedicine 2023, 18:3781-3800
Published Date: 10 July 2023
From Pioneering Discoveries to Innovative Therapies: A Journey Through the History and Advancements of Nanoparticles in Breast Cancer Treatment
Basingab FS, Alshahrani OA, Alansari IH, Almarghalani NA, Alshelali NH, Alsaiary AH, Alharbi N, Zaher KA
Breast Cancer: Targets and Therapy 2025, 17:27-51
Published Date: 21 January 2025