")
Back to Journals » Journal of Inflammation Research » Volume 18
Machine Learning-Based Mortality Risk Prediction Model in Patients with Sepsis
Authors Zhang Y, Li C, Ji Y, Wei B , Guo S, Mei X, Wang J
Received 4 November 2024
Accepted for publication 14 March 2025
Published 19 May 2025 Volume 2025:18 Pages 6427—6437
DOI https://doi.org/10.2147/JIR.S502837
Checked for plagiarism Yes
Review by Single anonymous peer review
Peer reviewer comments 2
Editor who approved publication: Dr Tara Strutt
Ye Zhang,1 Chen Li,1 Yilin Ji,2 Bing Wei,1 Shubin Guo,1 Xue Mei,1 Junyu Wang1
1Emergency Medicine Clinical Research Center, Beijing Chao-Yang Hospital &Capital Medical University, Beijing, 100000, People’s Republic of China; 2Shandong University of Traditional Chinese Medicine College of Optometry and Ophthalmology, Jinan, Shandong Province, 250355, People’s Republic of China
Correspondence: Junyu Wang, Email [email protected] Xue Mei, Email [email protected]
Objective: The aim of our study was to establish and validate a machine learning-based predictive model for mortality risk in elderly patients with sepsis. By integrating traditional biomarkers, novel biomarkers, clinical data, and established scoring systems, the model seeks to enhance predictive accuracy and thereby improve clinical outcomes in high-risk patient population.
Methods: Conducted at Beijing Chao-Yang Hospital from August 2021 to August 2023, our study included 180 emergency department patients meeting Sepsis 3.0 diagnostic criteria. Data collected included patient demographics, vital signs, laboratory parameters, disease-related scores, major comorbidities, and the 28-day mortality. Variables were analyzed using univariate analysis and LASSO regression, and the machine learning model was constructed using R statistical software and validated internally via bootstrap resampling and calibration curves.
Results: The model identified seven significant variables: SOFA, APACHE II, MAP, ALB, PCT, LTB, and VEGF. These variables constituted our final prediction model, which achieved an AUC of 0.845 (95% CI: 0.786, 0.905), with a sensitivity of 75.9% and a specificity of 85.0%. Internal validation yielded a bootstrap-corrected AUC of 0.857 (95% CI: 0.799, 0.912), confirming the model’s statistical robustness. The nomogram provided a visual tool for predicting 28-day mortality risk, and decision curve analysis demonstrated strong potential for clinical utility.
Conclusion: The predictive model, which incorporates SOFA, APACHE II, MAP, ALB, PCT, LTB, and VEGF, shows significant potential in predicting the 28-day mortality risk for elderly sepsis patients. It provides a convenient and rapid tool for clinical use. Further research with larger sample sizes and external validation is warranted to confirm these findings and enhance the model’s applicability.
Keywords: sepsis, machine learning, clinical prediction model, sequential organ failure assessment, acute physiology and chronic health evaluation II, vascular endothelial growth factor
Introduction
Sepsis is a systemic inflammatory response syndrome caused by infection, characterized by rapid progression, which often leads to multiple organ failure and can be life-threatening in severe cases.1 Elderly patients, due to immunocompromised states and the presence of multiple comorbidities, experience a significantly increased mortality rate from sepsis.2
Early and accurate assessment of sepsis severity in elderly patients, followed by timely and proactive therapeutic interventions, is crucial for improving patient outcomes.3,4 Currently, clinical biomarkers commonly used to assess sepsis severity include C-reactive protein (CRP) and procalcitonin (PCT).2,5,6 These markers play a role in traditional evaluation models; however, these models have limited calibration and relatively low predictive performance. Furthermore, international sepsis guidelines emphasize the importance of early identification and timely intervention, recommending the use of various biomarkers and scoring systems to enhance diagnostic and predictive accuracy. Cytokines such as IL-6, IL-8, and vascular endothelial growth factor (VEGF) are significantly elevated in sepsis patients and correlate with disease severity. Research indicates that combining these novel markers with traditional markers can significantly enhance the predictive accuracy for sepsis.7,8
In recent years, advancements in statistical methods and computational technologies have led to the development of advanced clinical prediction models.9–11 These machine learning methodologies demonstrate higher accuracy and efficiency in sepsis assessment.12 For instance, LASSO regression models and nomogram-based predictive models have shown superior performance compared to traditional models in several studies.13,14
Therefore, our study aims to develop and validate a new Machine learning-based mortality risk prediction model for sepsis by integrating advanced statistical methods with clinical data, incorporating both traditional and novel biomarkers, as well as scoring systems. We anticipate that the improved machine learning model will allow for more accurate identification of high-risk patients at an early stage, facilitating early intervention and ultimately improving clinical outcomes for elderly sepsis patients.
Materials and Methods
Study Population
Our study was conducted at Beijing Chao-Yang Hospital, Capital Medical University, from August 2021 to August 2023. Our study complied with the Declaration of Helsinki and received approval from the Ethics Committee of Beijing Chaoyang Hospital (Approval No.: 2021-S-636). Written informed consent was obtained from all patients or their families, and patient information was kept strictly confidential. The inclusion criteria for our study were patients aged ≥18 years who met the diagnostic criteria for sepsis 3.0 and were admitted to the emergency department resuscitation room.1 The exclusion criteria were as follows:
1. Patients treated in the emergency department for less than 24 hours or those transferred from other hospitals. 2. Patients with a history of acute or chronic renal failure. 3. Trauma patients. 4. Patients with a history of malignancy, hematologic diseases, or connective tissue diseases.
Data Collection
Data were extracted using a structured query language.
Patient Demographics
Basic patient information: ID number, gender, and age.
Vital Signs and Laboratory Parameters
Vital signs: body temperature, heart rate (HR), mean arterial pressure (MAP), and respiratory rate (RR). Laboratory parameters: white blood cell count (WBC), hemoglobin (HGB), hematocrit (HCT), platelet count (PLT), blood pH, partial pressure of oxygen (PaO2), partial pressure of carbon dioxide (PaCO2), lactate (LAC), blood urea nitrogen (BUN), creatinine (CR), Na+, K+, total bilirubin (TBIL), aspartate aminotransferase (AST), alanine aminotransferase (ALT), albumin(ALB), PCT, CRP, oxygenation index (OI), and ejection fraction (EF). Novel serum biomarkers: Ferritin, Vascular Endothelial Growth Factor (VEGF), IL-6, IL-7, IL-8.
Disease-Related Scores
Sequential Organ Failure Assessment (SOFA), Acute Physiology and Chronic Health Evaluation II (APACHE II).
Major Comorbidities and Treatments
Heart failure, cardiovascular diseases, pulmonary diseases, renal diseases, diabetes, hypertension, and long-term bedridden (LTB).
Endpoint Events
The 28-day mortality rate was recorded for all patients. Follow-up was conducted to document survival status at 28 days.
A total of 38 variables were analyzed. For variables measured multiple times, only the first measurement was included in the analysis.
Model Development, Validation, and Statistical Analysis
Statistical analysis and model development were performed using R software (version 4.3.2) to compare the relationship between monitoring variables and the prediction of 28-day mortality in sepsis patients. For normally distributed data, t-test were performed, and the variables were described using mean and standard deviation. Conversely, for non-normally distributed variables, the Wilcoxon rank-sum test was used, and descriptive statistics (median and interquartile range) were employed to describe the variables. Categorical variables were expressed as numbers and percentages and compared using the chi-square test.
Variables were screened through univariate analysis and LASSO regression. The discriminative ability of the model was evaluated using receiver operating characteristic (ROC) curve analysis. A nomogram model was developed using multivariable logistic regression. The accuracy of our model was further verified by bootstrap validation using computer resampling for 1000 repetitions of simple random sampling with replacement. Calibration curves were used to assess the consistency between the model’s predicted probabilities and the actual outcomes. P < 0.05 was considered statistically significant.
Results
Comparison of Basic Clinical Data Between Survivors and Non-Survivors in Sepsis Patients
A total of 180 sepsis patients were included in this study (Table 1). The survivor group consisted of 60 patients (33.3%), including 39 males (65.0%) and 21 females (35.0%), with an average age of 71 (64, 83) years. The non-survivor group included 120 patients (66.6%), with 71 males (59.0%) and 49 females (41.0%), with an average age of 76 (66, 83) years. Compared to the survivor group, the non-survivor group showed statistically significant differences in SOFA score, APACHE II score, MAP, ALB, LTB, and VEGF levels (P < 0.05) (Table 1).
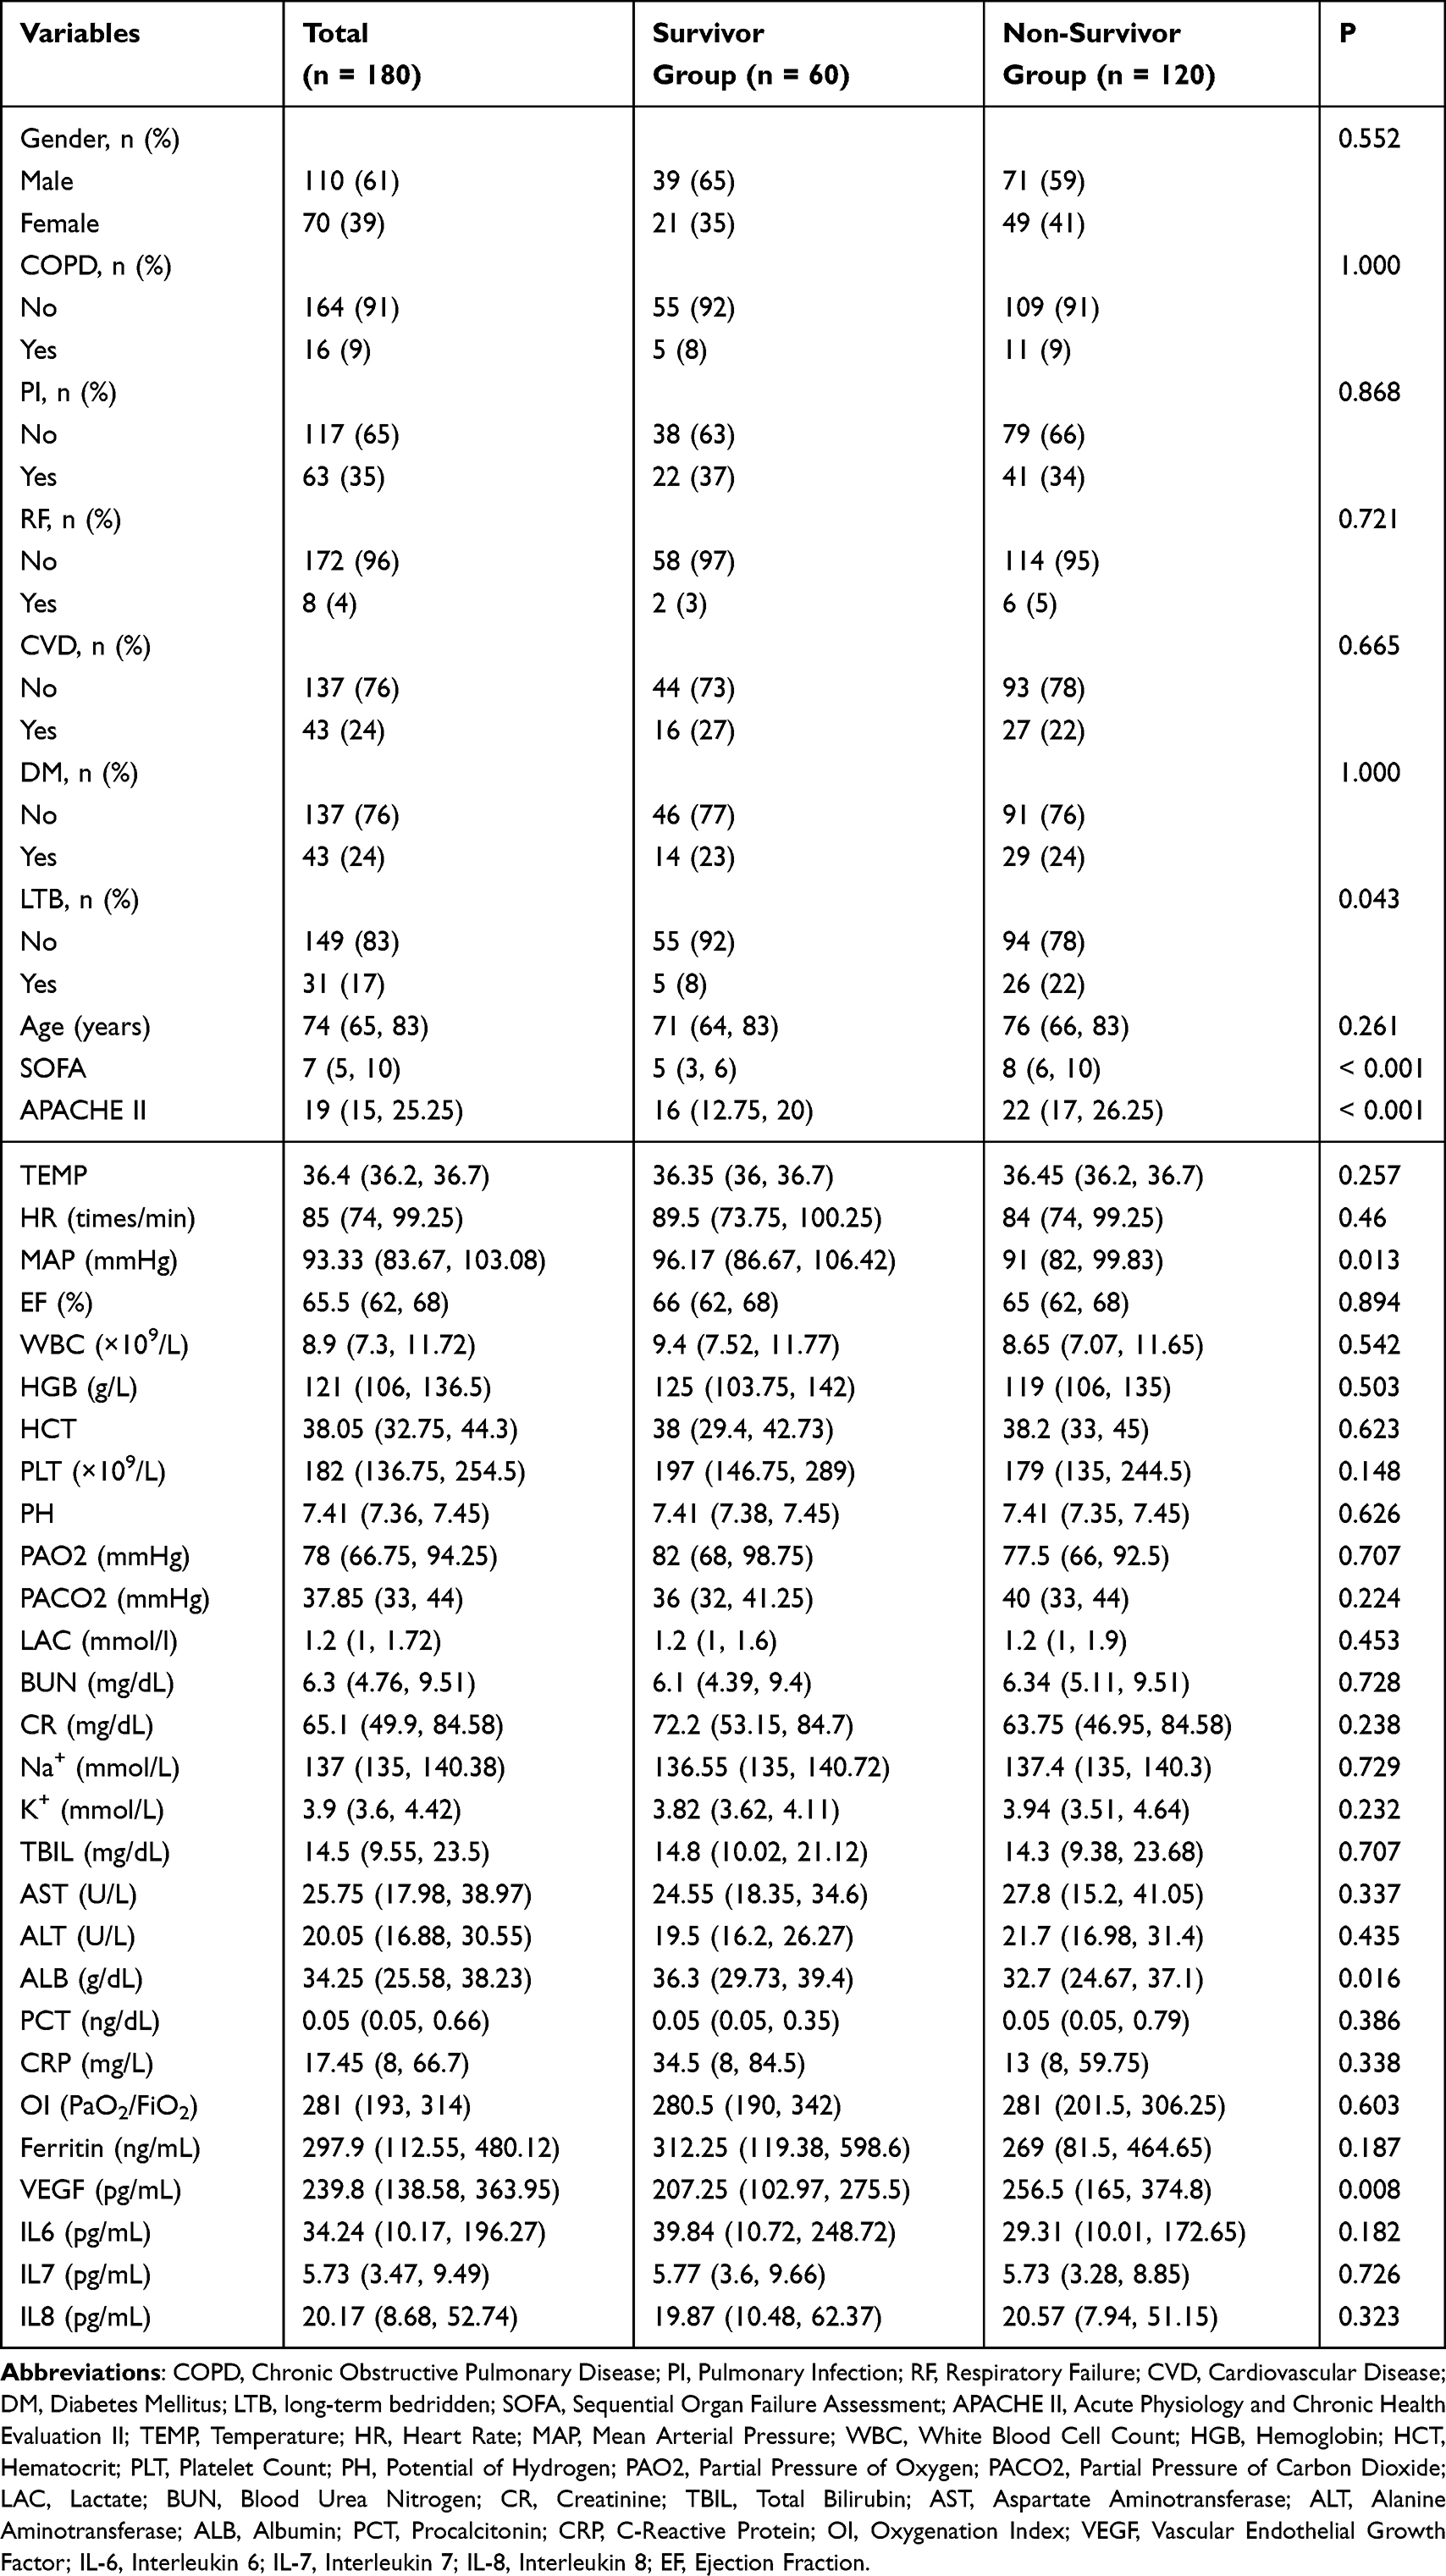 |
Table 1 Comparison of Patient Baseline Data |
Establishment of LASSO Regression and Predictive Model
Pearson correlation analysis revealed that several variables had correlation coefficients greater than 0.5, indicating a high degree of correlation and the presence of multicollinearity, which could distort or make accurate estimation of the model challenging (Figure 1). Therefore, LASSO regression was employed for variable selection, adding a penalty term to shrink the regression coefficients. Through ten-fold cross-validation, when λ = 0.044, seven factors were selected: SOFA, APACHE II, MAP, ALB, PCT, VEGF, and LTB status (Figure 2). The predictive model was constructed using the LASSO-logistic regression equation:

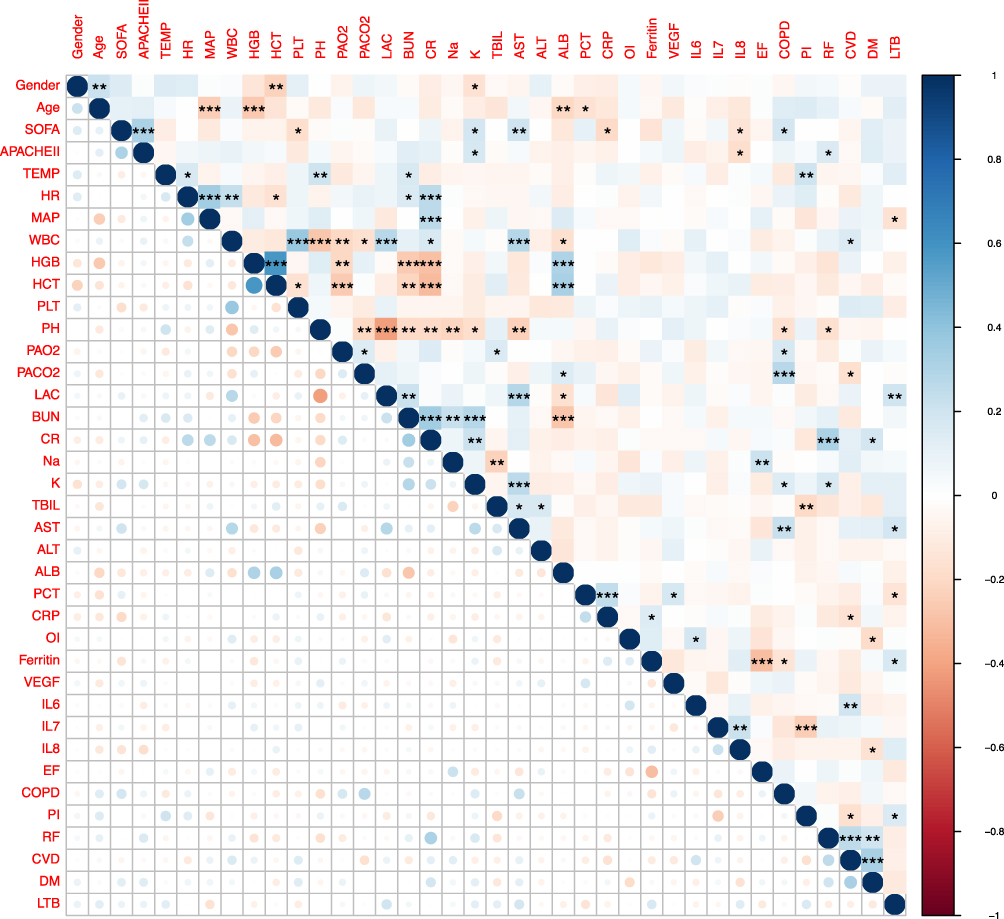 |
Figure 1 Correlation heatmap of variable differences. The heatmap shows the correlation coefficients between different variables. Blue indicates a positive correlation and red indicates a negative correlation. The size of the circles represents the strength of the correlation, with larger circles indicating stronger correlations. Asterisks denote the level of statistical significance: *p<0.05, **p<0.01, ***p<0.001. |
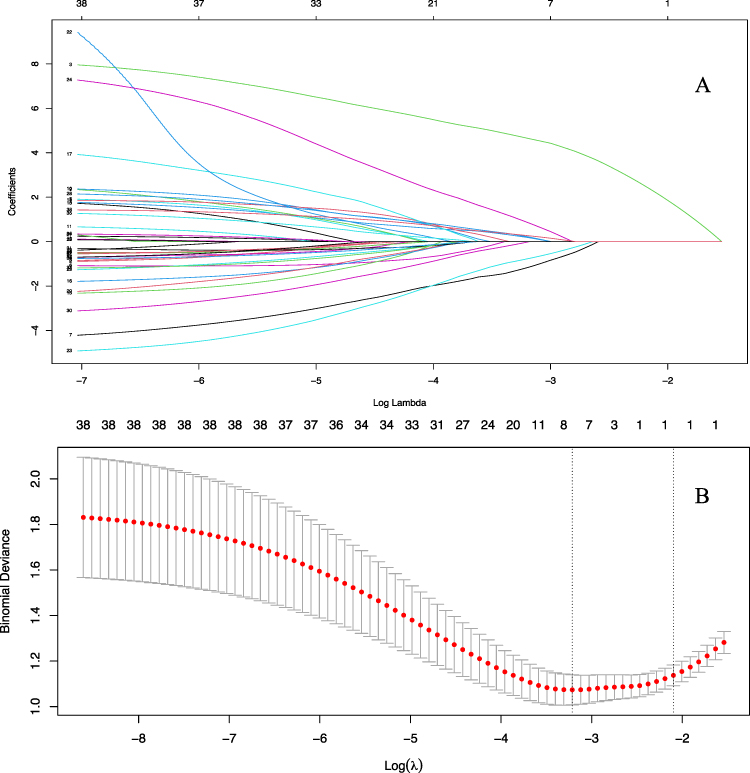 |
Figure 2 (A) LASSO Coefficient Path Plot. The horizontal axis represents the lambda (λ) values, and the vertical axis represents the partial regression coefficients. Each line represents the trajectory of a variable’s coefficient. As the value of log (lambda) increases, some coefficients shrink to zero, indicating the exclusion of the corresponding variables from the model. (B) LASSO Cross-Validation Plot. This plot displays the binomial deviance of the model for different values of the regularization parameter (log lambda). Red dots represent the deviance for each log(lambda) value with error bars indicating the standard error. The lower horizontal axis represents the lambda (λ) values, the left vertical dashed line represents the lambda value with the minimum binomial deviance, and the right vertical dashed line represents the largest lambda value within one standard error of the minimum deviance. The upper horizontal axis represents the number of variables, and the vertical axis represents the binomial deviance. |
The prognosis probability for sepsis patients can be estimated using a nomogram (Figure 3). The performance of this nomogram was measured using ROC curve analysis, with the model achieving an area under the ROC curve (AUC) of 0.845 (95% CI: 0.786, 0.905). The model demonstrated good diagnostic performance, with a Brier score of 0.148, sensitivity of 75.9%, and specificity of 85.0% at the optimal cut-off point (Figure 4).
 |
Figure 3 Nomogram for Predicting 28-Day Mortality Risk in Elderly Patients with Sepsis. This nomogram predicts the 28-day mortality risk based on clinical variables. To use the nomogram, locate the patient’s value for each variable on the corresponding axis. Draw a vertical line from this value to the “Points” axis to determine the individual points for that variable. Sum the points for all variables to obtain the total points. Finally, draw a line from the total points axis down to the lower line of the nomogram to determine the 28-day mortality risk probabilities. |
 |
Figure 4 Receiver operating characteristic curve. Abbreviation: AUC, Area under the receiver operating characteristic curve. |
Model Validation
The model was further validated using internal bootstrap methods. The ROC curve was measured through 1000 bootstrap repetitions, resulting in a bootstrap-corrected AUC of 0.857 (95% CI: 0.799, 0.912), indicating similar statistical power to the initial model (Figure 5). The internal bootstrap validation calibration curve revealed that the nomogram-derived curve might overestimate the risk of prognosis at probabilities of 0–0.4 and 0.7–0.9, and underestimate probabilities at 0.4–0.7. Overall, our model exhibited good fit and calibration compared to the ideal curve. Furthermore, decision curve analysis showed that the predictive model had a good positive net benefit for threshold probabilities below 0.9, suggesting that the model has good potential clinical utility (Figure 6).
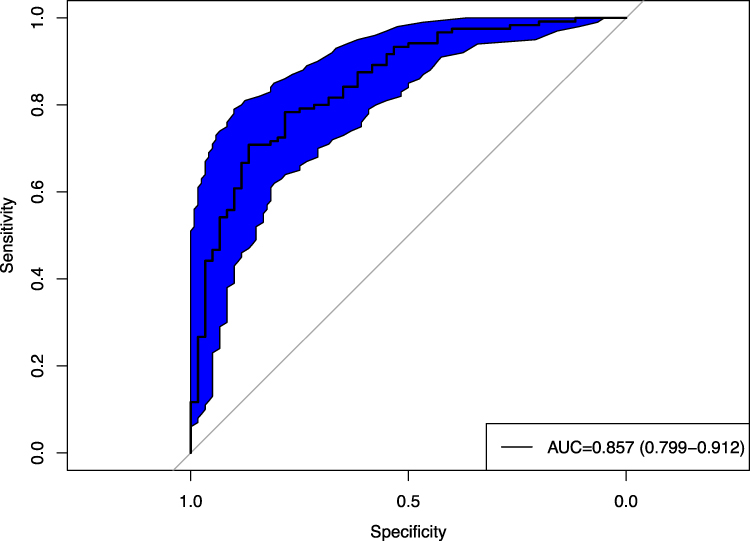 |
Figure 5 Internal validation of the nomogram using the bootstrap sampling. The ROC curve was measured by bootstrapping for 1000 repetitions, and the AUC of the bootstrap stepwise model was showed. |
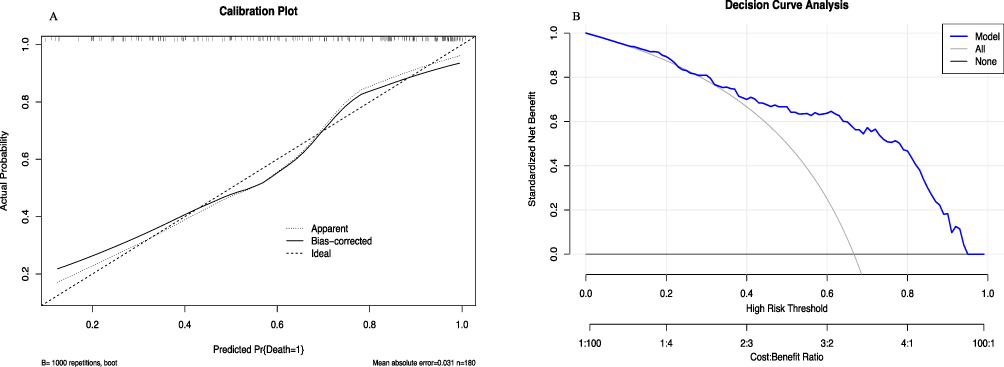 |
Figure 6 (A) Calibration curve for predicted probability. This calibration plot evaluates the accuracy of the predictive model by comparing the predicted probabilities of 28-day mortality with the actual observed probabilities. (B) Decision curve analysis for the prediction model. This decision curve analysis evaluates the clinical usefulness of the predictive model by comparing the standardized net benefit across different high-risk thresholds. The horizontal axis represents the high-risk threshold, while the left vertical axis represents the standardized net benefit. The blue line (Model) shows the net benefit of using the predictive model, the grey line (All) represents the net benefit of treating all patients, and the black horizontal line (None) indicates the net benefit of treating no patients. |
Discussion
Sepsis is a severe organ dysfunction caused by a dysregulated host response to infection and is potentially life-threatening. This condition involves a systemic response, which may be associated with an excessive increase in cytokines and other inflammatory mediators released into the systemic circulation during the disease course.1,15 The symptoms and signs of sepsis vary depending on the specific organ systems affected, such as altered mental status in the nervous system, hypoxemia in the respiratory system, shock in the cardiovascular system, reduced urine output and/or elevated serum creatinine levels in the renal system, thrombocytopenia in the hematologic system, and abnormal liver function.16–18 Organ failures, particularly acute kidney injury (AKI), are independent risk factors for increased mortality in hospitalized patients.19,20
In recent years, data mining and machine learning have been widely applied in clinical settings, aiding emergency intensive care physicians in making more precise clinical decisions. Our team has successfully developed a clinical prediction model for estimating the probability of AKI in ARDS patients, which was well-validated using the MIMIC-IV dataset.21 In the current study, we analyzed clinical data from 180 emergency sepsis patients, encompassing a total of 38 potential variables. Due to the aging population and the different types of patients in regional hospitals, we found that over 90% of patients diagnosed with sepsis were middle-aged and elderly. Therefore, the average age of patients in our study was 74 years (95% CI:65, 83), reflecting the predominance of middle-aged and elderly patients in our sample. Using machine learning algorithms, we further predicted the 28-day mortality rate in elderly sepsis patients and developed an efficient clinical prediction model that includes seven features: SOFA, APACHE II, MAP, ALB, PCT, LTB, and VEGF. The stepwise regression method demonstrated that the model has good diagnostic performance, with an AUC of 0.845 and a Brier score of 0.148 (Figure 4). At the optimal cut-off point, the sensitivity was 75.9% and the specificity was 85.0%. Internal bootstrap validation further confirmed that its statistical power is consistent with the initial model. Decision curve analysis indicated that the model has good potential clinical utility.
Among the seven features of the model, VEGF is one of the newly introduced markers and plays a significant role. VEGF is a highly specific pro-angiogenic factor that promotes increased vascular permeability, extracellular matrix degradation, endothelial cell migration, proliferation, and angiogenesis.22,23 The activation and dysfunction of endothelial cells are critical factors in the progression of infection to sepsis. Endothelial cell injury can lead to vascular leakage and edema, as well as severe complications such as shock, micro thrombosis, and multiple organ failure (MOF).24 Studies have shown that damage to the endothelial barrier affects the regulation of leukocyte migration and invasion, impacting the process of leukocyte migration to sites of inflammation. Moreover, disruption of the endothelial barrier results in the leakage of intravascular components into the extravascular space, causing tissue and organ edema and leading to insufficient organ perfusion.1,25,26 In an animal model study, septic mice induced by cecal ligation and puncture (CLP) showed significantly elevated plasma VEGF levels. This increase was associated with the secretion of VEGF by pulmonary endothelial cells through various MAPK-dependent pathways, promoting the development of non-cardiogenic pulmonary edema in sepsis-related acute lung injury (ALI).23 A meta-analysis by Tang et al of 20 studies involving 2242 patients indicated that baseline VEGF levels were higher in non-survivors and critically ill patients compared to survivors and non-critically ill patients, suggesting that high VEGF levels are associated with poor clinical outcomes in sepsis patients.27 Our findings are consistent with these reports.
Mean arterial pressure (MAP) is a crucial hemodynamic parameter that reflects tissue perfusion throughout the body. Maintaining an appropriate MAP is essential for the prognosis of sepsis patients.3,28,29 Increasing MAP generally enhances tissue perfusion and oxygen delivery. Organs such as the brain and kidneys possess autoregulatory functions, where perfusion and MAP display a linear relationship. When MAP falls below a certain threshold, perfusion decreases.15 In this study, MAP is a significant feature in the predictive model. Low MAP in sepsis patients leads to inadequate tissue and organ perfusion, resulting in cellular hypoxia and metabolic disturbances. This triggers the release of inflammatory mediators and increases vascular permeability, potentially causing multiple organ dysfunction syndrome (MODS) and even death. An analysis of 14,607 sepsis patients at Beth Israel Deaconess Medical Center found that MAP below 68.6 mmHg is a strong predictor of mortality, with each 10 mmHg increase in MAP reducing the risk of sepsis-related death by 52.1%.28
Procalcitonin (PCT) is a widely recognized biomarker for sepsis evaluation. Despite its potential lack of sensitivity in predicting sepsis outcomes, PCT is a significant feature in our predictive model. PCT has been extensively used in clinical sepsis prediction, including neonatal sepsis, abdominal trauma sepsis, burn sepsis, and emergency elderly sepsis.2,4,30 Albumin (ALB) is another critical factor in predicting patient outcomes. In sepsis patients, increased capillary leakage leads to the exudation of albumin and other components into the interstitial space, lowering plasma albumin concentration and colloid osmotic pressure. Additionally, endotoxin-induced inflammatory mediators inhibit hepatocyte albumin synthesis.31,32 Intravenous albumin infusion is necessary and beneficial for correcting hypoalbuminemia in sepsis patients.6,15 SOFA and APACHE II scores are vital for assessing changes in critically ill patients and organ function in emergency and ICU settings. LTB status is defined as continuous bed rest for more than seven days. The model achieved an AUC of 0.845 (95% CI: 0.786, 0.905), which is higher than what is typically reported for SOFA (0.677, 95% CI: 0.593, 0.761) and APACHE II (0.800, 95% CI: 0.731, 0.869) alone. This suggests that the model has the potential to outperform conventional risk scores in predicting 28-day mortality in elderly sepsis patients (Supplementary Figure 1).
The clinical prediction model developed in our study holds significant value for risk estimation, enhancing clinicians’ risk assessment of critically ill patients, and informing clinical decisions. We used stepwise regression to select seven features and establish a nomogram to predict the 28-day mortality risk in elderly sepsis patients. Although the study included only 180 patients, the model demonstrated relatively good performance. Qi et al constructed a clinical prediction model for sepsis prognosis in 5727 patients and found that the random forest model performed well in both training and validation sets, with age, albumin, and lactate as the most important features.26 Similarly, Mirijello et al used various models to predict ICU sepsis prognosis and found that quick-SOFA, procalcitonin, MAP, and SOFA were key features, with the classic multivariable logistic regression model being the most concise and calibrated.
Furthermore, our model’s nomogram serves as a statistical tool to calculate the 28-day mortality risk for elderly sepsis patients, providing an early visual warning signal for clinical use. The nomogram is convenient and quick to use in clinical settings, offering valuable references for clinical decision-making and care, enabling timely interventions to improve patient outcomes. Overall, machine learning algorithms have the potential to enhance prediction accuracy and guide clinical decisions. With larger and more diverse datasets, the performance of these models is expected to improve further, providing valuable insights for clinicians managing this complex condition. Future research will include more models for comparative validation to better serve clinical needs.
There were several limitations. First, the relatively small sample size may weaken the analysis results. Second, the nomogram lacks robust external validation, although internal bootstrap validation and decision curve analysis indicate good net benefit. These results need to be confirmed in future studies with larger sample sizes and additional model validation. Third, the model has not been prospectively validated. We plan to conduct a multicenter prospective validation study of the sepsis prognosis prediction model. This will help to confirm the robustness and applicability of our model in different clinical settings.
Conclusion
The predictive model constructed with seven features—SOFA, APACHE II, MAP, ALB, PCT, LTB and VEGF—shows great potential in predicting the 28-day mortality risk for elderly sepsis patients. The visual nomogram is convenient and quick for clinical use, providing valuable references for clinical decision-making and care, enabling timely interventions to improve patient outcomes.
Funding
There is no funding to report.
Disclosure
The authors report no conflicts of interest in this work.
References
1. Singer M, Deutschman CS, Seymour CW, et al. The third international consensus definitions for sepsis and septic shock (Sepsis-3). JAMA-j Am Med Assoc. 2016;315(8):801–810. doi:10.1001/jama.2016.0287
2. Cabral L, Afreixo V, Almeida L, Paiva JA. The use of Procalcitonin (pct) for diagnosis of sepsis in burn patients: a meta-analysis. PLoS One. 2016;11(12):e0168475. doi:10.1371/journal.pone.0168475
3. Zheng R, Zhang Y, Rong Z, Huang W, Fu X. [Surviving sepsis campaign: international guidelines for management of sepsis and septic shock 2021, interpretation and. Zhonghua Wei Zhong Bing Ji Jiu Yi Xue. 2021;33(10):1159–1164. doi:10.3760/cma.j.cn121430-20211009-01442
4. Oncul U, Dalgıç N, Demir M, Karadeniz P, Karadağ Ç. Use of procalcitonin as a biomarker for sepsis in pediatric burns. Eur J Pediatr. 2023;182(4):1561–1567. doi:10.1007/s00431-023-04831-6
5. Zhang W, Wang W, Hou W, et al. The diagnostic utility of IL-10, IL-17, and PCT in patients with sepsis infection. Front Public Health. 2022;10:923457. doi:10.3389/fpubh.2022.923457
6. Omiya K, Sato H, Sato T, et al. Albumin and fibrinogen kinetics in sepsis: a prospective observational study. Crit Care. 2021;25(1):436. doi:10.1186/s13054-021-03860-7
7. Schuch G, Erguen S, Soker S, Hossfeld D, Fiedler W. Endostatin inhibits VEGF-induced lung edema by reducing vascular permeability. Blood. 2004;104(11):2614. doi:10.1182/blood.V104.11.2614.2614
8. Alves BE, Montalvao SA, Aranha FJ, et al. Time-course of sFlt-1 and VEGF-A release in neutropenic patients with sepsis and septic shock: a prospective study. J Transl Med. 2011;9:23. doi:10.1186/1479-5876-9-23
9. Olisah CC, Smith L, Smith M. Diabetes mellitus prediction and diagnosis from a data preprocessing and machine learning perspective. Comput Meth Prog Bio. 2022;220:106773. doi:10.1016/j.cmpb.2022.106773
10. Wu J, Lin Y, Li P, Hu Y, Zhang L, Kong G. Predicting prolonged length of ICU stay through machine learning. Diagnostics. 2021;11(12):2242. doi:10.3390/diagnostics11122242
11. Bodenhofer U, Haslinger-Eisterer B, Minichmayer A, Hermanutz G, Meier J. Machine learning-based risk profile classification of patients undergoing elective heart valve surgery. Eur j Cardio-Thorac. 2021;60(6):1378–1385.
12. Hudson C, Branjerdporn G, Hughes I, et al. Using machine learning to mine mental health diagnostic groups from emergency department presentations before and during the COVID-19 pandemic. Discov Ment Health. 2023;3(1):22. doi:10.1007/s44192-023-00047-0
13. Tunthanathip T, Duangsuwan J, Wattanakitrungroj N, Tongman S, Phuenpathom N. Comparison of intracranial injury predictability between machine learning algorithms and the nomogram in pediatric traumatic brain injury. Neurosurg Focus. 2021;51(5):E7. doi:10.3171/2021.8.FOCUS2155
14. Alabi RO, Mäkitie AA, Pirinen M, Elmusrati M, Leivo I, Almangush A. Comparison of nomogram with machine learning techniques for prediction of overall survival in patients with tongue cancer. Int j Med Inform. 2021;145:104313. doi:10.1016/j.ijmedinf.2020.104313
15. Astapenko D, Černý V. Surviving sepsis campaign: international guidelines for management of sepsis and septic shock: 2021. Anesteziol Intenziv. 2021;32(4–5):249–255.
16. Calsavara AJC, Nobre V, Barichello T, Teixeira AL. Post-sepsis cognitive impairment and associated risk factors: a systematic review. Aust Crit Care. 2018;31(4):242–253. doi:10.1016/j.aucc.2017.06.001
17. Coopersmith CM, De Backer D, Deutschman CS, et al. Surviving sepsis campaign: research priorities for sepsis and septic shock. Intens Care Med. 2018;44(9):1400–1426.
18. Dobson GP, Letson HL, Morris JL. Revolution in sepsis: a symptoms-based to a systems-based approach? J Biomed Sci. 2024;31(1):57. doi:10.1186/s12929-024-01043-4
19. Hajj J, Blaine N, Salavaci J, Jacoby D. The “centrality of sepsis”: a review on incidence, mortality, and cost of care. Healthcare. 2018;6(3). doi:10.3390/healthcare6030090
20. Oami T, Imaeda T, Nakada TA, et al. Temporal trends of medical cost and cost-effectiveness in sepsis patients: a Japanese nationwide medical claims database. J Intensive Care. 2022;10(1):33. doi:10.1186/s40560-022-00624-5
21. Wei S, Zhang Y, Dong H, et al. Machine learning-based prediction model of acute kidney injury in patients with acute respiratory distress syndrome. BMC Pulm Med. 2023;23(1):370. doi:10.1186/s12890-023-02663-6
22. Xu Y, Xiao Y, Simon M, et al. Plasma Vascular Endothelial Growth Factor (VEGF) levels correlate with thrombocytopenia of various etiology. Blood. 2014;124(21):4991. doi:10.1182/blood.V124.21.4991.4991
23. Tomita K, Saito Y, Suzuki T, et al. Vascular endothelial growth factor contributes to lung vascular hyperpermeability in sepsis-associated acute lung injury. N-s Arch Pharmacol. 2020;393(12):2365–2374. doi:10.1007/s00210-020-01947-6
24. Almasy E, Szederjesi J, Grigorescu B, et al. VEGF-C and podoplanin, as biomarkers of sepsis. An experimental study. Rev Romana Med Lab. 2021;29(4):403–412.
25. Çokluk E, Doğanay S, Ramazan Şekeroğlu M, Betül Tuncer F, Çakıroğlu H, Boz M. Investigation of the effect of melatonin administration on inflammatory mediators; MMP-2, TGF-β and VEGF levels in rats with sepsis. Int j Clin Pract. 2021;75(11):e14832. doi:10.1111/ijcp.14832
26. Qi J, Lei J, Li N, et al. Machine learning models to predict in-hospital mortality in septic patients with diabetes. Front Endocrinol. 2022;13:1034251.
27. Tang AL, Peng Y, Shen MJ, et al. Prognostic role of elevated VEGF in sepsis: a systematic review and meta-analysis. Front Physiol. 2022;13:941257. doi:10.3389/fphys.2022.941257
28. Cao B, Chen Q, Tang T, et al. Non-linear relationship between baseline mean arterial pressure and 30-day mortality in patients with sepsis: a retrospective cohort study based on the MIMIC-III database. Ann Transl Med. 2022;10(16):872. doi:10.21037/atm-22-3457
29. Lee GT, Hwang SY, Jo IJ, et al. Associations between mean arterial pressure and 28-day mortality according to the presence of hypertension or previous blood pressure level in critically ill sepsis patients. J Thorac Dis. 2019;11(5):1980–1988. doi:10.21037/jtd.2019.04.108
30. Chen L, Wu X, Qin H, Zhu H. The PCT to albumin ratio predicts mortality in patients with acute kidney injury caused by abdominal infection-evoked sepsis. Front Nutr. 2021;8:584461. doi:10.3389/fnut.2021.584461
31. Wiedermann CJ. Moderator effect of hypoalbuminemia in volume resuscitation and plasma expansion with intravenous albumin solution. Int J mol Sci. 2022;23(22):14175. doi:10.3390/ijms232214175
32. Gatta A, Verardo A, Bolognesi M. Hypoalbuminemia. Intern Emerg Med. 2012;7(Suppl 3):S193–9. doi:10.1007/s11739-012-0802-0
 © 2025 The Author(s). This work is published and licensed by Dove Medical Press Limited. The
full terms of this license are available at https://www.dovepress.com/terms.php
and incorporate the Creative Commons Attribution
- Non Commercial (unported, 4.0) License.
By accessing the work you hereby accept the Terms. Non-commercial uses of the work are permitted
without any further permission from Dove Medical Press Limited, provided the work is properly
attributed. For permission for commercial use of this work, please see paragraphs 4.2 and 5 of our Terms.
© 2025 The Author(s). This work is published and licensed by Dove Medical Press Limited. The
full terms of this license are available at https://www.dovepress.com/terms.php
and incorporate the Creative Commons Attribution
- Non Commercial (unported, 4.0) License.
By accessing the work you hereby accept the Terms. Non-commercial uses of the work are permitted
without any further permission from Dove Medical Press Limited, provided the work is properly
attributed. For permission for commercial use of this work, please see paragraphs 4.2 and 5 of our Terms.
Recommended articles
Machine Learning Predictive Model for Septic Shock in Acute Pancreatitis with Sepsis
Xia Y, Long H, Lai Q, Zhou Y
Journal of Inflammation Research 2024, 17:1443-1452
Published Date: 5 March 2024
Identification and Analysis of PANoptosis-Related Genes in Sepsis-Induced Lung Injury by Bioinformatics and Experimental Verification
Yang Z, Kao X, Huang N, Yuan K, Chen J, He M
Journal of Inflammation Research 2024, 17:1941-1956
Published Date: 28 March 2024
Acute Kidney Injury Prediction Model Using Cystatin-C, Beta-2 Microglobulin, and Neutrophil Gelatinase-Associated Lipocalin Biomarker in Sepsis Patients
Susianti H, Asmoro AA, Sujarwoto, Jaya W, Sutanto H, Kusdijanto AY, Kuwoyo KP, Hananto K, Khrisna MB
International Journal of Nephrology and Renovascular Disease 2024, 17:105-112
Published Date: 28 March 2024
Cuproptosis-Related Biomarkers and Characterization of Immune Infiltration in Sepsis
Wang Y, Qiu X, Liu J, Liu X, Pan J, Cai J, Liu X, Qu S
Journal of Inflammation Research 2024, 17:2459-2478
Published Date: 22 April 2024
Comprehensive Sepsis Risk Prediction in Leukemia Using a Random Forest Model and Restricted Cubic Spline Analysis
Kou Y, Tian Y, Ha Y, Wang S, Sun X, Lv S, Luo B, Yang Y, Qin L
Journal of Inflammation Research 2025, 18:1013-1032
Published Date: 22 January 2025