")
Back to Journals » International Journal of Nanomedicine » Volume 19
Metabolic Reprogramming of CD4+ T Cells by Mesenchymal Stem Cell-Derived Extracellular Vesicles Attenuates Autoimmune Hepatitis Through Mitochondrial Protein Transfer
Authors Shen M, Zhou L, Fan X, Wu R, Liu S, Deng Q, Zheng Y, Liu J, Yang L
Received 9 June 2024
Accepted for publication 18 September 2024
Published 23 September 2024 Volume 2024:19 Pages 9799—9819
DOI https://doi.org/10.2147/IJN.S472086
Checked for plagiarism Yes
Review by Single anonymous peer review
Peer reviewer comments 3
Editor who approved publication: Prof. Dr. Dongwoo Khang
Mengyi Shen,1,* Leyu Zhou,1,* Xiaoli Fan,1 Ruiqi Wu,1 Shuyun Liu,2 Qiaoyu Deng,1 Yanyi Zheng,1 Jingping Liu,2 Li Yang1
1Department of Gastroenterology and Hepatology and Laboratory of Gastrointestinal Cancer and Liver Disease, West China Hospital, Sichuan University, Chengdu, People’s Republic of China; 2NHC Key Laboratory of Transplant Engineering and Immunology, Frontiers Science Center for Disease-Related Molecular Network, West China Hospital, Sichuan University, Chengdu, People’s Republic of China
*These authors contributed equally to this work
Correspondence: Li Yang; Jingping Liu, Email [email protected]; [email protected]
Background: Autoimmune hepatitis (AIH) is a serious liver disease characterized by immune disorders, particularly effector T-cell overactivation. This study aimed to explore the therapeutic effect and underlying mechanism of mesenchymal stem cell-derived extracellular vesicle (MSC-EV) treatment on CD4+ T-cell overactivation and liver injury in AIH.
Methods: The metabolic changes of CD4+ T cells were assayed in human AIH and mouse hepatitis models. The liver protective effect of MSC-EVs was evaluated by transaminase levels, liver histopathology and inflammation. The effect of MSC-EVs on the metabolic state of CD4+ T cells was also explored.
Results: Enhanced glycolysis (eg, ~1.5-fold increase in hexokinase 2 levels) was detected in the CD4+ T cells of AIH patient samples and mouse hepatitis models, whereas the inhibition of glycolysis decreased CD4+ T-cell activation (~1.8-fold decrease in CD69 levels) and AIH liver injury (~6-fold decrease in aminotransferase levels). MSC-EV treatment reduced CD4+ T-cell activation (~1.5-fold decrease in CD69 levels) and cytokine release (~5-fold decrease in IFN-γ levels) by reducing glycolysis (~3-fold decrease) while enhancing mitochondrial oxidative phosphorylation (~2-fold increase in maximal respiration) in such cells. The degree of liver damage in AIH mice was ameliorated after MSC-EV treatment (~5-fold decrease in aminotransferase levels). MSC-EVs carried abundant mitochondrial proteins and might transfer them to metabolically reprogram CD4+ T cells, whereas disrupting mitochondrial transfer impaired the therapeutic potency of MSC-EVs in activated CD4+ T cells.
Conclusion: Disordered glucose metabolism promotes CD4+ T-cell activation and associated inflammatory liver injury in AIH models, which can be reversed by MSC-EV therapy, and this effect is at least partially dependent on EV-mediated mitochondrial protein transfer between cells. This study highlights that MSC-EV therapy may represent a new avenue for treating autoimmune diseases such as AIH.
Keywords: autoimmune hepatitis, extracellular vesicles, metabolic reprogramming, mitochondria, inflammation
Introduction
Autoimmune hepatitis (AIH) is a serious progressive liver disease that is mediated by the autoimmune response and characterized by elevated transaminase levels, high immunoglobulin G levels, positive autoantibodies and interface hepatitis.1 However, similar to other types of autoimmune diseases, the efficacy of current therapies for AIH used in the clinic remains unsatisfactory. To date, AIH patients can achieve a response rate of only 70% to 80% with standard glucocorticoid and immunosuppressant therapy.2,3 In addition, these immunosuppressive therapies are not targeted to the liver and tend to cause systemic adverse effects such as infection, osteoporosis and diabetes when used for long periods.4 Moreover, disease relapse after drug withdrawal is one of the clinical issues of AIH, and its recurrence rate after 1 to 3 years of discontinuation can reach as high as 59–81%.5,6 Without effective interventions, AIH patients can rapidly progress to liver failure and cirrhosis.1,7 Therefore, it is critical to develop more safe and efficient therapeutics for AIH.
The pathology of autoimmune hepatitis is complicated, and multiple factors, such as the genetic background and internal and external triggers, especially immune disorders, are involved.8,9 T cells are key adaptive immune cells that induce the occurrence and development of immune disorder-related diseases, and increasing evidence indicates that abnormal T-cell (eg, CD4+ T-cell) infiltration and activation play vital roles in the pathogenesis of AIH.10–15 Previous studies have shown that CD4+ T cells can recognize self-antigenic peptides presented by antigen-presenting cells and then be activated and differentiate into effector cells, which subsequently produce cytokines and interact with other immune cells (eg, CD8+ T cells, B cells, macrophages and NK cells) to induce hepatocyte death during AIH.9,10 Conversely, genetic depletion of CD4+ T cells can reduce immune injury of the liver in AIH mice.11–13 These findings suggest that CD4+ T-cell overactivation is a promising therapeutic target for treating AIH. On the other hand, the cellular metabolic state has been recognized as a key modulator of the immune cell phenotype and thus can affect the outcomes of a variety of autoimmune diseases, such as AIH, rheumatoid arthritis and autoimmune encephalomyelitis.14,15 Briefly, effector T cells prefer glycolysis to obtain more energy quickly for survival and the immune response, whereas naive and regulatory T cells rely primarily on oxidative phosphorylation (OXPHOS).16,17 These findings suggest that metabolic disorders, such as impaired mitochondrial OXPHOS with enhanced glycolysis, may be potent therapeutic targets for inhibiting CD4+ T-cell activation during AIH, but efficient therapies for the targeted regulation of CD4+ T-cell metabolism are lacking.
In recent years, mesenchymal stem cell (MSC)-based therapies have emerged as promising means for treating immune disorders and inflammatory diseases in clinical and basic studies because of their immune and metabolic regulatory abilities.18–20 As cell-secreted nanovesicles, MSC-EVs have highly similar biological properties to MSCs.21,22 Moreover, compared with whole-cell therapy, MSC-EVs have several advantages, such as low embolism risk, low immunogenicity, and easy storage and shipping, making them promising for further clinical translation. Pilot studies have reported that MSC-derived extracellular vesicles (MSC-EVs) can attenuate liver injury in AIH mice,23,24 but the underlying mechanism is not completely understood. Recently, we and others reported that EVs derived from MSCs or other cells can exert therapeutic effects by regulating the metabolic status of recipient cells through the transfer of diverse mitochondrial components, such as mitochondrial proteins, mitochondrial DNA (mtDNA) and even fragmented or intact mitochondria between cells.25–27 For example, MSC-EV treatment increased mitochondrial respiration levels in lung cells in LPS-induced acute lung injury models via mitochondrial transfer.28 MSC-EV treatment can also restore the TFAM signaling pathway to improve the mtDNA stability of renal tubular cells and thus ameliorate mitochondrial injury and inflammation in individuals with acute renal injury.29 Brain endothelial cell-derived EVs, which contain mitochondria, reduce infarct areas in the mouse brain by increasing the mitochondrial respiration and glycolytic capacities of recipient brain endothelial cells.30 Additionally, EVs isolated from the HEK293 cell line, which overexpress the mitochondrial membrane protein (TOM40), delivered TOM40 to protect target cells from oxidative stress in models of neurodegenerative diseases.31 However, it is still unclear whether MSC-EV treatment affects the phenotype of activated CD4+ T cells via the transfer of mitochondrial components.
This study aimed to explore the therapeutic effect and underlying mechanism of MSC-EV treatment on CD4+ T-cell overactivation and liver injury in AIH. We revealed that disordered glucose metabolism promotes CD4+ T-cell activation and liver injury in AIH, which can be reversed by MSC-EV therapy, and this effect is at least partially due to EV-mediated mitochondrial transfer between cells. This study may provide a new approach for treating liver diseases related to CD4+ T-cell overactivation, such as AIH.
Materials and Methods
Patients and Specimens
AIH patients were enrolled at West China Hospital, Sichuan University, from January 2021 to April 2023. All patients met the diagnostic criteria established by the International Autoimmune Hepatitis Group. Peripheral blood and liver biopsy samples were obtained from AIH patients. This study complied with the Declaration of Helsinki and was approved by the Ethics Committee of West China Hospital. All enrolled patients signed informed consent forms.
Animals and Treatments
Female C57BL/6 mice (weighing 20–22 g) were obtained from the Experimental Animal Center of Sichuan University (Chengdu, China). The animal experiments were approved by the Animal Ethics Committee of West China Hospital, Sichuan University (No. 20220401003) and were performed according to the National Institutes of Health Guidelines for the Use of Experimental Animals. An immune-mediated hepatitis model was established by the intravenous administration of a single dose of 10 mg/kg concanavalin A (Con A; Sigma–Aldrich, USA) for 24 h. 2-deoxy-D-glucose (2-DG, 10 mg/mouse, Sigma‒Aldrich, USA) or MSC-EVs (3 × 10¹⁰ particles/mouse) were injected intraperitoneally or intravenously into Con A-treated mice. Blood and liver samples were collected when the mice were sacrificed at 24 h after the injection.
Cell Culture and Treatments
Human umbilical cord MSCs were provided by Hangzhou Aiwei Biotechnology Co., Ltd. (Hangzhou, China) and Sichuan Neo-life Stem Cell Biotech & Sichuan Stem Cell Bank (Chengdu, China). The culture medium of the MSCs was DMEM/F12 (Gibco, USA) supplemented with 10% FBS (Biological Industries, Israel) and 1% penicillin/streptomycin (HyClone, USA). The cells were passaged every 3‒4 days, and cells at the 5th passage were harvested for further experiments. MSCs were treated with rhodamine-6G (1 μg/mL, Sigma‒Aldrich) for 48 h to knock down mitochondrial electron transport chain (ETC) proteins.
CD4+ T cells from human peripheral blood or the mouse spleen were purified using the MojoSortTM Human or Mouse CD4+ T-Cell Isolation Kit (BioLegend, USA) according to the manufacturer’s protocol. The purity of the CD4+ T cells was greater than 95%, as determined by flow cytometry. Human CD4+ T cells were dissolved in RNA lysis solution (Vazyme, China) and stored at −80 °C . Mouse CD4+ T cells were cultured in 96-well plates at a density of 5×10⁵ cells/well. The medium consisted of RPMI 1640 medium supplemented with recombinant murine IL-2 (20 IU/mL, Novoprotein, China), 10% FBS (Biological Industries, Israel) and 1% penicillin/streptomycin (HyClone). Mouse CD4+ T cells were stimulated with PMA (10 ng/mL, MultiSciences, China) and ionomycin (200 ng/mL, MultiSciences) for 6 h to mimic activation. MSC-EVs (3 × 10¹⁰ particles/mL, 1.5×10⁴ particles/cell) or 2-DG (5–20 mM, Sigma‒Aldrich) were added to the activated CD4+ T cells.
 |
Figure 1 CD4+ T cells are hyperactivated in AIH patients and mice. (A) Schematic illustration of human sample collection. (B) The mRNA levels of CD25 and CD69 were normalized to β-actin mRNA levels in human peripheral blood CD4` T cells. (C) The mRNA levels of IFN-γ, TNF-α and IL-2 were normalized to β-actin mRNA levels in human peripheral blood CD4+ T cells. (D) Schematic illustration of the animal experiments. (E) Serum ALT and AST levels in NC and AIH mice. (F) Representative images of H&E-stained liver sections from NC and AIH mice (scale bars = 500 μm and 100 μm). (G) Representative flow cytometry plots of CD4+CD69+ T cells and CD4+CD25+ T cells among MNCs from NC and AIH mouse livers. (H) Statistical analysis of flow cytometry data for CD4+CD69+ T cells and CD4+CD25+ T cells among MNCs from NC and AIH mouse livers. Abbreviations: Con A, concanavalin A; NC, normal control. |
Isolation of MSC-EVs
Human umbilical cord MSCs were cultured in DMEM/F12 (Gibco, USA) supplemented with 10% FBS (Biological Industries, Israel). When the cells reached ~80% confluence, the medium was replaced with DMEM/F12 containing 10% EV-depleted FBS (System Biosciences, USA). After 48 h, the culture medium was collected for EV isolation. EVs were isolated from the culture medium using a previously reported differential ultracentrifugation method, with minor modifications.29 Briefly, the culture medium was centrifuged at 300 × g for 10 min, 1000 × g for 15 min and 10,000 × g for 30 min, followed by two ultracentrifugation steps at 100,000 × g for 90 min with an SW32Ti rotor in an Optima XPN-100 ultracentrifuge (Beckman Coulter, USA). All centrifugation steps were conducted at 4 °C. The purified EV pellets were resuspended in PBS for further experiments.
Characterization of MSC-EVs
EV morphology was observed using a transmission electron microscope (TEM) after negative staining.32 Briefly, EVs were diluted with PBS, dropped onto copper nets, stained with 2% phosphotungstic acid at room temperature for 2 minutes, and then observed using a TEM (JEM-1400FLASH, JEOL, Japan) at 80 kV. The size distribution and particle concentration of the EVs were measured using nanoparticle tracking analysis (NTA).33 EVs were diluted with ultrapure water and measured via NTA (Zeta View PMX 120, Particle Metrix, Germany). The analysis parameters were as follows: max area 1000, min area 10, min brightness 30, and operating temperature of 25 °C. The protein concentrations of the EVs were quantified using a BCA protein assay kit (CWBIO, China). Positive protein markers (CD63, TSG101, and Alix) and a negative protein marker (calnexin) of EVs were detected via Western blotting.
Biodistribution of MSC-EVs in Mice
Sulfo-Cy7-NHS ester (New Research Biosciences Co., Ltd., China) was used to label the MSC-EVs, as previously described.34 Next, dye-labeled EVs (3 × 10¹⁰ particles/mouse) and an equal amount of free dye (negative control) or PBS were injected intravenously into normal or Con A-treated mice. After 24 h, the major organs (hearts, lungs, livers, spleens, and kidneys) of the mice were harvested and observed using an IVIS spectrum (PerkinElmer, USA). In addition, these tissue sections were further stained with DAPI. Liver sections were stained with a rabbit anti-CD4 antibody (Ab183685; Abcam, USA) and DAPI.
Cellular Uptake of EVs
PKH26 (Umibio, China) was used to label the MSC-EVs according to the manufacturer’s instructions. Next, PKH26-labeled EVs (3 × 10¹⁰ particles/mL) were incubated with primary CD4+ T cells. The cells were subsequently washed with PBS and stained with FITC-conjugated anti-CD4 (BioLegend, USA) and DAPI. The fluorescence of the cells was observed with a confocal microscope (STELLARIS 5, Leica, Germany).
Mitochondrial Component Transfer Assay
A transwell system was established to assess the transfer of mitochondrial components from MSCs to CD4+ T cells through paracrine routes. Briefly, MitoTracker Deep Red (Invitrogen, USA)-stained MSCs (5 × 10⁴ cells) and MitoTracker Green (Beyotime Biotechnology, China)-labeled CD4+ T cells (1.5× 10⁶ cells) were seeded in the upper and lower chambers, respectively. The small pore size (3 µm) of the transwell allows only mitochondrial transfer between cells through the paracrine pathway, such as via MSC-EVs (~150 nm). Unstained MSCs in the upper chamber were used as a negative control. The fluorescence of CD4+ T cells was detected after coculture.
Moreover, we directly showed that mitochondrial components are transferred from MSCs to CD4+ T cells through EVs. MSCs were stained with MitoTracker Deep Red, and EVs were extracted via ultracentrifugation. Then, the EVs were added to MitoTracker Green-labeled CD4+ T cells, and CD4+ T-cell fluorescence was detected as previously reported35.
Seahorse Metabolic Assay
CD4+ T cells isolated from the mouse spleen by magnetic cell sorting were seeded on Seahorse culture plates at a density of 5×10⁵ cells/well. The extracellular acidification rate (ECAR, an indicator of glycolysis) and oxygen consumption rate (OCR, an indicator of respiration) of CD4+ T cells were measured with a Seahorse XF-24 Flux Analyzer (Seahorse Biosciences, Agilent, USA). The parameters used in the experiments were as follows: 10 mM glucose, 5 μM oligomycin, 50 mM 2-DG, 3 μM FCCP, and 1 μM rotenone/antimycin A.
Lactate Assay
The lactate level in the CD4+ T-cell (5 × 10⁵ cells) culture medium was measured using a lactate assay kit (Nanjing Jiancheng Bioengineering Institute, China) according to the manufacturer’s instructions.
Glucose Uptake Assay
After different interventions, the CD4+ T cells (5 × 10⁵ cells) in each group were harvested separately, washed with PBS and then incubated with 2-NBDG (100 μM, APExBIO, USA) at 37 °C for 30 min. The uptake of 2-NBDG by the cells was measured via flow cytometry.
Cell Viability Assay
The viability of the MSCs (5 × 10⁴ cells) was calculated according to the optical density at 450 nm measured using a microplate reader (BioTek, China) after an incubation with CCK-8 reagent (Absin, China).
Transaminase Level Assay
Mouse serum was isolated from retro-orbital blood by centrifugation at 1000 × g for 10 min. The serum alanine aminotransferase (ALT) and aspartate aminotransferase (AST) concentrations were measured using an automatic biochemical analyzer (Cobas®8000 702, Roche, Switzerland).
Cytokine Level Assay
The concentrations of cytokines (IFN-γ, TNF-α, IL-2, and IL-6) in the culture medium of CD4+ T cells were detected using commercial ELISA kits from MultiSciences and DAKEWE (China) and a Multi-Analyte Flow Assay Kit (BioLegend) according to the manufacturer’s instructions.
Liver Histological Assay
Liver samples from humans and mice were fixed with 4% paraformaldehyde, successively embedded in paraffin and sliced into 4–5 μm sections. The sections were subsequently stained with hematoxylin and eosin (H&E, Servicebio, China). Suzuki’s histological criteria for the assessment of liver damage were adopted.36 For immunofluorescence staining, the sections were incubated with anti-CD4 (Ab183685, Abcam for mouse; RMA-0620, MXB biotechnologies for human) and anti-GLUT1 (Ab115730, Abcam) antibodies at 4 °C overnight.
Flow Cytometry Analysis
To detect immune cell infiltration in the mouse liver, mononuclear cells (MNCs) were isolated from livers and stained with fluorophore-conjugated antibodies. Briefly, single-cell suspensions were prepared by mechanical disruption and filtration through 70 μm cell strainers. Next, the cell suspensions were centrifuged at 30 × g for 5 min. The supernatants were harvested, successively washed with PBS, resuspended in 40% Percoll (Solarbio, China), and overlaid onto 70% Percoll. MNCs were isolated by density gradient centrifugation at 750 × g for 20 min. The isolated MNCs were stained with anti-mouse CD45, CD4, CD69, CD25, CD11b, Ly6G and F4/80 antibodies (BioLegend). In addition, to detect CD4+ T-cell activation in vitro, the cells in each group were harvested, washed with PBS and stained with anti-mouse CD4, CD69, and CD25 antibodies. The analysis was performed with a CytoFLEX flow cytometer (Beckman Coulter, USA).
Western Blotting
Total protein was extracted from CD4+ T cells and EVs using radioimmunoprecipitation assay buffer supplemented with protease and phosphatase inhibitors (CWBIO). Proteins were electrophoresed on sodium dodecyl sulfate‒polyacrylamide gels and transferred to polyvinylidene difluoride membranes. After blocking with 5% BSA for 1.5 h, the membranes were then incubated with the primary antibodies anti-HK2 (ab209847, Abcam), anti-GLUT1 (ET1601-10, HuaBio), anti-PFKFB3 (ab181861, Abcam), anti-CD63 (ET1607-2, HuaBio), anti-TSG101 (ET1701-59, HuaBio), anti-Alix (ET1705-74, HuaBio), anti-Calnexin (10427-2-AP, Proteintech), anti-NDUFB8 (ab192878, Abcam), anti-SDHB (ab175225, Abcam), anti-UQCRC2 (ab203832, Abcam), anti-MTCO1 (ab203912, Abcam), anti-ATP5A (ab176569, Abcam), and anti-β-actin (8457, Cell Signaling Technology, USA) at 4 °C overnight. The following day, the membranes were incubated with HRP-conjugated secondary antibodies (Proteintech, SA00001-2) at room temperature for 1 h. The protein bands were observed using an ultrahigh sensitivity ECL kit (MedChemExpress, USA), and the expression levels were quantified using ImageJ software (NIH, USA).
RNA-Sequencing (RNA-Seq) Analysis of Mouse CD4+ T Cells
Total RNA was extracted from mouse CD4+ T cells from different groups with TRIzol and identified with a Bioanalyzer 2100 system (Agilent Technologies, USA). Sequencing was performed on an Illumina NovaSeq 6000 instrument (Illumina Inc., USA), and 150 bp paired-end reads were generated. The differential expression analysis was conducted using the DESeq2 R package (1.20.0), and the P value was adjusted via the Benjamini–Hochberg method. The thresholds for significant differences were Padj≤0.05 and |log2(fold change)| ≥ 1. KEGG pathway enrichment analysis was performed using clusterProfiler R software (3.8.1). Novogene Co., Ltd. (China) performed the aforementioned procedures.
Real-Time Quantitative PCR (RT–qPCR)
Total RNA was extracted from CD4+ T cells and liver tissues using an RNA extraction kit (Axygen, USA and Vazyme, China) and then reverse transcribed into cDNA using the PrimeScript RT reagent kit (Takara, Japan). RT–qPCR was conducted using SYBR Green mix and an RT–qPCR detection system (CFX96, Bio-Rad, USA). The expression levels were quantified relative to the β-actin levels. The primer sequences are listed in Table S1.
Statistical Analysis
All data are presented as the mean ± SEM. Student’s t-test was used for comparisons between two groups. Analysis of variance (ANOVA) followed by Tukey’s multiple comparison test were used to compare differences between multiple groups. Analyses and statistical graphs were generated with GraphPad Prism 9 (GraphPad Software, Inc., USA). Differences were considered statistically significant when the p value was <0.05.
Results
CD4+ T Cells are Hyperactivated in AIH Patients and AIH Mice
As central participants in the adaptive immune response, CD4+ T cells are effector cells that mediate sustained immune attack on hepatocytes and have been found to be hyperactivated in murine AIH models,10,37 but whether this effect occurs in AIH patients remains elusive. To address this question, we first collected peripheral blood CD4+ T cells from healthy controls (HCs) and AIH patients and compared the T-cell activation state between the two groups (Figure 1A). The mRNA levels of CD69 and CD25 (markers of early and middle activation of T cells, respectively) in the peripheral blood of CD4+ T cells from AIH patients were significantly higher than those in the peripheral blood of HCs (Figure 1B). Proinflammatory cytokine secretion can also reflect the T-cell activation state in individuals with AIH.9 Consistently, CD4+ T cells from AIH patients had higher mRNA levels of proinflammatory cytokines (TNF-α and IL-2) than those from HCs did (Figure 1C), which suggests that CD4+ T cells are overactivated
in AIH patients. In addition, we detected the CD4+ T-cell phenotype in the Con A-induced AIH mouse model (Figure 1D). Con A can partially mimic the pathogenesis of human AIH by inducing a T-cell-mediated immune response and is widely used in drug efficacy evaluations.8 The AIH model was successfully established, as indicated by increased serum ALT and AST levels (Figure 1E), as well as massive liver focal necrotic tissue formation and inflammatory cell infiltration (Figure 1F), in AIH model mice compared with NC mice. Consistent with the findings of a previous study,38 the populations of CD4+CD69+ T cells and CD4+CD25+ T cells were greater in the liver tissues of AIH mice than in those of NC mice (Figure 1G and H). Taken together, these data suggest that CD4+ T-cell activation may be a pivotal trigger of AIH.
Inhibiting Glycolysis Suppresses CD4+ T-Cell Activation and AIH Injury
Activated mouse T cells are dependent primarily on enhanced glucose uptake and glycolysis,39,40 but the metabolic status of CD4+ T cells in humans with AIH has rarely been evaluated. Thus, we first detected the expression of glucose transporter 1 (GLUT1, a major glucose transport protein) in CD4+ T cells from human liver specimens. The results revealed increased GLUT1 expression in the CD4+ T cells from the livers of AIH patients compared with those in the NC group, suggesting increased glucose uptake in the liver CD4+ T cells of AIH patients (Figure 2A). CD4+ T cells were purified from human peripheral blood samples and detected. Compared with those of the NC group, the CD4+ T cells of AIH patients presented higher mRNA levels of key metabolic enzymes involved in glycolysis, including GLUT1, hexokinase 2 (HK2, which catalyzes the first step of glycolysis), 6-phosphofructo-2-kinase/fructose-2,6-biphosphatase 3 (PFKFB3, a rate-limiting enzyme of glycolysis), and lactate dehydrogenase A (LDHA, which catalyzes the last step of glycolysis) (Figure 2B). Similarly, compared with NC mouse livers, AIH mouse livers also presented increased GLUT1 expression in CD4+ T cells (Figure 2C). In vitro, CD4+ T cells isolated from mouse spleens were activated via PMA and ionomycin stimulation, and the protein expression levels of HK2, GLUT1, and PFKFB3 were strikingly increased after activation (Figure 2D).
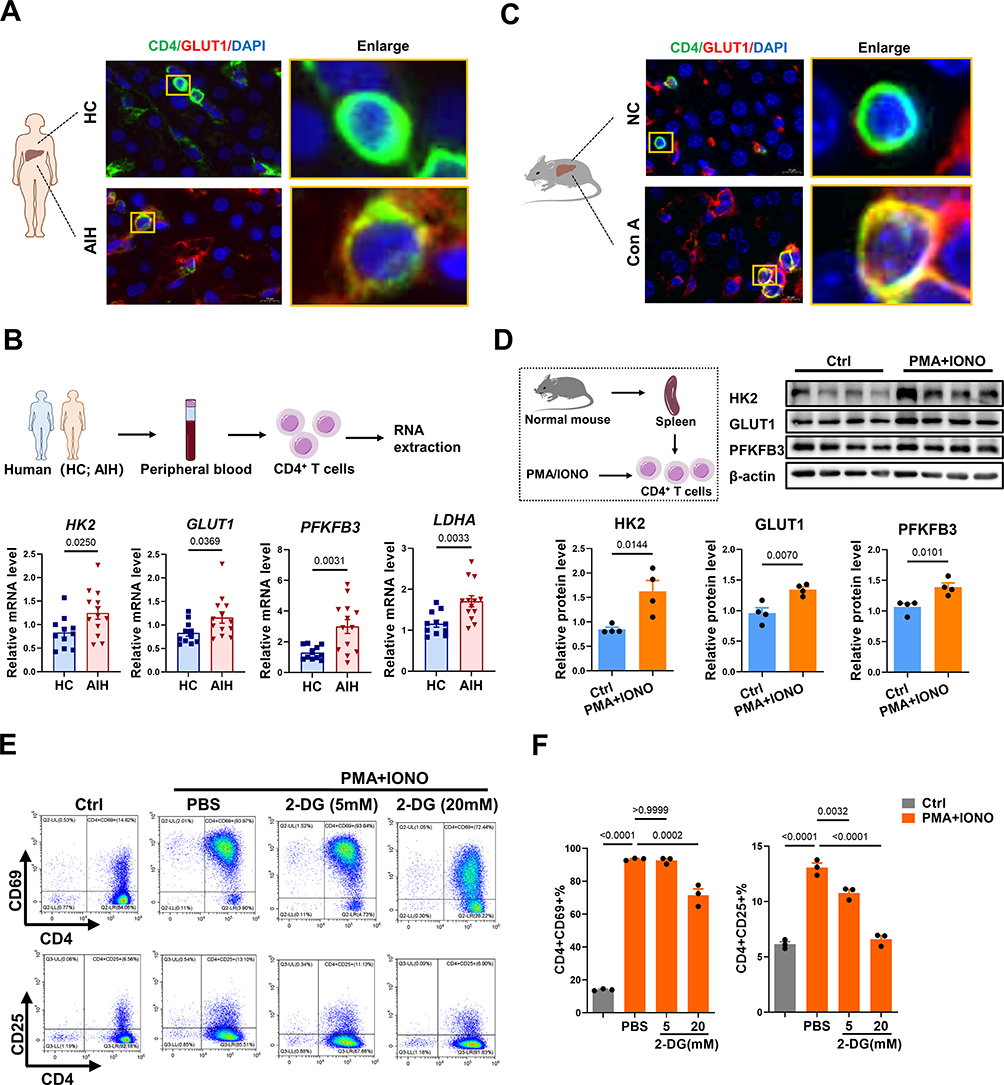 |
Figure 2 Inhibiting glycolysis downregulates CD4+ T-cell activation. (A) Immunofluorescence staining for CD4 and GLUT1 in the livers from AIH patients and HCs (scale bar = 10 μm). (B) Schematic illustration and the mRNA levels of HK2, GLUT1, PFKFB3, and LDHA normalized to β-actin mRNA levels in human peripheral blood CD4+ T cells. (C) Immunofluorescence staining for CD4 and GLUT1 in the livers from NC and AIH mice (scale bar = 10 μm). (D) Schematic illustration and Western blot analysis of HK2, GLUT1, and PFKFB3 levels in CD4+ T cells. (E) Representative flow cytometry plots of CD4+CD69+ T cells and CD4+CD25+ T cells. (F) Statistical analysis of flow cytometry data for CD4+CD69+ T cells and CD4+CD25+ T cells. Abbreviations: HC, healthy control; AIH, autoimmune hepatitis; GLUT1, glucose transporter 1; HK2, hexokinase 2; PFKFB3, 6-phosphofructo-2-kinase/fructose-2,6-biphosphatase 3; LDHA, lactate dehydrogenase A; 2-DG, 2-deoxy-D-glucose; IONO, ionomycin. |
To confirm the role of glycolysis in CD4+ T-cell activation, T cells or AIH mice were treated with 2-DG (a glycolysis inhibitor) as previously reported.41,42 In vitro, 2-DG treatment reduced CD4+ T cell activation in a dose-dependent manner compared with PMA/ionomycin alone (Figure 2E and F). In vivo, systemic administration of 2-DG (i.p). decreased the hepatic mRNA levels of HK2, GLUT1, and PFKFB3 in AIH mice (Figure 3A and B). In addition, 2-DG injection suppressed the activation of CD4+ T cells and the production of proinflammatory cytokines (IFN-γ and IL-6) in the livers of AIH mice (Figure 3C–E). As a result, the degree of liver injury (indicated by serum ALT and AST levels and Suzuki’s liver injury score) in AIH mice decreased after glycolysis inhibition (Figure 3F–H). Together, these results implicate enhanced glycolysis in activated CD4+ T cells in human AIH, which may be a potent therapeutic target for T-cell-mediated liver injury.
 |
Figure 3 Inhibiting glycolysis suppresses CD4+ T-cell activation and AIH injury. (A) Schematic illustration of the animal experiments. (B) The mRNA levels of HK2, GLUT1, and PFKFB3 in livers from different groups. (C) Representative flow cytometry plots of CD4+CD69+ T cells among MNCs in the livers of mice from different groups. (D) Statistical analysis of flow cytometry data for CD4+CD69+ T cells among MNCs in livers of mice from different groups. (E) The mRNA levels of IFN-γ, TNF-α, IL-2, and IL-6 normalized to β-actin mRNA levels in the livers of mice from different groups. (F) Serum ALT and AST levels in different mice. (G) Representative images of H&E-stained liver sections from different mice (scale bars = 500 μm and 100 μm). (H) Suzuki score of liver injury. Abbreviations: Con A, concanavalin A; 2-DG, 2-deoxy-D-glucose; GLUT1, glucose transporter 1; HK2, hexokinase 2; PFKFB3, 6-phosphofructo-2-kinase/fructose-2,6-biphosphatase 3; ALT, alanine aminotransferase; AST, aspartate aminotransferase. |
MSC-EV Treatment Inhibits Proinflammatory CD4+ T Cell Activation in vitro
Although our results revealed that 2-DG treatment reduced glycolysis, CD4+ T-cell activation, and inflammatory injury in AIH mice, the clinical application of this unapproved chemical drug is challenging since it can affect many other organs or tissues in addition to the liver, and long-term administration of 2-DG may disrupt glucose metabolism in other organs or cells and thus cause severe side effects.43,44 In fact, we and many other research groups have reported that the liver is one of the leading organs affected by systemically injected EVs, including MSC-EVs.29 In addition, MSC-EVs have been proposed as promising therapeutic tools to modulate the metabolic state and function of target cells.25 Thus, we sought to assess the therapeutic effect of MSC-EVs on CD4+ T-cell activation. MSC-EVs were isolated from the conditioned medium of MSCs via ultracentrifugation, as previously reported32 (Figure 4A). The isolated MSC-EVs displayed a bilayer membrane structure (Figure 4B), and their median size was ~154.5 nm (Figure 4C). They also expressed positive protein markers (CD63, TSG101, and Alix) but not a negative protein marker (Calnexin) of EVs (Figure 4D).
 |
Figure 4 MSC-EV treatment inhibits proinflammatory CD4+ T-cell activation in vitro. (A) Schematic illustration of MSC-EV isolation. (B) Representative TEM images of MSC-EVs (scale bar = 200 nm). (C) Size distributions of MSC-EVs measured by NTA. (D) Western blot analysis of positive and negative markers of MSC-EVs. (E) Representative fluorescence images of MSC-EV (red) uptake by CD4+ T cells (green). The yellow box indicates the colocalization of red and green signals (scale bar = 10 μm). (F) Representative flow cytometry plots of CD4+CD69+ T cells and CD4+CD25+ T cells. (G) Statistical analysis of flow cytometry data for CD4+CD69+ T cells and CD4+CD25+ T cells. (H) The mRNA levels of IFN-γ, TNF-α, IL-2 and IL-6 normalized to β-actin mRNA levels in different groups of CD4+ T cells. (I) The protein levels of IFN-γ, TNF-α, IL-2 and IL-6 in the supernatants of CD4+ T-cell cultures were measured via ELISA. Abbreviations: MSCs, mesenchymal stem cells; EVs, extracellular vesicles; MSC-EVs, mesenchymal stem cell-derived extracellular vesicles; SUP, supernatant; IONO, ionomycin. |
The effect of MSC-EVs on CD4+ T-cell activation was first evaluated in vitro. MSC-EVs were labeled with the fluorescent dye PKH26 and then added to CD4+ T cells, and these EVs were efficiently taken up by CD4+ T cells (Figure 4E). Indeed, MSC-EV treatment significantly reduced the activation of CD4+ T cells induced by PMA and ionomycin (Figure 4F and G). In addition, the MSC-EV intervention reduced the mRNA levels of proinflammatory cytokines (IFN-γ, TNF-α, and IL-2) in CD4+ T cells and the levels of cytokines (IFN-γ, TNF-α, IL-2, and IL-6) released into the supernatant (Figure 4H and I). These results collectively indicate that MSC-EV treatment can suppress the proinflammatory phenotype of CD4+ T cells.
MSC-EV Treatment Reduces CD4+ T-Cell Activation and Liver Injury in vivo
Next, the biodistribution and therapeutic role of MSC-EVs in AIH mice were evaluated. In line with previous reports,29 Cy7-labeled MSC-EVs mainly accumulated in the liver of mice and exhibited less accumulation in other organs, such as the spleen, kidney, heart, and lung. Moreover, no obvious signals were detected in the organs of the free dye- or PBS-treated groups. Interestingly, we detected an increasing trend of EV signals in the livers of AIH mice compared with those of normal mice, suggesting greater liver uptake or retention of EVs in AIH mice than in normal mice (Figure 5A and B, Figure S1A), which may be due to vascular injury in AIH mice, which increases the leakage of EVs into damaged liver tissues. The therapeutic effect of MSC-EVs (i.v. injection) on AIH mice was subsequently assessed (Figure 5C). Similar to previous studies,23,24 MSC-EV treatment (i.v. injection) significantly decreased the serum ALT and AST levels in AIH mice (Figure 5D). Liver histology revealed reduced damage in the MSC-EV group, as reflected by a decreased necrotic area and less inflammatory cell infiltration than in the AIH group (Figure 5E and F). These findings suggest that MSC-EV treatment can protect AIH mice from liver injury.
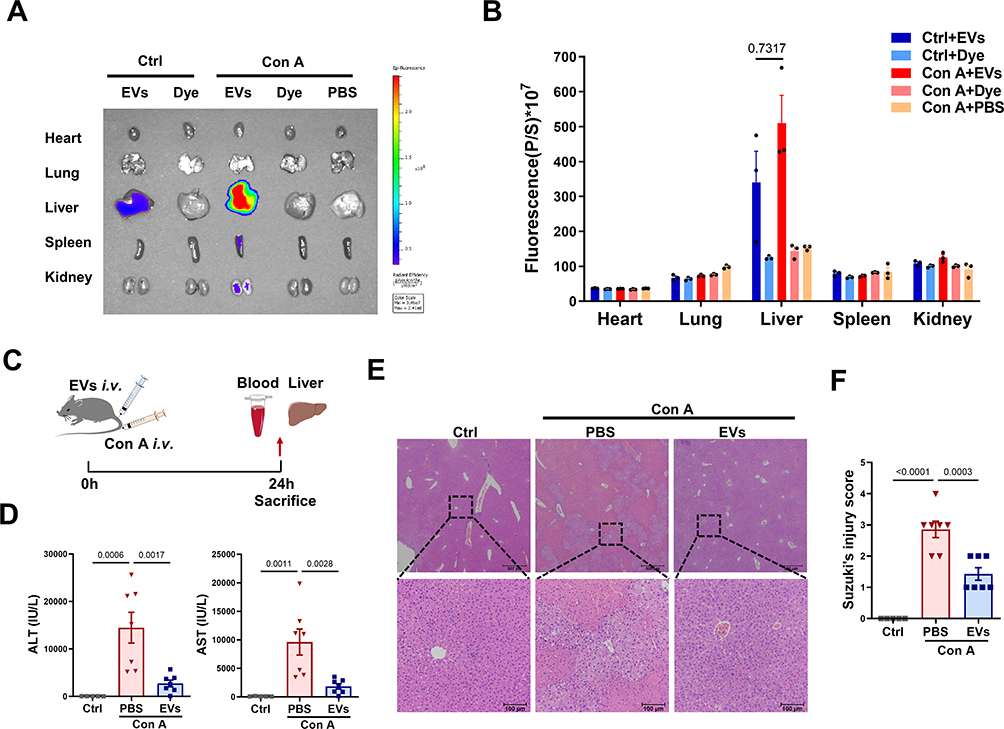 |
Figure 5 MSC-EV treatment reduces liver damage in AIH mice. (A) Representative IVIS images of different mouse organs. (B) Statistical analysis of the fluorescence intensity in different mouse organs. (C) Schematic illustration of the animal experiments. (D) Serum ALT and AST levels in the mice. (E) Representative images of H&E-stained liver sections from different mice (scale bars = 500 μm and 100 μm). (F) Suzuki’s score of liver injury. Abbreviations: EVs, extracellular vesicles; Con A, concanavalin A; ALT, alanine aminotransferase; AST, aspartate aminotransferase. |
Given the critical role of CD4+ T-cell activation in AIH, we also evaluated the effect of MSC-EV treatment on CD4+ T cells in vivo. Dye-labeled MSC-EVs were injected into Con A-treated mice via the tail vein (Figure 6A). As shown in Figure 6B, we observed that dye-labeled MSC-EVs (red) colocalized with CD4+ T cells (green) in the liver tissues of AIH mice, suggesting that MSC-EVs could be taken up by CD4+ T cells in the damaged liver. Moreover, compared with the AIH group, MSC-EV treatment significantly reduced the populations of activated CD4+ T cells while slightly increasing the populations of CD11b+F4/80+ macrophages or CD11b+Ly6G+ neutrophils in the livers of AIH mice (Figure 6C and D, Figure S1B and C). The possible explanation for these phenomena (increased numbers of neutrophils and macrophages in the liver) is that the cells act as phagocytes in response to foreign substances (such as EVs). Other studies have also shown that MSC-EVs can be taken up by macrophages and neutrophils and suppress the proinflammatory phenotype of these cells that mediate disease development.24,35 Therefore, EVs can be taken up by other cells, such as macrophages, and affect the phenotype of these cells; however, more attention should be given to CD4+ T cells in this process because of their dominant role in AIH. In addition, MSC-EV treatment reduced the mRNA levels of HK2, GLUT1, and PFKFB3 in the liver tissues of AIH mice, indicating decreased levels of glucose uptake and glycolysis in the liver of AIH mice after MSC-EV treatment (Figure 6E). The impact of MSC-EVs on GLUT1 expression in hepatic CD4+ T cells was also detected, and the results revealed that GLUT1 expression in the hepatic CD4+ T cells of AIH mice was lower after MSC-EV therapy (Figure 6F). These results indicate that MSC-EV treatment can suppress CD4+ T cell activation and AIH injury, and this effect is likely due to their inhibitory role in glycolysis.
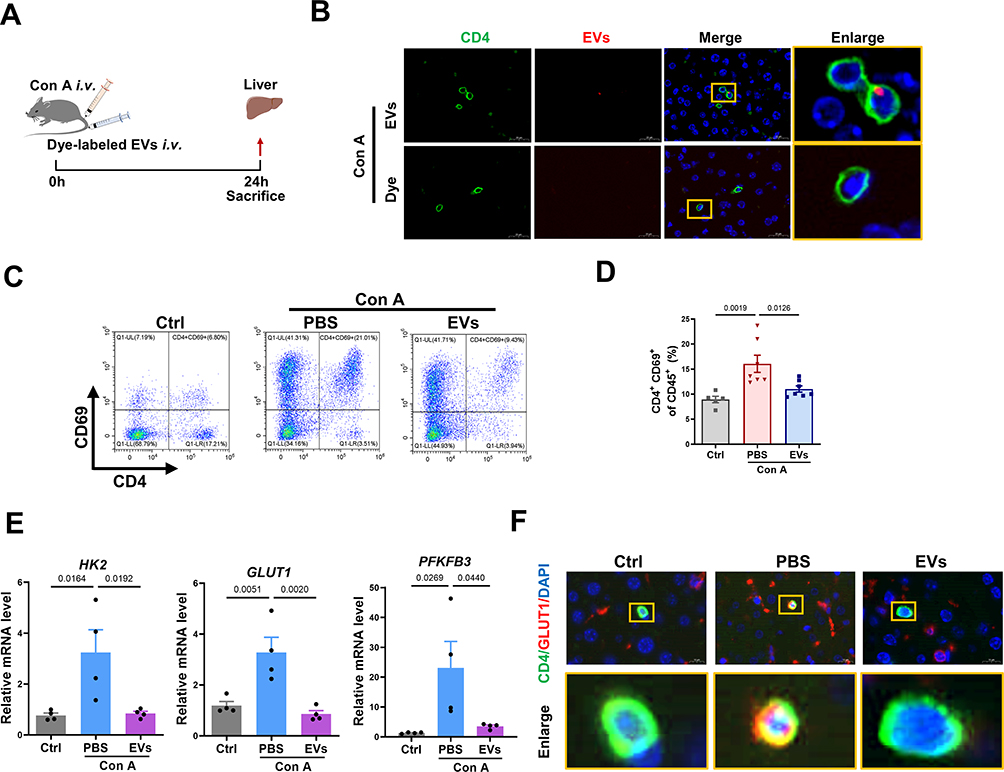 |
Figure 6 MSC-EV treatment reduces CD4+ T-cell activation in vivo. (A) Schematic illustration of the animal experiments. (B) Representative fluorescence images of dye-labeled EVs (red) in liver sections. Liver tissues were stained with a CD4 antibody (green) and DAPI (blue). The yellow box indicates the colocalization of red and green signals (scale bar = 20 μm). (C) Representative flow cytometry plots of CD4+CD69+ T cells among MNCs in livers from mice in the different groups. (D) Statistical analysis of flow cytometry data for CD4+CD69+ T cells among MNCs in the livers of mice from different groups. (E) The mRNA levels of HK2, GLUT1, and PFKFB3 were normalized to β-actin mRNA levels in livers of mice from different groups. (F) Immunofluorescence staining for CD4 and GLUT1 in the liver (scale bar = 10 μm). Abbreviations: EVs, extracellular vesicles; Con A, concanavalin A; GLUT1, glucose transporter 1; HK2, hexokinase 2; PFKFB3, 6-phosphofructo-2-kinase/fructose-2,6-biphosphatase 3. |
MSC-EV Treatment Inhibits CD4+ T Cell Activation via Metabolic Reprogramming
Although MSC-EV treatment can inhibit CD4+ T-cell activation and inflammatory liver injury in vitro and in vivo, the underlying mechanism is unclear. The gene profiles of PMA- and ionomycin-induced CD4+ T cells with or without MSC-EV treatment were analyzed using RNA-seq to determine the effects of MSC-EVs on CD4+ T cells. Principal component analysis (PCA) revealed overall changes in gene expression between the different groups (Figure 7A). The heatmap analysis revealed that the upregulation or downregulation of many genes in activated CD4+ T cells was reversed by the MSC-EV treatment (Figure 7B). A volcano plot showed differentially expressed genes (DEGs, 1689 downregulated and 1909 upregulated) affected by MSC-EV treatment in activated CD4+ T cells (Figure 7C). The KEGG pathway enrichment analysis revealed that the DEGs were enriched primarily in inflammation-related pathways, such as the NF-kappa B signaling pathway and cytokine−cytokine receptor interaction (Figure 7D), which again confirmed the anti-inflammatory role of MSC-EVs in activated CD4+ T cells. Moreover, MSC-EV treatment affected multiple metabolic pathways related to glucose metabolism, such as glycolysis/gluconeogenesis and oxidative phosphorylation (Figure 7D), suggesting that MSC-EVs inhibit CD4+ T-cell activation through metabolic reprogramming.
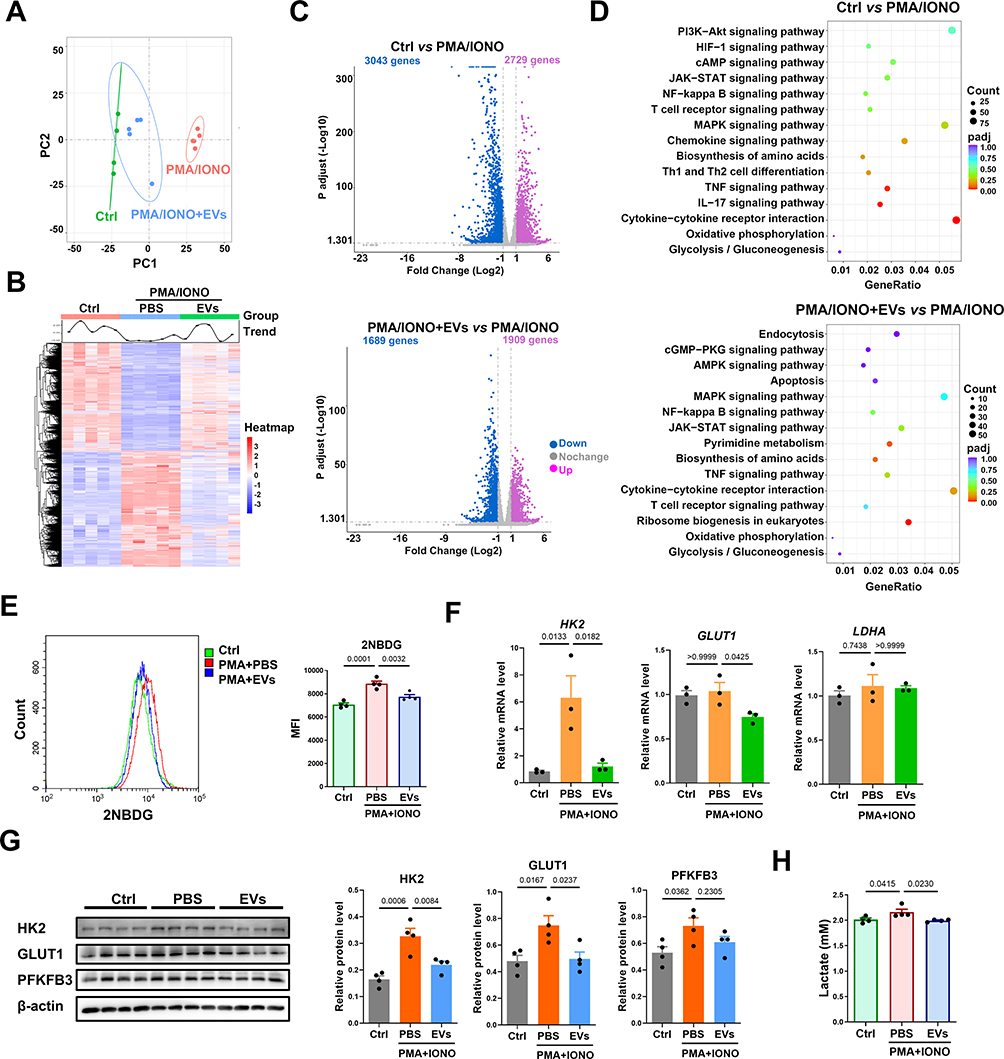 |
Figure 7 MSC-EV treatment induces metabolic reprogramming in CD4+ T cells in vitro. (A) PCA score plot. (B) Heatmap analysis of the differentially expressed genes. (C) Volcano plot of differentially expressed genes (Padj≤0.05 and |log2(fold change)| ≥ 1). (D) KEGG pathway enrichment analysis. (E) Assay of 2-NBDG uptake in CD4+ T cells. (F) The mRNA levels of HK2, GLUT1, and LDHA were normalized to β-actin mRNA levels in different groups of mouse CD4+ T cells. (G) Western blot analysis of HK2, GLUT1, and PFKFB3 levels in CD4+ T cells. (H) Lactate levels in the supernatant of CD4+ T cells. Abbreviations: EVs, extracellular vesicles; IONO, ionomycin; GLUT1, glucose transporter 1; HK2, hexokinase 2; PFKFB3, 6-phosphofructo-2-kinase/fructose-2,6-biphosphatase 3; LDHA, lactate dehydrogenase A. |
Changes in the glycolytic metabolism of CD4+ T cells after MSC-EV treatment were detected to confirm these findings. 2-NBDG (a fluorescent glucose analog) was used to measure the ability of T cells to take up glucose, as previously reported.45 We detected reduced signals of 2-NBDG in the CD4+ T cells from the MSC-EV group compared to the PMA/ionomycin alone group, suggesting that MSC-EVs suppress glucose uptake by CD4+ T cells (Figure 7E). Similarly, the expression of glycolysis-associated genes (HK2 and GLUT1) and proteins (HK2 and GLUT1) was significantly downregulated in MSC-EV-treated CD4+ T cells (Figure 7F and G). The levels of lactate, the end product of glycolysis, were also quantified.46 The level of lactate in the supernatant of CD4+ T-cell cultures decreased after MSC-EV treatment (Figure 7H). Together, these results indicate that MSC-EV treatment can suppress CD4+ T-cell activation through metabolic reprogramming (inhibiting glycolysis).
MSC-EVs Induce Metabolic Switching in CD4+ T Cells by Transferring Mitochondrial Contents
Next, we aimed to explore the effective mechanism by which MSC-EVs induce the metabolic switch of CD4+ T cells. Naive and regulatory T cells rely mainly on OXPHOS to generate ATP, whereas the energy demands of effector T cells shift to glycolytic metabolism.16 This conversion of effector T cells to glycolytic metabolism is closely associated with defective mitochondrial function, primarily OXPHOS dysfunction (eg, decreased expression of ETC proteins).47 Conversely, enhancing mitochondrial OXPHOS with isoalloLCA (a metabolite of lithocholic acid) is sufficient to increase mitochondrial activity and facilitates the differentiation of anti-inflammatory regulatory T cells.48 Importantly, MSC-EVs have been shown to increase mitochondrial OXPHOS in injured renal tubular cells or macrophages via functional mitochondrial transfer.29,49 Previous studies also revealed that various types of mitochondrial contents, such as ETC proteins (eg, ATP5A) and mtDNA, are enriched in MSC-EVs.29 Based on these reports, we hypothesized that MSC-EVs may transfer functional mitochondrial components to increase OXPHOS while suppressing glycolysis in activated CD4+ T cells. Consistent with previous studies, we detected abundant expression of mitochondrial ETC proteins, including NDUFB8, SDHB, UQCRC2, MTCO1, and ATP5A, in MSC-EVs (Figure 8A).
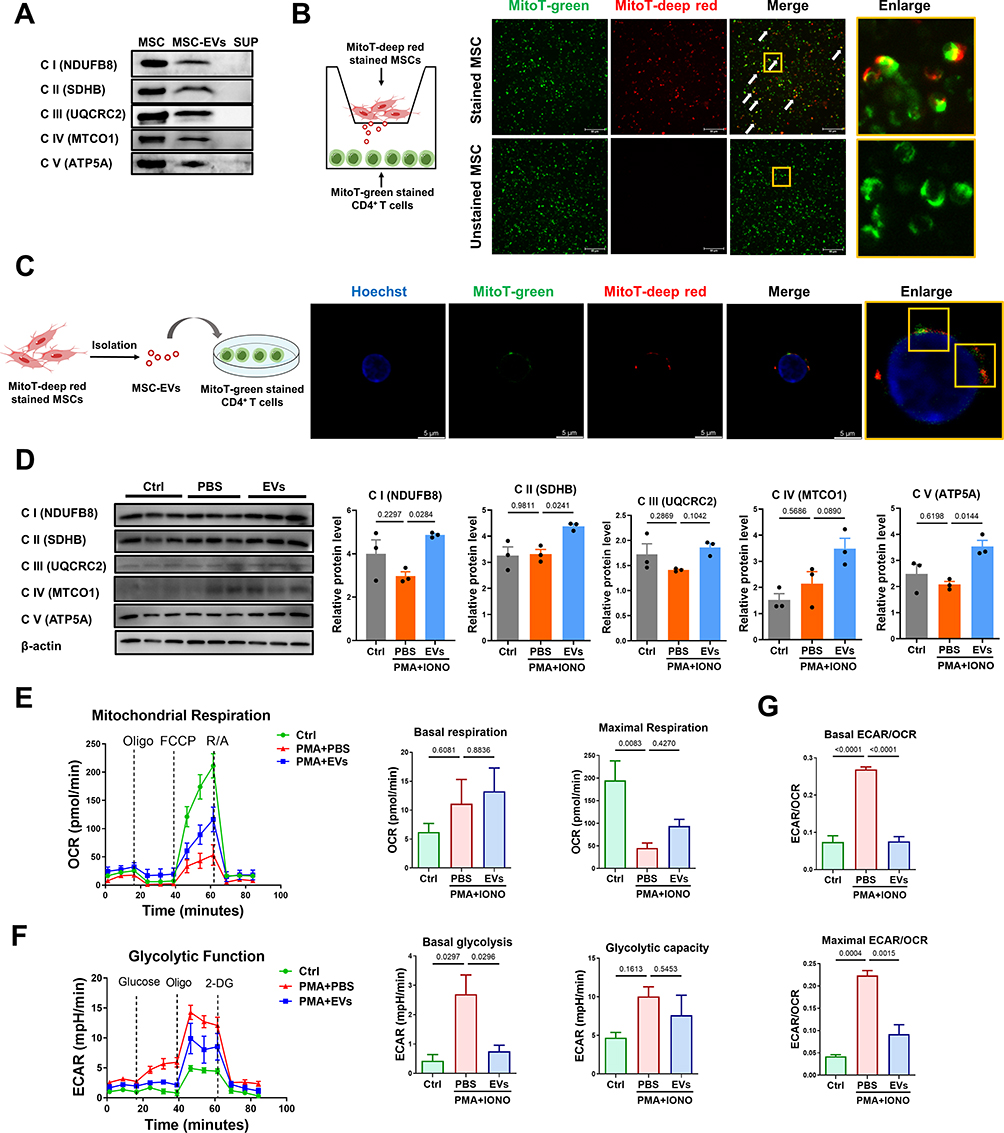 |
Figure 8 MSC-EVs induce the metabolic switch of CD4+ T cells via mitochondrial transfer. (A) Western blot analysis of the levels of mitochondrial electron transport chain (ETC) proteins in MSCs and MSC-EVs. (B) Schematic illustration and fluorescence images. The yellow box indicates the colocalization of red and green signals (scale bar = 50 μm). (C) Schematic illustration and confocal images. The yellow box indicates the colocalization of red and green signals (scale bar = 5 μm). (D) Western blot analysis of the levels of mitochondrial ETC proteins in different groups of CD4+ T cells. (E) Measurement of the OCR in CD4+ T cells. (F) Measurement of the ECAR of CD4+ T cells. (G) Basal and maximal ECAR:OCR ratios. Abbreviations: MSCs, mesenchymal stem cells; EVs, extracellular vesicles; MSC-EVs, mesenchymal stem cell-derived extracellular vesicles; SUP, supernatant. MitoT, MitoTracker. |
Next, a transwell system was used to visualize mitochondrial protein transfer from MSCs to CD4+ T cells, and MitoTracker Deep Red-labeled MSCs and MitoTracker Green-labeled CD4+ T cells (Figure S2A and B) were cultured in the upper and lower chambers, respectively. The small pore size (3 µm) of the transwell only allows mitochondrial transfer between cells through the paracrine pathway, such as via MSC-EVs (~150 nm). We found that MSC-derived mitochondrial contents (red) passed through the transwell system and then colocalized with the mitochondria (green) of CD4+ T cells in the lower chamber (Figure 8B). MitoTracker Deep Red-labeled MSC-EVs were directly added to MitoTracker Green-labeled CD4+ T cells to confirm this effect, and mitochondrial components (red) of MSC-EVs were also observed in the mitochondrial network (green) of CD4+ T cells (Figure 8C). Moreover, CD4+ T cells that received MSC-EVs presented increased levels of mitochondrial ETC proteins compared with those in the PMA/ionomycin alone group (Figure 8D). These results suggest that mitochondrial components can be transferred from MSCs to CD4+ T cells through EVs.
The impact of MSC-EV-mediated mitochondrial protein transfer on the metabolic state of CD4+ T cells was also evaluated. Notably, activated CD4+ T cells induced by PMA and ionomycin presented an impaired mitochondrial respiratory capacity (such as maximal respiration) and increased glycolysis (such as basal glycolysis) compared to native CD4+ T cells (Figure 8E and F). In contrast, MSC-EV treatment restored the mitochondrial respiratory capacity and suppressed glycolysis in activated CD4+ T cells (Figure 8E and F). The ECAR/OCR ratio in activated CD4+ T cells decreased after MSC-EV treatment (Figure 8G), indicating a metabolic switch from glycolysis to mitochondrial OXPHOS in these cells. Together, these findings suggest that the inhibitory effect of MSC-EVs on glycolysis in activated CD4+ T cells likely occurs through EV-mediated mitochondrial protein transfer.
Disruption of Mitochondrial Protein Transfer Impairs the Therapeutic Effects of MSC-EVs
As a method to further confirm the above findings, we used rhodamine-6G to irreversibly damage mitochondrial function in MSCs, as previously reported,49,50 and then isolated MSC-EVs harboring disrupted mitochondrial contents (Rho-EVs, Figure 9A). As shown in Figure S3A, rhodamine-6G (0.1–1 μg/mL) did not affect the viability of the MSCs; thus, 1 μg/mL rhodamine-6G was chosen for the subsequent experiments. Rhodamine-6G treatment reduced the levels of ETC proteins (NDUFB8, SDHB, UQCRC2, MTCO1, and ATP5A) and the mitochondrial respiratory capacity in MSCs (Figure S3B and C). However, no obvious differences in morphology, median size (152.8 nm vs 150.7 nm), and levels of protein markers (Alix) were observed between the Ctrl-EVs and Rho-EVs (Figure 9B–D). As expected, Rho-EVs contained lower levels of mitochondrial ETC proteins (NDUFB8, SDHB, UQCRC2, MTCO1, and ATP5A) than Ctrl-EVs (Figure 9D).
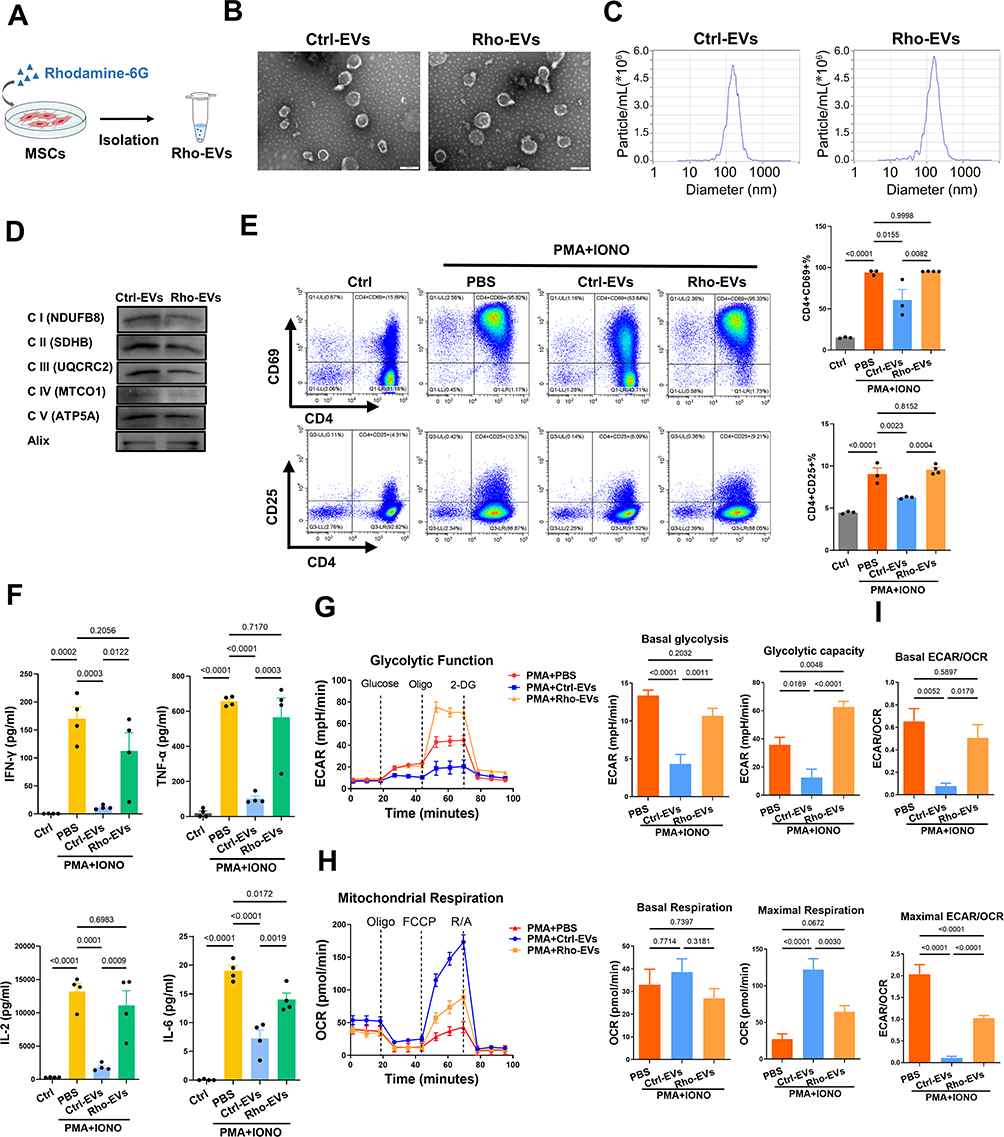 |
Figure 9 Disruption of mitochondrial transfer impairs the therapeutic effects of MSC-EVs on CD4+ T-cell activation. (A) Schematic illustration of Rho-EV isolation. (B) Representative TEM images of Ctrl-EVs and Rho-EVs (scale bar = 200 nm). (C) Size distributions of Ctrl-EVs and Rho-EVs measured by NTA. (D) Western blot analysis of Ctrl-EVs and Rho-EVs. (E) Representative flow cytometry plots and statistical analysis of CD4+CD69+ T cells. (F) The protein levels of IFN-γ, TNF-α, IL-2 and IL-6 in the supernatants of CD4+ T-cell cultures. (G) Measurement of the OCR in CD4+ T cells. (H) Measurement of the ECAR in CD4+ T cells. (I) Basal and maximal ECAR:OCR ratios. Abbreviations: EVs, extracellular vesicles; Ctrl, control; Rho, rhodamine-6G; IONO, ionomycin. |
Next, the effects of Ctrl-EVs or Rho-EVs on CD4+ T-cell activation were assessed. Compared with the Ctrl-EV group, the ability of Rho-EVs to inhibit the activation of CD4+ T cells was lower, as indicated by the larger populations of CD4+CD69+ T cells and CD4+CD25+ T cells (Figure 9E). Additionally, CD4+ T cells in the Rho-EV group presented higher levels of proinflammatory cytokines (IFN-γ, TNF-α, IL-2, and IL-6) in the supernatant than did those in the Ctrl-EV group (Figure 9F). Moreover, compared with Ctrl-EVs, Rho-EVs exhibited an impaired ability to induce metabolic switching in CD4+ T cells, such as decreased maximal respiration, increased basal glycolysis, and an increased ECAR/OCR ratio (Figure 9G–I). These findings again indicate that the metabolic reprogramming of activated CD4+ T cells by MSC-EVs is at least partially dependent on mitochondrial protein transfer.
Discussion
Overactivated CD4+ T cells play a pivotal role in the pathogenesis of AIH and are promising therapeutic targets for treating this disease. In this study, our results revealed that enhanced glycolysis promoted CD4+ T-cell overactivation and liver injury in humans with AIH and that MSC-EV-mediated mitochondrial protein transfer attenuated CD4+ T-cell activation and liver injury via the metabolic reprogramming of CD4+ T cells.
A better understanding of the regulatory mechanisms of CD4+ T-cell activation in AIH may provide insights for the development of efficient therapies to control this disease. In recent years, the metabolic status has been recognized as a key regulator of T lymphocyte survival and effector functions.51 The process underlying the shift of T cells from a quiescent state to an activated state is associated with a rapid transition from OXPHOS to glycolysis;52 thus, an increased ratio of glycolytic/OXPHOS represents T-cell activation.17 GLUT1 is a major transporter that supports glycolysis during CD4+ T-cell activation.53 Indeed, we detected increased levels of activation markers (CD69 and CD25), GLUT1 and glycolytic enzymes (HK2, PFKFB3, and LDHA) in CD4+ T cells from liver biopsies and the peripheral blood of AIH patients, and these metabolic changes were also observed in mouse AIH models, suggesting CD4+ T-cell overactivation with increased glycolysis in humans with AIH. This finding corroborates the findings of pilot studies emphasizing that activated effector T cells rely mainly on glycolysis to supply energy.54 In contrast, we confirmed that the inhibition of glycolysis with 2-DG can suppress CD4+ T-cell activation (as indicated by CD69 levels) and liver injury (as indicated by ALT levels, AST levels, and histological scores) in AIH mice. Similar research revealed that 2-DG treatment reversed the proinflammatory phenotype of hepatic CXCR3+ Th17 cells in a mouse model of nonalcoholic fatty liver disease.42 Based on these findings, enhanced glycolysis could be considered a potent therapeutic target to reverse activated CD4+ T cells and liver injury in individuals with AIH.
However, the clinical translation of 2-DG as a treatment for AIH is challenging because of its wide distribution in most organs and thus its high risk of off-target effects and side effects. This result prompted us to identify safer and targeted therapies that can modulate the metabolic state and function of T cells to treat AIH. MSC-EVs have been used as a promising approach for treating various inflammatory diseases in clinical trials and basic research,55,56 and the liver is the primary organ that takes up systemically injected EVs.29 Previous studies reported that MSC-EVs contributed to liver protection in an experimental AIH model via the regulation of hepatocytes.23,24 However, the exact mechanism involved needs further exploration. In the present study, we consistently found that MSC-EVs were able to reduce transaminase levels and histological injury scores, which represent liver damage, in AIH mice. Additionally, our study revealed that this effect was associated with increased retention of MSC-EVs in the damaged liver of AIH mice (as indicated by the fluorescence intensity of EVs) and the uptake of such EVs by the liver CD4+ T cells (as indicated by the colocalization of EVs and CD4+ T cells). Moreover, MSC-EV treatment suppressed CD4+ T-cell activation (as indicated by CD69 levels) and glycolytic potency (as indicated by HK2, GLUT1 and PFKFB3 levels) in the livers of AIH mice. These findings are consistent with those of a previous study describing the MSC-EV-mediated inhibition of CD4+ T-cell activation in liver ischemia/reperfusion injury.57 Taken together, our results highlight not only the vital role of MSC-EVs in alleviating AIH but also the metabolic status of CD4+ T cells as a regulatory target.
Emerging studies have documented that MSC-EVs may impact the metabolic state and function of immune cells by transferring mitochondrial components.25 For example, human bone marrow-derived MSC-EV treatment drives an anti-inflammatory phenotype in macrophages by enhancing mitochondrial OXPHOS via mitochondrial transfer, thereby ameliorating acute respiratory distress syndrome in mice.49 Human umbilical cord-derived MSC-EV treatment protects against liver ischemia/reperfusion injury by transferring functional mitochondria to inhibit the formation of neutrophil extracellular traps in the livers of mice.35 In addition to MSCs, EVs derived from brain endothelial cells have also been reported to transfer mitochondrial components (such as the mitochondrial structural protein TOMM20 and the functional protein ATP5A) and to facilitate ATP production in ischemic stroke model mice.27 In this study, we also found that MSV-EVs contained mitochondrial ETC proteins, including ATP5A, NDUFB8, SDHB, UQCRC2, and MTCO1. Furthermore, our new data suggest that these ETC proteins can induce a metabolic switch from glycolysis to OXPHOS (as indicated by a decreased ECAR and increased OCR) in activated CD4+ T cells. However, EVs from MSCs with a rhodamine 6G-induced disruption of mitochondrial function had limited effects on these parameters in CD4+ T cells. This reduced regulatory effect of EVs induced by rhodamine 6G has also been reported in neutrophils and macrophages.35,49 Together, our results suggest that MSC-EVs can regulate the phenotype of immune cells partially via metabolic reprogramming induced by mitochondrial protein transfer.
Importantly, our results showed that glycolysis in CD4+ T cells could also be suppressed by MSC-EV treatment. In fact, some previous studies have reported the direct suppressive effect of certain EVs on intracellular glycolysis pathways. For example, breast cancer cell-derived EVs inhibited glycolysis and insulin secretion by transferring miR-122 to inhibit the expression of the glycolytic enzyme pyruvate kinase M (PKM) in beta-cells.58 MSC-derived exosomal miR-21a-5p repressed glycolysis in tubular epithelial cells by targeting the glycolytic enzyme phosphofructokinase muscle isoform (PFKM).59 MSC-EVs can also downregulate the expression of a key regulator of glycolysis, hypoxia-inducible factor 1α (HIF-1α), to reduce glycolytic flux.60 These findings suggest that, in addition to their ability to transfer mitochondrial proteins and mediate OXPHOS, MSC-EVs might also deliver other types of bioactive cargos, such as miRNAs (which might inhibit the expression of glycolytic enzymes) and proteins (which might bind to transcription factors that regulate glycolysis), to inhibit glycolysis pathways and thus induce metabolic switching in T cells, which is worthy of further study. Furthermore, developing engineered MSC-EVs with an enhanced ability to inhibit the glycolysis pathway is a potent strategy for curing inflammatory diseases.
In this study, we revealed that enhanced glycolysis in CD4+ T cells plays a crucial role in the pathogenesis of human AIH, while MSC-EV therapy can induce metabolic reprogramming of CD4+ T cells to cure AIH, and this effect is at least partially due to EV-mediated mitochondrial protein transfer between cells. However, some questions are still unanswered and need to be explored in future studies. For example, in addition to mitochondrial proteins, MSC-EVs might also carry many other types of cargos (eg, miRNAs) that contribute to metabolic regulation (eg, glycolysis inhibition) or the immunomodulatory effects of MSC-EV therapy. Thus, a global profile of the functional cargos of MSC-EVs and investigation of their detailed impacts on target cells, such as over activated CD4+ T cells, are necessary. Additionally, the exact mechanism by which the mitochondrial protein components of MSC-EVs regulate the mitochondrial function of recipient cells remains elusive. MSC-EV subpopulations of different sizes may differ in the amounts and/or signatures of their mitochondrial contents. Nevertheless, this study indicates that MSC-EVs may serve as a safe and targeted therapy for treating inflammatory liver diseases, and more trials are needed to evaluate their therapeutic value before future clinical applications.
Conclusion
In summary, this study revealed that enhanced glycolysis promotes CD4+ T-cell overactivation and liver injury in human AIH. Conversely, MSC-EV treatment can reduce CD4+ T-cell overactivation and liver injury via metabolic reprogramming (enhancing OXPHOS and reducing glycolysis) in T cells, and this effect is at least partially due to EV-mediated mitochondrial protein transfer between cells. This study may provide a new strategy for treating liver diseases related to CD4+ T-cell overactivation, such as AIH.
Funding
This study was supported by grants from the National Natural Science Foundation of China (No. 82070582 to Li Yang) and the 135 Project for Disciplines of Excellence, West China Hospital, Sichuan University (No. ZYGD23031 to Li Yang, ZYYC23001 to Jingping Liu).
Disclosure
The authors declare that they have no competing interests in this work.
References
1. Mack CL, Adams D, Assis DN, et al. Diagnosis and management of autoimmune hepatitis in adults and children: 2019 practice guidance and guidelines from the American association for the study of liver diseases. Hepatol. 2020;72(2):671–722. doi:10.1002/hep.31065
2. Choi J, Choi GH, Lee D, et al. Long-term clinical outcomes in patients with autoimmune hepatitis according to treatment response in Asian country. Liver Int. 2019;39(5):985–994. doi:10.1111/liv.14082
3. Pape S, Schramm C, Gevers TJ. Clinical management of autoimmune hepatitis. Uni Eur Gastroenterol J. 2019;7(9):1156–1163. doi:10.1177/2050640619872408
4. Lohse AW, Mieli-Vergani G. Autoimmune hepatitis. J Hepatol. 2011;55(1):171–182. doi:10.1016/j.jhep.2010.12.012
5. Sharma R, Verna EC, Soderling J, Roelstraete B, Hagstrom H, Ludvigsson JF. Increased mortality risk in autoimmune hepatitis: A nationwide population-based cohort study with histopathology. Clin Gastroenterol Hepatol. 2021;19(12):2636–2647. doi:10.1016/j.cgh.2020.10.006
6. van Gerven NM, Verwer BJ, Witte BI, et al. Relapse is almost universal after withdrawal of immunosuppressive medication in patients with autoimmune hepatitis in remission. J Hepatol. 2013;58(1):141–147. doi:10.1016/j.jhep.2012.09.009
7. Sebode M, Hartl J, Vergani D, Lohse AW. International autoimmune hepatitis G. Autoimmune hepatitis: From current knowledge and clinical practice to future research agenda. Liver Int. 2018;38(1):15–22. doi:10.1111/liv.13458
8. Fan X, Men R, Huang C, et al. Critical roles of conventional dendritic cells in autoimmune hepatitis via autophagy regulation. Cell Death Dis. 2020;11(1):23. doi:10.1038/s41419-019-2217-6
9. Herkel J, Carambia A, Lohse AW. Autoimmune hepatitis: Possible triggers, potential treatments. J Hepatol. 2020;73(2):446–448. doi:10.1016/j.jhep.2020.03.015
10. Terziroli Beretta-Piccoli B, Mieli-Vergani G, Vergani D. Autoimmmune hepatitis. Cell Mol Immunol. 2022;19(2):158–176. doi:10.1038/s41423-021-00768-8
11. Sun C, Fujisawa M, Ohara T, et al. Spred2 controls the severity of concanavalin A-induced liver damage by limiting interferon-gamma production by CD4(+) and CD8(+) T cells. J Adv Res. 2022;35:71–86. doi:10.1016/j.jare.2021.03.014
12. Zhang S, Liang R, Luo W, et al. High susceptibility to liver injury in IL-27 p28 conditional knockout mice involves intrinsic interferon-gamma dysregulation of CD4+ T cells. Hepatol. 2013;57(4):1620–1631. doi:10.1002/hep.26166
13. Tiegs G, Hentschel J, Wendel A. A T cell-dependent experimental liver injury in mice inducible by concanavalin A. J Clin Invest. 1992;90(1):196–203. doi:10.1172/JCI115836
14. Wu B, Qiu J, Zhao TV, et al. Succinyl-CoA ligase deficiency in pro-inflammatory and tissue-invasive T cells. Cell Metab. 2020;32(6):967–980e965. doi:10.1016/j.cmet.2020.10.025
15. Xie W, Fang J, Shan Z, et al. Regulation of autoimmune disease progression by Pik3ip1 through metabolic reprogramming in T cells and therapeutic implications. Sci Adv. 2022;8(39):eabo4250. doi:10.1126/sciadv.abo4250
16. Almeida L, Dhillon-LaBrooy A, Carriche G, Berod L, Sparwasser T. CD4(+) T-cell differentiation and function: Unifying glycolysis, fatty acid oxidation, polyamines NAD mitochondria. J Allergy Clin Immunol. 2021;148(1):16–32. doi:10.1016/j.jaci.2021.03.033
17. Court AC, Le-Gatt A, Luz-Crawford P, et al. Mitochondrial transfer from MSCs to T cells induces treg differentiation and restricts inflammatory response. EMBO Rep. 2020;21(2):e48052. doi:10.15252/embr.201948052
18. Pang SHM, D’Rozario J, Mendonca S, et al. Mesenchymal stromal cell apoptosis is required for their therapeutic function. Nat Commun. 2021;12(1):6495. doi:10.1038/s41467-021-26834-3
19. Panes J, Garcia-Olmo D, Van Assche G, et al. Expanded allogeneic adipose-derived mesenchymal stem cells (Cx601) for complex perianal fistulas in Crohn’s disease: A phase 3 randomised, double-blind controlled trial. Lancet. 2016;388(10051):1281–1290. doi:10.1016/S0140-6736(16)31203-X
20. Zhao M, Liu S, Wang Y, et al. The mitochondria‒paraspeckle axis regulates the survival of transplanted stem cells under oxidative stress conditions. Theranostics. 2024;14(4):1517–1533. doi:10.7150/thno.88764
21. Wu R, Fan X, Wang Y, et al. Mesenchymal stem cell-derived extracellular vesicles in liver immunity and therapy. Front Immunol. 2022;13:833878. doi:10.3389/fimmu.2022.833878
22. Buzas EI. The roles of extracellular vesicles in the immune system. Nat Rev Immunol. 2023;23(4):236–250. doi:10.1038/s41577-022-00763-8
23. Chen L, Lu FB, Chen DZ, et al. BMSCs-derived miR-223-containing exosomes contribute to liver protection in experimental autoimmune hepatitis. Mol Immunol. 2018;93:38–46. doi:10.1016/j.molimm.2017.11.008
24. Lu FB, Chen DZ, Chen L, et al. Attenuation of experimental autoimmune hepatitis in mice with bone mesenchymal stem cell-derived exosomes carrying microRNA-223-3p. Mol Cells. 2019;42(12):906–918. doi:10.14348/molcells.2019.2283
25. Zhou X, Liu S, Lu Y, Wan M, Cheng J, Liu J. MitoEVs: A new player in multiple disease pathology and treatment. J Extracell Vesicles. 2023;12(4):e12320. doi:10.1002/jev2.12320
26. Wu S, Yang T, Ma M, et al. Extracellular vesicles meet mitochondria: Potential roles in regenerative medicine. Pharmacol Res. 2024;206:107307. doi:10.1016/j.phrs.2024.107307
27. Dave KM, Venna VR, Rao KS, et al. Mitochondria-containing extracellular vesicles from mouse vs. human brain endothelial cells for ischemic stroke therapy. J Contr Rel. 2024;373:803–822. doi:10.1016/j.jconrel.2024.07.065
28. Dutra Silva J, Su Y, Calfee CS, et al. Mesenchymal stromal cell extracellular vesicles rescue mitochondrial dysfunction and improve barrier integrity in clinically relevant models of ARDS. Eur Respir J. 2021;58(1). doi:10.1183/13993003.02978-2020.
29. Zhao M, Liu S, Wang C, et al. Mesenchymal stem cell-derived extracellular vesicles attenuate mitochondrial damage and inflammation by stabilizing mitochondrial DNA. ACS Nano. 2021;15(1):1519–1538. doi:10.1021/acsnano.0c08947
30. Dave KM, Stolz DB, Venna VR, et al. Mitochondria-containing extracellular vesicles (EV) reduce mouse brain infarct sizes and EV/HSP27 protect ischemic brain endothelial cultures. J Contr Rel. 2023;354:368–393. doi:10.1016/j.jconrel.2023.01.025
31. Sayeed N, Sugaya K. Exosome mediated Tom40 delivery protects against hydrogen peroxide-induced oxidative stress by regulating mitochondrial function. PLoS One. 2022;17(8):e0272511. doi:10.1371/journal.pone.0272511
32. Shen M, Fan X, Shen Y, et al. Myeloid-derived suppressor cells ameliorate liver mitochondrial damage to protect against autoimmune hepatitis by releasing small extracellular vesicles. Int Immunopharmacol. 2023;114:109540. doi:10.1016/j.intimp.2022.109540
33. Liu S, Lv K, Wang Y, et al. Improving the circulation time and renal therapeutic potency of extracellular vesicles using an endogenous ligand binding strategy. J Contr Rel. 2022;352:1009–1023. doi:10.1016/j.jconrel.2022.11.017
34. Wang Y, Liu S, Li L, et al. Peritoneal M2 macrophage-derived extracellular vesicles as natural multitarget nanotherapeutics to attenuate cytokine storms after severe infections. J Contr Rel. 2022;349:118–132. doi:10.1016/j.jconrel.2022.06.063
35. Lu T, Zhang J, Cai J, et al. Extracellular vesicles derived from mesenchymal stromal cells as nanotherapeutics for liver ischaemia-reperfusion injury by transferring mitochondria to modulate the formation of neutrophil extracellular traps. Biomat. 2022;284:121486. doi:10.1016/j.biomaterials.2022.121486
36. Suzuki S, Toledo-Pereyra LH, Rodriguez FJ, Cejalvo D. Neutrophil infiltration as an important factor in liver ischemia and reperfusion injury. Modulating effects of FK506 and cyclosporine. Transplant. 1993;55(6):1265–1272. doi:10.1097/00007890-199306000-00011
37. Zhao J, Chu F, Xu H, et al. C/EBPalpha/miR-7 controls CD4(+) T-cell activation and function and orchestrates experimental autoimmune hepatitis in mice. Hepatol. 2021;74(1):379–396. doi:10.1002/hep.31607
38. Yu Q, Tu H, Yin X, et al. Targeting glutamine metabolism ameliorates autoimmune hepatitis via inhibiting T cell activation and differentiation. Front Immunol. 2022;13:880262. doi:10.3389/fimmu.2022.880262
39. Wang R, Dillon CP, Shi LZ, et al. The transcription factor Myc controls metabolic reprogramming upon T lymphocyte activation. Immun. 2011;35(6):871–882. doi:10.1016/j.immuni.2011.09.021
40. Villarino AV, Laurence AD, Davis FP, et al. A central role for STAT5 in the transcriptional programing of T helper cell metabolism. Sci Immunol. 2022;7(77):eabl9467. doi:10.1126/sciimmunol.abl9467
41. Bailis W, Shyer JA, Zhao J, et al. Distinct modes of mitochondrial metabolism uncouple T cell differentiation and function. Nature. 2019;571(7765):403–407. doi:10.1038/s41586-019-1311-3
42. Moreno-Fernandez ME, Giles DA, Oates JR, et al. PKM2-dependent metabolic skewing of hepatic Th17 cells regulates pathogenesis of non-alcoholic fatty liver disease. Cell Metab. 2021;33(6):1187–1204. doi:10.1016/j.cmet.2021.04.018
43. Wu L, Hollinshead KER, Hao Y, et al. Niche-selective inhibition of pathogenic Th17 cells by targeting metabolic redundancy. Cell. 2020;182(3):641–654. doi:10.1016/j.cell.2020.06.014
44. Raez LE, Papadopoulos K, Ricart AD, et al. A Phase I dose-escalation trial of 2-deoxy-D-glucose alone or combined with docetaxel in patients with advanced solid tumors. Cancer Chemother Pharmacol. 2013;71(2):523–530. doi:10.1007/s00280-012-2045-1
45. Gong Y, Tang N, Liu P, et al. Newcastle disease virus degrades SIRT3 via PINK1-PRKN-dependent mitophagy to reprogram energy metabolism in infected cells. Autophagy. 2022;18(7):1503–1521. doi:10.1080/15548627.2021.1990515
46. Li X, Yang Y, Zhang B, et al. Lactate metabolism in human health and disease. Signal Transduct Target Ther. 2022;7(1):305. doi:10.1038/s41392-022-01151-3
47. Desdin-Mico G, Soto-Heredero G, Aranda JF, et al. T cells with dysfunctional mitochondria induce multimorbidity and premature senescence. Science. 2020;368(6497):1371–1376. doi:10.1126/science.aax0860
48. Hang S, Paik D, Yao L, et al. Bile acid metabolites control T(H)17 and T(reg) cell differentiation. Nature. 2019;576(7785):143–148. doi:10.1038/s41586-019-1785-z
49. Morrison TJ, Jackson MV, Cunningham EK, et al. Mesenchymal stromal cells modulate macrophages in clinically relevant lung injury models by extracellular vesicle mitochondrial transfer. Am J Respir Crit Care Med. 2017;196(10):1275–1286. doi:10.1164/rccm.201701-0170OC
50. Gear AR. Rhodamine 6G. A potent inhibitor of mitochondrial oxidative phosphorylation. J Biol Chem. 1974;249(11):3628–3637. doi:10.1016/S0021-9258(19)42620-3
51. MacIver NJ, Michalek RD, Rathmell JC. Metabolic regulation of T lymphocytes. Annu Rev Immunol. 2013;31:259–283. doi:10.1146/annurev-immunol-032712-095956
52. Sharabi A, Tsokos GC. T cell metabolism: New insights in systemic lupus erythematosus pathogenesis and therapy. Nat Rev Rheumatol. 2020;16(2):100–112. doi:10.1038/s41584-019-0356-x
53. Macintyre AN, Gerriets VA, Nichols AG, et al. The glucose transporter Glut1 is selectively essential for CD4 T cell activation and effector function. Cell Metab. 2014;20(1):61–72. doi:10.1016/j.cmet.2014.05.004
54. Huang L, Li H, Zhang C, et al. Unlocking the potential of T-cell metabolism reprogramming: Advancing single-cell approaches for precision immunotherapy in tumour immunity. Clin Transl Med. 2024;14(3):e1620. doi:10.1002/ctm2.1620
55. Nassar W, El-Ansary M, Sabry D, et al. Umbilical cord mesenchymal stem cells derived extracellular vesicles can safely ameliorate the progression of chronic kidney diseases. Biomater Res. 2016;20:21. doi:10.1186/s40824-016-0068-0
56. Kordelas L, Rebmann V, Ludwig AK, et al. MSC-derived exosomes: A novel tool to treat therapy-refractory graft-versus-host disease. Leukemia. 2014;28(4):970–973. doi:10.1038/leu.2014.41
57. Zheng J, Lu T, Zhou C, et al. Extracellular vesicles derived from human umbilical cord mesenchymal stem cells protect liver ischemia/reperfusion injury by reducing CD154 expression on CD4+ T cells via CCT2. Adv Sci. 2020;7(18):1903746. doi:10.1002/advs.201903746
58. Cao M, Isaac R, Yan W, et al. Cancer-cell-secreted extracellular vesicles suppress insulin secretion through miR-122 to impair systemic glucose homeostasis and contribute to tumour growth. Nat Cell Biol. 2022;24(6):954–967. doi:10.1038/s41556-022-00919-7
59. Xu S, Cheuk YC, Jia Y, et al. Bone marrow mesenchymal stem cell-derived exosomal miR-21a-5p alleviates renal fibrosis by attenuating glycolysis by targeting PFKM. Cell Death Dis. 2022;13(10):876. doi:10.1038/s41419-022-05305-7
60. Pei L, Li R, Wang X, et al. MSCs-derived extracellular vesicles alleviate sepsis-associated liver dysfunction by inhibiting macrophage glycolysis-mediated inflammatory response. Int Immunopharmacol. 2024;128:111575. doi:10.1016/j.intimp.2024.111575
 © 2024 The Author(s). This work is published and licensed by Dove Medical Press Limited. The
full terms of this license are available at https://www.dovepress.com/terms.php
and incorporate the Creative Commons Attribution
- Non Commercial (unported, 3.0) License.
By accessing the work you hereby accept the Terms. Non-commercial uses of the work are permitted
without any further permission from Dove Medical Press Limited, provided the work is properly
attributed. For permission for commercial use of this work, please see paragraphs 4.2 and 5 of our Terms.
© 2024 The Author(s). This work is published and licensed by Dove Medical Press Limited. The
full terms of this license are available at https://www.dovepress.com/terms.php
and incorporate the Creative Commons Attribution
- Non Commercial (unported, 3.0) License.
By accessing the work you hereby accept the Terms. Non-commercial uses of the work are permitted
without any further permission from Dove Medical Press Limited, provided the work is properly
attributed. For permission for commercial use of this work, please see paragraphs 4.2 and 5 of our Terms.