")
Back to Journals » Nature and Science of Sleep » Volume 16
Modifications in the Composition of the Gut Microbiota in Rats Induced by Chronic Sleep Deprivation: Potential Relation to Mental Disorders
Received 29 May 2024
Accepted for publication 23 August 2024
Published 4 September 2024 Volume 2024:16 Pages 1313—1325
DOI https://doi.org/10.2147/NSS.S476691
Checked for plagiarism Yes
Review by Single anonymous peer review
Peer reviewer comments 2
Editor who approved publication: Dr Sarah L Appleton
Li-Ming Zheng, Yan Li
Department of Psychology and Sleep Medicine, Guangdong Provincial Hospital of Chinese Medicine, Guangzhou, 510120, People’s Republic of China
Correspondence: Li-Ming Zheng, Department of Psychology and Sleep Medicine, Guangdong Provincial Hospital of Chinese Medicine, 111 Dade Road, Yuexiu District, Guangzhou, 510120, People’s Republic of China, Tel +8620-81887233-30409, Email [email protected]
Introduction: Sleep deprivation(SD) has numerous negative effects on mental health. A growing body of research has confirmed the implication of gut microbiota in mental disorders. However, the specific modifications in mammalian gut microbiota following SD exhibit variations across different studies.
Methods: Male specific-pathogen-free Wistar rats were given a modified multiple-platform exposure for 7 days of SD. Fecal samples were obtained from the control and SD groups both at baseline and after 7 days of SD. We utilized 16S rDNA gene sequencing to investigate the gut microbial composition and functional pathways in rats.
Results: Analysis of the microbiota composition revealed a significant change in gut microbial composition after chronic SD, especially at the phylum level. The relative abundances of p_Firmicutes, g_Romboutsia, and g_Enterococcus increased, whereas those of p_Bacteroidetes, p_Verrucomicrobia, p_Fusobacteria, g_Akkermansia, and g_Cetobacterium decreased in animals after chronic SD compared with controls or animals before SD. The ratio of Firmicutes to Bacteroidetes exhibited an increase following SD. The relative abundance of gut microbiota related to the functional pathways of GABAergic and glutamatergic synapses was observed to be diminished in rats following SD compared to pre-SD.
Conclusion: Collectively, these findings suggest that chronic SD causes significant alterations in both the structural composition and functional pathways of the gut microbiome. Further researches are necessary to investigate the chronological and causal connections among SD, the gut microbiota and mental disorders.
Keywords: gut microbiota, rats, sleep deprivation, mental disorders
Introduction
Undoubtedly, adequate sleep is crucial for the maintenance of both physical and mental health; however, the proportion of employed individuals reporting to get an average of six or fewer hours of sleep within a 24-hour period rose from 28.4% in 2008–2009 to 32.6% in 2017–2018.1 Extensive research has highlighted the detrimental effects of insufficient sleep on mental health, which result in such as cognitive impairments, decreased performance, interpersonal conflicts, mood disturbances, and difficulties in family communication.2 Additionally, accumulating evidence suggests that there is growing support for the involvement of the gut microbiota in various conditions, encompassing depression, anxiety, and neurodegenerative disorders.3–6 We hypothesized sleep deprivation influences mental well-being by altering the gut microbiota of the host.
 |
Figure 1 (A) Anosim test conducted using Bray-Curtis distances to compare the phylum-level differences between the SD-7d and C-7d groups (p=0.001, R=0.2956). (B) PCoA and (C) NMDS conducted using Bray-Curtis distances to compare the phylum-level differences between the SD-7d and C-7d groups. |
 |
Table 1 The Relative Abundance of Differential Species Between SD-7d and C-7d Groups (Phylum, %) |
 |
Table 2 The Relative Abundance of Differential Species Between SD-7d and SD-0d Groups (Phylum, %) |
 |
Table 3 The Relative Abundance of Differential Species Between SD-7d and SD-0d Groups (Genus, %) |
However, the specific alterations in the composition of the gut microbiota caused by sleep deprivation and restriction remain elusive at the first place. While some studies have suggested a potential association between the quality of sleep and the composition of the human gut microbiota, as well as the impact of chronic sleep disruption on gut microbiota in mice,7,8 it is important to note that conflicting results have been reported. For example, according to El Aidy and colleagues, mice experience slight changes in their gut microbiota composition after a short duration of sleep deprivation.9 And Zhang and his team found no notable modifications in the fecal microbiota of humans or rats following chronic sleep restriction.10 These variations may stem from factors including the duration and methodologies employed for sleep deprivation, animal species utilized, diverse analytical approaches, or other experimental variables that exert substantial influence on the microbiota. For instance, the duration of sleep deprivation in mice/rats varies, ranging from a short period of 5 to 72 hours,9,11–13 to a chronic course of 12 to 24 hours daily for 7 to 42 days.10,14–22 Moreover, most studies on gut microbiota have primarily focused on comparing one or more treatment groups with the control group post-treatment, overlooking potential differences between groups at baseline or caused by time. Therefore, the present study aims to accurately determine the alterations in the composition of gut microbiota in male rats induced by chronic SD, while minimizing confounding factors such as baseline differences or temporal effects. Here we implemented a chronic sleep deprivation protocol for 24 hours per day over a period of 7 days in order to induce more pronounced and enduring changes in gut microbiota.
Materials and Methods
Rats
Male Wistar rats were obtained from Southern Medical University (Guangzhou, China) at weight of 180–220g. The rats were randomly assigned by weight to the SD (n=9) and non-SD control(C) groups (n=9) and fed in a controlled environment that met specific pathogen-free conditions. The animals were kept in a light-dark cycle of 12 hours each, with the lights being switched on at 08:00 am. They had access to food and water ad libitum. After one week of adaptive feeding, the SD group began to experience chronic SD. The experimental protocols were reviewed and approved by the experimental animal ethics committee of the Guangdong Provincial Hospital of Chinese Medicine in accordance with Chinese legislation regarding experimental animals (No.2020083).
Sleep Deprivation
Rats in the SD group were sleep-deprived 24 hours daily for 7 days according to the modified multiple platform method(MMPM). Briefly, 9 animals from the SD group were placed in a polypropylene cage (60×44×37 cm). The cage contained 9 platforms, each with a diameter of 6.3 cm and a height of 15 cm, which were submerged into the water to a depth of approximately 2 cm below the surface of the platforms. The animals were allowed to move freely and jump from one platform to another. Food and water were provided throughout the procedure. MMPM was used to prepare an animal model of SD. Once the animals enter sleep and lose muscle tone, they tend to touch or fall into the water on the platforms and immediately wake up.23,24 During the SD period, the control rats allowed to sleep regularly were housed in identical SD devices with water as previously described, featuring a stainless steel wire mesh that provided a resting surface without direct contact with the water.24
Fecal Samples Processing and Microbiota Profiling
The fecal samples were collected from both the control and SD groups before and after a 7-day exposure to SD. 2–3 fecal pellets were collected from each rat every time. The samples were rapidly frozen and preserved at a temperature of −80°C until they were ready for subsequent analysis. The DNA extraction procedure followed the manufacturer’s instructions, utilizing HiPure Soil DNA Kits (or HiPure Stool DNA Kits) provided by Magen in Guangzhou, China. Relevant standard procedures with slight modifications were employed to conduct high-throughput sequencing of the V3-V4 hypervariable region of the bacterial 16S rDNA gene using an Illumina Nova 6000 SP PE250. Briefly, the V3-V4 region was amplified via PCR using universal primers incorporating adapter overhang nucleotide sequences for both forward and reverse index primers. The utilized primers consisted of 16S V3‐V4 Fwd CCTACGGGNGGCWGCAG and 16S V3‐V4 Rev GGACTACHVGGGTATCTAAT. The amplicons underwent purification using AMPure XP beads (Beckman, CA, USA). Subsequently, the Illumina DNA Prep Kit (Illumina, CA, USA) was employed to generate sequencing libraries in accordance with the manufacturer’s guidelines. The library quality was evaluated utilizing the ABI StepOnePlus Real-Time PCR System (Life Technologies, Foster City, USA). Ultimately, sequencing on the Novaseq 6000 platform yielded 2×250 bp paired-end reads.
Bioinformatics and Statistical Analyses
FASTP (version 0.18.0) was utilized for the analysis, initial quality control measures were conducted as previously explained, and chimera sequences were eliminated using the UCHIME algorithm. The remaining valid sequences were grouped into operational taxonomic units (OTUs) with a threshold of 97% similarity to determine the alpha diversity (Shannon and Simpson indices) and richness abundance-based coverage estimators (ACE and Chao1). Beta diversity was assessed by calculating Bray–Curtis distances and visualized through principal coordinate analysis (PCoA) and non-metric multi-dimensional scaling (NMDS). In NMDS analysis the stress value below 0.1 indicates closer proximity to the anticipated analytical outcome. Group comparisons were conducted using the Anosim test, which was implemented in the Vegan R package. In the Anosim test, the difference between groups exceeds the within-group difference when 1>R>0. We applied a filtering process to exclude samples with inadequate read counts, specifically discarding those with less than 1000 sequence reads. Comparisons between groups regarding microbic differences at various levels were performed using the Wilcoxon test. A procedure called LEfSe (linear discriminant analysis effect size) was employed to detect biomarkers of the microbiota in fecal samples, specifically at the phylum and genus levels. An LDA (logarithmic linear discriminant analysis) score threshold of 2 was utilized as a criterion for determining the effect size. In contrast to conventional statistical methods, LEfSe offers an evaluation of the strength of the relationship between each OTU and grouping categories through LDA scores, in addition to p-values. The accuracy of microbiota as a biomarker was assessed using Receiver Operating Characteristic (ROC) curve analysis, with the accuracy increasing proportionally with the AUC value. The Firmicutes/Bacteroidetes(F/B) ratios between groups were compared by Mann–Whitney U-test using the SPSS data analysis program (version 26.0). Tax4Fun analysis predicted the potential metabolic pathways in each group. Bioinformatic analysis was performed using Omicsmart, a dynamic real-time interactive online platform for data analysis(http://www.omicsmart.com). Statistical significance was determined when p-values were less than 0.05 or q-values (adjusted p-values) were less than 0.05.
Results
Impacts of Chronic Sleep Deprivation on Microbial Diversity
To investigate the disparities in fecal microbial communities between the SD and control groups, we assessed the ecological features using diverse indices derived from the OUT level. However, the α diversity index, including Shannon, Simpson, ACE, and Chao1 indices, exhibited notable variations, between the SD and control groups before SD (SD-0d vs C-0d, p < 0.05; Table S1). Therefore, changes in the α-diversity index of the rats between groups after SD could not be confirmed.
The comparison of species diversity similarity between groups was conducted using the Anosim function, principal coordinate analysis (PCoA), and non-metric multi-dimensional scaling (NMDS) to evaluate β diversity. Before SD, the SD group (SD-0d) exhibited similar phylum-level characteristics as the control group (C-0d) (Figure S1a, p > 0.05). However, the two groups exhibited notable dissimilarities at the class, order, family, and genus levels (Figure S1b-e, p < 0.05). After SD, the SD group (SD-7d) exhibited significant differences from the control group(C-7d) at the phylum level (Figure 1A–C, p < 0.05). No comparisons were made between SD-7d and C-7d at the class, order, family, and genus levels because they were different at baseline. The β-diversity of the control group did not deviate significantly before and after SD (C-7d vs C-0d) at the phylum, class, order, family, and genus levels (Figure S2a-e, p > 0.05). However, the SD group after SD compared to before(SD-7d vs SD-0d) showed significant changes in these levels(Figures 2–6, p < 0.05).
 |
Figure 2 (A) Anosim test conducted using Bray-Curtis distances to compare the phylum-level differences between groups before(SD-0d) and after(SD-7d) SD (p=0.001, R=0.4448). (B) PCoA and (C) NMDS conducted using Bray-Curtis distances to compare the phylum-level differences between groups before(SD-0d) and after(SD-7d) SD. |
 |
Figure 3 (A) Anosim test conducted using Bray-Curtis distances to compare the class-level differences between groups before(SD-0d) and after(SD-7d) SD (p=0.001, R=0.4849). (B) PCoA and (C) NMDS conducted using Bray-Curtis distances to compare the class-level differences between groups before(SD-0d) and after(SD-7d) SD. |
 |
Figure 4 (A) Anosim test conducted using Bray-Curtis distances to compare the order-level differences between groups before(SD-0d) and after(SD-7d) SD (p=0.001, R=0.5274). (B) PCoA and (C) NMDS conducted using Bray-Curtis distances to compare the order-level differences between groups before(SD-0d) and after(SD-7d) SD. |
 |
Figure 5 (A) Anosim test conducted using Bray-Curtis distances to compare the family-level differences between groups before(SD-0d) and after(SD-7d) SD (p=0.001, R=0.7716). (B) PCoA and (C) NMDS conducted using Bray-Curtis distances to compare the family-level differences between groups before(SD-0d) and after(SD-7d) SD. |
 |
Figure 6 (A) Anosim test conducted using Bray-Curtis distances to compare the genus-level differences between groups before(SD-0d) and after(SD-7d) SD (p=0.001, R=0.761). (B) PCoA and (C) NMDS conducted using Bray-Curtis distances to compare the genus-level differences between groups before(SD-0d) and after(SD-7d) SD. |
Variations in the Relative Abundance of Bacterial Taxa in Rats Following Chronic Sleep Deprivation
In terms of phylum composition after SD, the SD group exhibited a greater abundance of Firmicutes compared to the control group. Conversely, the prevalence of Bacteroidetes and Verrucomicrobia was higher in the control group (SD-7d vs C-7d, q < 0.05; Table 1), and Actinobacteria was filtered, which was significantly different between the two groups before SD (SD-0d vs C-0d, q < 0.05; Table 1). The comparison of species proportions between SD-7d and C-7d at the class, order, family, and genus levels was not conducted due to significant β diversity differences observed at these taxonomic levels between the two groups before SD(SD-0d vs C-0d) as mentioned above. In the SD group after SD, there was a significant increase in Firmicutes at the phylum level, while Bacteroidetes, Verrucomicrobia, and Fusobacteria exhibited a decline (SD-7d vs SD-0d, q < 0.05; Table 2), with filtration of Euryarchaeota, which was significantly different in the control group before and after SD (C-7d vs C-0d, q < 0.05; Table 2). At the genus level, Romboutsia and Enterococcus increased significantly, whereas Akkermansia and Cetobacterium decreased in the SD group after SD compared to before (SD-7d vs SD-0d, q < 0.05; Table 3). Weissella was filtered, which was significantly different in the control group before and after SD(C-7d vs C-0d, q < 0.05; Table 3).
Furthermore, we employed LDA LEfSe and ROC analysis to discern the aforementioned taxa that could elucidate the disparities in microbiota composition between control and SD animals post-SD, as well as pre- and post-SD rats. (Figures 7–9).
 |
Figure 7 (A) LEfSe identifying phylum-level microbial biomarkers that effectively discriminate between the C-7d and SD-7d groups of rats. (B-D) ROC curve to value the accuracy of the differential microbiota as biomarker for discriminating the C-7d and SD-7d groups at the phylum level. |
 |
Figure 8 (A) LEfSe identifying phylum-level microbial biomarkers that effectively discriminate between SD-0d and SD-7d groups of rats. (B-E) ROC curve to value the accuracy of the differential microbiota as biomarker for discriminating the SD-0d and SD-7d groups at the phylum level. |
 |
Figure 9 (A) LEfSe identifying genus-level microbial biomarkers that effectively discriminate between SD-0d and SD-7d groups of rats. (B-E) ROC curve to value the accuracy of the differential microbiota as biomarker for discriminating the SD-0d and SD-7d groups at the genus level. |
Effects of Chronic Sleep Deprivation on the Firmicutes/Bacteroidetes Ratio
No notable disparities in the Firmicutes/Bacteroidetes (F/B) ratios were observed between the SD and control groups prior to SD (SD-0d vs C-0d, p > 0.05; Figure S3a) or in the control groups before and after SD (C-7d vs C-0d, p > 0.05; Figure S3b). After SD, the levels of F/B ratios exhibited significantly elevated in the SD group compared to the control group (SD-7d vs C-7d, p < 0.05; Figure 10A). The F/B ratios in the SD group increased significantly after SD (SD-7d vs SD-0d, p < 0.05; Figure 10B).
 |
Figure 10 (A) Comparison of the Firmicutes/Bacteroidetes(F/B) ratios between C-7d and SD-7d groups (#, U=68, p=0.014, Mann–Whitney U-test). (B) Comparison of the F/B ratios between SD-0d and SD-7d groups (#, U=81, p=0.000, Mann–Whitney U-test). Boxes represent the interquartile ranges. Lines inside the boxes denote medians. The circle and asterisk are outliers. |
Changes of Functional Pathways in the Gut Microbiota Following Chronic Sleep Deprivation
The Tax4Fun algorithm was utilized to evaluate functional disparities by mapping differential pathways against the KEGG database, based on significantly distinct abundances observed between SD and control rats. Here, we mainly focused on the neurotransmitter system, which is closely associated with mental disorders. The gut microbial abundances relative to GABAergic synapses and glutamatergic synapses decreased in the SD group after SD compared to before SD (SD-7d vs SD-0d, q < 0.05; Figure 11), whereas no significant differences were observed in the control group before and after SD (C-7d vs C-0d, q > 0.05; Figure S4).
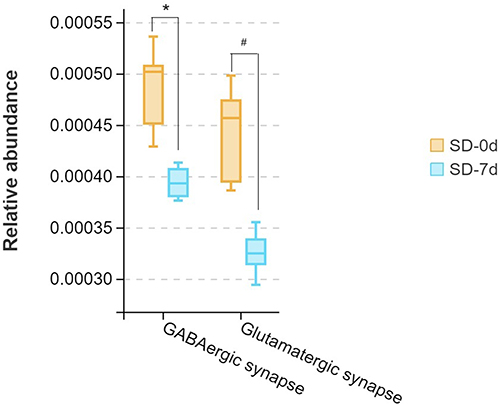 |
Figure 11 Comparison of the gut microbial abundance of KEGG pathways between SD-0d and SD-7d groups by Wilcoxon test (*, q=0.044; #, q=0.029). q-value, p-value after adjusted. Boxes represent the interquartile ranges. Lines inside the boxes denote medians. |
Discussion
In the present study, a comparison was conducted between the control and SD groups before SD to identify baseline differences. Additionally, a comparison was made between the control group before and after SD to account for changes attributable to time. The present study offers a notable advantage that excludes differences in the α diversity index, β diversity analysis, distinct microbiota, and functional pathways at baseline between the groups prior to sleep deprivation. Besides, we accounted for differences resulting from time (the control group before and after SD) to accurately ascertain the alterations induced by SD.
In this study, the confirmation of changes in the α-diversity index of the rats after SD was hindered due to existing differences between the two groups pre-SD. However, changes in gut microbial community composition were identified from the β diversity differences after chronic SD, assessed via Anosim analysis of the Bray–Curtis distances. Specifically, significant disparities in the gut microbiota composition were observed at the phylum level when comparing the SD-7d and C-7d groups, as well as substantial differences were detected at various taxonomic levels including phylum, class, order, family, and genus when comparing the SD-7d and SD-0d groups. The differential microbiota discussed below was obtained from these levels. Our results disagreed with those reported by El Aidy et al and Zhang et al mentioned at the beginning of this article.9,10 El Aidy et al kept male C57Bl6/J mice awake for 5 hour of sleep deprivation by employing gentle tapping, cage shaking, and/or removal of the wire cage top.9 Adult male Sprague-Dawley rats were subjected to enforced activity within slowly rotating drums for 20 hours per day over a period of 7 days, while giving them a resting period of 4 hours at the end of the light phase (Zhang et al).10 But we deprived the male Wistar rats of sleep for the whole 7 days by modified multi-platform method. These different results might originate from the duration and methods of SD and the different animal species.
In this study, we demonstrated that chronic SD in rats not only induces substantial alterations in the gut microbiota’s composition but also elicits significant variations in the differential abundance of specific taxa at various levels. The abundance of p_Firmicutes was found to be significantly higher in the SD-7d group, while the abundances of p_Verrucomicrobia and p_Bacteroidetes at the phylum level were significantly lower in comparison to those observed in the C-7d group. These differential phyla were similar to those in the comparison between the SD-7d and the SD-0d groups, besides significantly lower abundance of p-Fusobacteria. The findings suggest that Firmicutes has the potential to serve as a phylum-level biomarker for SD. And these findings exhibit substantial concurrence with investigations listed below on the gut microbiota in mental disorders. Rashnaei et al demonstrated a decrease in the relative abundance of Verrucomicrobia, Bacteroidetes, and Firmicutes phyla in bipolar patients’ fecal samples compared to those of healthy individuals.25 De Angelis et al observed a decreased abundance of Fusobacteria and Verrucomicrobia in children with autism compared to that in healthy controls.26 Yang et al reported a negative correlation between the duration of methamphetamine use and the abundance of Fusobacteria.27 Dong et al observed an rise in the Verrucomicrobia population among individuals with a diagnosis of general anxiety disorder,28 while Hemmings et al reported a decrease in this phylum among individuals suffering from posttraumatic stress disorder.29 Anxiety patients/mice typically exhibited reduced levels of Firmicutes but elevated levels of Bacteroidetes and Fusobacteria.30 Bacteroidetes decreased in individuals with major depressive disorders.31,32 These discrepancies may be attributed to various mental disorders. It may be speculated that chronic SD is more likely to develop depression than anxiety.
We also analyzed the Firmicutes/Bacteroidetes(F/B) ratios between the groups at the phylum level. Firmicutes, a group of gram-positive bacteria, exert significant influence on mental and physical health through their impact on the synthesis of short-chain fatty acids. Conversely, Bacteroidetes, as a group of gram-negative bacteria, include lipopolysaccharides and flagellin components that have the ability to stimulate cytokine synthesis and enhance immune response.33 Numerous studies have consistently demonstrated the significant association between the F/B ratio and health status, highlighting its pivotal role in preserving intestinal homeostasis. For instance, Rashnaei et al reported an elevated F/B ratio in bipolar patients compared to healthy controls, suggesting its potential as a candidate marker for bipolar disorder.12 In our study, the F/B ratios of the rats after chronic SD were increased obviously compared to both the ratios of the control rats and the animals before SD respectively. This finding suggests that chronic SD disrupts the ratio of F/B in the host, potentially implicating its association with mental disorders.
At the genus level, the rats after chronic SD had an increased abundance of g_Romboutsia and g_Enterococcus but a decreased abundance of g_Akkermansia and g_Cetobacterium. G_Romboutsia and g_Enterococcus belong to p_Firmicutes, g_Akkermansia to p_Verrucomicrobia, and g_Cetobacterium to p_Fusobacteria. The results suggest that Romboutsia and Enterococcus have the potential to serve as genus-level biomarkers for SD. Genera such as Romboutsia exhibited higher abundance in fecal samples obtained from pigs exposed to social stressors, including repetitive regrouping and a decreased allocation of space, over a period of 4 weeks.34 In comparison to the control group, rats exposed to chronic unpredictable mild stress exhibited a significant increase in the abundance of Romboutsia.35 Additionally, an alteration in the gut microbial community composition was evident among methamphetamine users, characterized by notable increases in Romboutsia compared to control individuals.14 Rashnaei et al found an increase in Enterococcus faecalis of the bipolar disorder in affected individuals.12 In a study comprising 90 individuals diagnosed with schizophrenia who were not taking any medication and 81 controls, it was noted that patients with schizophrenia exhibited the presence of specific facultative anaerobic bacteria, such as Enterococcus faecium, which were infrequently detected in healthy subjects (Zhu et al, 2020).36 Previous studies have indicated that specific gut microbiota, such as Enterococcus faecalis, can influence dopamine metabolism and function.37,38 Studies have reported a decrease in the abundance of Akkermansia muciniphila in mice displaying depressive behavior after experiencing social defeat39 and in rats exhibiting depression-like symptoms following chronic paradoxical sleep deprivation.40 Experimental findings also demonstrated that Akkermansia muciniphila exerted a mitigating effect on depressive symptoms through modulation of monoamine neurotransmitter levels and brain-derived neurotrophic factors (BDNF). The presence of Akkermansia muciniphila resulted in an upregulation of hippocampal BDNF mRNA expression, suggesting its capability to augment synaptic signaling pathways and neural connection.41 Akkermansia muciniphila directly modulates the host’s 5-HT system, leading to an elevation in intestinal 5-HT levels.42 However, we could not find any research on Cetobacterium in patients with mental illness. Both Enterococcus and Akkermansia were correlated with neurotransmitters and their pathways, as mentioned above. As is known to all, neurotransmitters are involved in the pathogenesis of mental illnesses. The association between SD and mental disorders may be related to gut microbiota.
The gut microbiota possesses the capacity to synthesize neurotransmitters, such as serotonin, dopamine, and γ-aminobutyric acid (GABA). In in vitro studies, the gut microbiota has been shown to synthesize precursors of neurotransmitters, such as tryptamine.43 These neurotransmitters have the potential to influence mental well-being through the gut-brain axis after they are released into the bloodstream. Modulation of neurotransmitter production represents a potential mechanism through which the gut microbiome could exert influence on the brain, thereby carrying significant implications for depression.44 Gut microbiota possesses the capacity to modulate the glutamate-glutamine-GABA cycle, thereby influencing neurochemistry and neurological function.45 In our study, Tax4Fun analysis revealed that gut microbial abundance relative to GABAergic and glutamatergic synapses decreased in rats after chronic SD. GABA is an important neurotransmitter with inhibitory effects on the mammalian central nervous system, lacking of which in vivo will make human evoke negative emotions such as anxiety, restlessness, fatigue, and worry. Glutamic acid, the predominant and efficacious excitatory neurotransmitter within the central nervous system, is involved in the proliferation, development, survival, and death of both neurons and glial cells. However, the present study suggests that chronic SD reduces gut microbiota related to these pathways. It is uncertain how these pathways are regulated by gut microbiota after SD as yet.
The present findings were largely consistent with previous studies, although certain discrepancies emerged, such as inconsistent alterations in the abundance of specific strains across different investigations. The present study is subject to several limitations. First, relevant stress-induced confounding factors potentially arising from the use of the SD method (MMPM) in this study should be minimized to the greatest extent possible. Moreover, the histological analysis of the rats’ brain was not conducted; thus, the impact of the significantly distinct microbiota observed after SD on mental illnesses remains unknown in this study. Thirdly, further validation through repeated experiments is warranted to confirm Firmicutes phylum, as well as the genera Romboutsia and Enterococcus, as reliable biomarkers for SD. In the future, it is imperative to undertake the following research endeavors. The relationship between specific changes in gut microbiota after SD and mental disorders needs to be determined by assessing animal behavioral performance, conducting histological analysis of rats’ brains, and comparing results between male and female subjects. It is necessary to verify Firmicutes phylum and the genera Romboutsia and Enterococcus as biomarkers for SD in human subjects. The GABAergic and glutamatergic pathways, through which alterations in gut microbiota may exert an impact on mental health, warrant further investigation both in vitro and in vivo utilizing agonists and antagonists.
Conclusion
In conclusion, our study has demonstrated that chronic sleep deprivation induces substantial modifications in the composition of the gut microbiota. The F/B ratio increased after the SD. We speculate that Firmicutes phylum, along with Romboutsia and Enterococcus genera, may serve as potential biomarkers and therapeutic targets for SD. The microbial abundance of the functional pathways of GABAergic and glutamatergic synapses was lower after SD, which may be correlated with mental disorders. Further researches are necessary to investigate the chronological and causal connections among SD, the gut microbiota and mental disorders, as well as to assess the feasibility of utilizing the microbiota as biomarkers.
Acknowledgments
This work was supported by the Department of Psychology and Sleep Medicine of Guangdong Provincial Hospital of Chinese Medicine, and funded by the National Natural Science Foundation of China (Grant Number 81804062).
Disclosure
The authors declare no conflicts of interest in this work.
References
1. QuickStats. Percentage* of currently employed adults aged ≥18 years who reported an average of ≤6 hours of sleep† per 24-hour period, by employment category§ - national health interview survey, United States, 2008-2009 and 2017-2018¶. MMWR Morb Mortal Wkly Rep. 2020;69(16):504. doi:10.15585/mmwr.mm6916a5.
2. Sandoval Y, Lobo AS, Somers VK, et al. Sleep deprivation in interventional cardiology: implications for patient care and physician-health. Catheter Cardiovasc Interv. 2018;91(5):905–910. doi:10.1002/ccd.27185
3. Koopman M, El Aidy S. MIDtrauma consortium. Depressed gut? The microbiota-diet-inflammation trialogue in depression. Curr Opin Psychiatry. 2017;30(5):369–377. doi:10.1097/YCO.0000000000000350
4. Sylvia KE, Demas GE. A gut feeling: microbiome-brain-immune interactions modulate social and affective behaviors. Horm Behav. 2018;99:41–49. doi:10.1016/j.yhbeh.2018.02.001
5. Waclawiková B, El Aidy S. Role of microbiota and tryptophan metabolites in the remote effect of intestinal inflammation on brain and depression. Pharmaceuticals (Basel). 2018;11(3):63. doi:10.3390/ph11030063
6. Warner BB. The contribution of the gut microbiome to neurodevelopment and neuropsychiatric disorders. Pediatr Res. 2019;85(2):216–224. doi:10.1038/s41390-018-0191-9
7. Poroyko VA, Carreras A, Khalyfa A, et al. Chronic sleep disruption alters gut microbiota, induces systemic and adipose tissue inflammation and insulin resistance in mice. Sci Rep. 2016;6(1):35405. doi:10.1038/srep35405
8. Anderson JR, Carroll I, Azcarate-Peril MA, et al. A preliminary examination of gut microbiota, sleep, and cognitive flexibility in healthy older adults. Sleep Med. 2017;38:104–107. doi:10.1016/j.sleep.2017.07.018
9. El Aidy S, Bolsius YG, Raven F, Havekes R. A brief period of sleep deprivation leads to subtle changes in mouse gut microbiota. J Sleep Res. 2020;29(6):e12920. doi:10.1111/jsr.12920
10. Zhang SL, Bai L, Goel N, et al. Human and rat gut microbiome composition is maintained following sleep restriction. Proc Natl Acad Sci U S A. 2017;114(8):E1564–E1571. doi:10.1073/pnas.1620673114
11. Zhu H, Zhao H, Qian H, Liu C. Urolithin A ameliorates athletic ability and intestinal microbiota in sleep deprivation from the perspective of the gut-muscle axis. Mol Nutr Food Res. 2024;68(7):e2300599. doi:10.1002/mnfr.202300599
12. Wang Z, Yuan K, Ji YB, et al. Alterations of the gut microbiota in response to total sleep deprivation and recovery sleep in rats. Nat Sci Sleep. 2022;14:121–133. doi:10.2147/NSS.S334985
13. Wang X, Li Y, Wang X, et al. Faecalibacterium prausnitzii supplementation prevents intestinal barrier injury and gut microflora dysbiosis induced by sleep deprivation. Nutrients. 2024;16(8):1100. doi:10.3390/nu16081100
14. Zhao N, Chen X, Chen QG, et al. NLRP3-mediated autophagy dysfunction links gut microbiota dysbiosis to tau pathology in chronic sleep deprivation. Zool Res. 2024;45(4):857–874. doi:10.24272/j.issn.2095-8137.2024.085
15. Zhang Y, He Y, Yuan L, et al. Multi-omics revealed anti-fatigue property of polyphenol from areca nut.Phytomedicine.2024.doi:10.1016/j.phymed.2024.155838
16. Yan J, Zhang X, Zhu K, et al. Sleep deprivation causes gut dysbiosis impacting on systemic metabolomics leading to premature ovarian insufficiency in adolescent mice. Theranostics. 2024;14(9):3760–3776. doi:10.7150/thno.95197
17. Yin C, Zhang M, Jin S, et al. Mechanism of salvia miltiorrhiza bunge extract to alleviate chronic sleep deprivation-induced cognitive dysfunction in rats. Phytomedicine. 2024;130:155725. doi:10.1016/j.phymed.2024.155725
18. Zhang N, Gao X, Li D, et al. Sleep deprivation-induced anxiety-like behaviors are associated with alterations in the gut microbiota and metabolites. Microbiol Spectr. 2024;12(4):e0143723. doi:10.1128/spectrum.01437-23
19. Li B, Hsieh YR, Lai WD, et al. Melatonin ameliorates neuropsychiatric behaviors, gut microbiome, and microbiota-derived metabolites in rats with chronic sleep deprivation. Int J Mol Sci. 2023;24(23):16820. doi:10.3390/ijms242316820
20. Lai WD, Tung TH, Teng CY, et al. Fish oil ameliorates neuropsychiatric behaviors and gut dysbiosis by elevating selected microbiota-derived metabolites and tissue tight junctions in rats under chronic sleep deprivation. Food Funct. 2022;13(5):2662–2680. doi:10.1039/d2fo00181k
21. Gunawan SP, Huang SY, Wang CC, et al. Sleep deprivation alters pubertal timing in humans and rats: the role of the gut microbiome. Sleep. 2024;47(2):zsad308. doi:10.1093/sleep/zsad308
22. Ma W, Song J, Wang H, et al. Chronic paradoxical sleep deprivation-induced depression-like behavior, energy metabolism and microbial changes in rats. Life Sci. 2019;225:88–97. doi:10.1016/j.lfs.2019.04.006
23. Coenen AM, Van Hulzen ZJ. Paradoxical sleep deprivation in animal studies: some methodological considerations. Prog Brain Res. 1980;53:325–330. doi:10.1016/S0079-6123(08)60072-2
24. Machado RB, Hipólide DC, Benedito-Silva AA, Tufik S. Sleep deprivation induced by the modified multiple platform technique: quantification of sleep loss and recovery. Brain Res. 2004;1004(1–2):45–51. doi:10.1016/j.brainres.2004.01.019
25. Rashnaei N, Akhavan Sepahi A, Siadat SD, Shahsavand-Ananloo E, Bahramali G. Characterization of gut microbiota profile in Iranian patients with bipolar disorder compared to healthy controls. Front Cell Infect Microbiol. 2023;13:1233687. doi:10.3389/fcimb.2023.1233687
26. De Angelis M, Piccolo M, Vannini L, et al. Fecal microbiota and metabolome of children with autism and pervasive developmental disorder not otherwise specified. PLoS One. 2013;8(10):e76993. doi:10.1371/journal.pone.0076993
27. Yang Y, Yu X, Liu X, et al. Altered fecal microbiota composition in individuals who abuse methamphetamine. Sci Rep. 2021;11(1):18178. doi:10.1038/s41598-021-97548-1
28. Dong Z, Shen X, Hao Y, et al. Gut microbiome: a potential indicator for differential diagnosis of major depressive disorder and general anxiety disorder. Front Psychiatry. 2021;12:651536. doi:10.3389/fpsyt.2021.651536
29. Hemmings SMJ, Malan-Müller S, van den Heuvel LL, et al. The microbiome in posttraumatic stress disorder and trauma-exposed controls: an exploratory study. Psychosom Med. 2017;79(8):936–946. doi:10.1097/PSY.0000000000000512
30. Xiong RG, Li J, Cheng J, et al. The role of gut microbiota in anxiety, depression, and other mental disorders as well as the protective effects of dietary components. Nutrients. 2023;15(14):3258. doi:10.3390/nu15143258
31. Amin N, Liu J, Bonnechere B, et al. Interplay of metabolome and gut microbiome in individuals with major depressive disorder vs control individuals. JAMA Psychiatry. 2023;80(6):597–609. doi:10.1001/jamapsychiatry.2023.0685
32. Lin P, Ding B, Feng C, et al. Prevotella and Klebsiella proportions in fecal microbial communities are potential characteristic parameters for patients with major depressive disorder. J Affect Disord. 2017;207:300–304. doi:10.1016/j.jad.2016.09.051
33. Stojanov S, Berlec A, Štrukelj B. The influence of probiotics on the firmicutes/bacteroidetes ratio in the treatment of obesity and inflammatory bowel disease. Microorganisms. 2020;8(11):1715. doi:10.3390/microorganisms8111715
34. Nguyen TQ, Martínez-álvaro M, Lima J, et al. Identification of intestinal and fecal microbial biomarkers using a porcine social stress model. Front Microbiol. 2023;14:1197371. doi:10.3389/fmicb.2023.1197371
35. Qu Z, Wu S, Zheng Y, et al. Fecal metabolomics combined with metagenomics sequencing to analyze the antidepressant mechanism of Yueju Wan. J Pharm Biomed Anal. 2024;238:115807. doi:10.1016/j.jpba.2023.115807
36. Zhu F, Ju Y, Wang W, et al. Metagenome-wide association of gut microbiome features for schizophrenia. Nat Commun. 2020;11(1):1612. doi:10.1038/s41467-020-15457-9
37. González-Arancibia C, Urrutia-Piñones J, Illanes-González J, et al. Do your gut microbes affect your brain dopamine? Psychopharmacology. 2019;236(5):1611–1622. doi:10.1007/s00213-019-05265-5
38. Hamamah S, Aghazarian A, Nazaryan A, Hajnal A, Covasa M. Role of microbiota-gut-brain axis in regulating dopaminergic signaling. Biomedicines. 2022;10(2):436. doi:10.3390/biomedicines10020436
39. McGaughey KD, Yilmaz-Swenson T, Elsayed NM, et al. Relative abundance of Akkermansia spp. and other bacterial phylotypes correlates with anxiety- and depressive-like behavior following social defeat in mice. Sci Rep. 2019;9(1):3281. doi:10.1038/s41598-019-40140-5
40. Park YS, Kim SH, Park JW, et al. Melatonin in the colon modulates intestinal microbiota in response to stress and sleep deprivation. Intest Res. 2020;18(3):325–336. doi:10.5217/ir.2019.00093
41. Ding Y, Bu F, Chen T, et al. A next-generation probiotic: akkermansia muciniphila ameliorates chronic stress-induced depressive-like behavior in mice by regulating gut microbiota and metabolites. Appl Microbiol Biotechnol. 2021;105(21–22):8411–8426. doi:10.1007/s00253-021-11622-2
42. Cheng R, Xu W, Wang J, Tang Z, Zhang M. The outer membrane protein Amuc_1100 of Akkermansia muciniphila alleviates the depression-like behavior of depressed mice induced by chronic stress. Biochem Biophys Res Commun. 2021;566:170–176. doi:10.1016/j.bbrc.2021.06.018
43. Williams BB, Van Benschoten AH, Cimermancic P, et al. Discovery and characterization of gut microbiota decarboxylases that can produce the neurotransmitter tryptamine. Cell Host Microbe. 2014;16(4):495–503. doi:10.1016/j.chom.2014.09.001
44. Cheung SG, Goldenthal AR, Uhlemann AC, Mann JJ, Miller JM, Sublette ME. Systematic review of gut microbiota and major depression. Front Psychiatry. 2019;10:34. doi:10.3389/fpsyt.2019.00034
45. Zheng P, Zeng B, Liu M, et al. The gut microbiome from patients with schizophrenia modulates the glutamate-glutamine-GABA cycle and schizophrenia-relevant behaviors in mice [published correction appears in Sci Adv. 2019 Jun 21;5(6):eaay2759]. Sci Adv. 2019;5(2):eaau8317. doi:10.1126/sciadv.aau8317
 © 2024 The Author(s). This work is published and licensed by Dove Medical Press Limited. The
full terms of this license are available at https://www.dovepress.com/terms.php
and incorporate the Creative Commons Attribution
- Non Commercial (unported, 3.0) License.
By accessing the work you hereby accept the Terms. Non-commercial uses of the work are permitted
without any further permission from Dove Medical Press Limited, provided the work is properly
attributed. For permission for commercial use of this work, please see paragraphs 4.2 and 5 of our Terms.
© 2024 The Author(s). This work is published and licensed by Dove Medical Press Limited. The
full terms of this license are available at https://www.dovepress.com/terms.php
and incorporate the Creative Commons Attribution
- Non Commercial (unported, 3.0) License.
By accessing the work you hereby accept the Terms. Non-commercial uses of the work are permitted
without any further permission from Dove Medical Press Limited, provided the work is properly
attributed. For permission for commercial use of this work, please see paragraphs 4.2 and 5 of our Terms.