")
Back to Journals » Journal of Inflammation Research » Volume 17
Multi-Omics Exploration of the Role of PTGS2 as a Hub Gene in Ferroptosis Within the Artery of Takayasu Arteritis
Authors Gao Q, Gao S, Li H, Chen Z, Zhang R, Li Y, Zhang H
Received 15 May 2024
Accepted for publication 2 November 2024
Published 19 November 2024 Volume 2024:17 Pages 9135—9146
DOI https://doi.org/10.2147/JIR.S478413
Checked for plagiarism Yes
Review by Single anonymous peer review
Peer reviewer comments 2
Editor who approved publication: Professor Ning Quan
Qing Gao,1,* Shang Gao,2,3,* Haiyang Li,1,* Zuoguan Chen,2 Ran Zhang,2 Yongjun Li,2 Hongjia Zhang1
1Department of Cardiovascular Surgery, Beijing Anzhen Hospital, Capital Medical University, Beijing, People’s Republic of China; 2Department of Vascular Surgery, Beijing Hospital, National Center of Gerontology, Institute of Geriatric Medicine, Chinese Academy of Medical Sciences, Beijing, People’s Republic of China; 3Graduate School of Peking Union Medical College, Chinese Academy of Medical Sciences, Beijing, People’s Republic of China
*These authors contributed equally to this work
Correspondence: Yongjun Li; Hongjia Zhang, Email [email protected]; [email protected]
Introduction: Takayasu arteritis (TAK) is an autoimmune disease affecting the aorta and its branches. Despite anti-inflammatory treatments, some patients require surgical vascular reconstruction due to rapid disease progression. The mechanisms behind persistent inflammation are unclear due to a lack of arterial samples. This study explores ferroptosis in TAK using high-throughput and single-cell transcriptomics.
Methods: Transcriptomic data were collected from 8 TAK patients (2 for single cell RNA-seq and 6 for bulk RNA-seq) and 8 renal transplant donors, with single-cell data from 3 public carotid artery samples for control. Bioinformatic analysis was performed to identify ferroptosis-related genes in inflamed arteries.
Results: We identified 1526 differentially expressed genes and 46 ferroptosis-related genes, with 6 genes including PTGS2 and HIF1A as hub genes. Single-cell analysis of 27,828 cells revealed increased M1-like macrophages, with PTGS2 highly expressed in these cells. Enrichment analysis indicated NF-κB signal pathway involvement.
Conclusion: PTGS2 is a core ferroptosis-related gene in TAK vascular inflammation, highly expressed in M1-like macrophages, potentially upregulated via the IL1B-NF-κB pathway.
Keywords: Takayasu arteritis, single-cell RNA sequencing, bulk RNA sequencing, ferroptosis, PTGS2
Introduction
Takayasu arteritis (TAK) is an autoimmune disease that affects the aorta and its primary and secondary branches. It predominantly occurs in young women from East Asia and Caucasus, and is characterized by large artery stenosis or aneurysmal dilation and target organ ischemia.1 Despite the use of existing anti-inflammatory and symptomatic treatments, approximately 20% of patients experience rapid progression and require surgical vascular reconstruction. Post-surgical intervention, the average arterial patency time is maintained at 6 to 12 months, and long-term follow-up reveals that about 17.5% of patients develop complications.2 Mechanistic studies have confirmed the role of CD4+ T cells and various signaling pathways, such as IL-6, in inducing autoimmune responses in TAK development.3,4 However, due to the lack of inflamed vascular samples, the reasons for continued vascular wall inflammation after anti-inflammatory treatment remain unclear, posing a challenge for clinical management.
Ferroptosis, a newly identified form of programmed cell death induced by ferrous ions, involves the depletion of glutathione and related synthetic enzymes, and the accumulation of lipid peroxides. It plays a significant regulatory role in the development of many chronic inflammatory diseases.5 Studies have identified ferroptosis-related targets in human coronary arteries, which can serve as biomarkers for the severity of atherosclerosis.6,7 Other studies have found that ferroptosis is crucial in cell remodeling and fibrosis following myocardial ischemia. Specifically, overexpression of PTGS2 (prostaglandin endoperoxide synthase 2) can cause lipid metabolism abnormalities and oxidative stress. In the study of ferroptosis, PTGS2 is often used as a marker to characterize ferroptosis.8 Given that TAK is a chronic vascular inflammatory disease, ferroptosis characterized by PTGS2 may play an important role in the chronic inflammatory processes of the vascular wall in TAK.9
In recent years, the development of bulk transcriptomics sequencing (bulk RNA-seq) and single-cell transcriptomics sequencing (scRNA-seq) has provided new avenues for exploring the mechanisms of TAK. With the help of the BeTA biobank established by our team,10 this study aims to use multi-transcriptomics to deeply analyze the vascular wall environment in TAK and explore the potential significance of ferroptosis in the inflammatory vascular lesions of TAK.
Method
Study Project
Transcriptomic data were collected from 6 TAK patients who underwent abdominal aorta to renal artery bypass graft surgery at Beijing Hospital between August 2018 and December 2021. As a control, we collected 8 healthy control samples of abdominal aorta from during the kidney transplant surgery in the urology department of Beijing Hospital. All sample collection processes have no impact on the medical treatment. All organs were donated voluntarily, and the organ donation process complies with the requirements of the Istanbul Declaration. This study was approved by the Ethics Committee of Beijing Hospital (2018BJYYEC-030-01), all organ donors and TAK patients have voluntarily signed written informed consent forms.11 The raw sequence data reported in this paper have been deposited in the Genome Sequence Archive (Genomics, Proteomics & Bioinformatics 2021) in National Genomics Data Center (Nucleic Acids Res 2022), China National Center for Bioinformation / Beijing Institute of Genomics, Chinese Academy of Sciences (GSA-Human: HRA003348) that are publicly accessible at https://ngdc.cncb.ac.cn/gsa-human.12
Single-cell sequencing samples were collected from two pathological abdominal aorta samples from TAK patients undergoing abdominal aorta-renal artery bypass surgery at Beijing Hospital between October 2019 and May 2020. This study was approved by the Ethics Committee of Beijing Hospital (Ethics Approval Number: 2018BJYYEC-030001), with informed consent obtained from both patients. The data reported in this paper have been deposited in the OMIX, China National Center for Bioinformation / Beijing Institute of Genomics, Chinese Academy of Sciences (https://ngdc.cncb.ac.cn/omix: accession no.OMI006324).13 Control sc RNA-seq data (GSE159677) were downloaded from the GEO database (http://www.ncbi.nlm.nih.gov/geo/) and generated from the GPL18573 platform. We selected three peri-carotid plaque artery samples as controls to identify differences at the single-cell level between the vascular walls of TAK and relatively normal artery.
All included patients’ clinical characteristics, laboratory results, and imaging findings met the 1990 American College of Rheumatology criteria for the diagnosis and surgical treatment of TAK.14 The entire study complies with the requirements of the Helsinki Declaration.
Sc RNA-Seq Process
Abdominal aorta samples were enzymatically digested using a composite digestion solution containing collagenase, hyaluronidase, and DNase. Single-cell suspensions with over 80% cell viability and more than 10,000 total cells were used for subsequent sc RNA-seq library construction. The single-cell suspensions were resuspended to a concentration of 1000 cells/μL. Single-cell capture and library construction were performed using the BD Rhapsody Single-Cell Analysis System. Qualified libraries were sequenced on the NovaSeq 6000 platform, with an average sequencing depth of 100G per sample for the transcriptome library.
Bulk-RNA Sequencing Analysis Methods
Principal Component Analysis (PCA) was used for dimensionality reduction and visualization of the data samples. The R package “DESeq2” was employed for probe summarization and background correction of the bulk-seq gene expression matrix, and to calculate differentially expressed genes between TAK samples and normal control samples. Differentially expressed genes related to ferroptosis were visualized using heatmaps.
The latest KEGG Pathway gene annotations were obtained using the KEGG rest API (https://www.kegg.jp/kegg/rest/keggapi.html).15 Enrichment analysis was performed using the R package clusterProfiler (version 3.14.3) to obtain gene set enrichment results.
Cytoscape software was used to visualize and predict core genes from the PPI network formed by the STRING database (http://string-db.org/). The top 10 genes with the highest correlations were calculated using four algorithms (MCC, MNC, Degree, EPC), and the intersection of these genes was taken to export and visualize the hub genes.
Single-Cell Sequencing Analysis
Quality control, preprocessing, and data analysis of the single-cell expression matrix were conducted using the R package Seurat (version 4.5.0)16 based on R (version 4.2.1). The quality control criteria were set as follows: (1) genes must be expressed in at least three cells; (2) each cell must contain between 200 to 3000 unique molecular identifiers (UMIs); (3) the percentage of mitochondrial gene expression must be less than 25% of total mRNA in each cell.
PCA was used to determine the cell clusters included in the dimensionality reduction. The Harmony method was employed to integrate multiple samples and reduce potential batch effects.17 Unsupervised cell clustering was performed using the UMAP method built into Seurat. The FindAllMarkers function was used to identify and label differentially expressed genes in each cluster and specific cell subclusters. The FindMarkers function was used to identify differentially expressed genes between TAK samples and control samples. Cell differentiation trajectories were reconstructed using Monocle2.18
Result
Clinical Baseline Data
A total of 6 samples were collected for bulk-RNA, the clinical baseline information can be found in the previous study,11 and the single-cell sequencing baseline table is shown below. Two patients underwent abdominal aortic renal artery bypass grafting and ascending aorta abdominal aortic bypass grafting, respectively (Table 1).
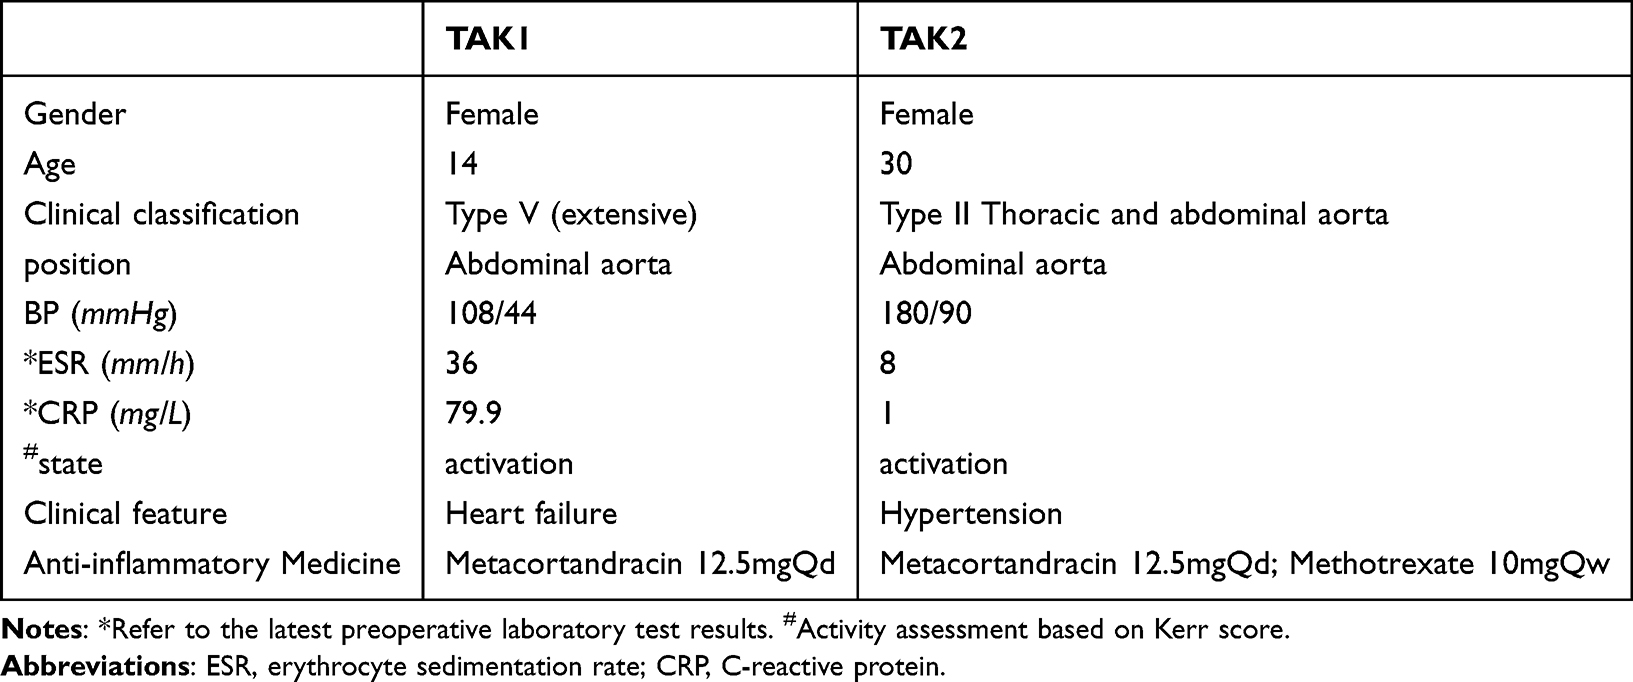 |
Table 1 Clinical Baseline Information of Patients Corresponding to Single-Cell Sequencing Samples |
Exploration of Ferroptosis-Related Hub Genes in Bulk-RNA Data
PCA results demonstrated distinct distribution regions and characteristic differences between Takayasu arteritis vascular wall samples and control vessels (Figure 1A). Differentially expressed genes (DEGs) were identified in the transcriptome matrix using criteria of p<0.05 and |LogFC|>1, resulting in a total of 1526 differentially expressed genes, which are displayed in a volcano plot (Figure 1B). Further intersection of these differentially expressed genes with the ferroptosis gene database yielded 46 ferroptosis-related DEGs (Figure 1C), visualized in a heatmap (Figure 1D). KEGG pathway analysis of these genes revealed significant enrichment in ferroptosis signaling pathways, as well as classical inflammatory pathways such as the NOD-like receptor pathway, MAPK pathway, TNF pathway, and HIF1A pathway (Figure 1E).
 |
Figure 1 (A) PCA analysis results of TA and Donor groups; (B) Volcano plot displaying differential expressed genes. 1526 DEGs were significantly differently (p < 0.05 and Log2FC > 1) expressed between the TA and Donor group. (C and D) The Venn diagram shows the intersection of the ferroptosis database and DEGs, identifying a total of 46 genes, and these genes are displayed in a heatmap. (E) KEGG enrichment analysis of DEGs. Ferroptosis, MAPK, HIF1A signal pathways were enriched. (F) Construction and analysis of protein-protein interaction (PPI) networks. (G) Construct the PPI network of DEGs using STRING online database and utilize Cytoscape software for analysis. MCC, MNC, EPC, Degree was used to identify the hub genes and Six hub genes (PTGS2, JUN, IL6, HIF1A, TLR4, NQO1) were by merging using Venn diagrams. (H) Hub genes were visualized by heatmap. |
The PPI network showed protein interactions among the ferroptosis-related differentially expressed genes (Figure 1F). Using four algorithms (MCC, MNC, Degree, EPC) in Cytoscape, we identified the top ten potential core genes, and their intersection yielded 6 hub genes: PTGS2, HIF1A, TLR4, IL6, JUN, and NQO1 (Figure 1G), which were visualized in a heatmap (Figure 1H).
scRNA-Seq Quality Control
Abdominal artery was obtained from 2 patients with TAK, and 3 peri-carotid plaque artery samples were used as controls (Figure 1A). A total of 27,828 qualified cells were obtained for further analysis. Seurat pocket was used for quality control and merging, and the Harmony method was employed to remove batch effects, providing an initial estimate of cell composition for each tissue sample. PA and TA were used to represent control samples and TAK samples, respectively, forming the basis for unsupervised clustering analysis of arterial wall cells, resulting in 14 clusters (Figure 1B).
Dimensionality Reduction and Annotation of the scRNA-Seq from Arteries
After examining marker genes in each cluster, we merged clusters with similar gene expression profiles, resulting in 10 major cell types, which were projected onto a UMAP plot (Figure 1C). The ten major cell types included monomacroDC (the cell cluster mixed with monocyte, macrophage and Dendritic cell), NK/T cells, B cells, plasma cells, endothelial cells, smooth muscle cells, fibroblasts, Mast cells, endothelial cells, and highly proliferative cells. The corresponding cell clusters were visualized in UMAP plots and heatmaps (Figure 2). When examining the tissue origin of each cell type, we found that the TA group contributed more fibroblasts and monomacroDC (Figure 1F), indicating enhanced chronic inflammation and potential vascular wall fibrosis in TAK.
 |
Figure 2 (A) Experimental approach strategy. (B) Data analysis strategy, UMAP plot of single-cell dimensionality reduction and initial clustering (C) A Umap plot showing all cells colored according to the 9 major cell types, and 1 cell type cannot be clarified. (D) Relative expression of several marker genes in all cells from all samples. Cells were projected onto a Umap plot. (E) The mean expression of selected genes in the major cell types. (F) The composition of each cell type is shown in the horizontal bar plot. Abbreviations: SMC, smooth muscle cell; EC, endothelial cell; MonoMacroDC, monocyte/macrophage/dendritic cell; NK/T cell, natural killer/T cell. |
Dimensionality Reduction and Annotation of monomacroDC Sub-Clusters
We extracted the clusters annotated as monomacroDC and performed unsupervised clustering analysis, resulting in 14 sub-clusters. These were annotated based on specific gene expression profiles, resulting in 10 major cell types, which were renamed and projected onto a UMAP plot (Figure 3D). The subpopulations were first classified into M1-like cluster (high IL1B expression), M2-like subpopulations (high MRC1 expression), and other groups (low expression of both IL1B and MRC1) based on MRC1 and IL1B expression levels.
 |
Figure 3 (A) the differences in ferroptosis hub genes expression between the PA and TA groups. (B) The expression proportion and levels of ferroptosis hub genes across different cell clusters. (C) Data analysis strategy of the MonomarcoDC, UMAP plot of single-cell dimensionality reduction and initial clustering. (D) A umap plot of all macrophage-like cells colored according to cluster. (E) Relative expression of IL1B and MRC1 in MonomarcoDC projected onto a Umap plot. (F) The mean expression of selected genes in the major group of MonomarcoDC. (G) Mean expression of selected genes in monocyte, DC, and macrophage clusters. ***Indicate significant differences (P < 0.05). |
M1 like1 subpopulation exhibited high expression of EREG, VCAN, and AREG, genes related to tissue repair and extracellular matrix secretion, indicating a potential tissue repair function. M1 like2 subpopulation showed high expression of antigen-presenting genes such as FCER1A, HLA-DQA1, and CD1C, suggesting an antigen-presenting function. M1 like3 subpopulation expressed high levels of inflammatory cytokine TNF, indicating a strong inflammatory function. M1 like4 had high expression of ferritin pseudogenes, suggesting apoptotic cells.
M2 like1 expressed high levels of inflammatory cytokines and chemokines such as CCL4, CCL3, TNF, and TXNIP, indicating a function in attracting inflammatory cells and promoting inflammation progression, different from conventional M2. M2-like2 expressed LYVE1 in addition to chemokines, suggesting these may be resident macrophages in artery. M Proliferating marked by TOP2A and MKI67, and a sub- cluster named M apoptosis associated with apoptosis marked by TNFSF10 were also identified. DC cells were annotated using CLEC9A as a marker.
Pseudotime Analysis
Single-cell dimensionality reduction analysis provided insights into the heterogeneity between TAK arteries and control tissues as well as the cell composition within the arterial wall. Additionally, we studied the differentiation trajectory of monomacroDC. Pseudotime ordering arranged most cells into a primary trajectory, with a path from left to right and three branching points (Figure 4D, upper left). Macrophages from TA were mainly distributed on the right side, while those from PA were on the left side (Figure 4D, lower left). M1-like were mainly located to the right of node 2 (marked by IL1B), and M2-like were primarily to the left of node 2. Coloring by cell types revealed that M1-like1 cells were mainly to the right of branch node 1, and M1-like 2 subpopulations were primarily to the left of branch node 1. Thus, we suggest that branch node 1 may be related to the differentiation of M1 towards tissue remodeling, with these cells showing a higher degree of differentiation relative to normal artery, potentially linked to inflammation progression in TA.
 |
Figure 4 (A) The expression proportion and levels of ferroptosis hub genes across the macrophage like cells. (B) The differences genes of ferroptosis hub genes (p < 0.05, Log2FC > 1, PC1-PC2 > 0.2). (C) KEGG enrichment analysis of DEGs between PA and TA group. NF-κB, MAPK, TNF signal pathway were enriched. (D) The trajectory was constructed using the unsupervised Monocle2 algorithm. The trajectory were colored by pseudotime, cell type, PA or TA, and the expression levels of PTGS2. (E)The trajectory were colored IL1B and MRC1, and PTGS2 and IL1B were represented using scatter plots, the black line in the middle represents the average expression level. (F) KEGG enrichment analysis of the DEGs before and after branch point 1, NF-κB, MAPK, TNF signal pathway were enriched. (G) PTGS2 and IL1B were represented using scatter plots, the black line represent the average expression level of the branches. |
Ferroptosis-Related Gene Analysis in scRNA-Seq
Using methods within the Seurat package, we visualized the expression of ferroptosis core genes identified in the transcriptome study in the single-cell omics data of arterial walls. We randomly selected 1000 cells from both PA and TA groups to display hub gene expression and calculated the significance of differences. The results showed significant differences in the expression of PTGS2, HIF1A, and IL6 (Figure 3A). Hub gene high expression states were localized within the monomacroDC (Figure 3B). Further localization within the monomacroDC revealed elevated PTGS2 expression in M1 like1 cells (Figure 4A).
We then performed differential gene analysis between TA and PA within monomacroDC cluster, using criteria of p<0.05, |LogFC|>1, and PC1-PC2>0.2, identifying PTGS2 as the only potential marker gene of ferroptosis (Figure 4B). KEGG enrichment analysis of these DEGs with p < 0.05 and |LogFC|>1, revealed enrichment in classical inflammatory pathways, including NF-κB signal pathway, TNF signal pathway, and MAPK signal pathway, suggesting an intrinsic link between PTGS2-mediated ferroptosis and chronic inflammation (Figure 4C, Supplements 1 and 2).
Further examination of PTGS2 gene expression along the pseudotime trajectory indicated that PTGS2 was mainly expressed on the right side of node 1 and within the M1 like1. We took node 1 as a branching point and calculated differentially expressed genes before and after the branch using Monocle2 recommended cutoffs (q < 0.0001), visualizing IL1B and PTGS2 expression (Figure 4G). KEGG enrichment analysis of all differentially expressed genes showed similar enrichment in classical inflammatory pathways, including the MAPK signal pathway, NF-κB signal pathway, TNF signal pathway, and HIF1A signal pathway (Figure 4F, Supplement 3).
Discussion
Current research on the pathogenesis of TAK primarily focuses on peripheral blood. Studies have shown that serum or IgG antibodies from TAK patients can activate the mTORC1 signal pathway in endothelial cells in vitro,19,20 and elevated mTORC1 signal pathway expression has been observed in pro-inflammatory T cells in the peripheral blood of TAK patients.21 Another study found that TLR4 activation can lead to increased expression of IL-1β and IL-1R2 in peripheral blood cells of TA patients. Additionally, research has found activation of the JAK/STAT pathway in CD4+ and CD8+ T cells from TAK patients, leading to noticeable cell differentiation and proliferation and increased downstream pro-inflammatory cytokines.4,22 With advancing mechanistic research, various biologics such as IL-6R antagonists (tocilizumab) and JAK pathway antagonists (tofacitinib) have been used as second-line treatments for patients unresponsive to immunosuppressive therapy.23,24 However, the lack of studies on the function of different effector cells in artery after activation of inflammatory signaling pathways fails to explain the unique changes in the inflammatory vasculature of TAK. This gap makes it difficult to understand why vascular stenosis or dilation progresses despite the use of anti-inflammatory medicine.
PTGS2 (prostaglandin-endoperoxide synthase 2), also known as COX2, is a key enzyme in the cyclooxygenase family. It is induced in response to cellular stimuli and catalyzes the conversion of arachidonic acid into prostaglandins, affect cell membrane lipid oxidation and participate in chronic inflammatory reaction.25 In the context of chronic vascular inflammation, numerous studies have demonstrated that PTGS2-related ferroptosis plays an important role.26 The core process of ferroptosis is depletion of glutathione and lipid peroxidation, which often interact with chronic inflammation, leading to the release of DAMPs, oxidative stress, and secretion of inflammatory factors such as TNF - α and IL-6, promoting inflammation progression.27 Chronic inflammation induced oxidative stress and iron homeostasis imbalance increase the risk of iron death, driving more cells to undergo iron death and exacerbating inflammation progression.28 In the field of chronic vascular inflammation, previous studies focused on atherosclerosis. This process is characterized by a high lipid peroxidation state with COX2 activity, which concurrently enhances the secretion of inflammatory signaling molecules.29,30 Furthermore, studies have identified ferroptosis-related targets such as PTGS2, ACSL4, caspase-1, NLRP3, and GPX4 in human coronary artery specimens, correlating with the severity of coronary artery disease.6,7 Interestingly, other studies have found that COX2 activation in the vascular wall is accompanied by the activation of the classical inflammatory NF-κB signaling pathway, suggesting that the upregulation of PTGS2 may be closely associated with the NF-κB signaling pathway.31
In our study, unbiased transcriptome analysis first revealed high expression of ferroptosis-related genes in high-throughput transcriptome sequencing of TAK. We identified six genes including PTGS2, HIF1A, and IL6 as potential hub genes in the ferroptosis process. Subsequently, based on the scRNA-seq of the artery, we identified common cell types, finding that ferroptosis-related hub genes were primarily highly expressed in the monomaroDC cluster, which is significantly associated with chronic vascular inflammation. We identified 9 clusters with different functions based on monomaroDC expression profiles, with each cluster characterized by typical markers described in previous reports.32–34 However, we noted that classical markers were not entirely applicable to the dimensionality reduction results in TAK artery. In the M1-like cluster, the highest cell proportion was found in cells with tissue repair and antigen presentation functions, with over 80% of these cells originating from TAK. Interestingly, these cells were located at the end of the pseudotime trajectory, indicating ongoing differentiation and phenotypic transformation in the context of local chronic inflammation in TAK. This is associated with the transition of M1 macrophages to a tissue repair state in chronic inflammation, promoting fibroblast proliferation.35 In the M2 like cluster, cells not only expressed genes related to tissue repair but also a large number of chemokines, possibly recruiting inflammatory cells. These findings are closely related to late-stage inflammatory cell infiltration and fibrosis progression in TAK.36
Results of bulk RNA-seq and scRNA-seq demonstrated significant high expression of the ferroptosis hub gene PTGS2 in MonoMacroDC, particularly in M1 like1with high expression of tissue repair-related proteins. This suggests that ferroptosis marked by PTGS2 occurs in M1 macrophages marked by IL1B and AREG. Previous studies found that IL1B significantly increased COX-2 transcription in a dose-dependent manner in a mouse pulmonary artery model,37 consistent with our findings. Comparing macrophages from TAK arteries to relatively normal arteries, we found that differentially expressed genes were enriched in inflammatory pathways represented by NF-κB signal pathway. Further pseudotime branch node 1 differential expression analysis showed significant enrichment of the NF-κB signal pathway, corroborating previous research that found NF-κB-mediated macrophage activation closely related to pro-inflammatory genes, including PTGS2, in a mouse aneurysm model, and inhibiting NF-κB could alleviate inflammation.38 Additionally, multiple studies have confirmed that IL1B can activate the NF-κB pathway, leading to downstream inflammatory changes. Therefore, these results may suggest a potential link between PTGS2-mediated ferroptosis and the IL1B-NF-κB pathway.
This study has certain limitations. Firstly, this article conducted analysis based on the single-cell sequencing data of artery tissue, without prospective validation. The research results are correlation research and cannot provide a causal relationship. Secondly, the two samples mainly came from the abdominal aorta, and both were narrow lesions, with relatively insufficient sample size and pathological type. We will further expand sc RNA-seq data to comprehensively reflect the in situ inflammatory microenvironment status of artery, and use cell models for validation.
In conclusion, using bulk RNA-seq and sc RNA-seq methods, we explored the inflammatory vascular wall in TAK identifying a subset of M1-like macrophages with tissue repair and extracellular matrix secretion functions marked by IL1B. These cells showed a ferroptosis state characterized by PTGS2, possibly due to IL1B-mediated NF-κB activation, promoting inflammation progression. Despite our rigorous multi-omics bioinformatics analysis, further validation is needed. Future research should delve deeper into the ferroptosis state within the inflammatory vascular wall of TAK to find new solutions for controlling inflammation progression in arterial focal sites.
Funding
The manuscript was supported by the National Natural Science Foundation of China (NO. 82070483), Beijing Natural Science Foundation (NO. 7232037 & L232030), Clinical and translational medicine research project of the Chinese Academy of Medical Sciences (2023-I2M-C&T-B-115) and National High Level Hospital Clinical Research Funding Project (No. BJ-2018-089).
Disclosure
The authors report no conflicts of interest in this work.
References
1. Gudbrandsson B, Molberg Ø, Garen T, et al. Prevalence, incidence, and disease characteristics of Takayasu arteritis by ethnic background: data from a large, population-based cohort resident in Southern Norway. Arthritis Care Res. 2017;69(2):278–285. doi:10.1002/acr.22931
2. Joseph G, Thomson VS, Attumalil TV, et al. Outcomes of percutaneous intervention in patients with Takayasu arteritis. J Am Coll Cardiol. 2023;81(1):49–64. doi:10.1016/j.jacc.2022.10.024
3. Watanabe R, Hashimoto M. Perspectives of JAK inhibitors for large vessel vasculitis. Front Immunol. 2022;13:881705. doi:10.3389/fimmu.2022.881705
4. Desbois AC, Régnier P, Quiniou V, et al. Specific follicular helper t cell signature in Takayasu arteritis. Arthritis Rheumatol. 2021;73(7):1233–1243. doi:10.1002/art.41672
5. Yagoda N, Von Rechenberg M, Zaganjor E, et al. RAS-RAF-MEK-dependent oxidative cell death involving voltage-dependent anion channels. Nature. 2007;447(7146):864–868. doi:10.1038/nature05859
6. Zhou Y, Zhou H, Hua L, et al. Verification of ferroptosis and pyroptosis and identification of PTGS2 as the hub gene in human coronary artery atherosclerosis. Free Radic Biol Med. 2021;171:55–68. doi:10.1016/j.freeradbiomed.2021.05.009
7. Bai T, Li M, Liu Y, et al. Inhibition of ferroptosis alleviates atherosclerosis through attenuating lipid peroxidation and endothelial dysfunction in mouse aortic endothelial cell. Free Radic Biol Med. 2020;160:92–102. doi:10.1016/j.freeradbiomed.2020.07.026
8. Bao C, Liu C, Liu Q, et al. Liproxstatin-1 alleviates LPS/IL-13-induced bronchial epithelial cell injury and neutrophilic asthma in mice by inhibiting ferroptosis. Int Immunopharmacol. 2022;109:108770. doi:10.1016/j.intimp.2022.108770
9. Wang J, Deng B, Liu Q, et al. Pyroptosis and ferroptosis induced by mixed lineage kinase 3 (MLK3) signaling in cardiomyocytes are essential for myocardial fibrosis in response to pressure overload. Cell Death Dis. 2020;11(7):574. doi:10.1038/s41419-020-02777-3
10. Gao S, Wu Z-Y, Miao Y-Q, et al. Design and protocol for Beijing Hospital Takayasu Arteritis (BeTA) Biobank. J Clin Med. 2023;12(4):1516. doi:10.3390/jcm12041516
11. Yuqing M, Shang G, Qing G, et al. Transcriptome profiling of abdominal aortic tissues reveals alterations in mRNAs of Takayasu arteritis. Front Genet. 2022;13:1036233. doi:10.3389/fgene.2022.1036233
12. Chen T, Chen X, Zhang S, et al. The genome sequence archive family: toward explosive data growth and diverse data types. Genomics Proteomics Bioinf. 2021;19(4):578–583. doi:10.1016/j.gpb.2021.08.001
13. Bao Y, Zhang Z, Zhao W, et al. Database resources of the national genomics data center, China national center for bioinformation in 2024. Nucleic Acids Res. 2024;52(D1):D18–d32. doi:10.1093/nar/gkad1078
14. Arend WP, Michel BA, Bloch DA, et al. The American college of rheumatology 1990 criteria for the classification of Takayasu arteritis. Arthritis Rheum. 1990;33(8):1129–1134. doi:10.1002/art.1780330811
15. Kanehisa M, Goto S. KEGG: Kyoto encyclopedia of genes and genomes. Nucleic Acids Res. 2000;28(1):27–30. doi:10.1093/nar/28.1.27
16. Stuart T, Butler A, Hoffman P, et al. Comprehensive integration of single-cell data. Cell. 2019;177(7):1888–1902.e21. doi:10.1016/j.cell.2019.05.031
17. Korsunsky I, Millard N, Fan J, et al. Fast, sensitive and accurate integration of single-cell data with Harmony. Nat Methods. 2019;16(12):1289–1296. doi:10.1038/s41592-019-0619-0
18. Trapnell C, Cacchiarelli D, Grimsby J, et al. The dynamics and regulators of cell fate decisions are revealed by pseudotemporal ordering of single cells. Nat Biotechnol. 2014;32(4):381–386. doi:10.1038/nbt.2859
19. Maciejewski-Duval A, Comarmond C, Leroyer A, et al. mTOR pathway activation in large vessel vasculitis. J Autoimmun. 2018;94:99–109. doi:10.1016/j.jaut.2018.07.013
20. Hadjadj J, Canaud G, Mirault T, et al. mTOR pathway is activated in endothelial cells from patients with Takayasu arteritis and is modulated by serum immunoglobulin G. Rheumatology. 2018;57(6):1011–1020. doi:10.1093/rheumatology/key017
21. Zhang J, Zhao L, Wang J, et al. Targeting mechanistic target of rapamycin complex 1 restricts proinflammatory t cell differentiation and ameliorates Takayasu arteritis. Arthritis Rheumatol. 2020;72(2):303–315. doi:10.1002/art.41084
22. Régnier P, Le Joncour A, Maciejewski-Duval A, et al. Targeting JAK/STAT pathway in Takayasu’s arteritis. Ann Rheum Dis. 2020;79(7):951–959. doi:10.1136/annrheumdis-2019-216900
23. Hellmich B, Agueda A, Monti S, et al. 2018 Update of the EULAR recommendations for the management of large vessel vasculitis. Ann Rheum Dis. 2020;79(1):19–30. doi:10.1136/annrheumdis-2019-215672
24. Li J, Li M, Tian X, et al. Tofacitinib in patients with refractory Takayasu’s arteritis. Rheumatology. 2020;59(11):e95–e98. doi:10.1093/rheumatology/keaa281
25. FitzGerald GA. COX-2 in play at the AHA and the FDA. Trends Pharmacol Sci. 2007;28(7):303–307. doi:10.1016/j.tips.2007.05.007
26. Fang X, Ardehali H, Min J, et al. The molecular and metabolic landscape of iron and ferroptosis in cardiovascular disease. Nat Rev Cardiol. 2023;20(1):7–23. doi:10.1038/s41569-022-00735-4
27. Zhu G, Sui S, Shi F, et al. Inhibition of USP14 suppresses ferroptosis and inflammation in LPS-induced goat mammary epithelial cells through ubiquitylating the IL-6 protein. Hereditas. 2022;159(1):21. doi:10.1186/s41065-022-00235-y
28. Ji Q-X, Zeng F-Y, Zhou J, et al. Ferroptotic stress facilitates smooth muscle cell dedifferentiation in arterial remodelling by disrupting mitochondrial homeostasis. Cell Death Differ. 2023;30(2):457–474. doi:10.1038/s41418-022-01099-5
29. Yang WS, SriRamaratnam R, Welsch M, et al. Regulation of ferroptotic cancer cell death by GPX4. Cell. 2014;156(1–2):317–331. doi:10.1016/j.cell.2013.12.010
30. Araújo AC, Wheelock CE, Haeggström JZ. The eicosanoids, redox-regulated lipid mediators in immunometabolic disorders. Antioxid Redox Signal. 2018;29(3):275–296. doi:10.1089/ars.2017.7332
31. Tang SY, Monslow J, Todd L, et al. Cyclooxygenase-2 in endothelial and vascular smooth muscle cells restrains atherogenesis in hyperlipidemic mice. Circulation. 2014;129(17):1761–1769. doi:10.1161/CIRCULATIONAHA.113.007913
32. Depuydt MAC, Prange KHM, Slenders L, et al. Microanatomy of the human atherosclerotic plaque by single-cell transcriptomics. Circ Res. 2020;127(11):1437–1455. doi:10.1161/CIRCRESAHA.120.316770
33. Li Y, Ren P, Dawson A, et al. Single-cell transcriptome analysis reveals dynamic cell populations and differential gene expression patterns in control and aneurysmal human aortic tissue. Circulation. 2020;142(14):1374–1388. doi:10.1161/CIRCULATIONAHA.120.046528
34. Pan H, Xue C, Auerbach BJ, et al. Single-cell genomics reveals a novel cell state during smooth muscle cell phenotypic switching and potential therapeutic targets for atherosclerosis in mouse and human. Circulation. 2020;142(21):2060–2075. doi:10.1161/CIRCULATIONAHA.120.048378
35. Oishi Y, Manabe I. Macrophages in inflammation, repair and regeneration. Int Immunol. 2018;30(11):511–528. doi:10.1093/intimm/dxy054
36. Chen R, Sun Y, Cui X, et al. Autophagy promotes aortic adventitial fibrosis via the IL-6/Jak1 signaling pathway in Takayasu’s arteritis. J Autoimmun. 2019;99:39–47. doi:10.1016/j.jaut.2019.01.010
37. Itoh A, Nishihira J, Makita H, et al. Effects of IL-1beta, TNF-alpha, and macrophage migration inhibitory factor on prostacyclin synthesis in rat pulmonary artery smooth muscle cells. Respirology. 2003;8(4):467–472. doi:10.1046/j.1440-1843.2003.00491.x
38. Aoki T, Frȍsen J, Fukuda M, et al. Prostaglandin E2 –EP2–NF-κB signaling in macrophages as a potential therapeutic target for intracranial aneurysms. Sci Signal. 2017;10(465). doi:10.1126/scisignal.aah6037
 © 2024 The Author(s). This work is published and licensed by Dove Medical Press Limited. The
full terms of this license are available at https://www.dovepress.com/terms.php
and incorporate the Creative Commons Attribution
- Non Commercial (unported, 3.0) License.
By accessing the work you hereby accept the Terms. Non-commercial uses of the work are permitted
without any further permission from Dove Medical Press Limited, provided the work is properly
attributed. For permission for commercial use of this work, please see paragraphs 4.2 and 5 of our Terms.
© 2024 The Author(s). This work is published and licensed by Dove Medical Press Limited. The
full terms of this license are available at https://www.dovepress.com/terms.php
and incorporate the Creative Commons Attribution
- Non Commercial (unported, 3.0) License.
By accessing the work you hereby accept the Terms. Non-commercial uses of the work are permitted
without any further permission from Dove Medical Press Limited, provided the work is properly
attributed. For permission for commercial use of this work, please see paragraphs 4.2 and 5 of our Terms.