")
Back to Journals » International Journal of Nanomedicine » Volume 20
Multimodal Imaging of Brain Metastasis-Derived Extracellular Vesicles Using Superparamagnetic Iron Oxide Nanoparticle Labeling
Authors Feginn Berle B, Juliussen S , Castilho Á, Solel E , Sdik Saed H, Vanderpoorten O, Lunavat TR, Thorsen F, Rigg E
Received 20 February 2025
Accepted for publication 12 May 2025
Published 13 June 2025 Volume 2025:20 Pages 7501—7514
DOI https://doi.org/10.2147/IJN.S520791
Checked for plagiarism Yes
Review by Single anonymous peer review
Peer reviewer comments 2
Editor who approved publication: Professor Dong Wang
Birgitte Feginn Berle,1,* Sunniva Juliussen,1,* Áurea Castilho,1 Ege Solel,1 Halala Sdik Saed,1 Oliver Vanderpoorten,2 Taral R Lunavat,1 Frits Thorsen,1,3– 5 Emma Rigg1
1Department of Biomedicine, University of Bergen, Bergen, Norway; 2Department of Physics and Technology, UiT The Arctic University of Norway, Tromsø, Norway; 3Department of Neurosurgery, Haukeland University Hospital, Bergen, Norway; 4Molecular Imaging Center, Department of Biomedicine, University of Bergen, Bergen, Norway; 5Department of Neurosurgery, Qilu Hospital of Shandong University and Shandong Key Laboratory of Brain Health and Function Remodeling, Jinan, People’s Republic of China
*These authors contributed equally to this work
Correspondence: Emma Rigg; Frits Thorsen, Department of Biomedicine, University of Bergen, Jonas Lies vei 91, Bergen, 5009, Norway, Email [email protected]; [email protected]
Background: Extracellular vesicles (EVs) are crucial mediators in brain metastasis (BM), facilitating pre-metastatic niche formation and metastatic progression. However, tracking their distribution and interactions in vivo remains challenging.
Objective: To develop and validate a method for labeling BM-derived EVs using superparamagnetic iron oxide nanoparticles (SPIONs) that enables their visualization and tracking through magnetic resonance imaging (MRI).
Methods: Three SPION variants with different coatings and sizes were evaluated using two patient-derived BM cell lines. The labeled EVs were characterized using transmission electron microscopy (TEM), colorimetric iron assays, dynamic light scattering and nanoparticle tracking analysis (NTA) in Nanospacer devices. The functionality and visualization of SPION-labeled EVs were assessed in fetal rat brain organoids (FRBOs) using Prussian blue staining, TEM, and MRI. Detection sensitivity was determined using agar phantoms, and in vivo tracking was validated through intramuscular injections in mice.
Results: Uncoated 5 nm SPIONs demonstrated superior labeling efficiency, successfully marking over 90% of cells within 24 hours without significantly affecting cell growth. These SPIONs were effectively incorporated into BM-derived EVs while maintaining their original size distribution. The labeled EVs were successfully internalized by FRBOs and could be visualized using multiple imaging modalities. Agar phantom studies revealed significant changes in T2 and T2* relaxation times, which was further confirmed through in vivo MRI following intramuscular injections.
Conclusion: This study establishes a reliable protocol for labeling BM-derived EVs with SPIONs, enabling their visualization across various biological contexts, from subcellular to tissue levels. This proposed model facilitates a valuable tool for spatially tracking BM-EVs in vivo, identifying specific target cells, and investigating their functional role in metastatic progression.
Keywords: extracellular vesicles, brain metastasis, pre-metastatic niche, magnetic resonance imaging, superparamagnetic iron oxide particles, transmission electron microscopy
Introduction
Metastatic spread of cancers to the brain is significantly affected by the release of tumor-derived extracellular vesicles (EVs).1 These nanosized particles, less than 200 nm in diameter, play an important role in intercellular communication through the transfer of various biomolecules such as lipids, proteins, carbohydrates, DNA and RNA.2 Although EVs are released from almost all cell types, tumor cells discharge them in much larger quantities compared to normal cells.3,4 In brain metastasis (BM), EVs have been shown to disrupt the blood–brain barrier (BBB), cause vascular and metabolic remodeling, promote neutrophil recruitment, and induce astrocyte dysregulation.5–8 These alterations prepare the brain microenvironment for the onset of metastasis and promote invasion by creating a pre-metastatic niche (PMN), where cells and mechanisms that typically protect from malignancies become more hospitable to incoming tumor cells.9
Although we have begun to understand the effects of EVs on BM and the PMN, a significant knowledge gap remains regarding the dynamic pathology of these brain metastasis-derived EVs (BM-EVs). Improved model systems are required to further understand their homing, spatial distribution, and interactions with specific cell types in the brain.
Magnetic resonance imaging (MRI) facilitates accurate clinical diagnosis of cancer patients and metastatic spread through its ability to differentiate between soft tissues, making it an ideal tool for detecting and visualizing tumors. This imaging technique offers detailed cross-sectional images of the brain, which are crucial for identifying the exact location, extent, size, shape, and potential invasiveness of cancerous growths.10 However, detecting single cells and EVs by MRI is challenging without using reliable contrast agents or labeling techniques.
Superparamagnetic iron oxide nanoparticles (SPIONs) have previously been used as stable, non-radioactive, and biocompatible contrast agents, producing strong, hypointense (dark) contrast in MRI.11 SPIONs are non-toxic at low doses and can remain in the body for weeks after administration depending on the coating, enabling long-term imaging in both pre-clinical and clinical settings.12–14 Due to the high electron density of SPIONs, iron is also easily detected by transmission electron microscopy (TEM), enabling detailed visualization of EVs within cells and tissue sections.
Given the strong signal and cost-effectiveness of SPIONs, bulk labeling of EVs allows for efficient visualization and tracking in imaging studies, both in cell culture and preclinical MRI.15–17 However, this approach has yet to be applied to BM-EVs for investigating their role in targeting healthy brain cells. By developing a model to track these BM-EVs in vitro and in vivo, we can gain insights into the specific cells and regions they target for PMN establishment. This knowledge could increase our understanding of their role in metastasis progression and highlight their potential as therapeutic targets.
In this study, we demonstrate that BM cell lines can be effectively prelabeled with SPIONs. Furthermore, we show that EVs derived from these cells incorporate SPIONs, enabling their visualization by MRI in both in vitro and in vivo settings.
Materials and Methods
Cell Lines and Cell Culture Conditions
The H16 cell line was derived from a BM of a patient with a BRAFwild-type malignant melanoma, while the LBM1 cell line was developed from a BM of a patient with non-small cell lung carcinoma. Both cell lines were grown in Dulbecco’s Modified Eagle’s medium (DMEM; Sigma-Aldrich Inc., St. Louis, MO, USA), supplemented with 10% heat-inactivated fetal bovine serum (Sigma-Aldrich Inc)., 5 mg/mL plasmocin (Invivogen, Toulouse, France), 2% L-glutamine (Sigma-Aldrich Inc)., 3.2% Nonessential amino acids, penicillin (100 IU/mL) and streptomycin (100 m L/mL) (Sigma-Aldrich Inc). Cells were grown in a tissue incubator at 37°C, 5% CO2, and 100% humidity. For maintenance of the cell lines, short tandem repeat fingerprinting (STR) and mycoplasma testing were performed regularly.
Generation of Fetal Rat Brain Organoids (FRBOs)
3D fetal rat brain organoids (FRBOs) are a well-established in vitro model for mimicking the brain environment for differentiation and therapeutic studies.18
Briefly, pregnant Sprague Dawley rats (Janvier Laboratories, Le Genest-Saint-Isle, France) were sacrificed on gestational day 18, and fetuses were surgically removed. The fetal brain tissue was excised, homogenized with scalpel blades, and washed with 1x PBS (Sigma-Aldrich Inc) under sterile conditions. Homogenized tissue was then enzymatically dissociated twice with StemPro Accutase (Thermo Fisher Scientific) for 20 min at 37°C. Meninges and other floating debris were removed, and dissociated cells were filtered through a 70 µm cell strainer (Thermo Fisher Scientific), washed with cell culture medium (DMEM supplemented with 10% heat-inactivated FBS) and counted. Cells were seeded in 24-well agar-coated plates (Thermo Fisher Scientific) at 2.0 × 10⁶ cells/well. Aggregated cells were transferred to agar-coated T25 flasks (Thermo Fisher Scientific) on day 3 of culture and placed on an orbital shaker to ensure 3D growth. Cell culture medium was exchanged regularly and mature FRBOs were used for experiments on day 21.
Labelling of Cell Lines with SPIONs
To label H16 and LBM1 cell lines with SPIONs, cells were first seeded in either 24-well plates, T75 flasks or T175 flasks (Thermo Fisher Scientific) and incubated overnight to reach 70% confluency.
Three different commercially available SPIONs were individually added to separate H16 and LBM1 cell cultures at increasing concentrations of 0 μg/mL, 50 μg/mL, 100 μg/mL or 200 μg/mL diluted in cell culture medium. These included Molday 35 nm dextran-coated SPIONs (BioPAL Inc., Worcester, MA, USA), uncoated 5 nm SPIONs (Sigma-Aldrich, Burlington, MA, USA), and carboxyl-coated 5 nm SPIONs (Ocean Nanotech, San Diego, CA, USA). The cells were then incubated for either 24 h or 48 h. After incubation, the cells were washed three times with pre-warmed PBS prior to downstream analyses.
Prussian Blue Staining
To confirm the uptake of SPIONs by BM cell lines or SPION-loaded EVs by FRBOs, Prussian blue staining was performed.
For staining of monolayer cell cultures after incubation with SPIONs for either 24 h or 48 h, the cell culture medium was removed, and excess SPIONs were discarded by washing the cells three times with 1x PBS. The cells were then fixed in 4% paraformaldehyde (PFA) for 20 min at room temperature. The fixative was removed, and the cells were rinsed gently three times with 1x PBS. The cells were then rinsed once with dH2O, once with 70% EtOH, and again with dH2O before incubating with Prussian Blue stain (1% potassium ferrocyanide (Sigma-Aldrich) + 0.5% HCl in dH2O) for 20 min. To remove excess stain, cells were rinsed three times with dH2O. Brightfield images of cells and histological sections were obtained using a Nikon Eclipse Ti2 inverted microscope (Nikon Instruments, Inc., Melville, NY, USA). The percentage of cells that contained SPIONS (blue spots) were quantified using Fiji freeware (version 2.14.0).
FRBOs were fixed overnight in 4% PFA and embedded in paraffin after being co-cultured with 50 µg/mL SPION-loaded LBM1-EVs for 24 h. Sections were deparaffinized with xylene for 2 × 5 min. Sections were then re-hydrated with decreasing percentages of ethanol and finally distilled water before staining for 10 min in Prussian Blue stain. Sections were washed in running water before counterstaining briefly for 1 min in Nuclear Fast Red (Thermo Fisher Scientific) and again washed in running water. Sections were incrementally dehydrated with an increasing percentage of ethanol before submerging in xylene and mounting coverslips. Images were taken using an Olympus VS120 S6 Slide scanner (Olympus Corporation, Tokyo, Japan).
Transmission Electron Microscopy (TEM)
TEM was utilized to visualize the uptake of SPIONs or SPION-labelled EVs into cells, EVs, and FRBOs. The cells or FRBOs were incubated with either 0 μg/mL, 50 μg/mL, or 100 μg/mL uncoated SPIONs or SPION-labeled LBM1-EVs for 24 h. The samples were then rinsed, harvested, and fixed overnight at 4°C in Karnovsky’s fixative, prepared as 2.5% glutaraldehyde (Electron Microscopy Sciences, Hatfield, USA) and 2% paraformaldehyde in 0.1 M sodium cacodylate buffer (Electron Microscopy Sciences). Samples were post-fixed for 1 h in 1% osmium tetroxide (Electron Microscopy Sciences) in 0.1 M Na cacodylate buffer (Electron Microscopy Sciences), followed by a serial dehydration in ethanol (50–100%), a 1:1 mixture of EtOH and propylene oxide, and finally 100% propylene oxide. The samples were then solidified in Agar 100 resin and sectioned. Ultrathin sections (60 nm) were placed on 200 mesh formvar-coated copper grids (Electron Microscopy Sciences), stained with 2% uranyl acetate (Electron Microscopy Sciences) and lead citrate (Electron Microscopy Sciences).
For EVs, 10 μg of EVs were fixed in Karnovsky’s fixative overnight at 4°C. After mounting on formvar carbon-coated copper grids, samples were post-fixed with 2.5% glutaraldehyde, followed by staining with 2% of uranyl acetate.
Final images were captured using a Hitachi HT7800 transmission electron microscope (Hitachi High-Tech Corporation, Tokyo, Japan).
Proliferation Assay
A proliferation assay was performed on H16 and LBM1 cells after 24 h incubation with both dextran-coated and uncoated SPIONs to assess their effects on cell growth. Cells were washed three times with PBS, and fresh cell culture medium was added to the cells. Plates were imaged every 2 h for 48 h using the IncuCyte Live-Cell Analysis System (Sartorius, Göttingen, Germany), and subsequent growth curves were generated using the IncuCyte S3 software (Essen Bioscience, Ltd). The experiments were performed in triplicates.
Separation and Characterization of EVs
EVs were separated from serum EV-free cell culture medium using qEV columns (Izon Science, Christchurch, New Zealand). H16 and LBM1 cells were cultured in T175 flasks containing EV-free cell culture medium for 48 h until ∼90% confluency. Conditioned medium (CM) was collected and centrifuged at 300 × g for 5 min to remove cell debris, and at 2000 × g for 20 min to remove larger apoptotic bodies. CM was concentrated in Amicon Ultra-15,100 kDa centrifugal filters (MilliporeSigma, Burlington, MA, USA) and immediately added to qEV Gen2 70nm series column. EVs were separated based on the manufacturer’s recommendations. EV-rich fractions (6–11) were collected, pooled, and concentrated further using AmiconTM Ultra-0.5 Centrifugal Filter Units (MilliporeSigma) to a final volume of ∼300 μL. Size distribution of isolated EV populations was quantified using dynamic light scattering (DLS) with a Zetasizer Nano ZS instrument (Malvern Panalytical, Malvern, Worcestershire, UK). Further characterization was performed through Western blotting for marker confirmation (and TEM for morphology) prior to further experimentation.
Western Blotting
Cells and EV lysates were isolated with RIPA lysis buffer supplemented with 10X protease and phosphatase inhibitor cocktail (Roche, Basel, Switzerland). Protein samples were electrophoresed on 4–12% NuPAGE Bis-Tris Protein gels (Invitrogen, Thermo Fisher), followed by a transfer to nitrocellulose membranes. Membranes were blocked for 1 h at room temperature (RT) with 5% skim milk in 1X TBS-T solution and incubated with primary immunoblotting antibodies: Calnexin (cat. no. 2679S; Cell Signaling Technology, Inc., Danvers, MA, USA), FLOT1 (cat. 18634S; Cell Signaling Technology), CD9 (cat. 13174S; Cell Signaling Technology), CD81 (cat. 56039S; Cell Signaling Technology) overnight at 4°C. Membranes were washed and incubated with secondary antibodies (HRP anti-rabbit IgG; Immunotech, Beckman Coulter) for 1 h at room temperature. Signals were visualized with SuperSignal™ Pico/Femto Chemiluminescent Substrate (Thermo Fisher Scientific) using a LAS-3000 imaging system (Fujifilm, Saitama, Japan).
Labeling BM Cell Line-Derived EVs with SPIONs
6.0 × 10⁶ H16 and LBM1 cells were seeded in T175 flasks with EV-free cell culture media and incubated overnight. Fresh EV-free media with 0 μg/mL, 50 μg/mL, or 100 μg/mL SPIONs was exchanged in the flasks and incubated for 24 h. Cells were washed gently three times with 1x PBS to remove excess SPIONs and incubated for another 48 h. Cell-conditioned culture medium was then collected and EVs were separated as described above in section “Separation and Characterization of EVs”.
Iron Assay
Iron content within EV samples was quantified using the Iron Assay Kit (Sigma-Aldrich). 60 μg/well of EV samples in triplicates were processed according to the manufacturer’s recommendations. Briefly, samples and iron kit standards (0 nmol/well, 2 nmol/well, 4 nmol/well, 6 nmol/well, 8 nmol/well, and 10 nmol/well) were added to 96-well plates in triplicates and iron assay buffer was added to all wells prior to a 1 h incubation at RT. 100 µL of Iron Probe was then added to all wells and the plate was incubated for 60 min at RT. Absorbance values at 593 nm were measured using a Multiskan FC Microplate Photometer (Thermo Fisher Scientific).
Nanospacer Assay
Nanoparticle tracking analysis (NTA) was conducted on control and SPION-EVs after isolation using Nanospacer devices (Norinnova, Norway). The device consists of a transparent coverslip precisely attached to a microscope slide – creating a nano space between the layers. Devices were filled by manual pipetting 2µL of sample onto the edge of the device (Supplementary Figure 1a). The capillary force pulls the liquid sample into a thin layer under the glass coverslip, which then immediately after is used for NTA analysis. EV samples were imaged with darkfield-microscopy using an Olympus bench-top industrial microscope (Model BX53M, Olympus) equipped with a FLIR industrial camera (BFS-U3-200S6C-C, FLIR IIS Inc.) and standard white LED illumination. Movies were acquired using a 50 × 0.5NA objective (LMPlanFL 50x BD, Olympus) at a frame rate of 10 hz and same illumination condition to allow comparative intensity measurements between samples. Movies were identically processed using standard FIJI (version v1.54g) software functions before further analysis (eg, binning, FFT filter, background removal). Open-source software Trackmate (FIJI) was used to trace EVs’ movements under flow and measure scattering intensity levels (quality parameter) of single particles (Supplementary Figure 1b).19,20 The TraJClassifier FIJI plugin (version v0.8.1) was then used for mean square displacement (MSD) analysis to obtain diffusion coefficients from single particle tracks and estimate their hydrodynamic size according to their Brownian motion using the Stokes–Einstein relation (Supplementary Figure 1c).21
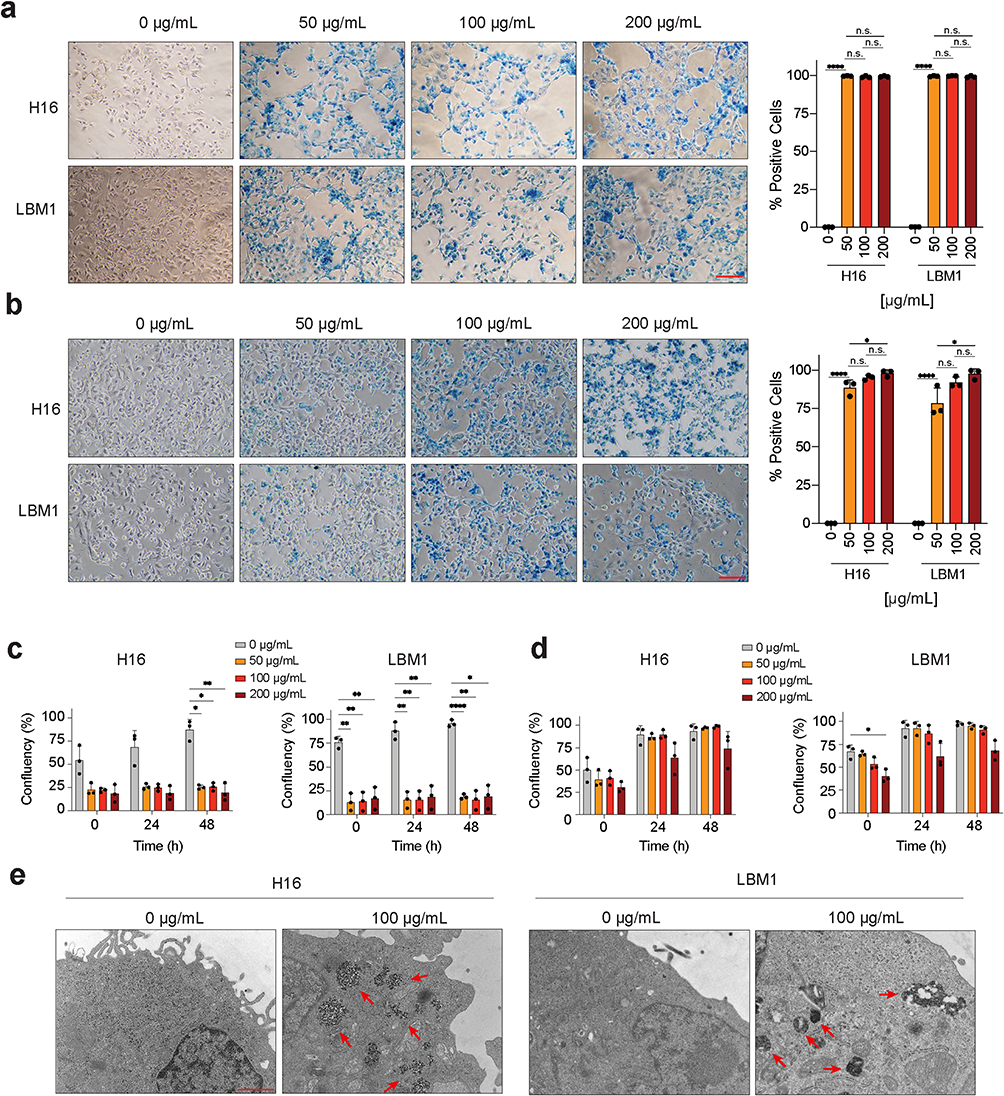 |
Figure 1 Evaluating uptake and growth effects of commercially available SPIONs in LBM1 and H16 cell lines. (a and b) Prussian blue staining and subsequent quantification of H16 and LBM1 cells incubated with increasing doses of 35 nm (a) or 5 nm (b) SPIONS after 24 h. Scale bar = 100 μm. Blue spots show the presence of iron, and quantification is represented as percentage of blue-stained cells relative to the total cell number. (c and d) Incucyte proliferation assay of H16 and LBM1 cells following 24 h incubation with increasing doses of 35 nm (c) or 5 nm (d) SPIONs. (e) TEM micrographs of H16 and LBM1 cells after 24 h incubation with 5 nm SPIONs. Red arrows indicate SPIONs, localized in clusters in the cytoplasm of the cells. Scale bar = 1 μm. n.s. non-significant, *p < 0.05, **p < 0.01, ****p < 0.0001. |
In vitro MR Relaxometry of Cell and EV Phantoms
To investigate the effects of SPION-labeled cells on relaxation time, H16 and LBM1 cells were incubated with 100 μg/mL SPIONS as described above. A 2% Difco Noble agar solution (Becton Dickinson, Franklin Lakes, NJ, USA) was prepared in autoclaved water and mixed 1:1 with cell culture medium containing prelabeled cells in increasing concentrations. Two milliliters from agar/cell dilution was transferred to 2 mL eppendorf tubes (Eppendorf SE, Hamburg, Germany) at final concentrations 500 cells/μL, 1000 cells/μL or 2000 cells/μL. Negative controls were prepared the same way with unlabeled cells. The experiments were performed in triplicates.
For EV phantoms, 10 and 20 μg of control or SPION-EVs were resuspended (1 mg/mL) and injected into semi-solidified 1% Difco Noble agar in PBS in 2 mL Eppendorf tubes and allowed to harden.
The tubes were examined by MRI at 21°C using a 7T small animal PET/MR scanner (MR Solutions Ltd, Guildford, UK). First, a T2 weighted fast spin echo sequence was performed (repetition time (TR) 3000 ms, echo time (TE) 45 ms, field of view (FOV) 3 cm, matrix 256 × 252, slice thickness 1 mm, 12 slices, number of averages (NA) 2) to verify homogeneity of the agar/cell solution. Next, a multiple gradient echo T2 mapping sequence was performed (TR 2000 ms, TE 6 ms, 12 echoes, FOV 3 cm, matrix 64 × 64, slice thickness 1 mm, 12 slices, NA 1). Last, a multiple gradient echo T2* mapping sequence was performed (TR 1000 ms, TE 2 ms, 6 echoes, FOV 3 cm, matrix 64 × 64, slice thickness 1 mm, 12 slices, NA 1). Within the images of each tube, a region of interest covering approximately 75% of the tube was defined in the scanning software (Powerscan, MR Solutions Ltd), and T2 as well as T2* mapping values of the tubes were calculated. MR images were visualized using the Horos software (version 3.3.6, Annapolis, MA, USA) and graphs, statistical calculations and linear regression were performed using GraphPad Prism software version 10 (GraphPad Software, Inc., Boston, MA, USA).
Intracardial Injections of LBM1 and H16 Cell Lines
Five 6–8-week-old female NOD/SCID mice per group were anesthetized with 3% sevoflurane in oxygen and anesthesia was maintained with 1.5% sevoflurane in oxygen. The mice were fixed in a supine position on a heating pad to maintain a core temperature of 37°C. 5×10⁵ of either LBM1 or H16 cells in 100 μL PBS were injected into the left cardiac ventricle using an insulin syringe by ultrasound guidance (Vevo 2100 Imaging System, VisualSonics Inc., Toronto, Canada). Brain tumor development was monitored with MRI every two weeks. T2 weighted coronal MR images were obtained using the following fast spin echo sequence scan parameters: FOV 20 mm × 20 mm, matrix size 256 × 256, 0.5 mm slice thickness, TR 3000 ms, TE 45 ms, FA 900, NA 2, scan time 3 min 41s. Visualization of MR images were performed using the 32-bit OsiriX freeware, version 5.8.1 (Pixmeo SARL, Geneva, Switzerland).
In vivo Injections of SPION-EVs and MRI
To visualize SPION-EVs in vivo, two 12-week-old C57BL/6 mice were scanned by MRI before and after intramuscular injection of 50 μg of LBM1 SPION-EVs in 100 µL of PBS into the right hind limb and 50 μg of control LBM1 EVs into the left hind limb. T2 weighted fast spin echo MRI scans (TR 3000 ms, TE 45 ms, FOV 3 cm, matrix 256 × 252, slice thickness 1 mm, 12 slices, NA 2) were performed to assess anatomical structures prior to injection and after, and 10 min post-injection. The imaging aimed to confirm the feasibility of MRI to detect small amounts of free, iron-labeled EVs.
Ethics Statement
For patient-derived cell lines used in this publication, written informed consent was obtained from all patients prior to tumor collection and tissue culture. Tissue collection, and generation, storage and use of cell lines from patient samples was approved by The Regional Committee for Medical and Health Research Ethics (REC; REC Approvals 2013/720 and 2020/65185) and all work complies with the Declaration of Helsinki.
For all in vivo work in this publication, mice were maintained on standard pellet feed with unrestricted water access. All mice experiments were approved by The Norwegian National Animal Research Authority under the Norwegian Food Safety Authority (Mattilsynet- Forsøksdyrutvalget; FOTS ID #30011) in accordance with the Norwegian Animal Welfare Act.
Results
SPIONs of Different Sizes are Effectively Internalized by LBM1 and H16 Cell Lines
We first tested the labeling of LBM1 and H16 cell lines using three different variants of commercially available superparamagnetic iron oxide nanoparticles (SPIONs); one measuring 35 nm and two measuring 5 nm in diameter, at concentrations of 50 μg/mL, 100 μg/mL, and 200 μg/mL. Prussian blue staining confirmed efficient SPION labeling within 24 h when using both dextran-coated 35 nm and uncoated 5 nm particles (Figure 1a and b). After 48 h of incubation, both cell lines exhibited reduced cell numbers and altered morphology (Supplementary Figure 2). Analysis indicated that over 90% of the cells were labeled with SPIONs at the highest concentrations after 24 h (Figure 1a and b). No uptake was observed when carboxyl-coated 5 nm particles were used, and therefore, no further experiments were performed (Supplementary Figure 3).
To quantify the effect of SPION labeling on cell growth, a proliferation assay was performed. For both cell lines, treatment with 35 nm SPIONs significantly inhibited cell growth already after 24 h of incubation for all iron concentrations tested (Figure 1c), as did 200 μg/mL of uncoated 5 nm SPIONs (Figure 1d). In contrast, lower concentrations of uncoated 5 nm SPIONs had minimal effects on cell proliferation. TEM further confirmed the presence of uncoated 5 nm SPIONs within perinuclear vesicles in both H16 and LBM1 cells (Figure 1e).
EVs are Successfully Loaded with 5nm SPIONs without Altering Population Size Distribution
EVs from LBM1 and H16 cells were isolated using Izon AFC and qEV columns. The presence of EV markers CD9, CD81, and flotilin-1, and the absence of the cell marker calnexin confirmed the successful extraction of EVs (Figure 2a).
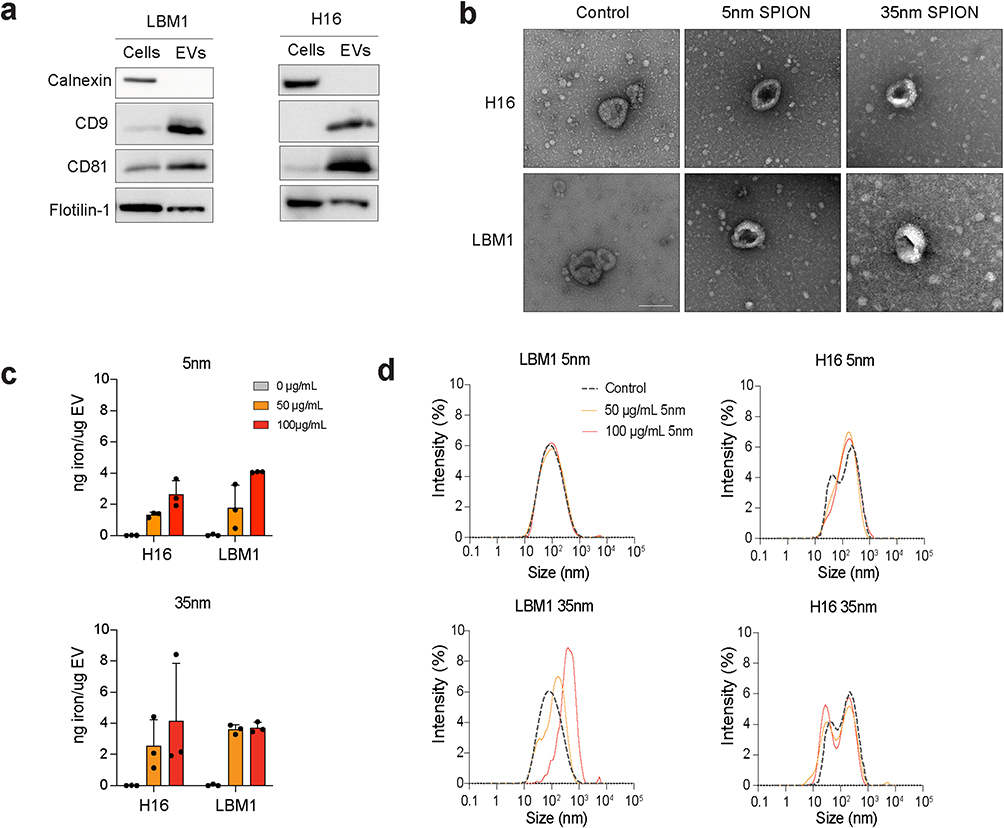 |
Figure 2 Characterization of LBM1- and H16-EV markers, size, morphology, and iron content after SPION labeling. (a) Western blot analysis of positive (CD9, CD81 and FLOT-1) and negative marker (calnexin) on LBM1 and H16 cells and corresponding EVs. (b) TEM of unlabeled and labeled EVs extracted from H16 and LBM1 cells. Scale bar = 100 nm. (c) Quantification of iron content in EVs from H16 and LBM1 cells after labeling with SPIONs. (d) DLS analysis of H16- and LBM1-EV samples after SPION labeling, showing size distribution compared to unlabeled controls. |
TEM was employed to confirm the labeling of BM-EVs with SPIONs. EV samples from both cell lines were collected after 24 h incubation with 5 nm and 35 nm SPIONS. SPION-labeled EVs displayed a distinct dark center within the vesicles, suggesting incorporation of 5 nm SPIONs into the EVs, though labeling was less consistent with the 35 nm SPIONs (Figure 2b). Further, TEM verified the cup-shaped morphology and the sizes of EVs, as well as their iron content (Figure 2b).
A quantitative colorimetric iron assay showed that EVs labeled with 5 nm uncoated SPIONs or dextran-coated 35 nm SPIONs had comparable iron concentrations per μg EV protein, however labeling with 5 nm SPIONs was more consistent between batches (Figure 2c).
The size distribution of the control EV population was confirmed to be between 50 and 200 nm through dynamic light scattering (DLS) analysis and remained unchanged after cell incubation with uncoated 5nm SPIONs (Figure 2d). EVs collected from cells incubated with 35 nm SPIONs exhibited an altered size distribution compared to the control (Figure 2d), suggesting either a change in EV production after incubation with SPIONs, or co-isolation of free SPIONs.
Based on the results from cell and EV labeling experiments as summarized in Supplementary Table 1, 100 μg/mL of 5 nm uncoated SPIONs with a 24 h incubation time was determined to be the optimal conditions for further experiments. LBM1 cells were chosen for subsequent studies due to their rapid growth rate and high EV production. Nanoparticle tracking analysis using Nanospacer demonstrated a clear population shift in H16 EV light scattering intensity after iron incubation (Supplementary Figure 4a) while maintaining similar average particle sizes (124.44 nm control vs 135.81 nm SPION), confirming successful iron incorporation (Supplementary Fig 4b).
SPION-EVs are Effectively Taken up by Normal Cells in FRBOs
To determine the bioactivity and feasibility of using SPION-EVs for iron delivery to organs, we conducted an in vitro co-culture assay by incubating 21-day-old FRBOs with LBM1 and H16 SPION-EVs to evaluate iron uptake.
After 24 h of incubation, Prussian blue staining revealed distinct blue spots within cells of FRBOs treated with LBM1-EVs, but not those treated with H16-EVs (Figure 3a). This pattern reflects the differential brain-colonizing capacity of their parent cells, as LBM1 cells form brain tumors in mice, whereas H16 cells do not. (Supplementary Figure 5) The iron-positive spots initially appeared concentrated at the FRBO periphery before progressively spreading inward, suggesting a time-dependent pattern of EV internalization (Figure 3a). TEM confirmed the presence of SPIONs within cell membranes, providing direct evidence of successful EV uptake (Figure 3b).
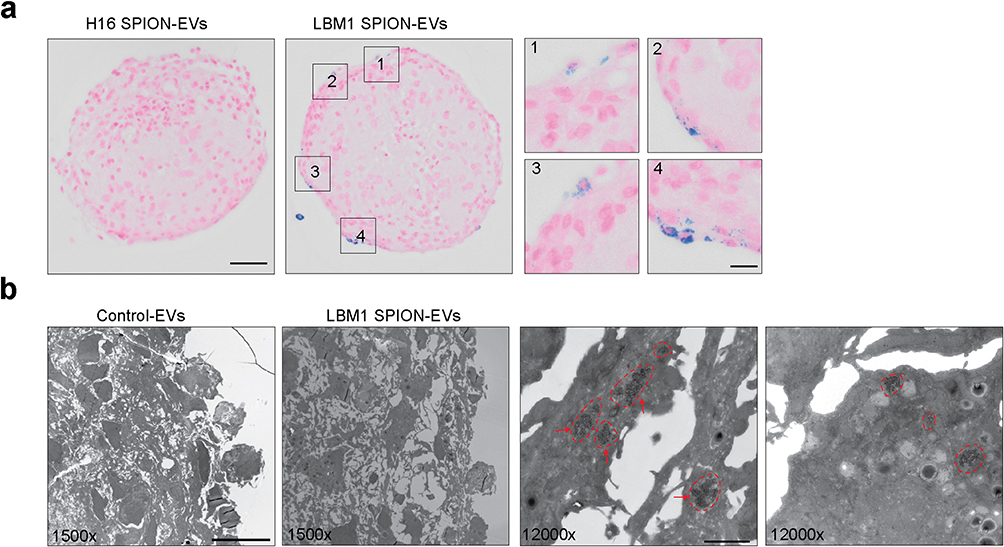 |
Figure 3 Visualization of uptake of EV labeled SPIONs in FRBOs. (a) Prussian blue staining of FRBOs after 24 h co-culture with LBM1 SPION-EVs or H16 SPION-EVs. Areas of SPION-EV uptake are highlighted in zoomed regions 1–4. Blue dots show the presence of SPIONs within brain cells in FRBOs. The pink color is nuclear fast red stain. Scale bar = 50 μm, zoomed scale bar = 12.5 μm (b) Negative stained TEM images of FRBOs after co-culture with LBM1 SPION-EVs. Red encircled areas and red arrows indicate SPIONs. 1500x Scale bar = 10 μm, 12000x Scale bar = 1 μm. |
BM Cells and EVs Labeled with SPIONs Were Successfully Detected by in vitro MRI
Detection limits and optimal scanning parameters of SPION-labeled EVs and cells were established using agar phantoms. These phantoms contained both unlabeled and SPION-labeled BM cells at varying concentrations, along with SPION-EVs. Initial imaging of the phantoms, which included both SPION-labeled and unlabeled cells, used T2 weighted and T2* mapping scans (Figure 4a–f).
 |
Figure 4 Detection of cells and EVs labeled with SPIONs in vitro using MRI. Representative MR images of T2 (a) and T2* weighted (d) scanning of LBM1 cell phantoms with or without SPION labeling immobilized in 1% agarose at varying cell concentrations. (b and c) Quantification of MRI signal from SPION-labeled cells compared to controls with T2 (b) or T2* weighted (e) scanning. (c and f) Linear regression of LBM1 cell phantom signal quantification with T2 (c) or T2* weighted (f) scanning and corresponding R2 value. (g) MR images of LBM1 SPION-EV or control-EV samples injected into 1% agarose with T2 weighted, T2 mapping and T2* weighted scans. Hypointense areas indicate the presence of iron. n.s., non-significant, *p < 0.05, **p < 0.01, ***p < 0.001. |
The phantoms with SPION-labeled cells appeared as hypointense areas compared to the label-free controls (Figure 4a and d). T2 weighted MRI scans showed that the unlabeled phantoms displayed a T2 relaxation times of 120–140 ms, regardless of cell concentration (500, 1000 or 2000 cells/µL in agar). In phantoms labeled with uncoated 5 nm SPIONs, a significant change in T2 relaxation times was found for the two highest concentrations (2000 and 1000 cells/µL agar) (Figure 4a and b). Further, a linear correlation between T2 relaxation values and the concentration of SPION-labeled cells were found (Figure 4c).
The T2* mapping was shown to be more sensitive in detecting labeled cells since there was a significant change in T2* mapping values also for 500 cells (Figure 4d and e). Additionally, there was a linear correlation between T2* values and cell concentration (Figure 4f).
In phantoms where SPIONs-labeled EVs were injected directly into the agar, their location was clearly visible in T2 weighted images, as well as T2 and T2* mapping images compared to the control-EVs (Figure 4g), confirming successful visualization of labeled EVs in vitro using MRI.
SPION-Labeled EVs Injected Intramuscularly Were Successfully Detected by in vivo MRI
After confirming the bioactivity of SPION-EVs in organoids in vitro and their feasibility for visualization with MRI, we next visualized the SPION-EVs in complex tissues using an in vivo model. As a proof of concept, bulk intramuscular injections of LBM1 SPION-EVs and control EVs were administered into the thighs of two mice. MRI clearly visualized the injection areas in both legs, with the control injection producing a hyperintensive area, likely due to the presence of PBS (Figure 5). However, the SPION-EVs produced a notable hypointense area (indicated by red arrows) in the center of the injection site, confirming the presence of SPIONs and thus a loss of signal. Ten min post-injection, the injection sites were more dispersed but remained clearly visible.
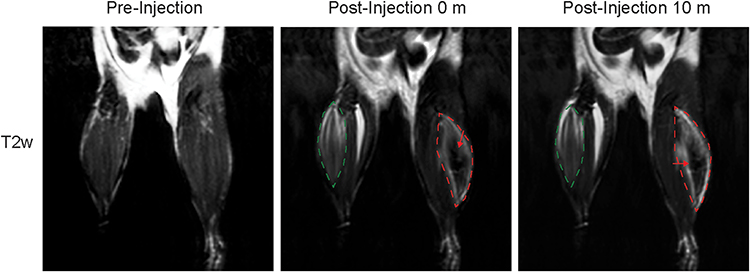 |
Figure 5 SPION-EVs are clearly detected in mouse tissues. T2 weighted MR images of mice quadricep muscles pre- and post- injection of either LBM1 control-EVs (left leg) or SPION-EVs (right leg). Injection areas are marked by either green (control) or red (SPION) dashed lines, and hypointense areas indicating SPION presence are marked with red arrows. |
Discussion
While EVs are known to play crucial roles in PMN formation and metastasis development, current methods lack the capability to track their dynamic distribution and cellular targeting in real-time.6,8,22 To address this critical gap, we developed a SPION-based labeling system that enables multiscale visualization of EVs from subcellular imaging to in vivo distribution. Our approach builds on existing methods by, for the first time to our knowledge, combining passive SPION labeling of EVs and size exclusion chromatography for greater purity and maintenance of tissue-tropism properties. Through extensive characterization and optimization with multimodal imaging, we establish a robust and reliable labeling system for both in vivo and in vitro applications.
Labeling of EVs has proven to be a challenging task. Given their nanoscale size and bioactivity, labels must also be nanosized, capable of penetrating tissue, stable, and non-interfering with the activity of the EVs themselves. Although many labeling techniques are available, labels are typically restricted to a single imaging modality and can have limited imaging time windows, such as with fluorescence or radionuclide tags.23 In contrast, SPIONs are detectable across a range from large-scale in vivo imaging to ex vivo cellular and sub-cellular imaging.24,25 While fluorescence-based methods are restricted to approximately 2 mm imaging depth, our approach enables deep-tissue visualization through MRI while simultaneously allowing detailed analysis at the subcellular and cellular level.26 This dual-capability system provides a comprehensive platform to study the temporal and spatial dynamics of EV distribution in PMN formation.
Uncoated 5 nm SPIONs emerged as the optimal choice among three commercially available formulations, demonstrating superior cellular uptake and preserving cell viability in our systematic evaluation. This specific size appears to represent an ideal balance between efficient cellular incorporation and minimal disruption of EV biology at a concentration that mediates cell toxicity.27 The removal of excess SPIONs, combined with their release from cells through EV production and the gradual dilution of SPIONs during cell division, further reduces the potential risk of long-term cytotoxicity.28 For any repeated SPION incubation studies or when using non-rapidly dividing cells, toxicity should be evaluated more thoroughly.
The SPION-labeled EVs exhibited an iron concentration of 4 ng iron/μg EV, which is comparable to previous reports in stem cells (6.43 ng iron/μg EV) after incubation with 200 μg/mL SPIONs, whereas our study used 100 μg/mL.15 Importantly, our labeling technique offers broad applicability across diverse cell types without requiring extensive protocol optimization or genetic modification of cell lines. By combining passive labeling with size exclusion chromatography, we achieved highly pure SPION-EVs while minimizing free SPION contamination—a persistent challenge when using larger particles with traditional ultracentrifugation-based isolation methods.29 Dynamic light scattering and Nanospacer analysis confirmed consistent EV size distributions (100–150 nm) before and after SPION loading, with a clear shift in light scattering intensity post-loading. This shift, occurring without significant size alterations, provides strong evidence for successful nanoparticle incorporation while preserving vesicle structural integrity.
A key concern when loading EVs with nanoparticles is the potential disruption of their biological function and natural behavior. Our results demonstrate that LBM1-EVs maintain their brain tropism, while EVs from H16 cells—which do not colonize the brain in vivo—showed no uptake in brain organoids. These findings align with previous research indicating that EV tropism is determined by the parent cell signature, and importantly, confirms that our SPION-loading process preserves the EVs’ targeting capabilities.30 This preservation of natural targeting behavior is a pre-requisite for studying PMN formation, ensuring EV distribution patterns reflect genuine biological processes rather than artifacts of the labeling method. The maintained functionality of SPION-labeled EVs also suggests preservation of their membrane proteins and surface markers, essential components for crossing the blood–brain barrier, and cellular recognition and uptake in the brain.31
While much of SPION-EV research has focused on therapeutic delivery, we aim to use this model for a novel application: understanding the fundamental biology of PMN formation before tumor cell arrival.32–34 We have successfully demonstrated that SPION-EVs are clearly visible following intramuscular injection, setting the stage for optimizing brain delivery methods. Moving forward, comprehensive dosing studies, time-course analyses, and biodistribution investigations will be essential to advance this work. Optimization of MRI detection techniques would enhance sensitivity for tracking physiologically relevant EV concentrations in vivo. While T2* was optimal for in vitro SPION detection, T2 proved more feasible for mouse tissue imaging due to its reduced sensitivity to magnetic field inhomogeneities. Our in vivo data (Figure 5) demonstrate proof-of-principle detection of SPION-labeled EVs following intramuscular injection, supporting the potential of this method for in vivo tracking. However, the current model does not replicate natural EV biodistribution. Future studies will explore systemic injection routes and longitudinal imaging to evaluate EV targeting to metastatic niches such as the brain. Optimization of SPION-EV dosing, imaging sensitivity, and MRI acquisition protocols will be essential for tracking physiologically relevant EV populations in more complex in vivo contexts.
Particular attention should be paid to understanding the kinetics of EV distribution in the brain microenvironment and their interactions with specific cell types involved in PMN formation. Additionally, future studies should explore the potential of combining this tracking system with therapeutic interventions to both monitor and modulate PMN development.
Our results on the SPION-based EV labeling may have potential clinical applications in diagnostics as well as in therapeutics. A non-invasive tracking strategy using SPION-labeled EVs and MRI could help monitor metastatic progression and evaluate therapeutic responses in patients with BM. SPIONs can effectively label EVs without changing their biological properties is particularly significant, as certain iron oxide nanoparticles have already received FDA approval for clinical imaging applications.35,36 Our results could facilitate translation to clinical studies aiming to understand EV-mediated PMN formation in patients, potentially leading to targeted treatment of the PMN itself. Additionally, SPION-loaded cancer EVs offer a powerful theranostic approach, enabling both tracking and the development of targeted therapies for specific cells or tissues. Integration of imaging and therapy into a single platform could be possible by loading EVs containing-SPIONs and therapeutic drugs to confirm their uptake and enable tracking. This approach shows promise in glioma treatment and may help address metastasis before it fully establishes in the brain.37 Magnetic guidance of SPION-loaded EVs ensures controlled delivery of therapeutic cargo, while the addition of antibodies or aptamers enhances selective binding to target cells.25 These combined functions position SPION-engineered cancer EVs as an advanced platform for personalized cancer treatment.
Conclusion
In this study, we developed a reproducible, trackable, and straightforward protocol for labeling BM-EVs, enabling their visualization in complex environments such as brain organoids and tissues and even at subcellular localization within individual cells. This model not only facilitates spatial tracking of EVs in vivo but also aids in identifying specific target cell types, paving the way for functional studies that may explore the impact of BM-EVs. This approach can be applied to investigate the role of EVs in shaping the pre-metastatic niche, providing insights into their contributions to tumor progression and metastasis.
Data Sharing Statement
Data available upon reasonable request to the corresponding authors.
Acknowledgments
Frits Thorsen and Emma Rigg contributed equally as last authors. All light microscopy, TEM, and MR imaging was performed at The Molecular Imaging Center, Department of Biomedicine, University of Bergen, Norway. This work was supported by the Norwegian Cancer Society (182716), The Western Norway Regional Health Authority (F-12856-D11661) and the University of Bergen and the Horizon Europe Program (101064246), UiT Talent Innovation grant.
Author Contributions
All authors made a significant contribution to the work reported, whether that is in the conception, study design, execution, acquisition of data, analysis and interpretation, or in all these areas; took part in drafting, revising or critically reviewing the article; gave final approval of the version to be published; have agreed on the journal to which the article has been submitted; and agree to be accountable for all aspects of the work.
Disclosure
Oliver Vanderpoorten has filed a patent application on Nanospacer technology. The authors report no other conflicts of interest in this work.
References
1. Li J, Lu S, Chen F, Zhu H. Unveiling the hidden role of extracellular vesicles in brain metastases: a comprehensive review. Front Immunol. 2024;15:1388574. doi:10.3389/fimmu.2024.1388574
2. Welsh JA, Goberdhan DCI, O’Driscoll L, et al. Minimal information for studies of extracellular vesicles (MISEV2023): from basic to advanced approaches. J Extracell Vesicles. 2024;13(2):e12404. doi:10.1002/jev2.12404
3. Hanelova K, Raudenska M, Kratochvilova M, et al. Autophagy modulators influence the content of important signalling molecules in PS-positive extracellular vesicles. Cell Commun Signal. 2023;21(1):120. doi:10.1186/s12964-023-01126-z
4. Walbrecq G, Margue C, Behrmann I, Kreis S. Distinct Cargos of Small Extracellular Vesicles Derived from Hypoxic Cells and Their Effect on Cancer Cells. IJMS. 2020;21(14):5071. doi:10.3390/ijms21145071
5. Wu D, Deng S, Li L, et al. TGF-β1-mediated exosomal lnc-MMP2-2 increases blood-brain barrier permeability via the miRNA-1207-5p/EPB41L5 axis to promote non-small cell lung cancer brain metastasis. Cell Death Dis. 2021;12(8):721. doi:10.1038/s41419-021-04004-z
6. Rigg E, Wang J, Xue Z, et al. Inhibition of extracellular vesicle-derived miR-146a-5p decreases progression of melanoma brain metastasis via Notch pathway dysregulation in astrocytes. J Extracell Vesicles. 2023;12(10):e12363. doi:10.1002/jev2.12363
7. Rodrigues G, Hoshino A, Kenific CM, et al. Tumour exosomal CEMIP protein promotes cancer cell colonization in brain metastasis. Nat Cell Biol. 2019;21(11):1403–1412. doi:10.1038/s41556-019-0404-4
8. Tominaga N, Kosaka N, Ono M, et al. Brain metastatic cancer cells release microRNA-181c-containing extracellular vesicles capable of destructing blood–brain barrier. Nat Commun. 2015;6(1):6716. doi:10.1038/ncomms7716
9. Geissler M, Jia W, Kiraz EN, et al. The Brain Pre-Metastatic Niche: biological and Technical Advancements. Int J Mol Sci. 2023;24(12):10055. doi:10.3390/ijms241210055
10. Chourmouzi D, Papadopoulou E, Marias K, Drevelegas A. Imaging of Brain Tumors. Surg Oncol Clin. 2014;23(4):629–684. doi:10.1016/j.soc.2014.07.004
11. Rahman M. Magnetic Resonance Imaging and Iron-oxide Nanoparticles in the era of Personalized Medicine. Nanotheranostics. 2023;7(4):424–449. doi:10.7150/ntno.86467
12. Thakor AS, Jokerst JV, Ghanouni P, Campbell JL, Mittra E, Gambhir SS. Clinically Approved Nanoparticle Imaging Agents. J Nucl Med. 2016;57(12):1833–1837. doi:10.2967/jnumed.116.181362
13. Wei H, Hu Y, Wang J, Gao X, Qian X, Tang M. Superparamagnetic Iron Oxide Nanoparticles: cytotoxicity, Metabolism, and Cellular Behavior in Biomedicine Applications. Int J Nanomed. 2021;16:6097–6113. doi:10.2147/IJN.S321984
14. Wang HH, Wang YXJ, Leung KCF, et al. Durable Mesenchymal Stem Cell Labelling by Using Polyhedral Superparamagnetic Iron Oxide Nanoparticles. Chem Eur J. 2009;15(45):12417–12425. doi:10.1002/chem.200901548
15. Busato A, Bonafede R, Bontempi P, et al. Magnetic resonance imaging of ultrasmall superparamagnetic iron oxide-labeled exosomes from stem cells: a new method to obtain labeled exosomes. International Journal of Nanomedicine. 2016;11:2481–2490. doi:10.2147/IJN.S104152
16. Kutchy NA, Ma R, Liu Y, Buch S, Hu G. Extracellular Vesicle-Mediated Delivery of Ultrasmall Superparamagnetic Iron Oxide Nanoparticles to Mice Brain. Front Pharmacol. 2022;13:819516. doi:10.3389/fphar.2022.819516
17. Han Z, Liu S, Pei Y, et al. Highly efficient magnetic labelling allows MRI tracking of the homing of stem cell-derived extracellular vesicles following systemic delivery. J Extracell Vesicles. 2021;10(3):e12054. doi:10.1002/jev2.12054
18. Bjerkvig R, Steinsvåg SK, Laerum OD. Reaggregation of fetal rat brain cells in a stationary culture system I: methodology and cell identification. Vitro Cell Dev Biol. 1986;22(4):180–192. doi:10.1007/BF02623302
19. Ershov D, Phan MS, Pylvänäinen JW, et al. TrackMate 7: integrating state-of-the-art segmentation algorithms into tracking pipelines. Nat Methods. 2022;19(7):829–832. doi:10.1038/s41592-022-01507-1
20. Tinevez JY, Perry N, Schindelin J, et al. TrackMate: an open and extensible platform for single-particle tracking. Methods. 2017;115:80–90. doi:10.1016/j.ymeth.2016.09.016
21. Wagner T, Kroll A, Haramagatti CR, Lipinski HG, Wiemann M. Classification and Segmentation of Nanoparticle Diffusion Trajectories in Cellular Micro Environments. PLoS One. 2017;12(1):e0170165. doi:10.1371/journal.pone.0170165
22. Zhang Y, Chen Y, Shi L, et al. Extracellular vesicles microRNA-592 of melanoma stem cells promotes metastasis through activation of MAPK/ERK signaling pathway by targeting PTPN7 in non-stemness melanoma cells. Cell Death Discov. 2022;8(1):1–10. doi:10.1038/s41420-022-01221-z
23. Almeida S, Santos L, Falcão A, Gomes C, Abrunhosa A. In Vivo Tracking of Extracellular Vesicles by Nuclear Imaging: advances in Radiolabeling Strategies. Int J Mol Sci. 2020;21(24):9443. doi:10.3390/ijms21249443
24. Arifin DR, Witwer KW, Bulte JWM. Non-Invasive imaging of extracellular vesicles: quo vaditis in vivo? J Extracell Vesicles. 2022;11(7):12241. doi:10.1002/jev2.12241
25. Zhuo Z, Wang J, Luo Y, et al. Targeted extracellular vesicle delivery systems employing superparamagnetic iron oxide nanoparticles. Acta Biomater. 2021;134:13–31. doi:10.1016/j.actbio.2021.07.027
26. Ochiai H, Sakamoto N, Fujita K, et al. Zinc-finger nuclease-mediated targeted insertion of reporter genes for quantitative imaging of gene expression in sea urchin embryos. Proc Natl Acad Sci. 2012;109(27):10915–10920. doi:10.1073/pnas.1202768109
27. Singh N, Jenkins GJS, Asadi R, Doak SH. Potential toxicity of superparamagnetic iron oxide nanoparticles (SPION). Nano Rev. 2010;1(1):5358. doi:10.3402/nano.v1i0.5358
28. Sundstrøm T, Daphu I, Wendelbo I, et al. Automated Tracking of Nanoparticle-labeled Melanoma Cells Improves the Predictive Power of a Brain Metastasis Model. Cancer Res. 2013;73(8):2445–2456. doi:10.1158/0008-5472.CAN-12-3514
29. Toomajian VA, Tundo A, Ural EE, Greeson EM, Contag CH, Makela AV. Magnetic Particle Imaging Reveals that Iron-Labeled Extracellular Vesicles Accumulate in Brains of Mice with Metastases. ACS Appl Mater Interfaces. 2024;16(24):30860–30873. doi:10.1021/acsami.4c04920
30. Sancho-Albero M, Navascués N, Mendoza G, et al. Exosome origin determines cell targeting and the transfer of therapeutic nanoparticles towards target cells. J Nanobiotechnol. 2019;17(1):16. doi:10.1186/s12951-018-0437-z
31. Morad G, Carman CV, Hagedorn EJ, et al. Tumor-Derived Extracellular Vesicles Breach the Intact Blood-Brain Barrier via Transcytosis. ACS Nano. 2019;13(12):13853–13865. doi:10.1021/acsnano.9b04397
32. Hu WJ, Wei H, Cai LL, et al. Magnetic targeting enhances the neuroprotective function of human mesenchymal stem cell-derived iron oxide exosomes by delivering miR-1228-5p. J Nanobiotechnol. 2024;22(1):665. doi:10.1186/s12951-024-02941-3
33. Ji C, Zhang J, Shi L, et al. Engineered extracellular vesicle-encapsulated CHIP as novel nanotherapeutics for treatment of renal fibrosis. npj Regen Med. 2024;9(1):1–11. doi:10.1038/s41536-024-00348-0
34. Tian T, Qiao S, Tannous BA. Nanotechnology-Inspired Extracellular Vesicles Theranostics for Diagnosis and Therapy of Central Nervous System Diseases. ACS Appl Mater Interfaces. 2023;15(1):182–199. doi:10.1021/acsami.2c07981
35. Pellico J, Ruiz-Cabello J, Herranz F. Radiolabeled Iron Oxide Nanomaterials for Multimodal Nuclear Imaging and Positive Contrast Magnetic Resonance Imaging (MRI): a Review. ACS Appl Nano Mater. 2023;6(22):20523–20538. doi:10.1021/acsanm.3c04269
36. Oberdick SD, Jordanova KV, Lundstrom JT, et al. Iron oxide nanoparticles as positive T1 contrast agents for low-field magnetic resonance imaging at 64 mT. Sci Rep. 2023;13(1):11520. doi:10.1038/s41598-023-38222-6
37. Jia G, Han Y, An Y, et al. NRP-1 targeted and cargo-loaded exosomes facilitate simultaneous imaging and therapy of glioma in vitro and in vivo. Biomaterials. 2018;178:302–316. doi:10.1016/j.biomaterials.2018.06.029
 © 2025 The Author(s). This work is published and licensed by Dove Medical Press Limited. The
full terms of this license are available at https://www.dovepress.com/terms.php
and incorporate the Creative Commons Attribution
- Non Commercial (unported, 4.0) License.
By accessing the work you hereby accept the Terms. Non-commercial uses of the work are permitted
without any further permission from Dove Medical Press Limited, provided the work is properly
attributed. For permission for commercial use of this work, please see paragraphs 4.2 and 5 of our Terms.
© 2025 The Author(s). This work is published and licensed by Dove Medical Press Limited. The
full terms of this license are available at https://www.dovepress.com/terms.php
and incorporate the Creative Commons Attribution
- Non Commercial (unported, 4.0) License.
By accessing the work you hereby accept the Terms. Non-commercial uses of the work are permitted
without any further permission from Dove Medical Press Limited, provided the work is properly
attributed. For permission for commercial use of this work, please see paragraphs 4.2 and 5 of our Terms.