")
Back to Journals » International Journal of Nanomedicine » Volume 20
NIR-II Imaging Guided Accurate Identification of Paraspinal Muscle Degeneration Through Targeting the Lysosomal Membrane Protein Sidt2
Authors Piao G , Fan L, Zhang Y, Jiang W, Guo X, Liu R, Wang Q, Jia S, Liang J, Li Y
Received 15 January 2025
Accepted for publication 7 June 2025
Published 17 June 2025 Volume 2025:20 Pages 7743—7762
DOI https://doi.org/10.2147/IJN.S517633
Checked for plagiarism Yes
Review by Single anonymous peer review
Peer reviewer comments 3
Editor who approved publication: Prof. Dr. Anderson Oliveira Lobo
Guanghao Piao,1,2,* Limin Fan,3,* Yanmin Zhang,4,5,* Wen Jiang,5 Xiaoping Guo,4 Rui Liu,1 Qian Wang,6 Sihan Jia,6 Junqin Liang,6,7 Yizhou Li1,6,7
1Department of Orthopedics, The Affiliated Hospital of Inner Mongolia Medical University, Hohhot, 010000, People’s Republic of China; 2Department of Orthopedics, Baogang Hospital of Inner Mongolia, Baotou, 014010, People’s Republic of China; 3School of Medicine, Tongji University, Shanghai, 200000, People’s Republic of China; 4Otolaryngology Diagnosis and Treatment Center, People’s Hospital of Xinjiang Uygur Autonomous Region, Urumqi, 830001, People’s Republic of China; 5Research and Education Center, People’s Hospital of Xinjiang Uygur Autonomous Region, Urumqi, 830001, People’s Republic of China; 6Department of Allergy, People’s Hospital of Xinjiang Uygur Autonomous Region, Urumqi, 830001, People’s Republic of China; 7Treatment Center of Biomedicine, People’s Hospital of Xinjiang Uygur Autonomous Region, Urumqi, 830001, People’s Republic of China
*These authors contributed equally to this work
Correspondence: Junqin Liang, Email [email protected] Yizhou Li, Email [email protected]
Background: This study introduces a novel imaging approach for early detection of degenerative paraspinal muscle disorders, which are a key contributor to lower back pain and lumbar-related diseases. The core concept involves the use of a lanthanide-doped nanoprobe with a core@shell structure (NaYbF₄:x%Er@NaYF₄:x%Yb@NaYF₄), designed to function as a second near-infrared (NIR-II) fluorescent probe. This probe demonstrates significant advantages such as deep tissue penetration, high spatial and temporal resolution, and exceptional stability, enabling in vivo monitoring of muscle degeneration.
Methods: To achieve precise imaging of degenerative paraspinal muscles, a core@shell structure lanthanide nanoprobe of NaYbF4:x%Er@NaYF4:x%Yb @NaYF4 was designed through adjusting the lanthanide concentration parameters and outer shell structure thickness in the probe structure so that these adjustments improved its fluorescence efficiency and long fluorescence life. Based on the results of mRNA sequencing, our findings support Sidt2 as a reliable and potentially specific marker for paraspinal muscle degeneration. The fluorescent probe was functionalized with an antibody specifically targeting the upregulated lysosomal membrane protein Sidt2.
Results: Notably, in a mice model of degenerative paraspinal muscles, the Sidt2-targeted nanoprobe selectively accumulated in the degenerative muscle tissues, displaying intense fluorescence signals. Fluorescence intensity measurements from the region of interest (ROI) in the degenerated paraspinal muscle showed NIR-II intensities of up to 200 a.u. with consistent fluorescence for 8 hours post-injection. Biological assays demonstrated a strong correlation between fluorescence intensity and the extent of muscle degeneration.
Conclusion: This study presents a platform for ultra-early detection of degenerative paraspinal muscles using NIR-II imaging, providing a theoretical basis for early intervention based on the multifunctionality of nanoprobes. This is the first application of NIR-II fluorescence imaging to assess muscle tissue lesions, and the results strongly support advancing to the next phase, which involves using multifunctional probe technology to intervene in paraspinal muscle degeneration.
Keywords: Sidt2, paraspinal muscle degeneration, NIR-II fluorescence imaging, lanthanide nanoprobe
Introduction
Lower back pain (LBP) is a major cause of reduced quality of life and shortened lifespan in older individuals.1 An epidemiological survey found that the prevalence of LBP among workers in labor-intensive occupations can reach up to 16.4%.2,3 Clinically, LBP is typically classified as specific or nonspecific, with nonspecific LBP being the most common form.4 This type of pain often results from lumbar instability due to degenerative paraspinal muscles, posing a significant challenge for diagnosis and treatment.5 Therefore, assessing paraspinal muscle degeneration can help predict the progression and prognosis of LBP-related conditions.
Currently, the evaluation of paraspinal muscle degeneration relies on imaging techniques such as computed tomography (CT), magnetic resonance imaging (MRI), and ultrasound. While these methods offer valuable indicators like muscle cross-sectional area (CSA), density, and fat infiltration, they each have specific limitations in terms of cost, resolution, or examination tim.6–11 Near-infrared fluorescence imaging (NIR-FL) has gained significant attention for its high sensitivity, resolution, non-ionizing nature, and real-time imaging capabilities.12 The NIR-II light source, in particular, offers reduced scattering and better penetration in biological tissues, enabling deep, noninvasive imaging with high contrast and a superior signal-to-background ratio.13 This makes NIR-FL ideal for imaging at greater depths without interference from normal tissue fluorescence. A key component in NIR-II imaging is the fluorescence probe, which significantly influences image quality through its sensitivity, specificity, fluorescence intensity, and lifetime. Recent advances in nanotechnology have led to the development of multifunctional nanoprobes, which allow for targeted tissue binding and optimized fluorescence properties.14,15 Among these, lanthanide-doped upconversion nanoparticles (UCNPs) are particularly promising, as they efficiently convert near-infrared photons into higher-energy UV-visible photons, offering narrow emission bands, long lifetimes, and excellent photostability.16–19 Despite their advantages, UCNPs face limitations in vivo, such as low fluorescence intensity due to small absorption cross-sections and low photoluminescence quantum efficiency.20 This can be addressed by employing a core@shell nanostructure, which enhances energy transfer, improves fluorescence intensity, and allows for better control over fluorescence lifetime. These innovations lead to brighter, more sensitive nanoprobes, improving imaging contrast and sensitivity, with promising potential for clinical applications.21
Significant progress has been made in research related to the diagnosis and treatment of clinical diseases using NIR-II fluorescence imaging. This technology demonstrates unique advantages such as high penetration depth, high selectivity, and visualization in various fields, including cancer localization and diagnosis, intraoperative guidance for resection margins, sentinel lymph node biopsy, monitoring of inflammation, and assessment of liver and kidney injuries.22–26 Moreover, by combining photothermal agents and photosensitizers with probes, NIR-II light excitation enables photothermal therapy (PTT) and photodynamic therapy (PDT) in vivo, further enhancing its unique strength in integrating diagnosis and treatment.27–30 To the best of our knowledge, no studies have yet applied NIR-II fluorescence imaging to evaluate muscle-related diseases. Clinical experience has highlighted the critical role of paraspinal muscles in the onset and progression of spinal disorders. However, current diagnostic methods for paraspinal muscle degeneration have certain limitations. This study aims to extend in vivo NIR-II fluorescence imaging to the diagnosis of muscle-related diseases.
In summary, a lanthanide-doped nanoprobe with a core@shell structure was designed, and its fluorescence efficiency and lifetime were enhanced by adjusting the component ratio and the thickness of the outer inert shell. Additionally, transcriptome sequencing identified specific biomarkers for degenerative changes in the paraspinal muscles of mice. After functionalizing the nanoprobe with antibodies targeting these biomarkers, it accurately targeted the degenerative muscles. Furthermore, NIR-II fluorescence imaging confirmed the probe’s ability to precisely assess the degenerative changes in the paraspinal muscles of mice.
This study presents a platform for ultra-early detection of degenerative paraspinal muscles using NIR-II imaging, providing a theoretical basis for early intervention based on the multifunctionality of nanoprobes. This is the first application of NIR-II fluorescence imaging to assess muscle tissue lesions, and the results strongly support advancing to the next phase, and this imaging strategy enables early detection of degenerative paraspinal muscles, providing a new approach for early intervention to mitigate disease progression (Scheme 1).
 |
Scheme 1 Synthesis and Targeting Strategy of core@shell structure lanthanide nanoprobe NaYbF4:x%Er@NaYF4:x%Yb@NaYF4. |
Results and Discussion
Verification of the Mice Model of Paraspinal Muscle Degeneration
The modeling results were validated after 8 weeks of hind-limb suspension in mice. Paraspinal muscle tissues from both the model and control groups were collected for HE staining, inflammatory factor detection, Western blot analysis, and immunofluorescence. HE staining (Figures 1A and S1) revealed that paraspinal muscle cells in the model mice had larger intercellular spaces compared to normal cells, a reduction in myofilament, nuclear pyknosis, and no noticeable fat infiltration. The muscle cross-sectional area was reduced, indicating degenerative changes. However, cytomorphological observations alone are insufficient for assessing muscle degeneration. Since muscle degeneration and regeneration are complex processes, the expression of related inflammatory factors and proteins provides a more sensitive assessment. Insulin-like growth factor (IGF) plays a crucial role in muscle growth and regeneration, correlating with muscle mass and strength. It promotes satellite cell proliferation and maintains muscle mass.31 Malondialdehyde (MDA) and superoxide dismutase (SOD) are markers of oxidative stress. Elevated MDA levels indicate lipid peroxidation and muscle oxidative stress,32 while decreased SOD levels suggest impaired antioxidant activity and muscle oxidative damage. Myostatin (MSTN) inhibits myogenesis, growth, and muscle cell differentiation.33 Myostatin (MSTN) is a protein produced and released by muscle cells that inhibits the myogenesis, growth, and differentiation of muscle cells through autocrine functions.34 Inflammatory factor analysis (Figure 1B and Tables S1–S4) showed increased MDA and MSTN expression and decreased SOD and IGF expression in the paraspinal muscles of model mice, with statistically significant differences, confirming significant muscle degeneration in the model group.
 |
Figure 1 Verification of the mice model of paraspinal muscle degeneration. (A) Construction of paravertebral muscle mice model and HE staining results. (B) Results of detection and quantitative analysis of inflammatory factors IGF, MDA, MSTN and SOD related to muscle degeneration. (C) WB detection and quantitative analysis results of MHC and Troponin T. (D) Immunofluorescence detection of Collagen I, α-SMA and Collagen III in degenerative paravertebral muscles of mice. (E) Quantitative analysis of immunofluorescence results. Notes: *means P<0.05, **means P<0.01, ***means P<0.001, P<0.05, P<0.01, P<0.001 all indicate that the differences were statistically significant. |
Myosin and troponin are essential proteins that regulate muscle contraction and relaxation. The myosin heavy chain (MHC) is a crucial component of myosin, while troponin T is a subunit that makes up troponin. Western blot analysis (Figures 1C and S2) of muscle proteins MHC and troponin T showed reduced expression levels, indicating impaired muscle contraction and relaxation. Quantitative analysis confirmed these differences were statistically significant, further supporting the degenerative state of the model mice’s paraspinal muscles. During muscle degeneration and regeneration, myoblast proliferation, migration, and differentiation are tightly regulated by the extracellular matrix (ECM). Collagen I plays a key role in promoting interleukin-6 (IL-6) production through NF-κB-p65 signaling and enhances myoblast migration and differentiation.35 Collagen III and α-smooth muscle actin (α-SMA) are also major ECM components that affect muscle flexibility, elasticity, and differentiation.36,37 To further confirm the efficacy of the paraspinal muscle degeneration model in mice, immunofluorescence staining was used to compare the levels of the three ECM components in degenerative paraspinal muscle tissue and normal paraspinal muscle tissue. Immunofluorescence staining results (Figures 1D, E and S3) showed a decrease in the levels of these ECM components in the paraspinal muscles of the model mice, with statistically significant differences in fluorescence intensity.
The consistent findings across HE staining, inflammatory factor detection, Western blot analysis, and immunofluorescence staining provide robust evidence of significant paraspinal muscle degeneration in the model mice after 8 weeks of hind-limb suspension.
mRNA Sequencing and Differential Gene Screening of Paraspinal Muscle Degeneration in Mice
Paraspinal muscle tissue was quickly collected from mice for mRNA sequencing using high-throughput next-generation sequencing technology. A total of 177 differentially expressed genes were identified in degenerated paraspinal muscle tissue compared to normal tissue, with 21 genes upregulated and 156 genes downregulated. Volcano plots (Figures 2A and S4) depicted the P values and fold changes, and cluster heatmaps (Figures 2B and S4) were generated based on the corresponding FPKM values.
 |
Figure 2 mRNA sequencing and differential gene screening of paraspinal muscle degeneration in mice. (A) Volcano map of differential gene sequencing of mice degenerative paravertebral muscle mRNA. (B) Differential gene thermal map of degenerative paravertebral muscle mRNA sequencing. (C) GO enrichment results of mice degenerative paravertebral muscle differential genes. (D) KEGG enrichment analysis results of degenerative paravertebral muscle differential gene in mice. (E) Quantitative analysis of gene expression of differential genes in degenerative paravertebral muscles of mice by qPCR. Notes: **represents P<0.01, ***represents P<0.001, P<0.01, P<0.001 all indicate that gene expression differences were statistically significant. |
Gene Ontology (GO) enrichment analysis, using the clusterProfiler R package, classified the differentially expressed genes into molecular function (MF), biological process (BP), and cellular component (CC) categories. The analysis revealed that in the BP category, the differentially expressed genes were enriched in extracellular matrix organization, extracellular structure organization, and external encapsulation structure organization in the degenerated muscle. In the CC category, genes related to collagen-containing extracellular matrix, collagen trimers, and cell leading edges were significantly enriched. In the MF category, extracellular matrix structural binding, glycosaminoglycan binding, and protein binding were notably enriched (Figures 2C and S5).
Kyoto Encyclopedia of Genes and Genomes (KEGG) pathway analysis (Figures 2D and S6) highlighted several pathways associated with muscle degeneration, including ECM-receptor interactions, focal adhesion, protein digestion and absorption, the PI3K-Akt signaling pathway, and the AGE-RAGE signaling pathway in diabetic complications.
Five genes, Teddm2, B3gnt9, Tsfm, Sorbs3, and Sidt2, were identified as potential specific targets for paraspinal muscle degeneration based on their increased expression, P values, FPKM values, and enrichment analyses. Quantitative PCR (qPCR) validation showed these genes were highly expressed in degenerated paraspinal muscles, with Sidt2 being the most upregulated (Figure 2E and Table S5).
While the functions of Teddm2 and B3gnt9 remain unclear, studies have linked Tsfm to mitochondrial diseases in infants and its role in mitochondrial protein translation.38 Sorbs3 has been implicated in brain aging and uveal melanoma, where it aids in cell adhesion and migration through the SH3 domain.39,40 However, the relationship of these genes with muscle degeneration remains uncertain, requiring further research to confirm their role as specific targets for NIR-II imaging.
Sidt2, encoding the lysosomal membrane protein Sid1 transmembrane family member 2, plays a key role in lysosomal function, maintaining lysosomal morphology, and facilitating RNA/DNA degradation.41 It has been implicated in mitochondrial quality control and autophagy in skeletal muscle.42,43 Our findings support Sidt2 as a reliable and potentially specific marker for paraspinal muscle degeneration, making it a relevant target for nanoprobes to localize degenerative muscle tissue.
Design and Parameter Adjustment of the Lanthanide Nanoprobe NaYbF4:x%Er@NaYF4:x%Yb@NaYF4 with a Core@Shell Structure
Ytterbium (Yb) in the core serves as a sensitizer and energy transfer ion, absorbing 980 nm excitation energy, while erbium (Er) emits 1525 nm near-infrared fluorescence. The inner shell structure uses Yb3+ for energy transfer, while the outer NaYF4 shell reduces fluorescence quenching (Scheme 1).
Concentration of Doped Lanthanide Ions in Luminescent Nuclei
When the concentration of rare-earth ions in the luminescent core-shell structure changes, the ion distance and energy transfer efficiency, as well as cross-relaxation efficiency, are affected, resulting in an adjustable fluorescence lifetime. For NaYbF4:x%Er@NaYF4:x%Yb@NaYF4 core@shell structure, the concentrations of Er3+ and Yb3+ ions in the luminescent core were optimized.
Initially, Er ion concentrations were varied (1%, 5%, 10%, 15%, 20%, and 40%), and the fluorescence emission spectrum and lifetime of the nanoparticles were measured. The fluorescence peak at NIR-II was centered at 1525 nm for all concentrations, with the highest intensity at 20% Er concentration. Fluorescence lifetime increased at 1% and 5% Er, but differences diminished at 10%, 15%, and 20% Er. After evaluating the fluorescence parameters, a 20% Er concentration was selected for further experiments. Transmission electron microscopy (TEM) confirmed that the nanoparticles retained a regular pentagonal structure, uniform distribution, and stable size without aggregation (Figures 3A and S7).
 |
Figure 3 Design and parameter adjustment of the lanthanide nanoprobe NaYbF4:x%Er@NaYF4:x%Yb@NaYF4 with a Core@Shell structure. (A) Concentration of Er ions in luminescent nuclei. (B) Concentration of Yb ions in luminescent nuclei. (C) Measuring the Yb ion concentration in the inner shell structure to adjust the energy transfer distance. (D) Adjusting the thickness of the outer inert layer in the core@shell structure. Note: The meaning of each figure from left to right is the summary of fluorescence intensity of nanoparticles in different wavelength bands at different concentrations or thicknesses, the summary of fluorescence intensity in the specific wavelength range with different concentrations or thicknesses, the summary of fluorescence lifetime in the specific wavelength range with different concentrations or thicknesses, TEM image with a selected concentration or thickness, the summary table of fluorescence parameters of nanoprobe with different concentrations or thicknesses. The adopted parameters for nanoprobes are highlighted in red within the table. |
Next, at 20% Er ion concentration, Yb ion concentration was varied (10%, 20%, 40%, 55%, 65%, and 80%). The fluorescence peak was centered at 1522 nm, with the highest intensity at 55% and 80% Yb. Fluorescence lifetime was longer at 10% and 55% Yb, but shorter at 20% and 80% Yb. Based on these results, a 55% Yb concentration was chosen for further experiments. TEM confirmed the nanoparticles maintained a regular pentagon shape with a uniform distribution and stable size at this concentration (Figures 3B and S8).
Measuring the Yb Ion Concentration in the Inner Shell Structure to Adjust the Energy Transfer Distance
The core-shell structure of the nanoprobe allows precise control over the energy transfer distance, which in turn regulates the fluorescence lifetime. Modifying the thickness of the inner shell or adjusting the concentration of energy-transferring Yb³⁺ ions in this layer enhances the fluorescence absorption of the luminescent core. In this study, we focused on adjusting the Yb³⁺ ion concentration in the inner shell to optimize the fluorescence intensity of Er³⁺ ions.
Yb ion concentrations of 20%, 40%, 60%, 80%, and 100% were tested in the inner shell, and the fluorescence emission spectrum and lifetime were measured. The fluorescence intensity at 1522 nm in the NIR-II region increased with higher Yb concentrations, peaking at 100% Yb, followed by 80%. Fluorescence lifetime measurements revealed no significant change at 20%, 40%, 60%, or 80% Yb, but a substantial decrease occurred at 100% Yb. There was no significant difference in the fluorescence lifetime when the Yb ion concentration was 20%, 40%, 60%, or 80%, but the fluorescence lifetime significantly decreased when the Yb ion concentration was 100%. The fluorescence parameters of nanoparticles with different Yb concentrations are summarized in a table, and after various fluorescence parameters were considered, a Yb ion concentration of 80% was chosen as the subsequent condition. TEM analysis showed that at 80% Yb concentration, the nanoparticles maintained a regular pentagonal structure with uniform distribution, stable particle size, and no aggregation or sedimentation (Figures 3C and S9).
Adjusting the Thickness of the Outer Inert Layer in the Core@shell Structure
The thickness of the outer inert layer in the core@shell structure can influence the distance between luminescent ions, sensitizing ions, and surface quenching centers, thereby regulating the fluorescence lifetime. For the NaYbF4:x%Er@NaYF4:x% Yb@NaYF4 core@shell structure, we varied the thickness of the outer NaYF4 layer to adjust the fluorescence intensity and lifetime of the nanoparticles.
The outer inert layer thicknesses were 4 nm, 6 nm, 9 nm, 12 nm, and 16 nm, and fluorescence emission spectra and lifetimes were measured for each. The fluorescence intensity at 1522 nm in the NIR-II region peaked when the outer layer thickness was 9 nm, followed by 6 nm. The longest fluorescence lifetime was observed for nanoparticles with a 16 nm thick outer layer, while 12 nm and 9 nm layers showed similar, but slightly shorter, lifetimes. A summary of fluorescence parameters for nanoparticles with different outer layer thicknesses is presented in Figure 3D. After considering all parameters, a 9 nm outer inert layer was chosen for further studies. TEM analysis confirmed that nanoparticles with this thickness maintained a regular pentagonal structure, uniform distribution, and stable particle size, with no aggregation or sedimentation (Figures 3D and S10).
After optimizing the four parameters, NaYbF4:20%Er@NaYF4:80%Yb@NaYF4 was selected for the study. The innovation of this probe lies in the high absorption cross-section of Yb ions in the inner shell, enabling energy transfer to the core. This enhances Er ion luminescence efficiency, reduces nonradiative relaxation losses on the surface, minimizes quenching effects from dangling bonds and polymer vibrations, and improves down-conversion efficiency. Additionally, the stability of the inert NaYF4 shell on the outer layer effectively suppresses surface quenching, passivates lattice defects, isolates adverse external factors, and improves quantum conversion efficiency, extending the fluorescence lifetime.
Characterization of the Core@Shell Lanthanide Nanoprobe NaYbF4:20%Er@NaYF4:80%Yb@NaYF4
We conducted a series of characterization tests on the probe. Energy dispersive spectroscopy (EDS) was performed to analyze the elements in the material (Figure 4A and Table S6). The results showed that the probe contained seven elements: C, N, O, Na, F, Er, and Yb. Er was primarily concentrated in the core, while Yb was distributed across the core and first shell. Fluorine (F) had the largest distribution range, present in all three layers of the nanoprobe. The elemental distribution aligned with the probe’s structural design.
 |
Figure 4 Characterization of the Core@Shell lanthanide nanoprobe NaYbF4:20%Er@NaYF4:80%Yb@NaYF4. (A) EDS detection results and schematic diagram of nanoprobes. (B) Particle size distribution detection results of nanoprobes loaded with and without Sidt2 antibodies. (C) Zeta potential detection results of nanoprobes loaded with and without Sidt2 antibodies. (D) Particle size stability test results of nanoprobes. |
Next, we measured the particle size of the probes with and without the Sidt2 antibody. The results (Figure 4B) indicated that the average particle size of the Sidt2 antibody-loaded nanoparticles was 68.28 nm (range: 65.68–70.54 nm), while the average size of the non-loaded nanoparticles was 65.50 nm (range: 64.23–65.73 nm). Regardless of antibody loading, the nanoparticles showed uniform size distribution and good homogeneity. The zeta potential of the nanoparticles decreased after loading the Sidt2 antibody (Figure 4C), confirming successful antibody loading.
Finally, the stability of the particle size over time was evaluated at six time points: 0 h, 4 h, 8 h, 12 h, 24 h, and 48 h. The particle size remained stable, with minimal fluctuation, indicating that the nanoparticles exhibited good stability (Figure 4D).
Lanthanide-doped nanoprobes have been widely used in NIR-II animal imaging experiments and exhibit many unique advantages, such as narrow emission bands, deep penetration, long emission lifetimes, good photostability, low toxicity and low autofluorescence effect.44–47 However, due to the small absorption cross section and low photoluminescence quantum efficiency of this probe, the fluorescence intensity generated in vivo is low, which limits its further development in the field of NIR-II in vivo imaging.20 The core@shell structure of an efficient multilayer energy transfer channel constructed through nanostructure engineering is a solution to this problem. By optimizing the structure of the nanoparticles and dye sensitization, the fluorescence intensity and fluorescence lifetime can be finely adjusted to meet the imaging requirements of different tissue depths, and lanthanide nanoprobes with higher brightness can be generated to improve the sensitivity and contrast of imaging, which is easier for clinical conversion.
Cytotoxicity and Biotoxicity of the Lanthanide Nanoprobe
One of the key advantages of NIR-II in vivo fluorescence imaging is its noninvasive nature. To ensure the safety of the lanthanide nanoprobe NaYbF4:20%Er@NaYF4:80%Yb@NaYF4, we conducted cytotoxicity and biotoxicity studies to confirm that it does not cause harm at the cellular or organ level.
Firstly, we performed calcein-AM/PI fluorescence staining to visualize live and dead cells after 24 and 48 hours of nanoprobe incubation. As shown in Figures 5A and S11, no significant decrease in live cell numbers and no significant increase in dead cells were observed. Quantitative analysis of the live/dead cell ratio (Figure 5B) confirmed that there were no significant differences between the control and experimental groups at any time point (P > 0.05). These complementary experiments further verified the low cytotoxicity of the nanoprobe, supporting its safety for in vivo NIR-II fluorescence imaging in mice.
 |
Figure 5 Cytotoxicity and biotoxicity of the lanthanide Nanoprobe. (A) Results of Calcein Am/PI fluorescence staining experiment after co-incubation of nanoprobes with cells. (B) Quantitative analysis results of Calcein Am/PI fluorescence staining experiment after co-incubation of nanoprobes with cells. (C) Cell viability test results after co-incubation of nanoprobes with cells. (D) The detection results of cell proliferation ability after co-incubation of nanoprobes and cells. (E) HE staining results of organ tissue slices from mice after 24h of imaging experiment. Note: The quantitative data in (B–D) have all been statistically tested, and their differences were not statistically significant (P>0.05). |
Additionally, we assessed the viability and proliferation of C2C12 myoblasts using the Cell Counting Kit-8 (CCK-8) assay (Figure 5C). Results showed that increasing nanoprobe concentration did not significantly reduce cell viability. At a concentration of 200 μg/mL, the proliferation ability of cells remained unaffected compared to the control group. Statistical analysis of the data (Figure 5C, D and Tables S7 and S8) confirmed that the differences were not statistically significant (P > 0.05), indicating low cytotoxicity and good safety.
Next, we performed histological analysis using H&E staining on tissue sections from major organs, including the lung, liver, spleen, kidney, and heart, of mice injected with nanoprobes via the tail vein (Figure 5E). H&E staining of the lung, liver, spleen, kidney, and heart tissues showed no pathological changes, indicating that the nanoprobe did not induce acute inflammation or organ damage. The absence of differences between the tissue sections of nanoprobe-injected and control mice further demonstrated that the nanoprobe does not cause biological toxicity in vivo.
After validating safety at the cellular and organ levels, we injected the lanthanide nanoprobe NaYbF4:20%Er@NaYF4:80%Yb@NaYF4 into mice. The probe showed no cellular or organ damage, highlighting the noninvasive nature of NIR-II in vivo fluorescence imaging.
Cellular Uptake of the Lanthanide Nanoprobe
A key objective of this study was to achieve targeted aggregation of the nanoprobes in degenerated paraspinal muscle tissue. To ensure effective uptake, we first performed confocal fluorescence microscopy on C2C12 myoblasts incubated with the probes (Figure 6A). Fluorescence overlap between nanoprobes and cells increased over time, which was confirmed by quantitative analysis of fluorescence intensity (Figure 6B).
 |
Figure 6 Cellular uptake of the lanthanide nanoprobe and NIR-II fluorescence imaging of mice in vivo. (A) Confocal fluorescence microscopy imaging of mice C2C12 myoblasts incubated with probes. (B) Results of confocal fluorescence microscopy imaging quantitative analysis of mice C2C12 myoblasts incubated with probes. (C) Flow cytometry results of mice C2C12 myoblasts incubated with probes. (D) NIR-II in vivo fluorescence imaging results in mice. (E) Results of quantitative analysis of fluorescence intensity in the left ROI region of mice NIR-II in vivo imaging. (F) Results of quantitative analysis of fluorescence intensity in the right ROI region of mice NIR-II in vivo imaging. Notes: **means P<0.01, ***means P<0.001, P<0.01, P<0.001 all indicate that the differences were statistically significant. |
We also performed flow cytometry to further evaluate nanoprobe uptake (Figure 6C). The results showed that the nanoprobe was quickly absorbed by cells, with fluorescence intensity gradually increasing as the incubation time extended. These findings confirmed that the nanoprobe exhibits good cell affinity and is efficiently taken up by C2C12 myoblasts, maintaining a high local concentration for prolonged periods, essential for NIR-II fluorescence imaging in degenerated paraspinal muscle.
NIR-II Fluorescence Imaging of Mice in vivo
We conducted in vivo imaging on mice with paraspinal muscle degeneration and control mice, both injected with 100 μL of Sidt2 antibody-loaded nanoprobes. NIR-II fluorescence imaging was performed at six time points (0 h, 0.5 h, 1 h, 2 h, 4 h, 6 h, 8 h) post-injection. Initial imaging (Figures 6D and S12) revealed strong fluorescence in the blood vessels, allowing clear visualization. Within 30 minutes, Sidt2 antibody-loaded nanoprobes accumulated in the major organs of control mice, while they began aggregating around the paraspinal muscles in the experimental group. At 2 hours, both groups maintained excellent fluorescence, but by 4 hours, the control group showed a decrease in fluorescence intensity due to probe elimination via the liver and kidneys. In contrast, the experimental group maintained strong fluorescence around the paraspinal muscle tissue, with the signal remaining visible even after 8 hours.
Fluorescence intensity measurements from the region of interest (ROI) in the degenerated paraspinal muscle (Figure 6E and F) showed NIR-II intensities of up to 200 a.u., with consistent fluorescence for 8 hours post-injection, demonstrating the probe’s stability and effectiveness for extended imaging.
These in vivo imaging results confirm that Sidt2 antibody-loaded nanoprobes effectively target degenerated paraspinal muscles, providing a significant and lasting NIR-II fluorescence signal. This capability, combined with the probe’s high sensitivity and specificity, positions NIR-II fluorescence imaging as a promising tool for clinical assessment of paraspinal muscle degeneration. findings and where the field is moving forward. The key findings, novelty, and future prospects of this study are summarized in Table 1.
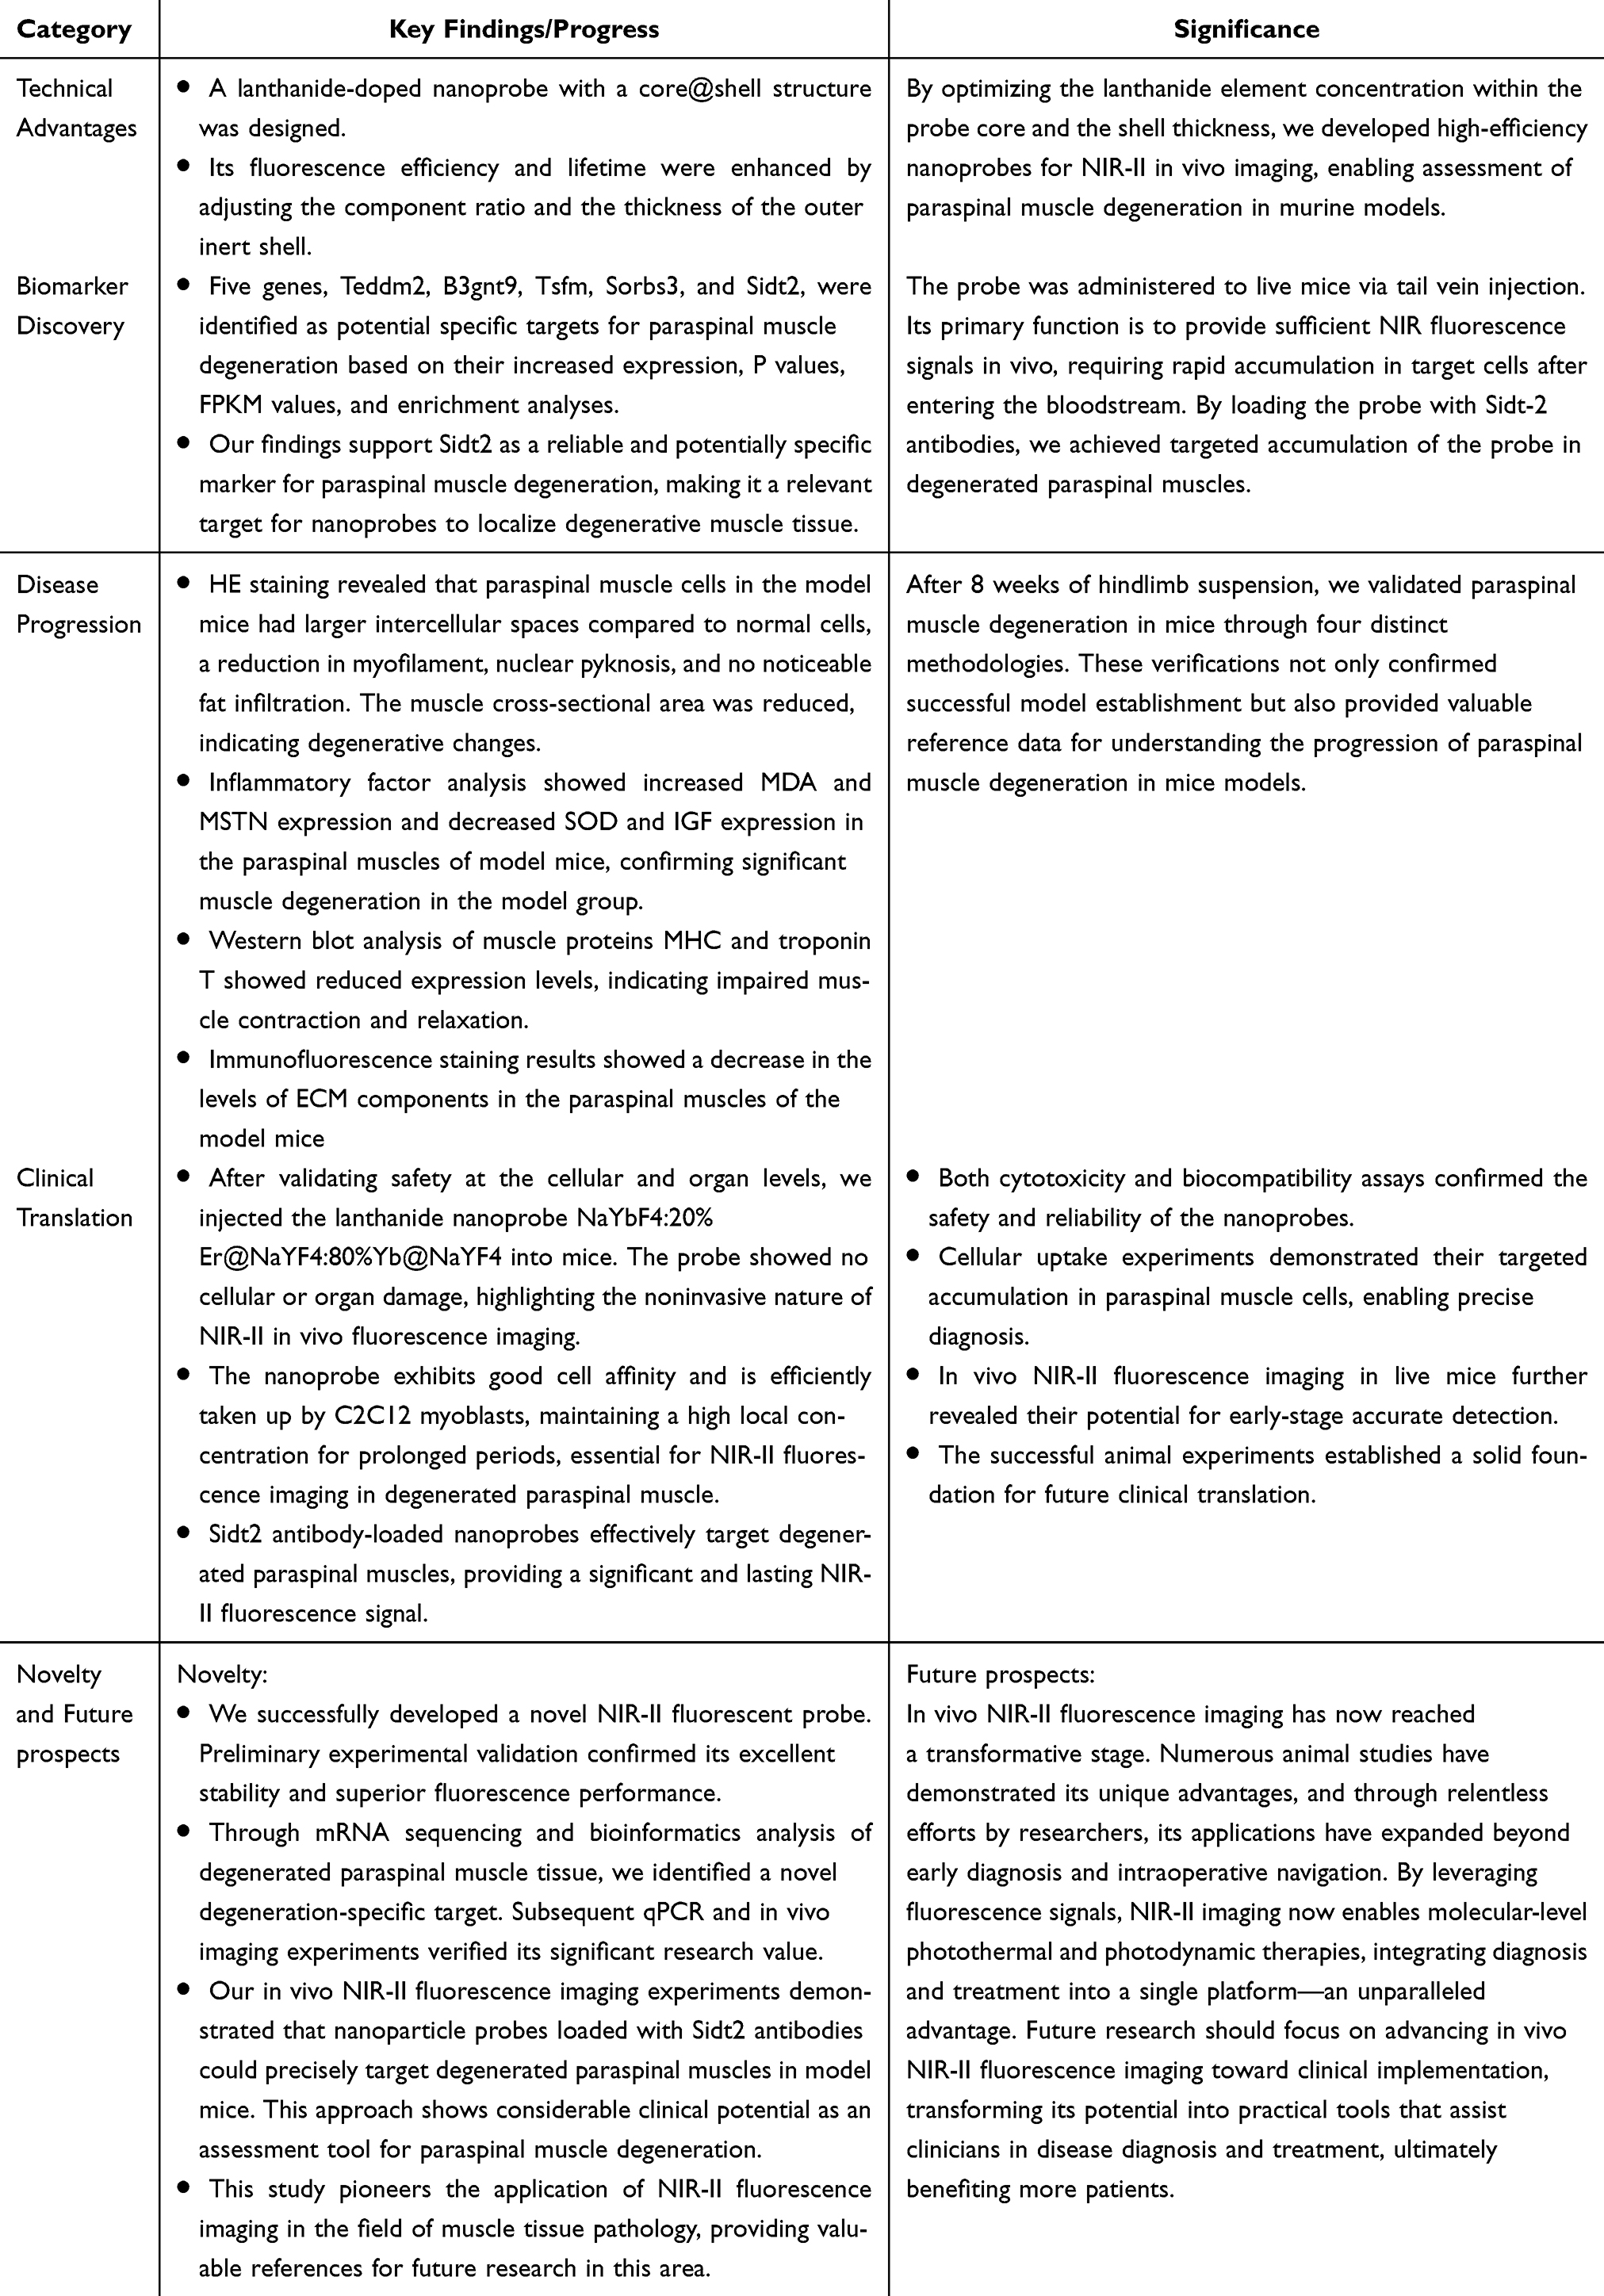 |
Table 1 The Findings, Novelty and Future Prospects of the Research |
Conclusion
Degeneration of the paraspinal muscles causes lumbar spine instability, leading to nonspecific low back pain, a significant concern in clinical practice. In this study, we developed a core@shell-structured lanthanide nanoprobe with an innovative design, optimizing key parameters in each layer to enhance its imaging capabilities. Multiple evaluations demonstrated that the nanoprobe exhibits low biological toxicity, high cell affinity, and excellent fluorescence performance. Notably, precise visualization of paraspinal muscle degeneration was achieved by targeting the autophagy lysosome core protein Sidt2. This is the first application of NIR-II fluorescence imaging to assess muscle tissue lesions, and the results strongly support advancing to the next phase, which involves using multifunctional probe technology to intervene in paraspinal muscle degeneration.
After decades of extensive research, various fluorescence imaging technologies have revolutionized traditional surgical approaches, bringing us closer to the goal of precision medicine. As an optical imaging method, NIR fluorescence imaging operates by using a near-infrared camera to capture NIR fluorescence signals emitted by targeted probes upon excitation, while normal tissues exhibit minimal background fluorescence. This enables high-contrast imaging. Moreover, due to reduced scattering of NIR-II fluorescence in biological tissues, it allows deeper penetration for fluorescence signal acquisition. However, NIR-II fluorescence imaging still faces two major challenges—limited available fluorescent probes and a narrow scope of clinical applications—that must be overcome to achieve true clinical translation.
In vivo NIR-II fluorescence imaging has now reached a transformative stage. Numerous animal studies have demonstrated its unique advantages, and through relentless efforts by researchers, its applications have expanded beyond early diagnosis and intraoperative navigation. By leveraging fluorescence signals, NIR-II imaging now enables molecular-level photothermal and photodynamic therapies, integrating diagnosis and treatment into a single platform—an unparalleled advantage. Future research should focus on advancing in vivo NIR-II fluorescence imaging toward clinical implementation, transforming its potential into practical tools that assist clinicians in disease diagnosis and treatment, ultimately benefiting more patients.
Experimental Section
Reagents, Materials and Facilities
Reagents, Materials
All chemical reagents and materials were purchased from Sinopharm Chemical Reagent Co., Ltd (Shanghai, China) and Gibco Ltd (California, USA) except as otherwise stated. Anti-COL-1, anti-COL-3 and anti-α-SMA were purchased from Proteintech (Wuhan, China). Anti-Sidt2 was obtained from Bioss Antibodies Ltd (Beijing, China). Calcein-AM/PI Cell Viability/Cytotoxicity Assay Kit and Cell Counting Kit-8 were purchased from Beyotime Biotechnology Ltd (Shanghai, China). Antigen repair solution, PBS buffer and DAPI were purchased from Ribiology Ltd (Shanghai, China).
Facilities
Transmission electron microscope (TEM) images were collected by HT-7700 TEM (Hitachi, Japan). Scanning electron microscope (SEM) images were obtained on a Gemini SEM450 (Zeiss, Germany). X-ray diffraction (XRD) profile was collected via Smartlab SE X-ray powder diffractometer (Rigaku, Japan). Fourier transform infrared (FT-IR) spectra were measured on a Nicolet iS50 (Thermo Fisher, USA). Absorption spectra were tested on a UV-2550 spectrophotometer (Shimadzu, Japan). Emission spectra were collected by FLS980 transient fluorescence spectrometer (Edinburgh, UK). Absorption of DNA, BSA, and so on, were collected by microplate detector. Fluorescence images of mice were collected by a near-infrared region II imaging system (PerkinElmer, USA).
Construction of a Mice Model of Paraspinal Muscle Degeneration
The experimental mice were male C57 mice, aged 5 weeks, purchased from Beijing Weitong Lihua Experimental Animal Technology Co., Ltd. The modeling period lasted for 8 weeks, and subsequent experiments were carried out after the mice models were generated. Ethical approval was attained from the biomedical research ethics committee of Inner Mongolia Medical University and adhered to ethical principles.
To prevent the hindlimbs of the mice from touching the ground, the tail was fixed and the heights of the hind legs were adjusted. This allowed the mice to land with its forelimbs while still being able to drink water and eat normally. Throughout the 8-week period of hind limb suspension, the mice were placed in a head-down position, with the forelimbs on the ground and the hind limbs suspended. Changes in the appearance, health status, normal diet, urine, and feces of the experimental mice were compared with those of the mice raised under normal conditions.
HE Staining
paraspinal muscles from normal mice and paraspinal muscle degeneration model mice were collected, labeled, and fixed in neutral formalin for 24 h. The tissue was then rinsed under running water to remove any remaining fixative solution. Subsequently, the paraspinal muscle tissue was dehydrated with increasingly concentrated alcohol in the following sequence: 75% alcohol for 4 h, 85% alcohol for 2 h, 90% alcohol for 2 h, 90% alcohol for 1 h, and absolute alcohol for 1 h. This was followed by treatment with xylene and paraffin for transparency and wax penetration. The paraffin-soaked tissues were embedded using an embedding machine and cooled in a refrigerator, and the wax blocks were trimmed after the paraffin solidified. Paraspinal muscle tissue sections were then obtained using a paraffin microtome. These sections were attached to glass slides using glycerol protein adhesive tablets and dried in a 60°C incubator.
For dewaxing, the paraffin tissue sections from normal mice and model mice were placed in xylene I for 10 min and xylene II for 5 min, respectively. The sections were then hydrated using a series of alcohol solutions of decreasing concentration, followed by repeated washing with distilled water.
Next, the paraffin sections were subjected to staining as follows: the sections were immersed in hematoxylin staining solution for 15 min, rinsed with running water for 5 min, differentiated with 1% hydrochloric acid alcohol for 5s, rinsed with running water for 3 min, and stained with 1% eosin alcohol for 1 min. Afterward, the sections were washed with distilled water for 2 min to complete the staining process. Dehydration was performed once again.
Following dehydration, the sections were sequentially immersed in xylene I for 5 min and xylene II for 5 min to make the paraffin-embedded tissue sections transparent. Excess liquid was then removed by wiping. A suitable amount of neutral gum was added dropwise, and the slices were sealed for later use.
Detection of Inflammatory Factors
The Eliza method was utilized to detect inflammatory factors, and the entire experimental procedure followed the kit instructions.
Western Blot Analysis
An appropriate amount of cracking solution was prepared, and PMSF was added within the first few minutes of use, ensuring a final concentration of 1 mm PMSF. The culture medium was removed from the 6-well plate. The remaining culture medium in the plate was removed by adding 2 mL of 1× PBS to each well, after which the supernatant was discarded. Two hundred microliters of cracking solution was added to each well, and the plate was gently shaken to ensure full coverage. The plate was incubated at 4°C for 10 minutes. The cells were scraped off using a cell scraper or the tip of a pipette gun and transferred to a 1.5 mL EP tube kept at 4°C for 10 minutes. The tube was centrifuged at 12000 rpm for 15 minutes, the supernatant was extracted, and the protein extraction process was completed.
The optimal quantity of BCA working solution was prepared based on the number of samples by combining 50 volumes of BCA reagent A with 1 volume of BCA reagent B (50:1 ratio) with thorough mixing. Following the BCA quantitative method, the wells were prepared to create standard curves. Two microliters of sample was added to the wells, and the volume was increased to 20 μL using PBS solution. Next, 200 mL of the BCA working solution was added to each well and incubated at 37°C for 20 minutes until a visible color gradient formed. Subsequently, the A562 cell concentration was measured, and the protein concentration was determined using a standard curve.
To prepare the sample solution, the sample was mixed with a 4:1 ratio of 5X loading buffer and boiled for 10 minutes. The prepared sample, along with a protein marker ranging from 10–180kDa, were applied separately. For the electrophoresis procedure, the electrophoresis apparatus was used to run the sample at a constant voltage of 80 V until the dye was close to the top of the gel. Then, electrophoresis was continued at a constant voltage of 120 V until the sample reached the bottom of the bromophenol blue gel.
The gel was removed, and all concentrated gel was extracted. The gel was submerged in transfer buffer for 5 minutes. To prepare the films, the NC film was immersed in transfer buffer for a few seconds. The transfer interlayer was assembled in the following sequence: foam, filter paper, gel, transfer film, filter paper, and foam. The transfer clip was inserted into the transfer tank, ensuring that the gel side of the clip faced the cathode (-) and the membrane side faced the anode (+). An appropriate amount of buffer was added to the tank to fully submerge the clip. The film transfer device was placed in ice water, and the power supply was turned on at 350 mA for 2 hours. Once protein transfer was complete, the transfer clamp was removed from the tank, the transfer stack was carefully opened using tweezers, and the membrane was rinsed with double distilled water. The membrane was placed in the reaction chamber with the blot protein side facing upward. Then, 0.5 mL of Ponceau red staining solution was added, and the cells were incubated for 30 seconds to observe the transfer effect. The dye solution was removed, the membrane was washed with double distilled water three times for 5 minutes each, and the protein imaging step was completed.
To freshly prepare the blocking solution, skim milk powder was added to Tris-buffered saline with Tween-20 (TBST) to a final concentration of 5% (w/v). For blocking, the membrane was immersed in blocking solution and shaken at room temperature for 1 hour. The primary antibody was diluted and incubated with the membrane overnight at 4°C. The membrane was washed three times with TBST for 10 minutes each. The diluted secondary antibody (of mice origin) was added and incubated at room temperature for 1 hour. The membrane was washed three times with TBST for 10 minutes each. After the membrane was washed, the ECL reagent was prepared by mixing solution A and solution B at a 1:1 ratio. The membrane was placed in a fluorescence chemiluminescence imager, the luminescent solution was applied, three exposures were performed, and the overlapping values from the three exposures were selected.
Immunofluorescence Detection
Three normal mice and three paraspinal muscle degeneration mice were selected. Paraffinized and hydrated paraffin sections were stained with HE. Paraffin tissue sections were placed in a recovery box filled with EDTA (pH 9.0) antigen recovery solution and heated in a microwave oven for antigen recovery. After natural cooling, the tissue sections were placed in PBS (pH 7.4) buffer, shaken and washed on a decolorizing shaker 3 times for 5 min each. Paraffin tissue sections were dried, and a circle was drawn around the tissue to be observed with a histochemical pen. Next, 3% BSA was added to the circle to evenly cover the tissue, which was then blocked at room temperature for 30 min.
After blocking, the blocking solution was shaken, PBS and the prepared primary antibody were added dropwise to the tissue sections, and the sections were incubated overnight at 4°C in a wet box. The paraffin-embedded tissue sections were placed in PBS (pH 7.4), shaken and washed 3 times on a decolorizing shaker for 5 min each. After the tissue sections were dried, the secondary antibody corresponding to the species of primary antibody was added to the circle, and the tissues were covered for observation. The mixture was incubated for 50 min at room temperature in the dark, and the above steps were repeated.
The cells were shaken and washed with PBS (pH 7.4) on a decolorizing shaker 3 times for 5 min each. After shaking and drying, DAPI staining solution was added to the sections, which were incubated for 10 min at room temperature in the dark. The tissue sections were placed in PBS (pH 7.4) buffer, shaken and washed 3 times on a decolorizing shaker for 5 min each. After drying, the slides were mounted with anti-fluorescence quenching mounting solution. The tissue sections were observed under an inverted fluorescence microscope, and images were collected. (UV excitation wavelength, 330–380 nm; emission wavelength, 420 nm; FITC green excitation wavelength, 465–495 nm; emission wavelength, 515–555 nm; CY3 red excitation wavelength, 510–560 nm; emission wavelength, 590nm)
mRNA Sequencing
Paraspinal muscle tissue was quickly obtained from normal mice and paraspinal muscle degeneration model mice, washed with precooled PBS buffer solution or physiological saline to remove blood stains and dirt on the surface of the tissue, quickly divided into 50–100 mg pieces after surface liquid drying, and frozen in liquid nitrogen within 3 min to ensure the quality of RNA in the tissue cells and prevent changes in its expression caused by environmental changes. After quick freezing was completed, the sample was placed into a liquid nitrogen precooled RNase-free cryopreservation tube, cryopreserved at −80°C and ready for sequencing. The whole sequencing process adopted second-generation high-throughput sequencing technology.
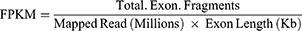
After sequencing was completed, the software HTSeq-count was used to compare the aligned data for RNA quantification, calculate the expression amount (count) of each molecule in each sample, and calculate the number of fragments per kilobase of exon model per million mapped reads (FPKM) value of each corresponding molecule in each sample. The FPKM value is a common method for measuring gene expression, which offsets the bias caused by differences in gene length.
The calculation formula is as follows:
Total Exon Fragments: Number of fragments aligned to gene exons.
Exon Length: The total length of the gene exon.
Mapped Reads: The total number of reads compared to the reference genome.
qPCR Experiments
One hundred milligrams of paraspinal muscle tissue from normal mice and model mice was placed into EP tubes without RNase, and 1 mL of TRIzol was added. The EP tube was homogenized at 60 hz for 120s, placed at room temperature for 5 min, and centrifuged at 4°C for 5 min with a centrifugation at 12000 × g. After centrifugation, the supernatant was aspirated and transferred to a new RNase-free centrifuge tube. The precipitate was not aspirated, chloroform was added to the centrifuge tube at 15 times the volume of TRIzol, the mixture was shaken vigorously for 15s, and the mixture was allowed to stand at room temperature for 5 min. After the mixture was fully emulsified without phase separation, it was centrifuged at 4°C with a centrifugation at 12000 × g for 15 min. After centrifugation, the centrifuge tube was carefully removed, and the homogenate was divided into three layers, namely, a colorless supernatant layer, a white protein layer in the middle layer, and a colored lower organic phase. The supernatant was aspirated into new centrifuge tubes, and the white intermediate layer was not aspirated. An equal volume of isopropyl alcohol was added to the centrifuge tube, mixed well in the centrifuge tube, and allowed to stand for 10 min at 15–30°C. After centrifugation was performed again with a centrifugal force of 12,000 × g for 10 min, a drop-shaped precipitate appeared at the bottom of the test tube. The supernatant was carefully discarded, the sample was centrifuged at low speed for 5s, and the residual isopropanol was removed with a pipette gun equipped with a 10 μL tip. One milliliter of 75% ethanol was added along the wall of the centrifuge tube, the wall of the centrifuge tube was slowly inverted, the tube was centrifuged at 4°C for 5 min at a centrifugation speed of 12000 g, the 75% ethanol was discarded, the tube was centrifuged again at low speed for 5s, and the residual 75% ethanol was aspirated with a pipette gun equipped with a 10 μL pipette tip. The mixture was allowed to dry at room temperature for 2–3 min, 20 μL of sterile DEPC water was added to dissolve the precipitate, and the bottom of the EP tube was gently tapped with a fingertip until the precipitate was completely dissolved. The ratio of OD260/OD280 was 1.91, which indicated that the RNA extracted was of high purity and did not contain protein or DNA residues.
The template RNA/primer mixture was prepared in a 0.2 mL RNase-free EP tube. The RNase-free EP tube prepared with the mixture (see Table S5 for the detailed reaction mixture formula) was placed at 37°C for 15 min, heat treated at 85°C for 5s, and stored at 4°C for 60 min. Then, 180 μL of ultrapure water was added to dilute the obtained cDNA solution for later use. This solution can be directly used to synthesize 2nd-strand cDNA or for PCR amplification and can be stored at −20°C. The PCR mixture was prepared in a PCR tube (see Table S5 for the detailed reaction mixture recipe) and prepared on ice. The above PCR mixture was mixed well, and 3 reaction samples were prepared for each sample as a duplicate control.
The following PCR program was used: Stage 1, predenaturation at 95°C for 30s; Stage 2, PCR at 95°C for 5s, 60°C for 34s for a total of 40–45 cycles; and Stage 3, dissociation curve at 95°C for 15s, 60°C for 60s, 95°C for 15s. PCR was then performed. The 2−ΔΔCt method was used to calculate the relative expression of differentially expressed genes.
Synthesis of the Lanthanide Nanoprobe with a Core@Shell Structure
β-NaYF4:x%Ln (Ln=Er, Yb)
0.4mmol Y (CH3CO2)3·4H2O and Ln (CH3CO2)3·4H2O were added into a flask which contained OA (3.0 mL) and ODE (7.0 mL), and the temperature was increased to 140°C under vacuum condition to be formed a transparent solution, furthermore the temperature was cooled down. After that 5mL MeOH with 1.6 mm NH4CL and 1mM NaOH were added to the above solution at the room temperature. The solution was continued stirring for 1h at 50°C, followed by warmed up to 100°C under vacuum condition to remove the methanol and water. Next, the mixture was heated to 290°C (~10°C/min) under argon temperature for 90 min, and then the solution was cooled down to room temperature. After that, an equal amount of ethanol was added to precipitate the nanoparticles, The precipitate was washed twice with ethanol and stored in cyclohexane.
β-NaYF4:x%Yb,y%Er@NaYF4:z%Yb
3 mL of above cyclohexane solution (0.1 M) was mixed with 4.8 mL OA and 7.2 mL ODE in a flask, in where the mixture was pumping for 30 min at 100°C to remove the cyclohexane, air and water. Next, the mixture was heated to 280°C (~20°C/min) under argon temperature, meanwhile the shell precursors composed of Ln (0.1 M) and Na-TFA OA (0.4 M) were added. Finally, an equal amount of ethanol was added to precipitate the nanoparticles with a Core@Shell structure, The precipitate was washed twice with ethanol and stored in cyclohexane.
β-NaYF4:x%Yb,y%Er@NaYF4:z%Yb@ NaYF4
The detailed process was described as 1.2.2 except of shell precursors were changed to 0.05mmol Na-TFA and 0.05mmol Y-TFA.
Water-Soluble Modification
The synthesized oleic acid stripped DCNPs were dispersed in 10mL of deionized water, and then 10 mL of NH2-PEG5000-SH (200 mg, 40 μmol) was added. After Stirring at room temperature for 24 h, the rest of PEG was removed by centrifugation (13000r/min, 20 min). The purified NH2-PEG-DCNPs were redispersed in 10mL of deionized water.
Targeting Modification
EDC (125 μmol) and NHS (210 μmol) were added to anti-SIDT2 (3 μmol) and incubated for 10 min at room temperature. After that, 0.03 μmol NH2-PEG-DCNPs were added and stirred for 24 h at room temperature. After removing the rest of EDC, NHS, and antibodies, the centrifuged nanoparticles (DCNPs-SIDT2) were redispersed in water for subsequent cellular/animal experiments.
TEM Detection
When the nanoprobe parameters were adjusted, the nanoprobe sample with the adjusted lanthanide content of the nuclear shell layer and the thickness of the outer inert layer was mounted on a TEM sample carrier. After the microscope was focused to obtain a clear image, proper electron beam energy was selected according to the characteristics of the sample, the magnification was set, the microscope was placed in transmission mode, the sample was exposed, the obtained image was recorded and stored, and the contrast and brightness were adjusted to improve the image quality.
Energy Dispersive Spectroscopy (EDS) Detection
After the nanoprobe parameters were adjusted, the nanoprobe samples were put into an EDS tester, the instrument parameters were debugged, the test type was determined, the scanning image was uploaded, the scanning elements were confirmed, the components were calculated, the EDS reports were outputted, and the original spectral data were exported.
Particle Size, Zeta Potential and Stability of the Core@shell Lanthanide Nanoprobe NaYbF4:20%Er@NaYF4:80%Yb@NaYF4
One milliliter of centrifuged NaYbF4:20%Er@NaYF4:80%Yb@NaYF4 nanoparticles was re-suspended in ultrapure water, and the particle size and zeta potential of the nanoparticle solution were measured using DLS. The particle size of the nanoparticles was measured at 6 time points (0 h, 4 h, 8 h, 12 h, and 24 h), and a curve was drawn to evaluate the particle size stability of the nanoparticles.
Cell Viability and Cell Proliferation
First, the cells in the culture flask were observed under a microscope. When the degree of cell growth and fusion was ≥80% and the cells were in good condition, C2C12 mice myoblast cells were plated in 96-well plates at a density of approximately 5000 cells/well. Two hundred microlitres of culture medium was injected into each well, and the culture was continued at 37°C, a CO2 content of 5%, and saturated humidity.
After the cells had completely adhered to the wall, the culture medium in the 96-well plate was aspirated by a pipette and replaced with fresh medium. Moreover, different concentrations of nanoprobes were added to the medium, and the concentration gradient was set to 0, 25, 50, 100 and 200 μg/mL. The nanoprobes were incubated with C2C12 mice myoblasts for the same time to detect cell activity. In addition, C2C12 mice myoblasts were incubated with 200 μg/mL nanoprobes for 0 h, 4 h, 8 h, 12 h or 24 h to detect cellular proliferation.
At the set time points, 100 μL of culture medium in each well was pipetted and discarded, 20 μL of CCK-8 solution was added, and the incubation was continued for 2 h in a cell incubator at 37°C and a CO2 concentration of 5%. The microplate reader was preheated in advance, the absorbance was measured at OD450, and the value was recorded.
Calcein Am/PI Fluorescence Staining
C2C12 mice myoblasts were inoculated at a density of 1×10⁴ cells per well, and then, nanoprobes at a concentration of 200 μg/mL were added and incubated with the cells for a period. Then, 100 μL of calcein-AM/PI detection working solution was added at 0h, 24 h and 48 h. After the working solution was added, the cells were incubated at 37°C for 30 min in the dark. After incubation, the stained sections were observed under a fluorescence microscope. (Calcein AM shows green fluorescence, Ex/Em=494/517 nm; PI shows red fluorescence, Ex/Em=535/617 nm)
Confocal Microscopy Imaging
According to the excitation and emission wavelengths of the fluorescent probe, the excitation light, excitation light power, spectral filter and emission filter were selected. The scanning method, scanning density (resolution), objective lens magnification and electron magnification were determined. The scanning range was selected, the appropriate pinhole size was selected according to the preparation quality of the sample, the laser tube voltage, photomultiplier tube power and noise reduction were adjusted, and the optimal conditions were achieved. Finally, the cutting range of the light (ie, the thickness of the scanned sample), the starting position and the end were determined. Then, the images were obtained and saved.
Flow Cytometry
C2C12 mice myoblasts were inoculated and cultured at a density of 4×10⁵ cells per well. Nanoprobes labeled with FITC at the same concentration used for in vivo NIR-II fluorescence imaging were added to the wells and incubated with the cells for 5 time points, namely, 0 h, 2 h, 4 h, 6 h, and 8 h. When the nanoprobes and cells reached the predetermined incubation time, they were digested and separated using trypsin and stored on ice, and the uptake of the nanoprobes by the cells was detected as soon as possible using a flow cytometer. (FITC: Ex/Em=495/520 nm)
In vivo NIR-II Fluorescence Imaging in Mice
The mice were anesthetized by intraperitoneal injection of 10% chloral hydrate via a 1mL syringe. After the mice stopped making noise, their backs were shaved. The shaving process avoided damaging the skin on the backs of the mice. The autofluorescence of the hair and the wounds on the backs of the mice interfered with the experimental results. The mice were placed into the tail vein injection cylinder fixator in turn according to the label. The experimental group of paraspinal muscle degeneration model mice and the control group of normal mice were injected with 100 μL of nanoprobe loaded with Sidt2 antibody. The limbs of the mice were fixed on the imaging plate with black medical tape to prevent the imaging position from changing due to slight movement of the mice during imaging. The survival status and anesthesia recovery status of the mice were examined. If necessary, the experimental mice were replaced, or anesthetics were injected. Six time points, 0 h, 0.5 h, 1 h, 2 h, 4 h, 6 h and 8 h after probe injection, were selected and placed into the NIR-II fluorescence imager for imaging. Images at the corresponding time points were recorded. During the whole imaging process, the survival and anesthesia recovery of the mice were checked many times to ensure that the mice were always alive during the whole experiment.
Statistical Analysis
The results are expressed as the mean±standard deviation (SD) unless otherwise stated. Student’s t test was used for two-group comparisons. P<0.05, P<0.01, and P<0.001 indicate that the differences were statistically significant. All the statistical calculations were performed using GraphPad Prism 9.5.0.
Data Sharing Statement
Data will be made available on request.
Ethics Approval and Consent to Participate
All animal experiments were approved by the Biomedical Research Ethics Committee of Inner Mongolia Medical University (YKD202401080) and conducted in compliance with China’s GB/T 35892-2018 Guidelines for the Review of Welfare and Ethics of Laboratory Animals.
Author Contributions
All authors made a significant contribution to the work reported, whether that is in the conception, study design, execution, acquisition of data, analysis and interpretation, or in all these areas; took part in drafting, revising or critically reviewing the article; gave final approval of the version to be published; have agreed on the journal to which the article has been submitted; and agree to be accountable for all aspects of the work.
Funding
The research was supported by Natural Science Foundation of Inner Mongolia Autonomous Region No. 2021BS08008, “Youth Science and Technology Talent Support Project” for Higher Education Institutions in Inner Mongolia Autonomous Region No. NJYT23054, General Program of Natural Science Foundation of Xinjiang Uygur Autonomous Region No. 2023D01C77 and Xinjiang Uygur Autonomous Region Tianshan Innovation Team Plan No. 2023D14005.
Disclosure
The authors declare that they have no known competing financial interests or personal relationships that could have appeared to influence the work reported in this paper.
References
1. GBD 2017 Disease and Injury Incidence and Prevalence Collaborators. Global, regional, and national incidence, prevalence, and years lived with disability for 354 diseases and injuries for 195 countries and territories, 1990–2017: a systematic analysis for the Global Burden of Disease Study 2017. Lancet. 2018;392(10159):1789–1858. doi:10.1016/s0140-6736(18)32279-7
2. Jia N, Zhang M, Zhang H, et al. Prevalence and risk factors analysis for low back pain among occupational groups in key industries of China. BMC Public Health. 2022;22(1):1493. doi:10.1186/s12889-022-13730-8
3. The Lancet Rheumatology. The global epidemic of low back pain. Lancet Rheumatol. 2023;5(6):e305. doi:10.1016/s2665-9913(23)00133-9
4. Knezevic NN, Candido KD, Vlaeyen JWS, Van Zundert J, Cohen SP. Low back pain. Lancet. 2021;398(10294):78–92. doi:10.1016/s0140-6736(21)00733-9
5. Maher C, Underwood M, Buchbinder R. Non-specific low back pain. Lancet. 2017;389(10070):736–747. doi:10.1016/s0140-6736(16)30970-9
6. Hu ZJ, He J, Zhao FD, Fang XQ, Zhou LN, Fan SW. An assessment of the intra- and inter-reliability of the lumbar paraspinal muscle parameters using CT scan and magnetic resonance imaging. Spine. 2011;36(13):E868–74. doi:10.1097/BRS.0b013e3181ef6b51
7. Keller A, Gunderson R, Reikerås O, Brox JI. Reliability of computed tomography measurements of paraspinal muscle cross-sectional area and density in patients with chronic low back pain. Spine. 2003;28(13):1455–1460. doi:10.1097/01.Brs.0000067094.55003.Ad
8. Sinelnikov A, Qu C, Fetzer DT, et al. Measurement of skeletal muscle area: comparison of CT and MR imaging. Eur J Radiol. 2016;85(10):1716–1721. doi:10.1016/j.ejrad.2016.07.006
9. Hebert JJ, Koppenhaver SL, Parent EC, Fritz JM. A systematic review of the reliability of rehabilitative ultrasound imaging for the quantitative assessment of the abdominal and lumbar trunk muscles. Spine. 2009;34(23):E848–56. doi:10.1097/BRS.0b013e3181ae625c
10. Ogon I, Takebayashi T, Takashima H, et al. Magnetic resonance spectroscopic analysis of multifidus muscles lipid content and association with spinopelvic malalignment in chronic low back pain. Br J Radiol. 2017;90(1073):20160753. doi:10.1259/bjr.20160753
11. Fischer MA, Nanz D, Shimakawa A, et al. Quantification of muscle fat in patients with low back pain: comparison of multi-echo MR imaging with single-voxel MR spectroscopy. Radiology. 2013;266(2):555–563. doi:10.1148/radiol.12120399
12. Kang H, Kang MW, Kashiwagi S, Choi HS. NIR fluorescence imaging and treatment for cancer immunotherapy. J Immunother Cancer. 2022;10(7). doi:10.1136/jitc-2022-004936
13. Liu HY, Wu PJ, Kuo SY, et al. Quinoxaline-based polymer dots with ultrabright red to near-infrared fluorescence for in vivo biological imaging. J Am Chem Soc. 2015;137(32):10420–10429. doi:10.1021/jacs.5b06710
14. Wang T, Chen Y, Wang B, Gao X, Wu M. Recent progress in second Near-Infrared (NIR-II) fluorescence imaging in cancer. Biomolecules. 2022;12(8). doi:10.3390/biom12081044
15. Gao Z, Ma T, Zhao E, et al. Small is smarter: nano MRI contrast agents - advantages and recent achievements. Small. 2016;12(5):556–576. doi:10.1002/smll.201502309
16. Malhotra K, Hrovat D, Kumar B, et al. Lanthanide-doped upconversion nanoparticles: exploring a treasure trove of NIR-mediated emerging applications. ACS Appl Mater Interfaces. 2023;15(2):2499–2528. doi:10.1021/acsami.2c12370
17. Wen S, Zhou J, Zheng K, Bednarkiewicz A, Liu X, Jin D. Advances in highly doped upconversion nanoparticles. Nat Commun. 2018;9(1):2415. doi:10.1038/s41467-018-04813-5
18. Shao W, Lim CK, Li Q, Swihart MT, Prasad PN. Dramatic enhancement of quantum cutting in lanthanide-doped nanocrystals photosensitized with an aggregation-induced enhanced emission dye. Nano Lett. 2018;18(8):4922–4926. doi:10.1021/acs.nanolett.8b01724
19. Song N, Zhou B, Yan L, Huang J, Zhang Q. Understanding the role of Yb(3+) in the Nd/Yb Coupled 808-nm-responsive upconversion. Front Chem. 2018;6:673. doi:10.3389/fchem.2018.00673
20. Jia Q, Ma L, Zhai X, et al. Orthogonal Near-Infrared-II imaging enables spatially distinguishing tissues based on lanthanide-doped nanoprobes. Anal Chem. 2020;92(21):14762–14768. doi:10.1021/acs.analchem.0c03383
21. Fan Y, Wang P, Lu Y, et al. Lifetime-engineered NIR-II nanoparticles unlock multiplexed in vivo imaging. Nat Nanotechnol. 2018;13(10):941–946. doi:10.1038/s41565-018-0221-0
22. Tian Y, Shen H, Li L, et al. Enhancing surgical outcomes: accurate identification and removal of prostate cancer with B7-H3-targeted NIR-II molecular imaging. Eur J Nucl Med Mol Imaging. 2024;51(9):2569–2582. doi:10.1007/s00259-024-06714-w
23. Wang B, Tang C, Lin E, et al. NIR-II fluorescence-guided liver cancer surgery by a small molecular HDAC6 targeting probe. EBioMedicine. 2023;98:104880. doi:10.1016/j.ebiom.2023.104880
24. Deng B, Wang Y, Bu X, et al. Sentinel lymph node identification using NIR-II ultrabright Raman nanotags on preclinical models. Biomaterials. 2024;308:122538. doi:10.1016/j.biomaterials.2024.122538
25. Ma H, Zhang X, Liu L, et al. Bioactive NIR-II gold clusters for three-dimensional imaging and acute inflammation inhibition. Sci Adv. 2023;9(31):eadh7828. doi:10.1126/sciadv.adh7828
26. Ge X, Su L, Yang L, et al. NIR-II fluorescent biodegradable nanoprobes for precise acute kidney/liver injury imaging and therapy. Anal Chem. 2021;93(41):13893–13903. doi:10.1021/acs.analchem.1c02742
27. Li C, Jiang G, Yu J, et al. Fluorination enhances NIR-II emission and photothermal conversion efficiency of phototheranostic agents for imaging-guided cancer therapy. Adv Mater. 2023;35(3):e2208229. doi:10.1002/adma.202208229
28. Liu L, Chen Y, Ye L, et al. NIR-II absorbed dithienopyrrole-benzobisthiadiazole based nanosystems for autophagy inhibition and calcium overload enhanced photothermal therapy. Small. 2024;20(37):e2309891. doi:10.1002/smll.202309891
29. Zeng S, Chen J, Gao R, et al. NIR-II photoacoustic imaging-guided oxygen delivery and controlled release improves photodynamic therapy for hepatocellular carcinoma. Adv Mater. 2024;36(4):e2308780. doi:10.1002/adma.202308780
30. Li W, Xin H, Zhang Y, et al. NIR-II fluorescence imaging-guided oxygen self-sufficient nano-platform for precise enhanced photodynamic therapy. Small. 2022;18(51):e2205647. doi:10.1002/smll.202205647
31. Ahmad SS, Ahmad K, Lee EJ, Lee YH, Choi I. Implications of insulin-like growth factor-1 in skeletal muscle and various diseases. Cells. 2020;9(8). doi:10.3390/cells9081773
32. Li L, Huang T, Yang J, et al. PINK1/Parkin pathway-mediated mitophagy by AS-IV to explore the molecular mechanism of muscle cell damage. Biomed Pharmacother. 2023;161:114533. doi:10.1016/j.biopha.2023.114533
33. Powers SK, Jackson MJ. Exercise-induced oxidative stress: cellular mechanisms and impact on muscle force production. Physiol Rev. 2008;88(4):1243–1276. doi:10.1152/physrev.00031.2007
34. Das DK, Graham ZA, Cardozo CP. Myokines in skeletal muscle physiology and metabolism: recent advances and future perspectives. Acta Physiol. 2020;228(2):e13367. doi:10.1111/apha.13367
35. Liu X, Gao Y, Long X, et al. Type I collagen promotes the migration and myogenic differentiation of C2C12 myoblasts via the release of interleukin-6 mediated by FAK/NF-κB p65 activation. Food Funct. 2020;11(1):328–338. doi:10.1039/c9fo01346f
36. Kuivaniemi H, Tromp G. Type III collagen (COL3A1): gene and protein structure, tissue distribution, and associated diseases. Gene. 2019;707:151–171. doi:10.1016/j.gene.2019.05.003
37. Wang Y, Mack JA, Maytin EV. CD44 inhibits α-SMA gene expression via a novel G-actin/MRTF-mediated pathway that intersects with TGFβR/p38MAPK signaling in murine skin fibroblasts. J Biol Chem. 2019;294(34):12779–12794. doi:10.1074/jbc.RA119.007834
38. Vedrenne V, Galmiche L, Chretien D, de Lonlay P, Munnich A, Rötig A. Mutation in the mitochondrial translation elongation factor EFTs results in severe infantile liver failure. J Hepatol. 2012;56(1):294–297. doi:10.1016/j.jhep.2011.06.014
39. Park SJ, Frake RA, Rubinsztein DC. Increased SORBS3 expression in brain ageing contributes to autophagic decline via YAP1-WWTR1/TAZ signaling. Autophagy. 2023;19(3):943–944. doi:10.1080/15548627.2022.2100106
40. Luo J, Li H, Xiu J, et al. Elevated ZNF704 expression is associated with poor prognosis of uveal melanoma and promotes cancer cell growth by regulating AKT/mTOR signaling. Biomark Res. 2023;11(1):38. doi:10.1186/s40364-023-00471-y
41. Song Y, Gu J, You J, et al. The functions of SID1 transmembrane family, member 2 (Sidt2). FEBS J. 2023;290(19):4626–4637. doi:10.1111/febs.16641
42. Wang L, Yu C, Pei W, et al. The lysosomal membrane protein Sidt2 is a vital regulator of mitochondrial quality control in skeletal muscle. FASEB J. 2021;35(4):e21223. doi:10.1096/fj.202000424R
43. Liu H, Jiang W, Chen X, et al. Skeletal muscle-specific Sidt2 knockout in mice induced muscular dystrophy-like phenotype. Metabolism. 2018;85:259–270. doi:10.1016/j.metabol.2018.05.004
44. Xu H, Yang Y, Lu L, et al. Orthogonal multiplexed NIR-II imaging with excitation-selective lanthanide-based nanoparticles. Anal Chem. 2022;94(8):3661–3668. doi:10.1021/acs.analchem.1c05253
45. Pei P, Hu H, Chen Y, et al. NIR-II ratiometric lanthanide-dye hybrid nanoprobes doped bioscaffolds for in situ bone repair monitoring. Nano Lett. 2022;22(2):783–791. doi:10.1021/acs.nanolett.1c04356
46. Xue Z, Zeng S, Hao J. Non-invasive through-skull brain vascular imaging and small tumor diagnosis based on NIR-II emissive lanthanide nanoprobes beyond 1500 nm. Biomaterials. 2018;171:153–163. doi:10.1016/j.biomaterials.2018.04.037
47. Mi C, Zhang X, Yang C, et al. Bone disease imaging through the near-infrared-II window. Nat Commun. 2023;14(1):6287. doi:10.1038/s41467-023-42001-2
 © 2025 The Author(s). This work is published and licensed by Dove Medical Press Limited. The
full terms of this license are available at https://www.dovepress.com/terms.php
and incorporate the Creative Commons Attribution
- Non Commercial (unported, 4.0) License.
By accessing the work you hereby accept the Terms. Non-commercial uses of the work are permitted
without any further permission from Dove Medical Press Limited, provided the work is properly
attributed. For permission for commercial use of this work, please see paragraphs 4.2 and 5 of our Terms.
© 2025 The Author(s). This work is published and licensed by Dove Medical Press Limited. The
full terms of this license are available at https://www.dovepress.com/terms.php
and incorporate the Creative Commons Attribution
- Non Commercial (unported, 4.0) License.
By accessing the work you hereby accept the Terms. Non-commercial uses of the work are permitted
without any further permission from Dove Medical Press Limited, provided the work is properly
attributed. For permission for commercial use of this work, please see paragraphs 4.2 and 5 of our Terms.