")
Back to Journals » International Journal of Nanomedicine » Volume 20
Nonshrinkable Thermosensitive Hydrogels Combined with Bispecific Anti-PSMA/CD3 T-Cell Engager for Effective Against Tumors in Mice Model
Authors Wei PS , Chou PY, Hsu HY, Chen M, Chen YJ, Tsai TH, Wen BY, Sheu MT, Chuang KH, Lin HL
Received 29 October 2024
Accepted for publication 27 February 2025
Published 12 March 2025 Volume 2025:20 Pages 3083—3111
DOI https://doi.org/10.2147/IJN.S496746
Checked for plagiarism Yes
Review by Single anonymous peer review
Peer reviewer comments 3
Editor who approved publication: Professor Farooq A. Shiekh
Nonshrinkable Thermosensitive Hydrogels for Tumor Immunotherapy – Video S2C [496746]
Views: 52
Pu-Sheng Wei,1,* Po-Yu Chou,1,* Hao-Yi Hsu,2 Michael Chen,3 Yi-Jou Chen,3 Tung-Han Tsai,1 Bang-Yu Wen,4 Ming-Thau Sheu,1 Kuo-Hsiang Chuang,3,5– 10 Hong-Liang Lin2,5
1School of Pharmacy, College of Pharmacy, Taipei Medical University, Taipei, Taiwan; 2School of Pharmacy, College of Pharmacy, Kaohsiung Medical University, Kaohsiung, Taiwan; 3Graduate Institute of Pharmacognosy, Taipei Medical University, Taipei, Taiwan; 4Department of Biotechnology and Pharmaceutical Technology, Yuanpei University of Medical Technology, Hsinchu, Taiwan; 5Drug Development and Value Creation Research Center, Kaohsiung Medical University, Kaohsiung, Taiwan; 6Program in Clinical Genomics and Proteomics, Taipei Medical University, Taipei, Taiwan; 7Ph.D. Program in Clinical Drug Development of Herbal Medicine, Taipei Medical University, Taipei, Taiwan; 8Traditional Herbal Medicine Research Center, Taipei Medical University Hospital, Taipei, Taiwan; 9Ph.D Program in Biotechnology Research and Development, Taipei Medical University, Taipei, Taiwan; 10The Ph.D. Program of Translational Medicine, Taipei Medical University, Taipei, Taiwan
*These authors contributed equally to this work
Correspondence: Kuo-Hsiang Chuang; Hong-Liang Lin, Email [email protected]; [email protected]
Purpose: CD3-based Bispecific T-cell engagers (BiTEs) are effective for solid tumors due to their tumor specificity and tissue penetration, but they face challenges like short half-lives and narrow therapeutic windows. Innovative delivery systems, like thermosensitive hydrogels, show the potential to enhance stability, sustained release, and therapeutic efficacy.
Methods: We developed PEGylated PLGA (PEG–PLGA) thermosensitive hydrogels with a nonshrinkable property (nsTPPgels) for effective controlled release and loaded them with bispecific anti-prostate surface membrane antigen (PSMA) Fab/anti-CD3 scFv T-cell engager (BiPTE) to form in situ drug deposits with a sustained-release profile after subcutaneous injection. Each group of hydrogels was first tested for differences in properties through rheological and in vitro drug release profiles. Meanwhile, in vivo pharmacokinetics, anti-tumor efficacy studies, and T-cell tracking studies were conducted to analyze the advantages of nsTPPgels included D2gel and DTgels.
Results: The cytotoxicity of BiPTE against PSMA-overexpressing tumor cells and the drug release functionality of nsTPPgels were validated in vitro. Rheological studies showed that both D2gel and DTgels remained in solution below 27 °C for easy injection and solidified at physiological temperatures to form localized depots for sustained BiPTE release. All nsTPPgels demonstrated a 5-day in vitro sustained release, prolonged elimination half-life, steady plasma BiPTE levels, and extended mean residence time. In an LNCaP-xenograft mouse model, tumor growth inhibition rates for BiPTE/DTgel-2, BiPTE/DTgel-2S, and BiPTE/D2gel were 74.3%, 96.1%, and 113.1%, respectively, compared to 35.6% for intravenous and 46% for subcutaneous BiPTE administration. Furthermore, all nsTPPgels effectively achieved T-cell recruitment to lymph nodes and tumor sites in tracking studies.
Conclusion: In conclusion, we developed relatively convenient injectable thermosensitive D2gel with a desirable gelation temperature window, which have the potential to be used for antibody drug delivery in several biomedical applications.
Keywords: Bispecific T-cell engager, thermosensitive hydrogel, nonshrinkable, in situ drug deposits, anti-PSMA, T-cell recruitment
Graphical Abstract:

Introduction
The advantages of using small-format cluster of differentiation 3 (CD3)-based bispecific T-cell engagers (BiTEs) to treat solid tumors include high tumor specificity, good tissue penetration, efficient immune synapses formation due to possible close contact between effectors (eg, T cells) and target cells, and the lack of need for co-stimulatory molecules.1 However, many bispecific antibody fragments, including CD3-based BiTEs such as blinatumomab, lack an Fc region, which results in a short serum half-life. Consequently, hematological cancer treatment requires continuous intravenous infusion for 24 days to maintain blood concentrations above the effective level and below the toxic level in order to avoid serious side effects, such as cytokine release syndrome, which can cause patient discomfort and additional medical expenses.2–4
Several reviews5–7 have reported that both recombinant and chemical approaches allow the modification of antibody fragments (eg, fragment antigen-binding [Fab], single-chain variable fragment [scFv] and variable fragment [Fv] regions) by fusing with the fragment crystallization (Fc) region, albumin, or anti-albumin Fv.8–13 These methods increase protein size by conjugation with polyethylene glycol (PEG),14 polysialic acid, N-(2-hydroxypropyl)methacrylamide and dextran,15,16 HESylation (hydroxyethyl starch [HES]),17 or GlycoTAIL18 to prolong circulation time.19 However, the extension of the half-life of these modified antibody fragments, as described above, is achievable through attachment or binding to high-molecular-weight carriers, but the higher hydrodynamic radius results in greater confinement in the vascular compartment and thus lower tissue distribution or lower infiltration into the solid tumor environment. As a result, on subcutaneous injection, the cleavable microsphere–scFv conjugate releases its protein cargo with a prolonged half-life comparable to that of most full-length mAbs (increased t1/2,β of about 2 days to 2 weeks), but in a form that has the high tissue distribution characteristic of smaller mAb fragments.20 Therefore, for treating solid tumors, CD3-based BiTEs with smaller mAb fragments are more beneficial as they show better tumor tissue distribution, thereby increasing uptake if they are transformed into or maintained in their original format after arriving at the solid tumor site.
In addition, some reviews have described subcutaneously injectable polymeric delivery systems for controlled release of pharmaceutical proteins, with a special focus on hydrogels.21–23 All concluded that the success of application of protein-loaded hydrogels in in vivo applications is primarily due to their possession of desirable features. For example, their porous structure is favorable for carrying protein drugs in large quantities and they provide an aqueous environment that helps preserve proteins in their active form and prevents denaturation.22 Moreover, these advanced controlled delivery systems can improve the unfavorable pharmacokinetics of proteins, which enhances their therapeutic effect. Specifically, the fluctuating plasma drug concentrations observed with traditional repeated bolus injections are avoided by using controlled-release hydrogels, which can potentially maintain drug levels within the therapeutic window and overcome risks associated with potentially toxic or ineffective drug concentrations.21 Overall, these approaches can provide the following benefits: (a) maintenance of plasma concentrations of protein drugs within the therapeutic window over an extended period; (b) protection of the active therapeutic agent from premature degradation; (c) enhancement of drug efficacy, while reducing side effects; and (d) avoidance of frequent administration and lowered drug dosage.24
Nonetheless, there are several challenges to the clinical translation of in situ injected hydrogels. A major obstacle is the high permeability of hydrogels, which may lead to rapid release of a substantial portion of the drug content. This phenomenon, known as “burst release”, could cause the drug concentration to exceed toxic levels within the body, resulting in ineffective treatment and adverse side effects.25 Therefore, various approaches have been explored to achieve sustained drug release from hydrogels while minimizing the burst effect. They include immobilization of protein drugs within gel matrices using a cleavable spacer and incorporation of biodegradable micro- and nanospheres as carriers for protein drugs.22 Generally, hydrogels with diffusion-controlled release mechanisms exhibit shorter release periods (t1/2 ≈ 1 day) and higher burst release. In contrast, hydrogels with degradation-controlled release mechanisms achieve longer release durations (greater than one week).26 However, in vivo burst release may be attributable to the gelation rate and possible shrinkage of the gel body after gelling in in situ injectable gelling systems. When the sol–gel transition is not immediate, the protein may prematurely leak into the surrounding tissue before complete gelation. In addition, gel body shrinkage can lead to the expelling of water, resulting in the burst release of proteins dissolved in the water.
A previous study27 demonstrated that an injectable in situ nonshrinkable PEGylated poly (lactide-co-glycolide) (PLGA) thermosensitive composite hydrogel (DTgel) system for controlled, sustained release of CD3-based BiTEs was capable of extending plasma half-life and maintaining steady lower blood levels of CD3-based BiTEs within the therapeutic window for efficacious therapy of solid tumors. This resolves the problem of limited clinical applications of bispecific anti-CD3 scFv T-cell/anti-EGFR Fab engager (BiTEE) with a short half-life and potential side effects. However, such in situ nonshrinkable DTgels are necessarily composed of methoxy poly (ethylene glycol) (mPEG)–PLGA (a diblock copolymer [DP]) and PLGA–PEG–PLGA (a triblock copolymer [TP]) to obtain thermosensitive properties with a sol–gel transition temperature at 28–34 °C that is desirable for injection. An animal pharmacokinetic study of subcutaneously injected BiTEE/DTgel thus obtained showed 2.0~3.5-fold prolongation of the half-life of BiTEE compared to intravenously injected BiTEE solution. Furthermore, injectable thermosensitive and non-shrinkable hydrogels used as an effective delivery system for macromolecules also possess several advantages:28 (1) the sol form at a temperature lower than room temperature can be easily and homogenously mixed with the lyophilized antibody powder during reconstitution; (2) a liquid state is maintained after reconstitution for easier injection; and (3) the nonshrinking character allows in situ formation of a persistent hydrogel with a controllable release rate that is adjustable by hydrogel strength.29
After subcutaneous administration of a therapeutic protein such as a monoclonal antibody with a larger molecular weight (> 16 kDa), convective processes created by the unidirectional lymphatic flow generate a pressure gradient that transports these larger molecular-weight proteins into lymphatic venules before entering systemic circulation or migrating to solid tumor sites. This is because “first-pass” immune cell interactions after subcutaneous administration of larger molecular-weight drugs are most likely to occur primarily around the injection site and during lymphatic transport. This process not only enhances systemic absorption and direct targeting of solid tumor sites, but also facilitates the action of CD3-based BiTEs armed with cytotoxic T lymphocytes (CTLs) when transported into lymphatic nodes, thereby increasing therapeutic efficacy.23,30
In this study, instead of using composite hydrogels consisting of DPgel and TPgel (DTgels), we established a rational design for a PEG–PLGA DP able to form a thermosensitive nonshrinkable hydrogel for delivering, via subcutaneous injection, another type of CD3-based BiTE, BiPTE (Bispecific anti-PSMA Fab/anti-CD3 scFv T cell Engager), which targeted PSMA-positive cancer cells for efficacious treatment of PSMA-positive solid tumors. Composite hydrogels (DTgels) composed of PEG–PLGA DP and PLGA–PEG–PLGA TP optimally developed in a previous study27 were included for comparison of in vitro physicochemical characteristics, rheology, and sustained-release profiles and in vivo pharmacokinetic profiles, safety, and tumor-inhibition efficacy in a xenograft mouse model.
Materials and Methods
The pLNCX vector was purchased from Clontech (Mountain View, CA, USA). Expi293 cells, Expi293 expression medium, ExpiFectamine, and a Pierce™ BCA protein assay kit were obtained from Thermo Fisher Scientific (Waltham, MA, USA). Methoxy PEG 550 (mPEG550), mPEG750, PEG1500, tin(II) 2-ethylhexanoate and bovine serum albumin (BSA) were procured from Sigma-Aldrich (St. Louis, MO, USA). Lactide and glycolide were obtained from Greensquare (Taoyuan, Taiwan). LNCaP (CRL-1740) and PC-3 (CRL-1435) were purchased from the American Type Culture Collection (ATCC, USA). Cell culture medium containing basic medium, Fetal Bovine Serum (FBS) and penicillin-streptomycin (10,000 U/mL) were all purchased from Sigma-Aldrich. 1.1′-Dioctadecyl-3,3,3′,3′-tetramethylindotricarbocyanine iodide (DiR) was bought from AAT Bioquest (Sunnyvale, CA, USA). Matrigel® matrix was purchased from Corning (Corning, NY, USA). Ficoll-Paque® PLUS and a HiTrap column were purchased from Cytiva (Marlborough, MA, USA).
Tissue Culture Studies Using LNCap as a PSMA-Overexpressing Cell Model, PC3 as a Negative Control, and huPBMCs as the Human T-Cell Model
LNCap, a PSMA-overexpressing prostate cancer cell line, was cultured in Dulbecco’s modified Eagle’s medium (DMEM)/F12 medium containing 10% FBS and 1% penicillin-streptomycin. PC-3, a prostate cancer cell line without PSMA expression, was cultured in F-12K medium containing 10% FBS and 1% penicillin-streptomycin. Human peripheral blood mononuclear cells (huPBMCs) were separated from fresh human blood using Ficoll-Paque gradient centrifugation, and then huPBMCs were cultured in AIM V medium with 100 units/mL human recombinant interleukin (IL)-2 and 1 µg/mL of an anti-CD3 antibody (OKT3) for two weeks to obtain activated huPBMCs (a-huPBMCs). Cell culture medium and FBS were from Corning or Thermo Fisher Scientific. Human blood samples were collected from Taipei Medical University Hospital in compliance with the Declaration of Helsinki and Institutional Review Board-approved protocols (N201606001 and N202002066). All donors provided written informed consent prior to enrollment.
The Evaluation of Bispecific Anti-PSMA Fab/Anti-CD3 scFv T-Cell Engager Using a PSMA-Overexpressing Cell Model
The method of preparation of BiPTE was adopted from a previous study27 and involved simply replacing an anti-epidermal growth factor receptor (anti-EGFR) Fab fragment with an anti-PSMA Fab fragment. To assess the cytotoxicity of BiPTE to cell lines with various levels of expression of PSMA, LNCap cells (PSMA-positive) and PC-3 cells (PSMA-negative) were incubated with different BiPTE concentrations in triplicate wells of 96-well plates for 1 h at 37 °C. After removing the medium containing BiPTE, human T cells were introduced at an effector:target ratio of 10:1 (1×10⁵:1×10⁴) or 5:1 (5×10⁴:1×10⁴). After a 16-h incubation period, the culture supernatant was collected. Lactate dehydrogenase released from killed cells was determined with a CytoTox 96 Non-Radioactive Cytotoxicity Assay (Promega, Madison, WI, USA). The cytotoxicity of BiPTE was calculated according to the manufacturer’s instructions. Enzyme-linked immunosorbent assays (ELISAs) for tumor necrosis factor (TNF)-α, gamma interferon (IFN)-γ, and granzyme B released after activation of T cells were performed according to the manufacturer’s instructions (Invitrogen, Waltham, MA, USA; R&D Systems, Minneapolis, MN, USA). To observe T cell-mediated cytotoxicity, time-lapse videos were recorded at an effector:target ratio of 2:1 (2 × 10⁴:1 × 10⁴). Images were obtained in a bright field at 20× magnification every 5 min using a Cytation 3 Cell Imaging Multi-Mode Reader (Bio-Tek, Winooski, VT, USA) and were converted to videos at fps using ImageJ software.
Rational Design of mPEG–PLGA Diblock Copolymers Able to Transform Into Hydrogel with Lower Shrinkage
A previous study27 found that both mPEG–PLGA (550–900) DP and mPEG–PLGA (750–1200) DP at a 15% concentration could not form hydrogel but remained in a liquid state when the incubation temperature gradually increased from 15 °C to higher than 37 °C. Even when the concentration of both DPs was increased to 20–30%, they only became turbid without hydrogel formation. On the other hand, mPEG–PLGA (550–1400) DP at 15% concentration was able to form a hydrogel but with a higher shrinkage. This indicated that increasing the PLGA weight portion from 900 to 1400, while maintaining the same mPEG weight portion at 550, could result in a hydrogel due to the micellization of hydrophobic PLGA. High temperatures can lead to dehydration of PEG fragments, causing hydrogel collapse and precipitation.31 The molecular weight ratio of PEG to PLGA is crucial in hydrogel formation, implying that the optimization of thermosensitive hydrogels requires adjusting this ratio and the molecular weights.32 The shrinkage observed in mPEG–PLGA (550–1400) was likely due to insufficient mPEG weight (550) to retain adequate water in the hydrogel structure. However, increasing the mPEG weight to 750 in mPEG–PLGA (750–1200) did not result in hydrogel formation at a 15% concentration, possibly due to an insufficient PLGA weight portion (1200 vs 1400) for effective micellization. This further indicated that it was necessary to increase the PLGA weight portion to ensure that a long enough PLGA segment micellized for gelation. Therefore, two DPs, mPEG–PLGA (750–1800) and mPEG–PLGA (750–2000), potentially able to transform into hydrogels with less shrinkage or even no shrinkage, were rationally designed and synthesized for evaluation in this study by increasing the PLGA weight portion from 1200 to 1800 and 2000 while maintaining the same mPEG weight portion at 750.
Characterization of Diblock and Triblock Copolymers Using Nuclear Magnetic Resonance and Gel Permeation Chromatography, and Evaluation of Their Shrinkage Properties
Three mPEG–PLGA DPs, including mPEG–PLGA (750–1200), mPEG–PLGA (750–1800), and mPEG–PLGA (750–2000), listed in Table 1, were synthesized by typical ring-opening polymerization of lactide and glycolide using mPEG as an initiator according to a procedure described in a previous study.27 In addition, another mPEG–PLGA DP (550–1400) and a PLGA–PEG–PLGA TP (1250–1500-1250), the two components of the composite DTgel hydrogel, were also synthesized using the same method as above with mPEG and PEG, respectively, as the initiator.
 |
Table 1 Integral H1NMR Signals and Physical Properties of Methoxy Poly(Ethylene Glycol) (mPEG)–Poly(Lactide-Co-Glycolide) (PLGA) (Diblock Copolymer [DP]) and PLGA–PEG–PLGA (Triblock Copolymer [TP]) |
Nuclear magnetic resonance (NMR) spectroscopy was used to detect the molecular weight and properties of the copolymer after synthesis. The copolymer (10–20 mg) was dissolved in d-chloroform and then measured with a 500-Hz 1H-NMR spectrometer (Bruker Avance DRX 500). Then, the number-average molecular weight of DP and TP was calculated according to equation 1 and equation 2, respectively:33


where MmPEG was the molecular weight of mPEG, MPEG was the molecular weight of PEG, and Ax was the area of 1H NMR signal peak at x ppm.
Gel permeation chromatography (GPC) was performed using an Enshine SUPER CO-150 system (Enshine, Taipei County, Taiwan) equipped with SUPER CO150 columns and THF as the eluent at a flow rate of 1.0 mL/min. The temperature was maintained at 40 °C. Retention times were recorded at 30 minutes and analyzed using LabSolutions to determine the molecular weights of the products. The samples were dissolved in tetrahydrofuran (THF, ACROS Chemical Co., Geel, Belgium) at a concentration of 0.1 wt%.
The shrinkage ratio was also measured in this study. Briefly, 1 mL of 15% hydrogel solution was placed in microtubes and incubated in water at 37 °C. After 6 hours, the shrinkage ratio was confirmed by calculating the volume of water that had escaped from the hydrogel.
Analysis of Solution–Gel Phase Transitions in Nonshrinkable Thermosensitive PEG–PLGA Hydrogels
Based on the shrinkage data shown in Table 1, nonshrinkable mPEG–PLGA (750–1800), designated as D2gel, was selected for the construction of a sol–gel–sol phase transition diagram, while the hydrogel containing mPEG–PLGA (750–2000) was discarded due to its high shrinkage ratio. For the construction of a sol–gel–sol phase transition diagram for composite hydrogels with a 1:1 DP:TP or 2:3 DP:TP ratio, mPEG–PLGA (550–1400) diblock polymer-1 and PLGA–PEG–PLGA (1250–1500-1250) TP were dissolved in two kinds of PBS buffer concentrations (1:1 DP:TP ratio in 1× PBS was designated as DTgel-1, 1:1 DP:TP in 1.5× PBS as DTgel-1S, 2:3 DP:TP in 1× PBS as DTgel-2, and 2:3 DP:TP in 1.5× PBS as DTgel-2S), as reported in a previous study,27 for comparison. The sol–gel–sol transition temperature to construct the sol–gel–sol phase transition diagrams was evaluated using the inverted-tube technique. Briefly, a concentration series, ranging from 20%, 17.5%, 15%, and 12.5% to 10%, was created for DTgel-1, DTgel-1S, DTgel-2, DTgel-2S, and D2gel and stored at 4 °C. Then, each sample was heated in a water bath at a rate of 1 °C per minute. At each temperature point, the microtubes containing the samples were inverted, and the fluidity of the solution was observed. The temperature when the solution transformed into a solid gel and settled at the bottom of the microtubes was defined as the sol–gel transition temperature. The temperature when continuous heating caused the gel structure to disintegrate and release water was defined as the gel–sol transition temperature. Phase diagrams for each sample were constructed by plotting the sol-to-gel and gel-to-sol temperatures against various concentrations of the hydrogel samples DTgel-1, DT-gel 1S, DTgel-2, DTgel-2S, and D2gel (all hydrogel samples were collectively designated as nonshrinkable Thermosensitive PEG–PLGA hydrogels [nsTPPgels]).
Rheological Characterization of Nonshrinkable Thermosensitive PEG–PLGA Hydrogels
For measuring rheological profiles of nsTPPgels, DTgel-2, DTgel-2S, and D2gel were prepared at 15% and 20% concentrations and tested using a rheometer with a temperature gradient. In brief, 0.1 mL of each solution sample stored at 4 °C was placed on a disposable sample plate. The temperature of the sample plate was held at 15 °C, and then the CP25-1 rotor was used to detect the rheological properties of the gel at a heating rate of 1 °C per minute. Amplitude and frequency were set to 0.5% and 10 rad/s, respectively.
In vitro Release of Bovine Serum Albumin and Bispecific Anti-PSMA Fab/Anti-CD3 scFv T-Cell Engager From Nonshrinkable Thermosensitive PEG–PLGA Hydrogels and Release Model Characterization
Bovine serum albumin (BSA) was released from the nsTPPgels, DTgel-2, DTgel-2S, and D2gel, prepared at 15% and 20% concentration, while BiPTE was released from DTgel-2, DTgel-2S, and D2gel at only 15% concentration. DTgel-2, DTgel-2S, D2gel at 15% and 20% concentration were prepared according to the formula in Table S1. In this study, we collectively refer to the nsTPPgels loaded with BSA as BSA/nsTPPgels, which include BSA/DTgel-2, BSA/DTgel-2S, and BSA/D2gel. Similarly, the nsTPPgels loaded with BiPTE are termed BiPTE/nsTPPgels, encompassing BiPTE/DTgel-2, BiPTE/DTgel-2S, and BiPTE/D2gel. For the preparation of BSA/nsTPPgels or BiPTE/nsTPPgels, a pH 7.4 PBS solution of BSA or BiPTE at a concentration of 2.5 mg/mL was first prepared. This solution was then slowly mixed with 25% nsTPPgel (pH = 7.4) at 4°C to produce hydrogels with a final BSA or BiPTE concentration of 0.5 mg/mL and a hydrogel concentration of 20% or 15%. A 100 µL quantity of each hydrogel sample was placed in an incubator at a constant temperature of 37 °C for 5 minutes to allow the solution to gel and form a slab geometry at the bottom of the microtube. Then, 1000 µL of pH 7.4 PBS solution was added as release buffer; at predetermined intervals of 1, 3, 6, 12, 24, 48, 72, 96, 144, and 168 hours, all the releasing buffer was removed and the tube was refilled with the same volume of fresh releasing buffer. Each group was subjected to three repeated tests and the samples were stored at −80 °C until analysis with a Pierce™ BCA Protein Assay (BCA) Kit for BSA and ELISA for BiPTE.
The mechanism of drug release from biodegradable hydrogels, such as PEG–PLGA–PEG TP,29 has been proposed to involve two stages: an initial burst release from hydrogels through diffusion, followed by a slower release as the hydrogels gradually biodegrade.34 The PEG–PLGA DP and PEG–PLGA–PEG TP hydrogel systems are also thought to have a domain (core–shell micelle) structure in aqueous environments.35,36 The hydrophilic PEGs occupy the outer shell region and hydrophobic PLGAs constitute the inner core, which decreases the free energy of hydration. At the sol-to-gel transition temperature, an abrupt increase in polymer–polymer attraction and micelle size results in the packing of micelles, thereby transforming them into the gel state. With a domain (core–shell micelle) structure in aqueous environments, the difference in hydrophobicity may cause the drug to partition into different polymer domains, leading to varied release profiles.
Considering that the mechanism of drug release from hydrogels can be quite complex, involving both diffusion and matrix degradation, the release profile of this system should follow a diffusion-then-degradation model. However, since nsTPPgels are composed of core–shell micelles, the hydrophilic protein drug is theoretically highly concentrated in the hydrophilic shell layer and tends to be released by diffusion. On the other hand, since the protein drug is completely dissolved in the polymer medium, the resulting hydrogel is considered a monolithic device. Diffusive drug release from monolithic devices with slab geometry can be explained using equation 3:37

where Mt/M0 was the fraction of drug released from the device relative to the total amount of drug (M0), D was the diffusion coefficient of the drug, and I was the thickness of the device. Due to the complexity of the equation, two approximated equations based on different intervals are proposed. Equation 4 served as an early-time approximation used to describe 0–60% release, while equation 5 served as a late-time approximation used to describe 40–100% release:38


Equations 6 and 7 were further derived from the above equations, allowing linear regression analysis of in vitro release versus time profile, facilitating the comparison of the release properties of different nsTPPgels:


In vivo Pharmacokinetic Evaluation of Bispecific Anti-PSMA Fab/Anti-CD3 scFv T-Cell Engager-Loaded Nonshrinkable Thermosensitive PEG–PLGA Hydrogels Compared with Subcutaneous or Intravenous Administration
We observed the principles of replacement, reduction, and refinement (the 3Rs) for ethical use of experimental animals by reducing the number of animal experimental groups, ensuring accurate use of animals, and replacing animals with cell experiments in the experimental design to achieve the goal of reducing the number of animals used in this study. The protocol for the animal study was reviewed and approved by the Institutional Animal Care and Use Committee (IACUC) of Taipei Medical University (TMU), confirming that the execution and operation of the experiment complied with the provisions of the Animal Protection Act and related regulations. The animal application form and consent form number was LAC-2017-0823. The animal model used in this experiment was 6-week-old male mice (BALB/c mice) purchased from LASCO Biotechnology (Taipei, Taiwan) and raised by the Animal Center of TMU. The environmental temperature was 25 °C and the mice were provided an ad libitum diet, but food was not provided before administration of the intravenous or subcutaneous injections.
Male BALB/c mice were selected for the pharmacokinetic study of subcutaneously injected BiPTE/nsTPPgels (including BiPTE/DTgel-2, BiPTE/DTgel-2S, and BiPTE/D2gel) and intravenously and subcutaneously injected BiPTE solution (sol) at the same dose of 5 mg/kg. Mice were randomly divided into five groups (n = 3 for intravenous; n = 4 for subcutaneous and nsTPPgels), and then a 26 G needle was used to inject 200 µL of each of 15% BiPTE/DTgel-2, BiPTE/DTgel-2S, and BiPTE/D2gel containing BiPTE at a concentration of 500 µg/mL into the subcutaneous area of the right hind thigh of the mouse. In addition, subcutaneously or intravenously injected BiPTE sol was used as a control group and the doses of the five groups were all 5 mg/kg equivalent weight of BiPTE. Blood collection times for the intravenous injection group were 5 min, 15 min, 30 min, and 1, 3, 6, 12, 24, and 48 h, while the blood collection time for the other subcutaneous injection groups were 30 min and 1, 3, 6, 12, 24, 48, 72, 96 and 120 h. The sampled fresh blood was centrifuged at 6000 rpm for 5 min to separate the plasma and stored in an environment of −80 °C until analysis. After thawing at room temperature, the plasma concentration of BiPTE in each sample was diluted and analyzed by ELISA. The detection range of the ELISA was from 0.625 to 20 ng/mL, with the concentration calculated using the formula: Concentration = (OD405 - 0.0243) / 0.0223, where R² = 0.9998. The results were analyzed by the Phoenix WinNonlin compartmental model to calculate various pharmacokinetic parameters.
Efficacy of Bispecific Anti-PSMA Fab/Anti-CD3 scFv T-Cell Engager in Solid Tumor Treatment and in vivo Imaging of LNCaP-Xenografted CTL Mouse Model
The protocol of the animal study was reviewed and approved by the IACUC of TMU, confirming that the execution and operation of the experiment complied with provisions of the Animal Protection Act and related regulations. The animal application form and consent form number was LAC-2017-0823. The animal model used in this experiment was 6-week-old male SCID mice purchased from LASCO Biotechnology and raised by the Animal Center of TMU. They were kept at an environmental temperature of 25 °C. Food was provided ad libitum, but not before administration of the intravenous and subcutaneous injections. A previous study showed that huPBMC used as the source of CTLs could still show a good immune response in mice, which was quite suitable for mouse models for observing the human immune response.39 Thus, male SCID mice were injected with a huPBMCs suspension (1 × 10⁷ cells/100 µL) in the tail vein to establish a mouse model of human-derived T cells (CTL mouse model).
In this study, male SCID mice were used as animal models to evaluate the anti-tumor efficacy of the BiPTE/nsTPPgels. First, mice were randomly divided into six groups (n = 4). Matrigel (Corning® Matrigel® Matrix) and an LNCaP cell suspension (5E6 cells/mL) were mixed at a 1:1 ratio, and then subcutaneously injected into the right back buttock of each mouse (with a 26 G needle). When the tumor volume grew to about 80 mm3, a suspension of 1×10⁷ a-huPBMCs (CTLs, n = 1) or DiR-labeled a-huPBMCs (CTLs stained with 320 µg/mL DiR for 30 min [DiR–CTLs], n = 3) was injected into the tail vein. The formula for calculating tumor volume was as follows: tumor volume = (length × width2)/2. One day after the CTL suspension was injected, the BiPTE dose, which was equivalent to 5 mg/kg of BiPTE/DTgel-2, BiPTE/DTgel-2S, or BiPTE/D2gel, was subcutaneously injected into the left back buttock of each mouse (the site opposite to the implanted tumor). The reason for injecting the three BiPTE/nsTPPgels at the opposite side of the tumor site, instead of injecting intratumorally or peritumorally, was to demonstrate the targeting ability of the anti-PMSA arm in the BiPTE antibody. In addition, the three BiPTE/nsTPPgels injected might have been able to play the role of artificial lymph nodes to attract and arm T cells at injection sites and then target PMSA-positive tumor cells. A control group received subcutaneously or intravenously injected BiPTE sol. After injection, tumor size and body weight were determined twice a week. For LNCaP-xenografted mice injected with DiR–CTLs, live images were observed at 2, 6, 12, 24, 52, 72, and 96 h with ex/em of 740/780 nm with the in vivo imaging system (IVIS) (200 Series; PerkinElmer, Waltham, MA, USA). The average radiant efficiencies ([p/s]/[μW/cm2]) of the liver, tumor sites, injection sites, and lymph nodes were calculated with Living Image® software 4.7.3 (PerkinElmer). After 21 days, the treatment effect on tumor growth was analyzed for each group. The safety of each treatment was evaluated based simply on the body weight change profile. Tumor growth inhibition (TGI) was determined twice weekly after a single shot of each of the three BiPTE/nsTPPgels according to the following formula:

To evaluate T-cell recruitment and the extent of cytotoxicity in tumor tissues, tumors from all mice were removed on day 21 post-administration. For the IHC staining analysis, the tumors were fixed in 10% formalin for 24 hours, followed by paraffin embedding, sectioning, and staining. Briefly, all sections were immunostained with an anti-human granzyme B antibody (Proteintech, Rosemont, IL, USA) and visualized using DAB (diaminobenzidine). Histological images were captured using a BX43 Microscope (Olympus, Tokyo, Japan) and a DP80 Microscope Digital Camera (Olympus).
Data Analysis
Student’s t-tests and ANOVA were performed using GraphPad Prism. The p-values for t-test results and post-hoc analysis of ANOVA results are indicated in the figures or tables using the following symbols: *p≤0.05, **p≤0.01, ***p≤0.001, and ****p≤0.0001.
Results and Discussion
Confirmation of the Structure of Bispecific Anti-PSMA Fab/Anti-CD3 scFv T-Cell Engager and Verification of Specific T-Cell Cytotoxic Effects Against PSMA-Positive Prostate Cancer Cells
The structure of BiPTE was confirmed using sodium dodecyl sulfate polyacrylamide gel electrophoresis (SDS-PAGE). Due to the presence of disulfide bonds connecting the light and heavy chains of antibodies of this type, we used both reducing and non-reducing SDS-PAGE to preliminarily assess whether or not the antibody structure was correct. When BiPTE was subjected to non-reducing SDS-PAGE, a molecular weight of approximately 75~80 kDa was observed (Figure 1a), consistent with the actual molecular weight of BiPTE. In contrast, reducing SDS-PAGE revealed fragments of around 25 and 50 kDa, confirming the presence of disulfide bonds in the antibody structure. To confirm the specificity of BiPTE for PSMA-positive tumor cells, PSMA-positive LNCaP cells were used as the target for treatment. PSMA-negative PC3 cells were employed as the control group for T-cell cytotoxicity assays, conducted at effector:target ratios of 5:1 and 10:1. As shown in Figure 1b, even at very low concentrations (1.6 ng/mL), BiPTE exhibited a remarkably significant cytotoxic effect on PSMA-positive LNCaP cells compared to PSMA-negative PC3 cells. This effect was particularly pronounced at an effector:target ratio of 10:1, indicating a positive correlation with T-cell concentration. These findings align with the results of our previous study.27 We also detected granzyme B in the cell culture supernatant, which is considered direct evidence of T-cell cytotoxicity.40 Figure 1c shows that the granzyme B concentration in PSMA-positive LNCaP cells was positively correlated with BiPTE concentration and T cell quantity. Granzyme B was also detected in PSMA-negative PC3 cells, but its concentration was not correlated with BiPTE concentration. In addition, as TNF-α and IFN-γ are also known to be associated with T-cell activation and cytotoxicity during initial stimulation,41 we used ELISA to confirm their concentrations (Figure 1d and e). The similar trends observed for cell cytokines and granzyme B provide sufficient evidence to confirm that BiPTE could induce tumor-specific cytotoxicity of T cells against PSMA-positive prostate cancer in vitro. We also performed time-lapse imaging of T cells with LNCaP (Videos S1A, S1B and S1C) or PC3 cells (Videos S2A, S2B and S2C). Screenshots taken at the 8th hour (Figures 1f, g, S1, and S2) showed that both low (0.2 µg/mL) and high (5 µg/mL) BiPTE concentrations eliminated LNCaP cells from the field. However, there was no noticeable change in PC3 cells.
 |
Figure 1 Verification of the structure and function of a bispecific anti-prostate-specific membrane antigen (PSMA) Fab/anti-cluster of differentiation 3 (CD3) scFv T-cell engager (BiPTE). (a), Analytical results of non-reducing and reducing SDS-PAGE for BiPTE. (b), In vitro cellular cytotoxicity of BiPTE against PSMA-overexpressing LNCaP cells or PSMA-negative PC-3 cells with different effector:target (E:T) ratios. The supernatant from the cytotoxicity assay was also used to detect granzyme B (c), interferon (IFN)-γ (d), and tumor necrosis factor (TNF)-α (e). Screenshots show the cytotoxic effects of BiPTE on PSMA-positive LNCap cells (f) and PSMA-negative PC3 cells (g) via cytotoxic lymphocytic T cells (CTLs) and 5 µg/mL BiPTE. |
The immunological response at the cellular level shown in Figure 1b–e demonstrated that BiPTE (PSMA and CD3) can induce tumor-specific cytotoxicity of T cells against PSMA-positive LNCaP in the in vitro cell study. Figure 1f and g further illustrates that in the case of the PC3 prostate cancer cell line, which does not express PSMA, the presence of BiPTE could not facilitate close contact between effectors (eg, T cells) and target cells (PSMA-negative PC3) via linkage with BiPTE to form efficient immune synapses for activating T cells to release cell cytokines and granzyme B to eradicate PC3 tumor cells. Therefore, the immunological responses in the cellular study presented in Figure 1 demonstrate the advantage of BiPTE as an efficacious therapy for solid tumors with positive expression of PMSA.
Furthermore, the previous study27 demonstrated that sustained release of BiTEE from the thermosensitive hydrogel depot with a lower initial burst effect could retard the release of proinflammatory cytokines close to zero (<100 pg/mL), regardless of whether the dose was 5 or 10 mg/kg BW. Since BiPTE shows the same immunological response and activation of the release of proinflammatory cytokines as BiTEE, it is reasonable to conclude that the cytokine release syndrome caused by in vivo subcutaneous administration of BiPTE as a thermosensitive in situ hydrogel depot would be at a minimum compared to that caused by intravenous and subcutaneous administration of BiPTE as a solution.
Rationally Designed mPEG–PLGA Diblock Copolymers Exhibit Nonshrinkable Thermosensitive Properties
As described in method, two DPs, mPEG–PLGA (750–1800) and mPEG–PLGA (750–2000), were designed and synthesized for evaluation in this study. These copolymers were potentially conferred the ability to transform into hydrogel with less or no shrinkage by increasing the PLGA weight portion from 1200 to 1800 and 2000 while keeping the mPEG weight portion constant at 750. Following the same synthetic scheme as that reported in a previous study,27 mPEG or PEG, used as the initiator in the overall synthesis, went through a ring-opening polymerization reaction with lactide and glycolide, with tin(II) 2-ethylhexanoate as the catalyst.42 Figure S3 shows the 1H-NMR spectrum of four mPEG–PLGA DPs and one PLGA–PEG–PLGA TP synthesized in this study. Both DPs and TPs exhibited hydrogen signals from the side chain methyl group (-CH3) and the alkyl group (-CH-) of lactide at 1.6 ppm and 5.2 ppm, and a hydrogen signal at 4.8 ppm from the alkyl group (-CH2-) of glycolide. In addition, the hydrogen signal at 3.6 ppm originated from the alkyl group (-CH2-) of mPEG or PEG, and the hydrogen signal at 3.3 ppm was from the methoxy group of mPEG. On the other hand, the copolymers from each group were analyzed by GPC, as shown in Figure S4. The results indicated that all copolymers, including four mPEG–PLGA DPs and one PLGA–PEG–PLGA TP, exhibited single-peak signals with molecular weights matching the original design. The PDI values ranged from 1.4 to 1.7, indicating successful polymerization and purification of all copolymer groups.
The NMR integration and GPC results of each PEGylated PLGA group is also shown in Table 1. The actual molecular weights of each polymer group were approximately close to the theoretical molecular weights. In addition, the NMR results in Table 1 further showed that compared to the original DP (mPEG550–PLGA1400), D3P (mPEG750–PLGA2000) had the closest PLGA:PEG molar ratio (3.0 versus 2.9), but the degree of shrinkage was reduced from 75% to 25%. This is likely because the longer PEG chains helped to hold more water; the longer PLGA chain length prevented water from being expelled due to dehydration as temperature increased, leading to the maintenance of the bulk volume of the hydrogel body. As expected, by further reducing the PLGA:PEG ratio to 2.7 with a shorter PLGA (1800) but the same PEG chain length of 750, we found that D2P (mPEG750–PLGA1800) exhibited 0% shrinkage at 37 °C, similar to our previous findings for DTgel. Nevertheless, when the PLGA:PEG ratio was largely reduced to 1.5, with a shorter PLGA chain length (PLGA1200) as D1P (mPEG750-PLGA1200), no gel formation was observed. This might be attributable to PLGA being too short for aggregation to form hydrogel with increasing temperature. Therefore, it is reasonable to conclude that a DP hydrogel with 0% to low shrinkage required the PLGA:PEG ratio to be within the range of 2.6 to 2.8 and the PLGA chain length to be approximately 1800.
Validating the Feasible of Nonshrinkable Thermosensitive PEG–PLGA Hydrogels as Injectable Thermosensitive Hydrogel Drug Delivery Carriers via Sol–Gel Transition Phase Diagrams and Shrinkage Ratio
According to previous studies, the PLGA–PEG copolymer’s ability to form a solid gel depends on its PLGA:PEG ratio, with a higher PLGA proportion leading to a stronger gelation ability and lower gelation temperature.43–45 The schematic diagram of gelling in Figures 2a and S5 includes different phase transitions, such as solution type, gelling type, and precipitation type. The rising temperature led to an increase in the hydrophobicity of the PLGA fragment and a decrease in the diameters of the nanoparticles that formed the gel structure. This phenomenon is called “phase separation” or “precipitation”.46
 |
Figure 2 (a) Schematic diagram of gelling properties of nsTPPgel. (b)The phase diagram and (c) The shrinkage ratio of DTgel-1, DTgel-2, DTgel-2S, D2gel and D3gel. (d) Rheological characterization of DTgel-2, DTgel-2S, and D2gel. ****p < 0.0001 compared to each group in one-way ANOVA and post hoc = Tukey. |
We further discovered that the gelation temperature could be altered and improved by simply mixing copolymers with a higher or lower PLGA:PEG ratio. This might be because the polymer with a lower PLGA:PEG ratio has a higher proportion of PEG; thus, the higher PEG content could fill up and strengthen linkages between the nanoparticles and hence prevent the gel structure from collapsing as the temperature rose and water was expelled.
The sol–gel transition phase diagram of each formulation is shown in Figure 2b. In the comparison of the DTgel-1, DTgel-2, DTgel-2S, D2gel, and D3gel groups, we found that most of the formulations had a sol–gel transition temperature above 25 °C and below 37 °C, indicating that these thermosensitive hydrogel formulations are suitable for injection at room temperature and would form a subcutaneous polymeric active pharmaceutical ingredient depot once the formulation reaches body temperature. The lower gelation temperature exhibited by DTgel-1 confirmed the prediction that a higher PLGA:PEG ratio of the DP formulation could lead to a lower sol–gel transition temperature. Hence, we concluded that manipulation of the PLGA:PEG ratio was key to preparing thermosensitive hydrogels within an appropriate range. Moreover, we also observed that PBS salt concentrations could affect the gelation temperature, because the gelation temperature of DTgel-2S was slightly lower than that of DTgel-2. This result also corresponded with the findings of a previous report.45 On the other hand, the shrinkage levels of each hydrogel group at a fixed 15% concentration were compared and are shown in Figure 2c. It is evident that while D3gel exhibits a favorable gelation range in the Sol-Gel Transition Phase, these hydrogels fail to maintain their gel state for extended periods at 37°C, ultimately resulting in approximately 25% shrinkage. Interestingly, although DTgel-1 was considered inferior to other groups in the Sol-Gel Transition Phase, its shrinkage was only 10%, suggesting that both the Sol-Gel Transition Phase and hydrogel shrinkage need to be evaluated comprehensively. Finally, we excluded the DTgel-1 formulation due to its low gelation temperature (< 25 °C) and also excluded D3gel because its shrinkage exceeded 10%, failing to meet the criteria for subcutaneous injection applications.
Evaluating the Gel Strength of Nonshrinkable Thermosensitive PEG–PLGA Hydrogels as Injectable Thermosensitive Hydrogel Drug Delivery Carriers Using Rheological Properties
In this experiment, the rheological properties of the three nsTPPgel formulations (DTgel-2, DTgel-2S, and D2gel) were examined at two concentrations (15% and 20%). The results are shown in Figure 2d. G′ represents the storage modulus and G″ represents the loss modulus. G′ increased as the temperature rose, and the temperature at which G′ surpassed G″ (indicating that the sample transitioned from a fluid to a gel) was regarded as the sol–gel transition temperature or the gelling temperature. The gelling temperatures and G′ values (gel strength, Pa) at 36–37 °C for all formulations measured are listed in Table S2. The gelling temperatures for 15% DTgel-2, 15% DTgel-2S, 15% D2gel, 20% DTgel-2, 20% DTgel-2S, 20% D2gel were 30.5, 30.5, 29.5, 29.5, 22.3, and 21.2 °C, respectively, which corresponded to the phase diagram results. In addition, the G′ values at 36–37 °C for 15% DTgel-2, DTgel-2S, and D2gel were 51.8 Pa, 52.0 Pa, and 67.4 Pa, respectively, while those for 20% DTgel-2, DTgel-2S, and D2gel were 61.7 Pa, 185.2 Pa, and 162.5 Pa, respectively (Table S2). These results indicate that a higher polymer concentration results in higher gel strength at body temperature for the same type of hydrogel. In the case of the two composite hydrogels, a higher buffer concentration led to higher gel strength at both polymer concentrations (DTgel-2S > DTgel-2). Gel strength seemed to follow the trend of DTgel-2 < DTgel-2S < D2gel at the polymer concentration of 15%, whereas it followed the trend of DTgel-2 < D2gel < DTgel-2S at 20% polymer concentration. Although the 20% hydrogel exhibited higher gel strength, the critical utility condition for thermosensitive hydrogels is to exhibit gel properties only within 30–37 °C. Therefore, we believe that the 15% hydrogel is more suitable for injection as it has a relatively higher gelling temperature. In addition, these formulations displayed good viscoelasticity between 32 °C and 37 °C, which means that both composite hydrogels (DTgels) and the DPs (D2gels) could maintain a non-shrinkable and stable gel structure at human body temperature and avoided the burst release of the active pharmaceutical ingredient as a result of collapse of the gel structure. In summary, the rheological data suggest that the gelling temperature and rheological properties, especially gel strength (G′), of the thermosensitive hydrogel we designed can be adjusted by selecting the polymer type and polymer concentration to meet various formulation designs and drug delivery system requirements.
Using Drug Release Models to Explain the Differences in Drug Release Profiles Among Various Nonshrinkable Thermosensitive PEG–PLGA Hydrogels
Amphiphilic block copolymers (AB or ABA-type) consist of two types of monomeric unit with different solubilities. In solution at low concentrations, these amphiphilic molecules exist as unimers. However, as concentration increases, aggregation occurs. The resulting aggregates, known as micelles, typically have a spherical shape and consist of several dozen of these monomeric units.47 The critical micelle concentration is defined as the monomeric amphiphile concentration at which micelles start to form. Furthermore, since the solvation of amphiphiles in block copolymers is highly temperature-dependent, another crucial parameter to consider is the lowest critical micellization temperature, below which, the amphiphile exists as unimers, while above this temperature, unimers and aggregates coexist.
A schematic diagram of the thermoregulation mechanism of the PEG–PLGA DP and PEG–PLGA–PEG TP is presented in Figure 3a. According to this model, the hydrogel systems formed by these copolymers are characterized by a core–shell micelle structure at concentrations above the critical micelle concentration in aqueous environments.35,36 The hydrophilic PEG segments of the PEG–PLGA DP occupy the outer shell region, while the hydrophobic PLGA segments constitute the inner core, thereby minimizing the free energy of hydration. At the sol-to-gel transition temperature, an abrupt increase in polymer–polymer attraction and micellar size leads to the packing of micelles, transforming them into a percolated micellar gel network. This transformation occurs by bridging the hydrophobic PLGA core with the hydrophilic PEG in the outer shell region. The PLGA–PEG–PLGA TPs form micelles, with PLGA blocks at the core and PEG forming the curved shells. At higher concentrations and temperatures, these systems can also form bridging micelles by the curved hydrophilic PEG shells connecting with each other. Composite hydrogel composed of DPs and TPs is expected to have a mixed micellar structure. This structure includes unimers of both DPs and TPs, which pack together to form a percolated micellar gel network. This network is achieved by bridging hydrophobic PLGA segments (including two PLGA segments from the TP and one PLGA segment from the DP) with hydrophilic PEG segments (including curved PEG segments from the TP and straight chain PEG segments from the DP). In the case of both types of hydrogel (composite hydrogel and D2gel hydrogel), a continuous hydrophilic domain channel formed by entangled hydrophilic PEG segments in the outer shell region of the hydrogel structure is expected to function as a diffusion pathway for the release of hydrophilic proteins such as BSA.
 |
Figure 3 (a), Schematic diagram of the thermogelation mechanism of PLGA–PEG–PLGA triblock copolymer and mPEG-PLGA diblock copolymer solutions with increasing polymer concentration and at an elevated temperature for composite hydrogel (mixed micelles, DTgel-2 and DTgel-2S) and regular micelles (D2gel). In vitro release profile of BSA/nsTPPgels or BSA/D3gel (b) and BiPTE/nsTPPgels (c). Data are expressed as mean ± SD (n = 3). |
Based on the rheology results, we concluded that the three nsTPPgels (DTgel-2, DTgel-2S, and D2gel) were able to form and maintain a nonshrinkable gel structure at human body temperature. In the first part of the in vitro release study, BSA was selected as a hydrophilic macromolecule with a molecular weight of 66.5 KDa, which is similar to the molecular weight of BiPTE of 75–80 KDa. BSA was loaded into the three nsTPPgels (DTgel-2, DTgel-2S, and D2gel) at two polymer concentrations (15% and 20%) to profile in vitro release; in contrast, 15% D3gel with 25% shrinkage (Table 1 and Figure 2c) was selected for comparison. The results are shown in Figure 3b and all BSA release profiles of nsTPPgels exhibited sustained release without an initial burst.
However, D3gel-15% exhibited a release rate of 30% within the first 6 hours, which differed from other nonshrinkable hydrogel groups, including DTgel-2-15% (24%), DTgel-2S (8%), and D2gel-15% (19%). After the initial rapid release, the rate plateaued at 24 hours. This is likely due to the tighter hydrophobic structure of the gel post-shrinkage, making it more difficult for the loaded BSA to be released. This confirmed that after exposure to a temperature of 37 °C, the nsTPPgels were formed in situ and maintained their gel volume without shrinkage, thereby preventing burst release of BSA during the initial stage. The release profiles were clearly influenced by the initial polymer solution concentration (15% and 20%), buffer concentration (1.0× and 1.5× PBS), and the type of hydrogel (DTgel and D2gel). Higher polymer concentrations resulted in a more retarded release of BSA from all three hydrogel types (20% DTgel-2 > 15% DTgel-2, 20% DTgel-2S > 15% DTgel-2S, and 20% D2gel > 15% D2gel). Increased buffer concentration also slowed down BSA release (20% DTgel-2S < 20% DTgel-2 and 15% DTgel-2S < 15% DTgel-2). Overall, the rate of release of BSA from the various hydrogel types appeared to follow the order of DTgel-2S < D2gel < DTgel-2 for both polymer concentrations.
Following Jeong et al,38 the release profiles were plotted against the square root of time, revealing pseudo-linear curves indicative of diffusion-dominated drug release, consistent with the Higuchi equation for all BSA release profiles. Therefore, based on the late time approximation in equation 5, a linear plot of  versus time t (equation 7) derived from equation 5, as shown in Figure S6, was used to determine the slope for calculating the diffusion coefficients (D = -slope*l2/π2) of BSA within the hydrogel matrix. Here, it was assumed that the device thickness (l), calculated as l0 = V0/A0, where V0 was the initial volume (0.1 cm3) and A0 was the area (~0.2 cm2), remained constant over the 5 days. The diffusion coefficients (D) of BSA obtained from Figure S6 are as follows (see also Table 2): 7.98 × 10⁻⁴, 1.90 × 10⁻⁴, 1.62 × 10⁻⁴, 1.17 × 10⁻⁴, 3.44 × 10⁻⁴, and 1.72×10⁻⁴ cm2/h for 15% DTgel-2, 20% DTgel-2, 15% DTgel-2S, 20% DTgel-2S, 15% D2gel, and 20% D2gel formulations, respectively. Higher initial polymer solution concentrations resulted in slower drug release rates due to tighter polymer–polymer interactions within the gel matrix. For the same polymer concentration, the diffusion coefficients (D values) of BSA followed the trend of DTgel-2 > D2gel > DTgel-2S. A higher D value indicated less resistance to BSA diffusion through the hydrogel matrix.
 |
Table 2 Diffusion Coefficients and R2 of Each nsTPPgel Release Profile Using the Late-Time Approximation Equation (Equation 5) |
Among the physical characteristics, mesh or pore size and tortuosity of the hydrophilic domain channels within the percolated micellar gel networks of the composite hydrogels (DTgel-2 and DTgel-2S) and D2gel played a crucial role in the diffusion resistance of BSA, thereby influencing the diffusion coefficient. Theoretically, an increase in polymer concentration typically leads to a decrease in mesh size but an increase in tortuosity, which in turn increases the diffusion resistance of BSA and results in a lower diffusion coefficient. This explains why the 20% polymer concentration showed a smaller diffusion coefficient compared to the 15% polymer concentration of DTgel-2, DTgel-2S, and D2gel. On the other hand, increased buffer concentration of the polymer solution causes greater packing density, resulting in smaller mesh sizes of the hydrophilic domain channels. Consequently, BSA in DTgel-2S had a smaller diffusion coefficient than BSA in DTgel-2 at the same polymer concentration due to the more compact structure of DTgel-2S at higher buffer concentrations.
The hydrophobic core of the mixed micelles in DTgel-2 hydrogel consisted of PLGA chains with a length of 1250 from the TP (PLGA–PEG–PLGA [1250–1500-1250]) and those with a length of 1400 from the DP (mPEG–PLGA [550–1400]). In contrast, the hydrophilic shell of these mixed micelles included half-fold PEG chains of 1500 from the TP and straight PEG chains of 550 from the DP. On the other hand, the regular micelles in D2gel hydrogel only contained PLGA chains with a length of 1800 from the DP (mPEG–PLGA [750–1800]) in the hydrophobic core and straight PEG chains of 750 in the hydrophilic shell. A higher hydrophobic effect due to longer PLGA chain lengths compared to PEG chain lengths can lower the gelling temperature and increase packing density, subsequently reducing the mesh size of the hydrophilic domain channels.48,49 Furthermore, the radius of the hydrophilic domain channel, which serves as a diffusion pathway for BSA release, is expected to increase with longer PEG chain lengths. Therefore, longer PEG chains result in larger diffusion channel radii. In the comparison of PLGA and PEG chain lengths between DTgel-2 and D2gel hydrogels as described above, it is evident that the PLGA chain in the micellar core of DTgel-2 was shorter than that in D2gel, while the PEG chain in the shell region of DTgel-2 was longer than that in D2gel. These differences contributed to the larger radius of the hydrophilic domain channel of DTgel-2 compared to that of D2gel, leading to a higher diffusion coefficient of BSA released from DTgel-2. This observation aligns with the release profiles of BSA from DTgel-2 and D2gel hydrogels, which were prepared under identical polymer and buffer concentrations.
Due to the difficulties encountered during their preparation and formulation, thermogels with 20% polymer concentration were excluded from the second part of the investigation of in vitro release of BiPTE. The release of BiPTE from 15% DTgel-2, DTgel-2S, and D2gel hydrogels was performed according to the formulations listed in Table S1. The BiPTE release profiles are shown in Figure 3c. Similar to the release of BSA, BiPTE was released in a sustained manner without an initial burst release, confirming that the hydrogel maintained its structure without shrinkage on exposure to a temperature of 37 °C.
During the preparation of BiPTE/nsTPPgels, BiPTE was observed to completely dissolve in the polymer solution similar to BSA. Therefore, the hydrogel obtained was also termed a monolithic device, and the release of BiPTE from it can be described using either equation 4, valid for the initial portion of the curve, or equation 5, valid for the final portion of the release curve. Subsequently, the release profiles were redrawn against the square root of time, following the approach reported by Jeong et al.38 Pseudo-linear curves were obtained, indicating diffusion-dominant drug release, consistent with the Higuchi equation for all BiPTE release profiles. Similarly, a linear plot of  versus time t (equation 7), derived from equation 5 (Figure S6), was used to obtain the slope for calculating the diffusion coefficients (D = -slope*l2/π2) of BiPTE in the hydrogel matrix, with the assumption that the thickness of the device was constant over 5 days (ie, l0 = V0/A0 = 0.1 cm3/0.2 cm2 = 0.5 cm). The diffusion coefficients (D) of BiPTE (Figure S6) were 1.85 × 10⁻⁴, 7.09 × 10⁻⁵, and 1.17×10⁻⁵ cm2/h for 15% DTgel-2, 15% DTgel-2S, and 15% D2gel formulations, respectively (Table 2). These results indicated that BiPTE’s diffusion coefficient trend was DTgel-2 > D2gel > DTgel-2S, similar to that of BSA, but with smaller D values in each respective hydrogel (1.85 × 10⁻⁴ versus < 7.98×10⁻⁴ cm2/h for 15% DTgel-2; 7.09×10⁻⁵ versus 1.62×10⁻⁴ cm2/h for 15% DTgel-2S; and 1.17×10⁻⁴ versus 3.44×10⁻⁴ cm2/h for 15% D2gel). The smaller D of BiPTE suggests that BiPTE encountered greater resistance to diffusion across the hydrophilic domain channel within the hydrogel matrix. The larger molecular weight of BiPTE compared to that of BSA (75 KDa versus 62.5 KDa) indicated that the hydrodynamic radius of BiPTE should also be larger than that of BSA. Therefore, the resistance to diffusion across the hydrophilic domain channel with the same mesh size was expected to increase with increasing hydrodynamic radius, resulting in a reduction in the D of BiPTE compared to that of BSA with a smaller hydrodynamic value.
In Vivo Pharmacokinetic Studies Demonstrated That Nonshrinkable Thermosensitive PEG–PLGA Hydrogels Can Serve as a Sustained-Release Platform for Bispecific Anti-PSMA Fab/Anti-CD3 scFv T-Cell Engager, Leading to More Stable Blood Concentrations
Following the same design as in previous experiments,27 male BALB/c mice were selected as animal models to investigate the in vivo pharmacokinetic profiles of BiPTE/nsTPPgels, including DTgel-2, DTgel-2S, and D2gel, all at 15% polymer concentration. In this experiment, the pharmacokinetic profiles of BiPTE were compared between the three nsTPPgels (BiPTE/DTgel-2, BiPTE/DTgel-2S, and BiPTE/D2gel) administered subcutaneously and BiPTE sol administered either subcutaneously or intravenously (Figure 4a). The concentration–time profile of BiPTE in plasma is shown in Figure 4b. The typical plasma concentration profile of intravenous BiPTE sol showed a very high initial concentration immediately after injection, followed by a rapid decline depending on the rate of elimination of BiPTE from mice until reaching the terminal phase, in which the elimination half-life determined the rate of decline. On the other hand, subcutaneous BiPTE sol showed a gradually increasing BiPTE plasma concentration from zero to maximum concentration (Cmax) and then a rapid decline followed by a flattened decline at a rate dependent on its terminal half-life. However, in the three treatment groups BiPTE/DTgel-2, BiPTE/DTgel-2S, and BiPTE/D2gel, the plasma concentration of BiPTE also increased gradually to reach Cmax, followed by a smooth decline, instead of a rapid initial decline as observed for subcutaneous BiPTE sol, indicating that nsTPPgel did indeed regulate the BiPTE concentration in vivo. From the pharmacokinetic perspective, the rapid decline from Cmax observed for subcutaneous BiPTE sol indicated that BiPTE’s input rate was much higher than its elimination rate. Nevertheless, the three treatment groups BiPTE/DTgel-2, BiPTE/DTgel-2S, and BiPTE/D2gel did not show any sign of a fast input rate, indicating that there was no burst release of BiPTE from nsTPPgels as a result of gel shrinkage after gelling at body temperature. This conforms to observations in the in vitro release study, which demonstrated that nonshrinkable hydrogel was formed in situ with the three nsTPPgels, BiPTE/DTgel-2, BiPTE/DTgel-2S, and BiPTE/D2gel, with minimization of burst release.
 |
Figure 4 (a) Schematic diagram of the in vivo pharmacokinetic study. The dotted time points were observed only for the intravenous (i.v.) BiPTE sol group. (b) In vivo pharmacokinetic profiles of i.v. BiPTE sol, subcutaneous (s.c.) BiPTE sol, BiPTE/DTgel-2, BiPTE/DTgel-2S, and BiPTE/D2gel (the dose of BiPTE was 5 mg/kg). The one-way ANOVA analysis of the pharmacokinetic parameters includes (c) area under the curve from zero to time infinity (AUC0-inf) (d), half-life (e), Tmax (f), Cmax and (g), mean residence time (MRT). Data are expressed as mean ± SD (n = 3 for the i.v. group; n = 4 for the s.c. and nsTPPgel groups). *p < 0.05, **p < 0.01, ***p < 0.001, and ****p < 0.0001 compared to each group in one-way ANOVA and post hoc = Tukey. |
The pharmacokinetic profiles of subcutaneously administered BiPTE/DTgel-2, BiPTE/DTgel-2S, and BiPTE/D2gel were compared with those of subcutaneously and intravenously administered BiPTE sol. The plasma concentration of BiPTE in BiPTE/DTgel-2 was maintained for at least 72 hours, while the concentration of BiPTE in BiPTE/DTgel-2S and BiPTE/D2gel could still be detected up to 96 h. Nevertheless, the BiPTE concentrations of the intravenous and subcutaneous sol groups lasted less than 48 hours. The comparison of pharmacokinetic parameters determined from the profiles of the subcutaneous groups (subcutaneous BiPTE sol, BiPTE/DTgels, and BiPTE/D2gel; Table 3 and Figures 4c–g) showed that the AUC0-inf of these three hydrogel groups was not less than that of the subcutaneous sol group, indicating that BiPTE could be fully released from DTgel-2S, DTgel-2S, and D2gel, similar to its release from subcutaneous BiPTE sol, but in a sustained-release manner, thereby altering its pharmacokinetic profile and biodistribution in plasma (Figure 4c). In addition, BiPTE/DTgel-2S exhibited the longest elimination half-life (t1/2) of 19.5 ± 6.5 hour, followed by BiPTE/DTgel-2 with a t1/2 of 14.3 ± 3.2 hour and BiPTE/D2gel with a t1/2 of 11.9 ± 1.6 hour. These results for t1/2 were significantly different from those of the intravenous BiPTE sol and subcutaneous BiPTE sol groups, whose t1/2 was only 5.2 ± 0.7 hour and 6.7 ± 2.3 hour, respectively (Figure 4d). Therefore, we concluded that BiPTE/DTgel-2, BiPTE/DTdel-2S, and BiPTE/D2gel were capable of decreasing the terminal elimination rate of BiPTE, thus extending its plasma concentration above the minimum effective concentration for a longer duration, potentially enhancing BiPTE uptake into tumor tissues. In addition, the Cmax of BiPTE from BiPTE/DTgel-2, BiPTE/DTgel-2S, and BiPTE/D2gel after subcutaneous injection was 1453.3 ± 499.8, 991.8 ± 58.2, and 885.9 ± 222.3 ng/mL and Tmax was mainly 6–10 hour. The subcutaneous BiPTE sol group exhibited a BiPTE Cmax of 3039.2 ± 518.2 ng/mL at a Tmax of 3 hour, which was earlier than the Tmax of the hydrogel groups (Figure 4e and f). These results suggest that the sustained release of BiPTE from DTgel-2, DTgel-2S, and D2gel contributed to the lower Cmax and later Tmax, leading to a reduction in the plasma concentration of BiPTE below the toxic level and maintenance of the plasma concentration above the minimum effective concentration for a longer period. Thus, this sustained release is beneficial for minimizing dose-dependent side effects (eg, cytokine release syndrome) and extending the plasma circulation time of BiPTE to facilitate accumulation in solid tumors during clinical treatment. In fact, previous studies have indicated that sustained release of monoclonal antibodies from an in situ polymeric drug depot can achieve higher therapeutic effects against solid tumors while minimizing side effects.50,51
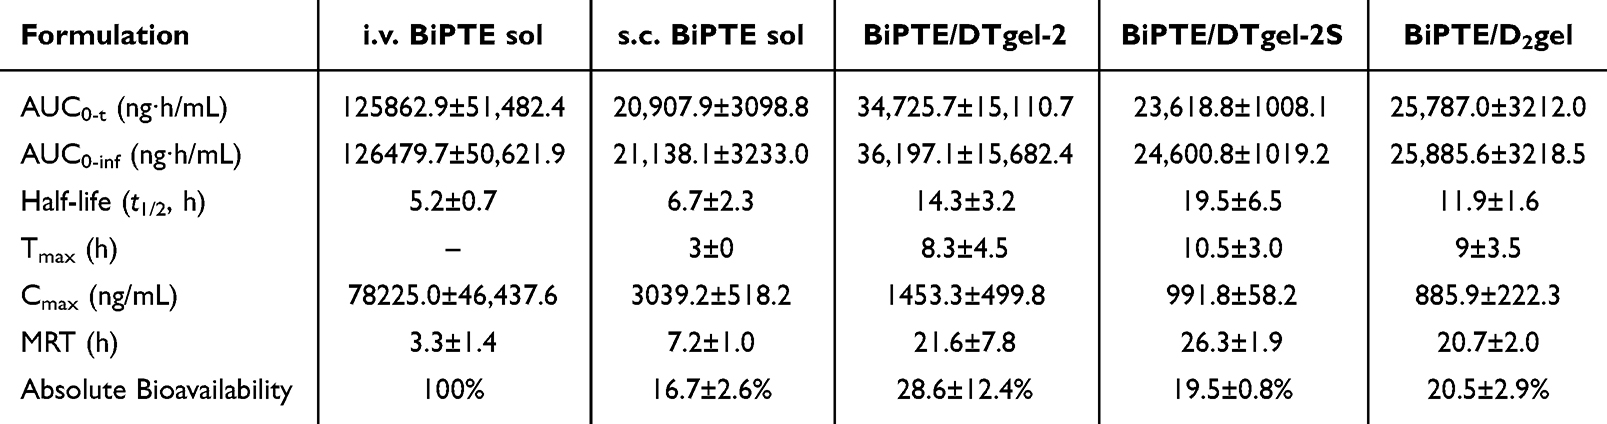 |
Table 3 In Vivo Pharmacokinetic Parameters of Intravenous (I.v.) BiPTE Sol, Subcutaneous (S.c.) BiPTE Sol, BiPTE/DTgel-2, BiPTE/DTgel-2S, and BiPTE/D2gel. The Dose of BiPTE Was 5 mg/Kg. Data are Expressed as Mean ± SD (n = 3 for the I.v. Group; n = 4 for the S.c. Group and nsTPPgel Groups) |
The mean residence time (MRT) of BiPTE in the five treatment groups followed the order of intravenous BiPTE sol (3.3 ± 1.4 h) < subcutaneous BIPTE sol (7.2 ± 1.0 h) < BiPTE/DTgel-2 (21.6 ± 7.8 h) ≈ BiPTE/D2gel (20.7 ± 2.0 h) < BiPTE/DTgel-2S (26.3 ± 1.9 h). This demonstrated that the MRT of BiPTE after subcutaneous injection of the three nsTPPgels was 7–9 times longer than that of intravenous BiPTE sol and 3–4 times longer than that of subcutaneous BiPTE sol (Figure 4g). Since MRT is defined as the average time that molecules of a dosed drug spend in the plasma, a longer MRT implies that the three subcutaneously injected BiPTE/nsTPPgels could maintain longer plasma circulation of BiPTE, resulting in its increased exposure to and accumulation in tumor tissue. Therefore, a higher BiPTE concentration at the tumor site after subcutaneous injection of BiPTE/nsTPPgels is expected and enhances tumor inhibition efficacy. Furthermore, the longer MRT of the BiPTE/DTgel-2S group, compared to that of BiPTE/DTgel-2 and BiPTE/D2gel, might be attributable to the slower rate of in vitro release observed for BiPTE/DTgel-2S (Figure 3c).
Overall, nsTPPgels provide a stable platform for BiPTE release. Compared to direct subcutaneous injection, they effectively extend the half-life and MRT of BiPTE while reducing Cmax, which helps prolong its therapeutic effect in vivo and lowers the potential risk of side effects. Compared to other methods for extending the half-life of protein drugs, such as PEGylation of an anti-CEA/CD3 bispecific antibody in the other study,52 which successfully extended the half-life from 3 hours to 36 hours, PEGylated antibodies are still administered via intravenous. This approach theoretically cannot fully address issues such as CRS and other side effects. Furthermore, in tumor treatment, that study required daily administration for six consecutive doses. In contrast, our study achieved comparable results with a single dose, highlighting the potential of hydrogels as a drug delivery platform to reduce dosing frequency while maintaining therapeutic efficacy.
Nonshrinkable Thermosensitive PEG–PLGA Hydrogels as an Efficient Delivery Platform for Bispecific Anti-PSMA Fab/Anti-CD3 scFv T-Cell Engager, Enhancing Antitumor Activity and T-Cell Infiltration
Based on the experimental design of a previous study,29 LNCaP xenografted mice injected with CTL were chosen as the model to examine the antitumor efficacy and CTL biodistribution imaging of the treatments. When the xenografted LNCaP tumor volume reached approximately 80 mm3, 1×10⁷ a-huPBMC cells were administered one day before treatment. Tumor growth inhibitory efficiency was assessed by profiling the tumor growth curve with a single dose (5 mg/kg) of the five treatments (subcutaneously administered BiPTE/DTgel-2, BiPTE/DTgel-2S, and BiPTE/D2gel and intravenously or subcutaneously administered BiPTE sol) (Figure 5a). Tumor growth curves after a single dose of each treatment, observed over a 21-day period, are shown in Figure 5b. The tumor growth curves of the control group and intravenous and subcutaneous BiPTE sol groups showed the following pattern: after administration at day 0, tumor size gradually increased, followed by a rapid increase between days 4 and 9, and then a continuous upward increase until the end of observation on day 21. In contrast, the tumor growth curves of BiPTE/DTgel-2, BiPTE/DTgel-2S, and BiPTE/D2gel followed a different pattern: after administration on day 0, tumor size remained stable over the initial 5 days, then gradually decreased until day 14 (in the BiPTE/DTgel-2 and BiPTE/DTgel-2S groups) or day 19 (BiPTE/D2gel group), followed by a slower increase in tumor size until the end of observation on day 21. We further analyzed tumor volume on days 14 and 21 using one-way ANOVA. The results showed significant differences in tumor volume of BiPTE/DTgel-2S and BiPTE/D2gel compared to the control and intravenous BiPTE sol (p < 0.05) on day 14 (Table S3). On day 21, the antitumor effects of nsTPPgel, especially BiPTE/D2gel, were even more pronounced. The BiPTE/DTgel-2, BiPTE/DTgel-2S, and BiPTE/D2gel groups all showed significant differences in tumor volume compared to the control group (p < 0.05, p < 0.01, and p < 0.001, respectively). In addition, the BiPTE/D2gel group was also significantly different in tumor volume compared to the volume of both intravenous BiPTE sol and subcutaneous BiPTE sol groups (p < 0.05). These results demonstrated that a single dose of the three hydrogels could effectively inhibit tumor growth over two to three weeks. This suggests that a dosing regimen of biweekly or monthly subcutaneous BiPTE/D2gel injections could be designed for effective prostate cancer treatment with BiPTE in future clinical applications. The results shown in Figure 1 indicate that once BiPTE comes into contact with PSMA-positive cells, it exhibits strong cytotoxicity. On the other hand, a previous study29 found that once a bispecific T-cell engager successfully accumulates at the tumor site, it can induce significant T-cell infiltration and notably increase the amount of granzyme B. Therefore, after in vivo administration, BiPTE is expected to be accumulated extensively in the tumor area and exhibit strong T-cell cytotoxic responses that result in the killing of PSMA-overexpressed tumors. Furthermore, body weight changes over the 21-day period were monitored as an indicator of systemic cytotoxicity (Figure 5c). The results showed that while there were no significant changes in body weight over 21 days, with most weights remaining above 90%, a notable difference was observed on day 14. The subcutaneous BiPTE sol group exhibited significant weight changes compared to the BiPTE/DTgel-2S and BiPTE/D2gel groups (p < 0.05). This indicates that BiPTE/nsTPPgels, particularly BiPTE/DTgel-2S and BiPTE/D2gel, have superior safety profiles, consistent with our findings from the pharmacokinetic studies.
 |
Figure 5 BiPTE/nsTPPgel serves as an effective and safe therapeutic approach for treating PSMA-positive tumors. (a) Schematic diagram of the in vivo antitumor study. (b) In vivo antitumor efficacy of intravenous (i.v.) BiPTE sol, subcutaneous (s.c.) BiPTE sol, BiPTE/DTgel-2, BiPTE/DTgel-2S, and BiPTE/D2gel with doses equal to 5 mg/kg in LNCaP tumor-bearing mice. (c) Body weight changes over 21 days after treatment. (d) Tumor growth inhibition (TGI%) of each group at the end of the treatment (day 21). (e) The tumor images for each group at the end of the treatment. (f) IHC staining images of GranzymeB in tumors on day 21 after administration. (g) Quantization of GranzymeB in IHC images using Image J software. Data are expressed as mean ± SD (n = 4). *p < 0.05, **p < 0.01, ***p < 0.001, and ****p < 0.0001 compared to each group in two-way (Figure 5b and c) or one-way ANOVA (Figure 5d and g). Post hoc = Tukey. |
The levels of TGI relative to the control group were calculated after sacrifice on the 21st day post-administration; the results are shown in Figure 5d. Compared to the control group, TGI of intravenous BiPTE sol, subcutaneous BiPTE sol, BiPTE/DTgel-2, BiPTE/DTgel-2S, and BiPTE/D2gel groups was 35.1% ± 13.7%, 57.7% ± 17.5%, 73.1% ± 11.4%, 93.7% ± 7.4%, and 113.1% ± 3.2%, respectively. Similar to the tumor volume results (Figure 5b), the TGI of BiPTE/DTgel-2, BiPTE/DTgel-2S, and BiPTE/D2gel groups was significantly different from that of the intravenous BiPTE sol group (p < 0.05, p < 0.001, and p < 0.0001, respectively). In addition, the TGI of the BiPTE/DTgel-2S and BiPTE/D2gel groups was significantly different from that of the subcutaneous BiPTE sol group (p < 0.01 and p < 0.001, respectively). Ultimately, the TGI values of the three hydrogel groups followed the order of BiPTE/D2gel (113.1% ± 3.2%) > BiPTE/DTgel-2S (93.7% ± 7.4%) > BiPTE/DTgel-2 (73.1% ± 11.4%). Notably, the TGI of BiPTE/D2gel was significantly different from that of BiPTE/DTgel-2 (p < 0.05). These results indicate that while BiPTE/nsTPPgels showed significant therapeutic efficacy, the controlled release properties of the different nsTPPgels also had an impact on the overall treatment effectiveness. Moreover, Figure 5e shows the overall morphology of tumor samples on the 21st day post-administration and also demonstrates a significant difference especially in the comparison between the three hydrogel groups and intravenous and subcutaneous BiPTE sol groups. Hence, these findings suggest that DTgel-2, DTgel-2S, and D2gel were not only able to enhance the therapeutic efficacy of BiPTE but were also reliably biosafe without exhibiting obvious toxicity.
To verify whether nsTPPgels can elicit a stronger tumor immune response, tumor sections were subjected to Granzyme B IHC staining. As shown in Figure 5f, the nsTPPgels group displayed a significant Granzyme B intensity, which is primarily released by CTLs and induces apoptosis in target cells by activating caspases.53 The granzyme B intensity of tumor sections were quantified and presented in Figure 5g. It was observed that the granzyme B intensity in the nsTPPgels group was significantly higher compared to the i.v. BiPTE or s.c. BiPTE groups. Moreover, a correlation between Granzyme B intensity and TGI was evident, confirming that increased Granzyme B levels in the tumor contribute to tumor inhibition. Notably, the BiPTE/D2gel group showed a strong statistical difference compared to the i.v. BiPTE and s.c. BiPTE groups (p<0.0001).
To further understand the in vivo pharmacokinetic profiles of and translation of the nsTPPgels to clinical applications for tumor growth inhibition, correlation analysis of the physical characteristics of the hydrogel (gel strength) (Figure 6a) and pharmacokinetic parameters (t1/2, Tmax, MRT, Cmax, and AUC0-inf) versus TGI was performed (Figure 6b–f). The correlation coefficients of TGI versus Cmax and TGI versus MRT were high. TGI was inversely correlated with Cmax, (R2 = 0.8624), meaning that the higher the Cmax, the lower the TGI. In contrast, the positive correlation between TGI and MRT (R2 = 0.7489) implied that the longer the MRT, the higher the TGI. Although the correlation coefficient for TGI versus Cmax was high, the data used in the correlation analysis excluded Cmax for intravenous BiPTE sol since it could not be estimated after intravenous administration. On the other hand, although the correlation coefficient for TGI versus MRT was somewhat weaker, the data used for correlation analysis covered all treatment groups, including MRT for intravenous BiPTE sol. Therefore, the relationship between TGI and MRT could be fully explained by the fact that the longer the MRT of BiPTE in plasma, the higher the TGI, indicating the extent to which the plasma-circulating BiPTE was responsible for killing cancer cells. The R2 of 0.7489 for TGI versus MRT indicated that plasma-circulating BiPTE was only partly responsible for tumor growth inhibition and that alternative pathways existed for delivering BiPTE to the tumor site that contributed to the rest of the tumor growth inhibition. Likewise, as described in the Introduction section, subcutaneous administration of a therapeutic protein, such as a monoclonal antibody, with a larger molecular weight (> 20 kDa) facilitated the transportation of these larger-molecular-weight proteins into lymphatic venules and subsequent entry into the lymphatic circulatory system or migration to solid tumor sites. Therefore, it is highly likely that a portion of the BiPTE released from the three nsTPPgels migrated directly to tumor sites or via the lymphatic circulatory system, while the other portion was absorbed into the systemic circulation.
 |
Figure 6 Correlation analysis of the relationship between tumor growth inhibition rate (TGI) and gel strength, as well as pharmacokinetic (PK) parameters. TGI is plotted on the X-axis, and gel strength (a), half-life (b), Tmax (c), MRT (d), Cmax (e), and AUC0-inf (f) are plotted on the Y-axis for regression analysis. Solid lines represent regression lines for intravenous (i.v.) BiPTE sol, subcutaneous (s.c.) BiPTE sol, BiPTE/DTgel-2, BiPTE/DTgel-2S, and BiPTE/D2gel groups, while dashed lines represent regression lines for s.c. BiPTE sol, BiPTE/DTgel-2, BiPTE/DTgel-2S, and BiPTE/D2gel groups. Gel strength analysis was performed only for the three hydrogel groups. |
Although all BiPTE/nsTPPgels, particularly BiPTE/DTgel-2S and BiPTE/D2gel, demonstrated promising results in tumor inhibition study, a limitation of the DTgel might be that it is composed of two copolymers, which may lead to inconsistent in vivo degradation times. While this issue may not be evident in short-term drug release or pharmacokinetic studies, it could cause instability during long-term implantation as the more water-soluble segments are metabolized first. In contrast, D2gel, which consists of a single segment, does not have this problem. This might explain why, despite the pharmacokinetic result of D2gel in this study not showing significant advantages, it still demonstrated excellent performance in anti-tumor experiments. On the other hand, single copolymer usage has a clear advantage in clinical translation. In addition to the ease of preparation, they are also more likely to achieve regulatory approval efficiently.
Nonshrinkable Thermosensitive PEG–PLGA Hydrogels Loaded with Bispecific Anti-PSMA Fab/Anti-CD3 scFv T-Cell Engager Enhance T-Cell Recruitment at Injection Sites and Lymphoid Organs, Promoting Tumor-Specific T-Cell Infiltration
The IVIS system was used for in vivo T-cell biodistribution imaging to monitor the systemic biodistribution of DiR–CTLs (n = 3), which was injected one day before BiPTE administration (at a site opposite to the implanted tumor) as the source of CTLs responsible for eradicating LNCaP tumor cells. After systemic administration, DiR–CTLs were observed to be predominantly accumulated in the liver, tumor area, injection site, and sciatic lymph node (Figures 7a and S7). Average radiant efficiencies (ARE) of DiR–CTLs in the liver, injection site, tumor site, and lymph node at various times are shown in Figure S8. Alternatively, Figure 7 provides a quantitative plot of ARE versus time for DiR–CTLs in four biodistribution sites—the injection site (Figure 7b), tumor site (Figure 7c), sciatic lymph node (Figure 7d), and liver (Figure 7e)—after administration of all five treatment formulations. The injection of different BiPTE formulations resulted in distinct CTL distribution patterns in the four biodistribution sites over different time points. A brief visual assessment of the quantified average radiant efficiency (QARE) at the last time point of 72 hours indicated the highest QARE (1E8) of more than 15 at the injection site, followed by approximately 12 at the sciatic lymph node, around 10 at the tumor site, and less than 15 at the liver site. Since the QARE of DiR–CTLs was measured after BiPTE administration, the biodistribution of BiPTE released from the formulations to the four main release areas should be responsible for the observed QARE. This is due to the anti-CD3 arm of BiPTE attracting CTLs to these distribution areas via the CD3 ligand located on the surface of CTLs. Therefore, the QARE may be regarded as an indicator of the amount of BiPTE–CTL complex in the four main biodistribution areas.
 |
Figure 7 BiPTE/nsTPPgels can accumulate large amounts of T cells at the injection site and lymph node areas, demonstrating their potential feasibility as artificial lymph nodes. (a) Schematic diagram of the liver, tumor, injection site, and lymph nodes in IVIS imaging. Average radiant efficiencies of DiR-labeled a-huPBMCs in the (b) injection site, (c) tumor, (d) lymph node, and (e) liver at 2, 6, 12, 24, 52, 72, and 96 h after injection of intravenous (i.v.) BiPTE sol, subcutaneous (s.c.) BiPTE sol, BiPTE/DTgel-2, BiPTE/DTgel-2S, and BiPTE/D2gel with a dose equal to 5 mg/kg. Data are expressed as mean ± SD (n = 3). |
Examination of the QARE at the injection site (Figure 7b) showed that the QARE time curve for the control group and intravenous BiPTE sol group remained flat at a low level until the last time point, similar to the pattern observed for the subcutaneous BiPTE sol group. The flat QARE time curve of the control group and the intravenous BiPTE sol group may be explained by the fact that both groups received intravenous rather than subcutaneous injections. The only explanation for the subcutaneous BiPTE sol group’s QARE remaining flat at a low level until the last time point was that as soon as BiPTE was released from the subcutaneously injected BiPTE sol, it spread out of the injection site without delay, leading to minimal attraction of CTLs to the injection site. Surprisingly, the three hydrogel groups’ QARE at the injection site increased steadily until the last time point, gradually approaching a maximum QARE of about 15~20. This indicated that the sustained release of BiPTE from the three hydrogel groups resulted in not only attraction of CTLs to the injection site by the steady stream of BiPTE, but also retention of some BiPTE in the hydrogel depot, effectively turning it into an artificial lymph node that armed CTLs with BiPTE for killing cancer cells. This may partly explain why the TGI of the three hydrogel groups was higher than that of the intravenous and subcutaneous BiPTE sol groups.
Since the presence of DiR–CTLs within the tumor region indicates a higher chance of initiating T-cell immunotherapy through the release of granzyme B and perforin by BiPTE connecting CD3 on CTLs with PSMA on LNCaP, the QARE of DiR–CTLs measured at tumor sites would be the most direct evidence for explaining the TGI of the treatment groups. After treatment administration, the QARE profiles of the three hydrogel groups, BiPTE/DTgel-2, BiPTE/DTgel-2S, and BiPTE/D2gel, measured at tumor sites gradually increased to a greater extent than the QARE profiles of the control, intravenous BiPTE sol, and subcutaneous BiPTE sol groups (Figure 7c). This further confirms that the TGI of the three hydrogel groups was higher than that of the intravenous and subcutaneous BiPTE sol groups. However, the TGI of the three hydrogel treatment groups followed the order of BiPTE/D2gel > BiPTE/DTgel-2S > BiPTE/DTgel-2, whereas the QARE of these treatment groups measured at the tumor site followed the order of BiPTE/D2gel ≈ BiPTE/DTgel-2 > BiPTE/DTgel-2S. This suggests that the QARE emitted by DiR–CTLs measured at tumor sites did not fully account for the therapeutic effects, as not all DiR–CTLs attracted to the tumor site formed complexes with BiPTE; this means that not all DiR–CTL-emitted QARE at the tumor site formed a complex with BiPTE that could connect another arm with PSMA on LNCaP cells to initiate T-cell immunotherapy by releasing granzyme B and perforin for killing tumor cells. Nevertheless, selective infiltration of DiR–CTLs into the tumor environment with a larger QARE of the three nsTPPgel groups also implied that there was a higher chance of infiltrated DiR–CTLs connecting with BiPTE targeting PSMA-positive tumor cells to initiate T-cell immunotherapy for killing tumor cells.
After subcutaneous administration, the released BiPTE with a larger molecular weight (75–80 kDa) can enter lymphatic venules30 and circulate through the lymphatic system. This suggests that DiR–CTLs present in the sciatic lymph node would likely form complexes with BiPTE, ensuring that these DiR–CTL–BiPTE complexes migrate to the tumor site. The QARE emitted by DiR–CTLs measured in the sciatic lymph node is shown in Figure 7d. The QARE time curve of the control group and intravenous BiPTE sol group remained consistently flat at the initial low level until the last time point, while the subcutaneous BiPTE sol group followed a similar pattern but at an even lower level than that at the initial time point. The QARE time curve of the control group and the intravenous BiPTE sol group remained flat at a constant level, which was the same as that at the initial time point, until the last time point; this may be because both treatments were intravenously injected instead of subcutaneously injected, leading to no BiPTE being transported into the sciatic lymph node. In the case of the subcutaneous BiPTE sol group, the QARE remaining flat, at a level lower than that at the initial time point, until the last time point suggests that once BiPTE was released from the subcutaneous injection, it quickly dispersed out of the injection site, resulting in minimal attraction of CTLs to the site for migration into the sciatic lymph node. Unexpectedly, the increase in the QARE in the sciatic lymph node in the three hydrogel groups was steady until the last time point at 96 h when it gradually approached the flatness of maximum QARE of about 16, 15, and 14, for BiPTE/D2gel, BiPTE/DTgel-2S, and DTgel-2, respectively. Since the BiPTE released from the three nsTPPgels has a greater chance of migrating into the sciatic lymph node, the larger QARE emitted by the DiR–CTLs was expected to cause a higher portion of DiR–CTLs complexed with BiPTE to migrate into the sciatic lymph node and target the tumor site with the anti-PSMA targeting arm on BiPTE, resulting in enhanced TGI. Accordingly, TGI of the three hydrogel groups was found to follow the order of D2gel > DTgel-2S > DTgel-2. This result was consistent with the conclusions drawn from our anti-tumor experiments (Figure 5). Therefore, we inferred that the QARE emitted by the CTLs in the sciatic lymph nodes was more likely to be correlated with TGI than that emitted at the tumor site. This may be due to the CTLs in the sciatic lymph node having a higher tendency to complex with BiPTE that migrated to the sciatic lymph node, thereby enhancing their effectiveness in not only targeting but also initiating T-cell immunotherapy by releasing granzyme B and perforin for eliminating tumor cells.
In the biodistribution analysis of CTLs in the liver (Figure 7e), the fluorescence observed in the liver of the control group, which did not receive a BiPTE injection, represents the natural distribution of CTLs in the liver. In contrast, groups injected with BiPTE via intravenous or subcutaneous administration, including those subcutaneously administered with the three BiPTE/nsTPPgels, exhibited higher levels of CTL biodistribution in the liver. This enhanced distribution may be attributed to BiPTE accumulation in the liver, facilitated by the anti-CD3 arm of BiPTE that attracts CTLs via CD3 ligands on their surface. Therefore, the expression of QARE by CTLs in the liver is expected to be positively correlated with the plasma concentration of BiPTE. However, BiPTE–CTL complexes that are trapped in the reticuloendothelial system of the liver, exhibiting lower QARE values, are unlikely to significantly contribute to the enhancement of TGI in the respective treatment groups.
Moreover, the results of this study highlights the ability of all three BiPTE/nsTPPgels to cause the accumulation of a significant amount of CTLs in the sciatic lymph nodes. Although simultaneous monitoring of signals from all lymph nodes is challenging, the observed CTL signals in the sciatic lymph nodes suggest a positive correlation between CTL accumulation in lymph nodes and the propensity to kill tumor cells. This indicates that BiPTE/nsTPPgels can act as depots at the injection site, functioning similarly to artificial lymph nodes. These depots continuously attract T cells to the vicinity of the hydrogel and facilitate their activation by the released BiPTE. Therefore, we hypothesize that by injecting these hydrogels, a-huPBMCs serving as a CTL source in both blood and lymph nodes could be attracted to the injection site. Subsequently, these a-huPBMCs (CTLs) armed with BiPTE could facilitate the migration of CTLs to the tumor site via the targeting arm of PSMA on BiPTE, thereby enhancing therapeutic efficacy against solid tumors.
Due to the exceptional therapeutic efficacy of the BiPTE/nsTPPgel groups, particularly BiPTE/DTgel-2S and BiPTE/D2gel, several key points can be made. On release from nsTPPgel, BiPTE not only attracted CTLs to the injection site, but also facilitated the migration of these antibody-armed (via anti-CD3 arm) CTLs to the tumor site via the anti-targeting tumor-associated antigen arm. This strategy of using “bi-armed activated T cells” has been validated in multiple studies.54,55 In addition, we also substantiated through pharmacokinetic studies and IVIS imaging that the use of a thermosensitive hydrogel to release BiPTE holds significant medical potential. Moreover, the efficacious treatment of solid tumors after subcutaneous administration of BiPTE/ nsTPPgels at the site opposite to the implanted tumor indicated the targeting potential of the anti-PSMA arm on BiPTE and implied that intratumoral or peritumoral injection of BiPTE/ nsTPPgels would be able to further promote therapeutic efficiency against solid tumors. Among the various nsTPPgels tested in this experiment, D2gel exhibited the most remarkable therapeutic outcomes. Its superiority may be attributable to its ability to efficiently target the tumor site with the BiTE–CTL complex and to arm CTLs with BiPTE within the lymphatic circulation system. In addition, selective infiltration of CTLs into the tumor environment facilitates the targeting of PSMA-positive tumor cells by BiPTE, which initiates T-cell immunotherapy by releasing granzyme B and perforin for killing tumor cells, leading to enhanced TGI. Furthermore, the simpler design of the D2gel, compared to that of DTgel, further supports its status as the optimal formulation. Importantly, D2gel represents a versatile platform, suggesting that different BiTEs could achieve outstanding and safe therapeutic outcomes through similar formulations.
Conclusion
This study successfully developed and validated nsTPPgels—a hydrogel platform suitable for protein drug delivery—and used BiPTE as a model drug to demonstrate its tumor suppression efficacy in PSMA-overexpressing prostate cancer. Among all the nsTPPgels, D2gel stood out due to its use of a single copolymer, offering the advantage of easier preparation. Its nonshrinkage property makes it particularly suitable for delivering therapeutics like Bispecific T Cell Engagers, which require narrow therapeutic windows. In conclusion, D2gel provides a robust, efficient, and easily manufacturable drug delivery system that not only ensures sustained release of BiPTE but also supports targeted T-cell recruitment to tumor sites, enhancing anti-tumor efficacy. This approach offers an attractive solution for protein therapeutics, minimizing dosing frequency while maximizing therapeutic impact against solid tumors.
Acknowledgment
This work was financial supported by the National Science and Technology Council, ROC (NSTC 112-2221-E-037-002). The authors would like to acknowledge the Laboratory Animal Center at TMU for technical support in in vivo imaging studies.
Disclosure
Dr Pu-Sheng Wei reports a patent US11680107B2 licensed to Taipei Medical University. The authors declare that they have no known competing financial interests or personal relationships that could have appeared to influence the work reported in this paper.
References
1. Kamakura D, Asano R, Yasunaga M. T cell bispecific antibodies: an antibody-based delivery system for inducing antitumor immunity. Pharmaceuticals. 2021;14(11):1172. doi:10.3390/ph14111172
2. Runcie K, Budman DR, John V, Seetharamu N. Bi-specific and tri-specific antibodies- the next big thing in solid tumor therapeutics. Mol Med. 2018;24(1):50. doi:10.1186/s10020-018-0051-4
3. Hijazi Y, Klinger M, Kratzer A, et al. Pharmacokinetic and pharmacodynamic relationship of blinatumomab in patients with non-Hodgkin lymphoma. Current Clin Pharmacol. 2018;13(1):55–64. doi:10.2174/1574884713666180518102514
4. Slaney CY, Wang P, Darcy PK, Kershaw MH. CARs versus BiTEs: a comparison between T cell-redirection strategies for cancer treatment. Cancer Discovery. 2018;8(8):924–934. doi:10.1158/2159-8290.cd-18-0297
5. Herrington-Symes AP, Farys M, Khalili H, Brocchini S. Antibody fragments: prolonging circulation half-life special issue-antibody research. Adv Biosci Biotechnol. 2013;4(05):689–698. doi:10.4236/abb.2013.45090
6. Ahamadi-Fesharaki R, Fateh A, Vaziri F, et al. Single-chain variable fragment-based bispecific antibodies: hitting two targets with one sophisticated arrow. mol Ther Oncolytics. 2019;14:38–56. doi:10.1016/j.omto.2019.02.004
7. Lou H, Cao X. Antibody variable region engineering for improving cancer immunotherapy. Cancer Commun. 2022;42(9):804–827. doi:10.1002/cac2.12330
8. Nguyen A, Reyes AE 2nd, Zhang M, et al. The pharmacokinetics of an albumin-binding Fab (AB.Fab) can be modulated as a function of affinity for albumin. Protein Engineering, Design & Selection: PEDS. 2006;19(7):291–297. doi:10.1093/protein/gzl011
9. Müller D, Karle A, Meissburger B, Höfig I, Stork R, Kontermann RE. Improved pharmacokinetics of recombinant bispecific antibody molecules by fusion to human serum albumin. J Biol Chem. 2007;282(17):12650–12660. doi:10.1074/jbc.M700820200
10. Andersen JT, Sandlie I. The versatile MHC class I-related FcRn protects IgG and albumin from degradation: implications for development of new diagnostics and therapeutics. Drug Metab. Pharmacokinet. 2009;24(4):318–332. doi:10.2133/dmpk.24.318
11. Davé E, Adams R, Zaccheo O, et al. Fab-dsFv: a bispecific antibody format with extended serum half-life through albumin binding. mAbs. 2016;8(7):1319–1335. doi:10.1080/19420862.2016.1210747
12. Guo R, Guo W, Cao L, et al. Fusion of an albumin-binding domain extends the half-life of immunotoxins. Int J Pharm. 2016;511(1):538–549. doi:10.1016/j.ijpharm.2016.07.046
13. Chames P, Van Regenmortel M, Weiss E, Baty D. Therapeutic antibodies: successes, limitations and hopes for the future. Br. J. Pharmacol. 2009;157(2):220–233. doi:10.1111/j.1476-5381.2009.00190.x
14. Haraldsson B, Nyström J, Deen WM. Properties of the glomerular barrier and mechanisms of proteinuria. Physiol Rev. 2008;88(2):451–487. doi:10.1152/physrev.00055.2006
15. Kang JS, Deluca PP, Lee KC. Emerging PEGylated drugs. Expert Opinion on Emerg Drugs. 2009;14(2):363–380. doi:10.1517/14728210902907847
16. Chen C, Constantinou A, Deonarain M. Modulating antibody pharmacokinetics using hydrophilic polymers. Expert Opin Drug Delivery. 2011;8(9):1221–1236. doi:10.1517/17425247.2011.602399
17. Liebner R, Mathaes R, Meyer M, Hey T, Winter G, Besheer A. Protein HESylation for half-life extension: synthesis, characterization and pharmacokinetics of HESylated anakinra. Eur J Pharmaceutics and Biopharmaceutics. 2014;87(2):378–385. doi:10.1016/j.ejpb.2014.03.010
18. Seifert O, Kontermann RE. GlycoTAIL and FlexiTAIL as half-life extension modules for recombinant antibody fragments. Molecules. 2022;27(10):3272. doi:10.3390/molecules27103272
19. Jain M, Kamal N, Batra SK. Engineering antibodies for clinical applications. Trends Biotechnol. 2007;25(7):307–316. doi:10.1016/j.tibtech.2007.05.001
20. Schneider EL, Hearn BR, Pfaff SJ, et al. Approach for half-life extension of small antibody fragments that does not affect tissue uptake. Bioconjugate Chem. 2016;27(10):2534–2539. doi:10.1021/acs.bioconjchem.6b00469
21. Vermonden T, Censi R, Hennink WE. Hydrogels for Protein Delivery. Chem. Rev. 2012;112(5):2853–2888. doi:10.1021/cr200157d
22. Bae KH, Kurisawa M. Emerging hydrogel designs for controlled protein delivery. Biomater. Sci. 2016;4(8):1184–1192. doi:10.1039/C6BM00330C
23. Malta R, Marques AC, Costa PCD, Amaral MH. Stimuli- responsive hydrogels for protein delivery. Gels. 2023;9(10):802. doi:10.3390/gels9100802
24. Thang NH, Chien TB, Cuong DX. Polymer-based hydrogels applied in drug delivery: an overview. Gels. 2023;9(7):523. doi:10.3390/gels9070523
25. Lau CML, Jahanmir G, Yu Y, Chau Y. Controllable multi-phase protein release from in-situ hydrolyzable hydrogel. J Control Release. 2021;335:75–85. doi:10.1016/j.jconrel.2021.05.006
26. Li J, Mooney DJ. Designing hydrogels for controlled drug delivery. Nature Rev Mater. 2016;1(12). doi:10.1038/natrevmats.2016.71
27. Carrasco MJ, Alishetty S, Alameh M-G, et al. Ionization and structural properties of mRNA lipid nanoparticles influence expression in intramuscular and intravascular administration. Commun. Biol. 2021;4(1):956. doi:10.1038/s42003-021-02441-2
28. Khan B, Arbab A, Khan S, et al. Recent progress in thermosensitive hydrogels and their applications in drug delivery area. MedComm – Biomaterials and Applications. 2023;2(3):e55. doi:10.1002/mba2.55
29. Brenner S, Jacob F, Meselson M. An unstable intermediate carrying information from genes to ribosomes for protein synthesis. Nature. 1961;190(4776):576–581. doi:10.1038/190576a0
30. Jarvi NL, Balu-Iyer SV. Immunogenicity challenges associated with subcutaneous delivery of therapeutic proteins. BioDrugs. 2021;35(2):125–146. doi:10.1007/s40259-020-00465-4
31. Kim SY, Kim HJ, Lee KE, Han SS, Sohn YS, Jeong B. Reverse thermal gelling PEG−PTMC diblock copolymer aqueous solution. Macromolecules. 2007;40(15):5519–5525. doi:10.1021/ma070190z
32. Cespi M, Bonacucina G, Tiboni M, et al. Insights in the rheological properties of PLGA-PEG-PLGA aqueous dispersions: structural properties and temperature-dependent behaviour. Polymer. 2021;213(123216):123216. doi:10.1016/j.polymer.2020.123216
33. Izunobi JU, Higginbotham CL. Polymer molecular weight analysis by 1H NMR spectroscopy. J Chem Educ. 2011;88(8):1098–1104. doi:10.1021/ed100461v
34. Xie B, Jin L, Luo Z, et al. An injectable thermosensitive polymeric hydrogel for sustained release of Avastin® to treat posterior segment disease. Int J Pharm. 2015;490(1–2):375–383. doi:10.1016/j.ijpharm.2015.05.071
35. Jeong B, Han Bae Y, Wan Kim S. Biodegradable thermosensitive micelles of PEG-PLGA-PEG triblock copolymers. Colloids Surf. B. 1999;16(1):185–193. doi:10.1016/S0927-7765(99)00069-7
36. Jeong B, Bae YH, Kim SW. Thermoreversible Gelation of PEG−PLGA−PEG triblock copolymer aqueous solutions. Macromolecules. 1999;32(21):7064–7069. doi:10.1021/ma9908999
37. Heller J, Baker RW. THEORY AND PRACTICE OF CONTROLLED DRUG DELIVERY FROM BIOERODIBLE POLYMERS. In: Baker R, editor. Controlled Release of Bioactive Materials. Academic Press; 1980:1–17.
38. Jeong B, Bae YH, Kim SW. Drug release from biodegradable injectable thermosensitive hydrogel of PEG–PLGA–PEG triblock copolymers. J Control Release. 2000;63(1):155–163. doi:10.1016/S0168-3659(99)00194-7
39. Lacerda JF, Ladanyi M, Louie DC, Fernandez JM, Papadopoulos EB, O’Reilly RJ. Human Epstein-Barr virus (EBV)-specific cytotoxic T lymphocytes home preferentially to and induce selective regressions of autologous EBV-induced B cell lymphoproliferations in xenografted CB-17 scid/scid mice. J Exp Med. 1996;183(3):1215–1228. doi:10.1084/jem.183.3.1215
40. Choi BD, Gedeon PC, Herndon JE 2nd, et al. Human regulatory T cells kill tumor cells through granzyme-dependent cytotoxicity upon retargeting with a bispecific antibody. Cancer Immunol Res. 2013;1(3):163. doi:10.1158/2326-6066.cir-13-0049
41. Leclercq G, Servera LA, Danilin S, et al. Dissecting the mechanism of cytokine release induced by T-cell engagers highlights the contribution of neutrophils. Oncoimmunology. 2022;11(1):2039432. doi:10.1080/2162402x.2022.2039432
42. Liang B, Li N, Zhang S, et al. Idarubicin-loaded methoxy poly (ethylene glycol)-b-poly (l-lactide-co-glycolide) nanoparticles for enhancing cellular uptake and promoting antileukemia activity. Int j Nanomed. 2019;14:543. doi:10.2147/IJN.S190027
43. Qiao M, Chen D, Ma X, Liu Y. Injectable biodegradable temperature-responsive PLGA–PEG–PLGA copolymers: synthesis and effect of copolymer composition on the drug release from the copolymer-based hydrogels. Int J Pharm. 2005;294(1–2):103–112. doi:10.1016/j.ijpharm.2005.01.017
44. Lee DS, Shim MS, Kim SW, Lee H, Park I, Chang T. Novel thermoreversible gelation of biodegradable PLGA‐block‐PEO‐block‐PLGA triblock copolymers in aqueous solution. Macromolecular Rapid Communications. 2001;22(8):587–592. doi:10.1002/1521-3927(20010501)22:8<587::AID-MARC587>3.0.CO;2-8
45. Shim MS, Lee HT, Shim WS, et al. Poly (D, L‐lactic acid‐co‐glycolic acid)‐b‐poly (ethylene glycol)‐b‐poly (D, L‐lactic acid‐co‐glycolic acid) triblock copolymer and thermoreversible phase transition in water. J Biomed Mater Res. 2002;61(2):188–196. doi:10.1002/jbm.10164
46. Dutta K, Das R, Ling J, et al. In situ forming injectable thermoresponsive hydrogels for controlled delivery of biomacromolecules. Am Chemical Soc Omega. 2020;5(28):17531–17542. doi:10.1021/acsomega.0c02009
47. Zhang L, Eisenberg A. Multiple morphologies of “crew-cut” aggregates of polystyrene-b-poly(acrylic acid) block copolymers. Science. 1995;268(5218):1728–1731. doi:10.1126/science.268.5218.1728
48. Bonacucina G, Cespi M, Mencarelli G, Giorgioni G, Palmieri GF. Thermosensitive self-assembling block copolymers as drug delivery systems. Polymers. 2011;3(2):779–811. doi:10.3390/polym3020779
49. Gong C, Qi T, Wei X, et al. Thermosensitive polymeric hydrogels as drug delivery systems. Curr. Med. Chem. 2013;20(1):79–94. doi:10.2174/0929867311302010009
50. Pan A, Wang Z, Chen B, et al. Localized co-delivery of collagenase and trastuzumab by thermosensitive hydrogels for enhanced antitumor efficacy in human breast xenograft. Drug Delivery. 2018;25(1):1495–1503. doi:10.1080/10717544.2018.1474971
51. Lo YW, Sheu MT, Chiang WH, et al. In situ chemically crosslinked injectable hydrogels for the subcutaneous delivery of trastuzumab to treat breast cancer. Acta Biomater. 2019;86:280–290. doi:10.1016/j.actbio.2019.01.003
52. Pan H, Liu J, Deng W, Xing J, Li Q, Wang Z. Site-specific PEGylation of an anti-CEA/CD3 bispecific antibody improves its antitumor efficacy. Int J Nanomed. 2018;13:3189–3201. doi:10.2147/ijn.s164542
53. Cullen SP, Brunet M, Martin SJ. Granzymes in cancer and immunity. Cell Death Differ. 2010;17(4):616–623. doi:10.1038/cdd.2009.206
54. Shanshal M, Caimi PF, Adjei AA, Ma WW. T-cell engagers in solid cancers-current landscape and future directions. Cancers. 2023;15(10):2824. doi:10.3390/cancers15102824
55. Simão DC, Zarrabi KK, Mendes JL, et al. Bispecific T-cell engagers therapies in solid tumors: focusing on prostate cancer. Cancers. 2023;15(5):1412. doi:10.3390/cancers15051412
 © 2025 The Author(s). This work is published and licensed by Dove Medical Press Limited. The
full terms of this license are available at https://www.dovepress.com/terms.php
and incorporate the Creative Commons Attribution
- Non Commercial (unported, 3.0) License.
By accessing the work you hereby accept the Terms. Non-commercial uses of the work are permitted
without any further permission from Dove Medical Press Limited, provided the work is properly
attributed. For permission for commercial use of this work, please see paragraphs 4.2 and 5 of our Terms.
© 2025 The Author(s). This work is published and licensed by Dove Medical Press Limited. The
full terms of this license are available at https://www.dovepress.com/terms.php
and incorporate the Creative Commons Attribution
- Non Commercial (unported, 3.0) License.
By accessing the work you hereby accept the Terms. Non-commercial uses of the work are permitted
without any further permission from Dove Medical Press Limited, provided the work is properly
attributed. For permission for commercial use of this work, please see paragraphs 4.2 and 5 of our Terms.