")
Back to Journals » International Journal of Nanomedicine » Volume 19
Optimization of Lipid-Based Nanoparticles Formulation Loaded with Biological Product Using A Novel Design Vortex Tube Reactor via Flow Chemistry
Authors Suwanpitak K , Huanbutta K, Weeranoppanant N, Sriamornsak P, Panpipat C, Sangnim T
Received 20 April 2024
Accepted for publication 18 August 2024
Published 27 August 2024 Volume 2024:19 Pages 8729—8750
DOI https://doi.org/10.2147/IJN.S474775
Checked for plagiarism Yes
Review by Single anonymous peer review
Peer reviewer comments 2
Editor who approved publication: Dr Krishna Nune
Kittipat Suwanpitak,1 Kampanart Huanbutta,2 Nopphon Weeranoppanant,3 Pornsak Sriamornsak,4,5 Chonlada Panpipat,1 Tanikan Sangnim1
1Faculty of Pharmaceutical Sciences, Burapha University, Chonburi, 20131, Thailand; 2Department of Manufacturing Pharmacy, College of Pharmacy, Rangsit University, Pathum Thani, 12000, Thailand; 3Department of Chemical Engineering, Faculty of Engineering, Burapha University, Chonburi, 20131, Thailand; 4Department of Industrial Pharmacy, Faculty of Pharmacy, Silpakorn University, Nakhon Pathom, 73000, Thailand; 5Academy of Science, the Royal Society of Thailand, Bangkok, 10300, Thailand
Correspondence: Tanikan Sangnim, Faculty of Pharmaceutical Sciences, Burapha University, 169, Seansook, Muang, Chonburi, 20131, Thailand, Email [email protected]
Introduction: Lipid-based nanoparticles (LNPs) is increasingly recognized for their potential in drug delivery, offering protection to hydrophobic drugs from degradation. Industrial synthesis of LNPs, exemplified by Pfizer-BioNTech and Moderna mRNA vaccines, utilizes flow chemistry or microfluidics, showcasing its scalability. This study explores the utilization of a novel design reactor, the vortex tube reactor, within flow chemistry for LNPs synthesis, aiming to optimize its conditions and compare them with batch synthesis.
Methods: LNPs were synthesized using the vortex tube reactor, incorporating bovine serum albumin (BSA) as a model drug in the aqueous phase, alongside 1.2-dipalmitoyl-sn-glycero-3-phosphocholine (DPPC) and cholesterol in the organic phase. Design of experiments (DoE), specifically Box-Behnken design, was employed to optimize parameters, including X1: the flow rate ratio (10– 100 mL/min), X2: the aqueous-to-organic volumetric ratio (1:1– 10:1), and X3: the number of reactor units (1– 5 units). Responses evaluated encompassed physical properties and productivity. Optimized conditions were determined by minimizing particle size (Y1), polydispersity index (Y2), and zeta potential (Y3), while maximizing entrapment efficiency (Y4), drug loading (Y5), and productivity (Y5).
Results: Results indicated that optimal conditions were achieved at X1 of 100 mL/min, X2 of 5.278, and X3 of 1 unit. LNPs synthesized under these conditions exhibited favorable physical properties and productivity, with uniformity maintained across batches. The vortex tube reactor demonstrated superiority over batch synthesis, yielding smaller particles (166.23 ± 0.98 nm), more uniform nanoparticles (PDI 0.17 ± 0.01), and higher entrapment (67.75 ± 1.55%) and loading capacities (36.39 ± 0.83%), indicative of enhanced productivity (313.4 ± 12.88 mg/min).
Conclusion: This study elucidates the potential of flow chemistry, particularly utilizing the vortex tube reactor, for large-scale LNPs formulation, offering insights into parameter relationships and advancing nanoparticle synthesis for drug delivery applications.
Keywords: flow chemistry, lipid-based nanoparticles, nanoparticles synthesis, biological product
Graphical Abstract:

Introduction
Nanoparticles have transformed drug delivery, spanning sizes from 1 to 1000 nm. This innovation promises enhanced drug efficacy while minimizing side effects. These nanoparticles enable precise drug delivery to target cells, controlled release, and targeted distribution through surface modification with ligands. They are currently being developed as drug delivery systems for various substances and vaccines on the market, including AmBisome, DepoCyt, Doxil, Inflexal, Myocet, Pfizer-BioNTech vaccines, and Moderna mRNA vaccines.1,2 Nanoparticles have garnered significant attention in drug delivery due to their unique properties, such as a high surface area-to-volume ratio, the ability to traverse biological barriers, and the capacity to encapsulate both hydrophobic and hydrophilic drugs. Various types of nanoparticles, including polymeric, inorganic, and lipid-based nanoparticles, have been developed for drug delivery applications.3
Lipid-based nanoparticles (LNPs) constitute a subclass of nanoparticles composed primarily of lipids, which have garnered significant attention in recent years. LNPs present several advantages over alternative nanoparticle systems, including high stability, biocompatibility, and the capability to target specific cells or tissues. This targeted approach enhances drug efficacy while mitigating side effects. Moreover, the customization of LNPs through surface modification with targeting ligands further refines their specificity toward desired cells or tissues, thus optimizing drug delivery efficiency. Structurally, LNPs typically comprise a lipid bilayer surrounding an aqueous core, forming a versatile platform for drug encapsulation. This architecture facilitates the encapsulation of both hydrophobic and hydrophilic drugs within the lipid bilayer or aqueous core, respectively, enabling the simultaneous delivery of multiple therapeutic agents. Moreover, the lipid bilayer contributes to the stability of LNPs in biological environments, shielding encapsulated drugs from degradation and extending their circulation time in the bloodstream.3,4 LNPs can be synthesized using various techniques, such as sonication,5 microfluidics,6 and extrusion.7 However, traditional formulations typically involve batch chemical synthesis have limitations in terms of reproducibility, scalability, and particle size control in a non-continuous production process.8
To overcome these limitations, flow chemistry has emerged as a promising method for LNPs synthesis. Flow chemistry reactors offer numerous benefits compared to traditional batch reactors, such as precise control over reaction parameters, improved reproducibility, and scalability for industrial manufacturing. By harnessing the continuous flow characteristic of these reactors, high mixing efficiency and rapid reaction kinetics are achievable, enhancing control over particle properties.9,10 However, microfluidic productivity remains insufficient for large-scale industries, and particle formation may obstruct small channels within these reactors.11
Hence, advancing the novel design of a vortex tube reactor is imperative for the future development of a flow chemistry, enabling high productivity and mixing efficiency within a short synthesis timeframe. In flow chemistry system with vortex tube reactor, reactants are continuously pumped through a reactor, which provides high mixing performance and rapid mixing. This reactor comprises two inlets, where the flow streamlines at the mixer inlet of the aqueous phase are connected with those at the mixer inlet of organic phase via a fin to facilitate mixing. The fluid flow is directed tangentially within the mixer section, and the whirling fluid flow is compelled by the fin to change its direction and form a vortex streamline before leaving the mixer through the outlet. This vortex streamline then passes through the reactor to enhance mixing and mass transfer, thereby increasing productivity. To further elevate the fluid velocity, the streamlines are separated into four pathways via the by-pass tube, which creates an appropriate environment for vortex mixing of the reagents within the chamber. This results in improved reaction efficiency and faster reaction times compared to tubular reactor and batch methods.12,13
LNPs for vaccine delivery, such as the Pfizer-BioNTech vaccines and Moderna mRNA vaccines, were synthesized using flow chemistry or microfluidics on an industrial scale.14 This demonstrates the potential for utilizing flow chemistry with the vortex tube reactor to synthesize LNPs for bioproduct delivery. LNPs can be synthesized in a flow reactor by mixing lipids, a stabilizer, and the drug of interest in a suitable solvent, and then adding the mixture to an aqueous solution under controlled conditions.6 One of the challenges in LNPs development is the selection of an appropriate model drug for biological drugs. Bovine serum albumin (BSA), a protein commonly found in blood plasma, has been widely used as a model drug for testing the effectiveness of LNPs delivery systems. BSA is an ideal model drug as it is similar in size and structure to many therapeutic proteins and is readily available. In this paper, we explore the use of flow chemistry for the synthesis of LNPs using BSA as a model drug.15 We also evaluate the effect of different instrumental methods on LNPs properties and productivity. Partial least squares (PLS) models were generated to uncover the relationship between process parameters and particle properties,16 aiding in the future development of LNPs synthesis.
Materials and Methods
Materials
Bovine serum albumin (BSA), lot SLCF8575, laboratory grade, was purchased from Sigma Aldrich, Inc. (St. Louis, MO, USA). Dipalmitoylphosphatidylcholine (DPPC), lot 580355P-1G-D-326, laboratory grade, was purchased from Avanti polar lipids (Birmingham, AL, USA). Cholesterol, lot SLCP9543, laboratory grade, was purchased from Sigma Aldrich, Inc. (St. Louis, MO, USA). Ethanol, lot L1215483-220, laboratory grade, was purchased from Sigma Aldrich, Inc. (St. Louis, MO, USA). Bradford reagent, SLCP9543, laboratory grade, was purchased from Sigma Aldrich, Inc. (St. Louis, MO, USA).
Formulating Lipid-Based Nanoparticles Through a Vortex Tube Reactor Using the Box-Behnken Design
The lipid-based nanoparticles (LNPs) was produced using a vortex tube reactor, as described in the previous study,12 by combining an aqueous solution of 2 mg/mL of bovine serum albumin (BSA), as the biological model drug, in DI water and an organic phase of ethanol containing dipalmitoylphosphatidylcholine (DPPC) and cholesterol lipids in a weight ratio of 70:30, at a total concentration of 10 mg/mL, which the experimental setting-up shown in Figure 1.
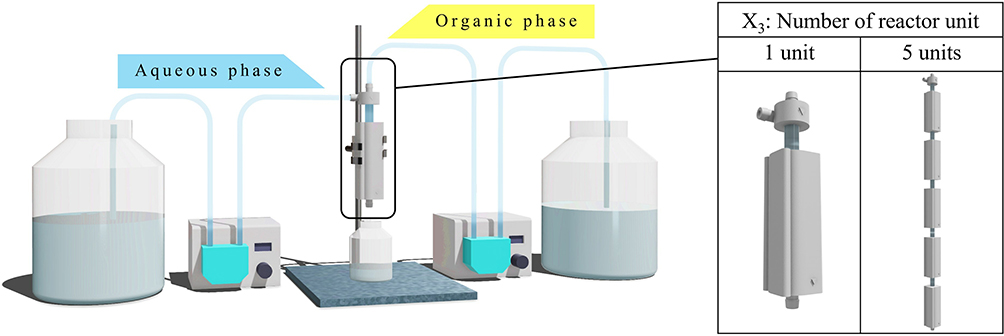 |
Figure 1 Schematic representation of the experimental setting-up of the vortex tube reactor in synthesis of lipid-based nanoparticles. |
The influence of various system parameters on the final formulation was investigated by an experimental design called the 3-factor, 3-level Box-Behnken design, as shown in Table 1. The factors of interest in this study were X1: total flow rate of the incoming streams from 10 to 100 mL/min, X2: aqueous-to-organic volumetric ratio of the incoming streams from a ratio of 1:1 to 10:1 (aqueous-to-organic volumetric ratio), and X3: the number of reactor units ranging from 1–5 units. Total flow rate represents the combined flow rate of the organic and aqueous phases that are pumped through the two inlets, while aqueous-to-organic volumetric ratio refers to the volume ratio of the aqueous and organic phases. These factors were related to the responses of the study, which included Y1: z-average, Y2: polydispersity index, Y3: zeta potential, Y4: %entrapment efficiency, Y5: %drug loading capacity, and Y6: productivity. The collected samples were transferred to centrifugal ultrafiltration with MWCO of 30 kDa (Amicon Ultra-15 filter, Merck, Germany) and centrifuged at 8,000 rpm and 4°C for 30 minutes. The retentate containing loaded BSA was redispersed to 1.5 mL with DI water and kept at 2°C - 8°C in the refrigerator.
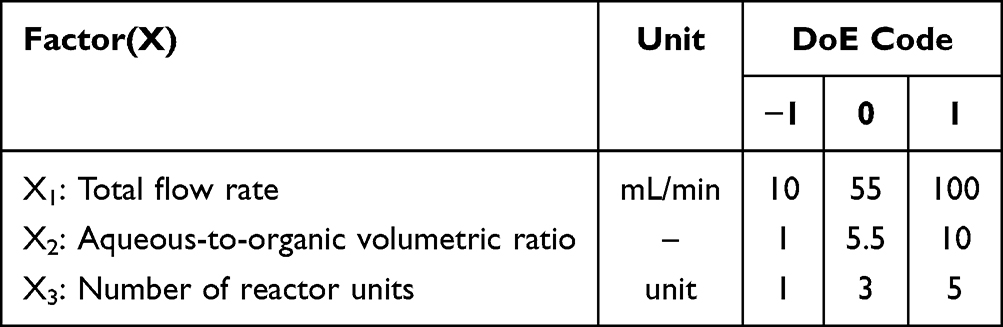 |
Table 1 The Interested Factors on Formulation of Lipid-Based Nanoparticles Using a Vortex Tube Reactor |
Lyophilization of Lipid-Based Nanoparticles
To obtain powdered particles from lipid-based nanoparticles, the samples were filled into cryovials, each containing up to 1 mL of the sample. Subsequently, these cryovials were subjected to an initial deep-freezing step at −80°C for a duration of 2–3 hours. After this initial freezing step, the cryovials were transferred to the vacuum chamber of a lyophilizer (Christ Gamma 2–16 LSCplus, Martin Christ, Germany). Within this vacuum chamber, the samples underwent the lyophilization process, during which all the water within the samples was completely sublimated.
The Physical Characteristics of Lipid-Based Nanoparticles
The particle size, polydispersity index and zeta potential were evaluated using a zeta sizer (MAL1070387, Malvern, UK). To perform the measurements, the lipid-based nanoparticles samples were diluted to a concentration of 10% v/v using deionized water and agitated for 3 minutes before analysis. The average values and standard error were calculated based on measurements from three batches of samples.
Entrapment Efficiency and Loading Capacity Evaluation
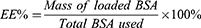
To measure the bovine serum albumin (BSA) loading in lipid nanoparticles (LNPs), this method was modified from Roshan Goswami et.al,17 and integrated it with Bradford assay.18 Specifically, 100 µL of the retentate containing loaded BSA was taken in the centrifugal ultrafiltration. This initial sample was diluted by adding 100 µL of 0.1% Triton X-100 in DI water. Triton X-100 disrupts the integrity of LNPs, leading to the release of the BSA encapsulated within the LNPs. Subsequently, this diluted sample was further diluted by 60 times the original volume of DI water. Following by Bradford Assay to quantify the BSA content, 200 µL of Bradford reagent was added to 200 µL of the diluted sample. The mixture was then incubated for 10 minutes at room temperature. The Bradford assay is based on the formation of a dry-protein complex, with absorbance measured at 595 nm. The concentration of BSA in the LNPs was determined by comparing the absorbance values to a standard curve constructed using known BSA concentrations. The encapsulation efficiency (EE%) was calculated as the percentage of BSA incorporated compared to the initial BSA concentration available using the following equation:
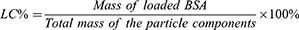
Loading capacity (LC%) was calculated as the percentage of the mass of BSA-loaded divided by the total mass of the particle component (lyophilized LNPs) using the following equation:
Productivity Evaluation
To calculate the productivity after lyophilization of LNPs synthesis, the weight of the final lyophilized product obtained after the process. The productivity can be calculated using the following equation:
Morphology Evaluation
The morphology of the lipid-based nanoparticles was meticulously examined through a comprehensive imaging approach involving Transmission Electron Microscopy (TEM) (TECNAI 20, Philips, Amsterdam, Netherlands) and Scanning Electron Microscopy (SEM) (LEO 1450 VP, Carl Zeiss, Germany). For sample preparation in TEM imaging, a small aliquot of the nanoparticle suspensions was meticulously fixed onto a formvar-coated copper grid. Following this, the samples underwent a thorough drying process to ensure optimal imaging conditions. TEM imaging was performed at an accelerating voltage of 100 kV, and micrographs were captured under various magnifications to obtain detailed insights into the nanoparticle structure. For sample preparation in SEM imaging, a small quantity of the nanoparticle suspension was affixed to an SEM stub using double-sided adhesive tape. A gold coating was then applied using a sputter coater under vacuum conditions to enhance conductivity and facilitate improved imaging quality. SEM imaging was performed at an accelerating voltage of 15 kV, and the samples were observed under various working distances to capture a range of magnifications.
Optimization Condition for Lipid-Based Nanoparticles Formulation Using a Vortex Tube Reactor
In order to optimize the formulation condition of lipid-based nanoparticles using the vortex tube reactor, Design Expert 11 software was employed. This software utilizes partial least square models and 3D surface plots to identify relationship patterns based on simulation results for each sample. Table 2 outlines the optimization criteria, encompassing in ranges of X1: total flow rate ratio, X2: aqueous-to-organic volumetric ratio, and X3: the number of reactor units. The objective is to minimize Y1 (z-average), Y2 (PDI), and Y3 (zeta potential). Additionally, the goal is to maximize Y4 (%entrapment efficiency), Y5 (%loading capacity), and Y6 (productivity) in order to predict the optimal conditions that will yield both high productivity and desirable physical properties for the lipid-based nanoparticles.
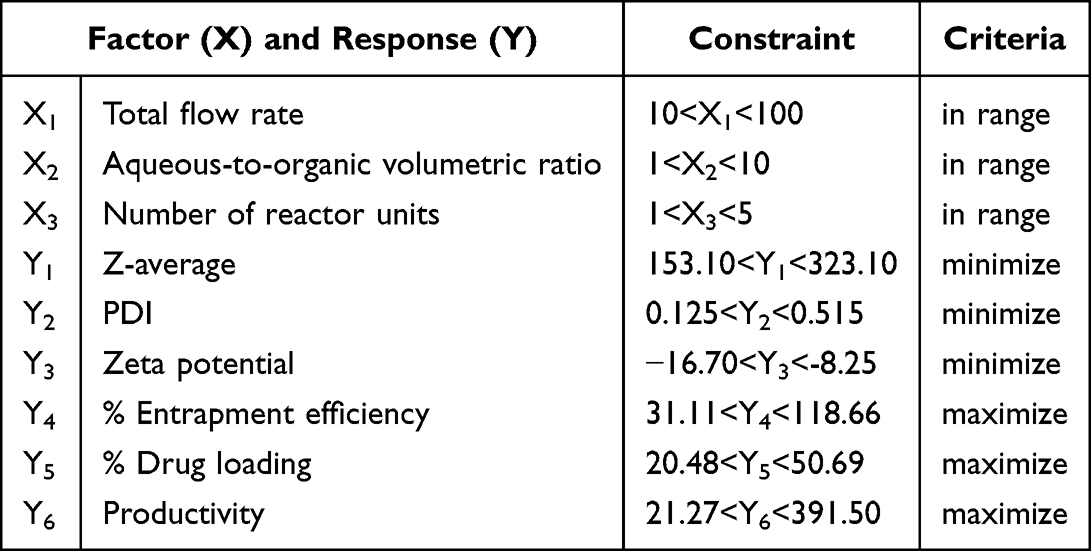 |
Table 2 Constraint and Criteria of the Optimized Condition of Lipid-Based Nanoparticle Synthesis |
Statistical Analysis
The correlations of factors were determined using Design Expert 11 (Stat-Ease, Inc., USA) for statistical analysis and graphing of the model response surface. The experimental data were reported as the mean ± 95% confidence interval of three replicates (n=3). To identify statistically significant variations (p<0.05), ANOVA and Levene’s test for homogeneity of variance were conducted using SPSS version 10.0 for Windows (SPSS Inc., USA). For post hoc testing of multiple comparisons (p < 0.05), either the Scheffé or Games-Howell test was employed, depending on the significance of Levene’s test.
Results and Discussion
Experimental Design of Lipid-Based Nanoparticles Formulation Using a Vortex Tube Reactor
Lipid-based nanoparticles (LNPs) samples were formulated using the vortex tube reactor. The primary objective behind this endeavor was to optimize these LNPs as effective carriers for the delivery of bioproducts, thereby exploring their potential applications in the field of targeted drug delivery or other relevant biomedical applications. The investigation of the relationship between flow system parameters and the formulation of LNPs, utilizing bovine serum albumin (BSA) as the biological model drug, in combination with dipalmitoylphosphatidylcholine (DPPC), and cholesterol as lipids, was conducted using a 3-factor, 3-level Box–Behnken design. The results of these experiments are summarized in Table 3.
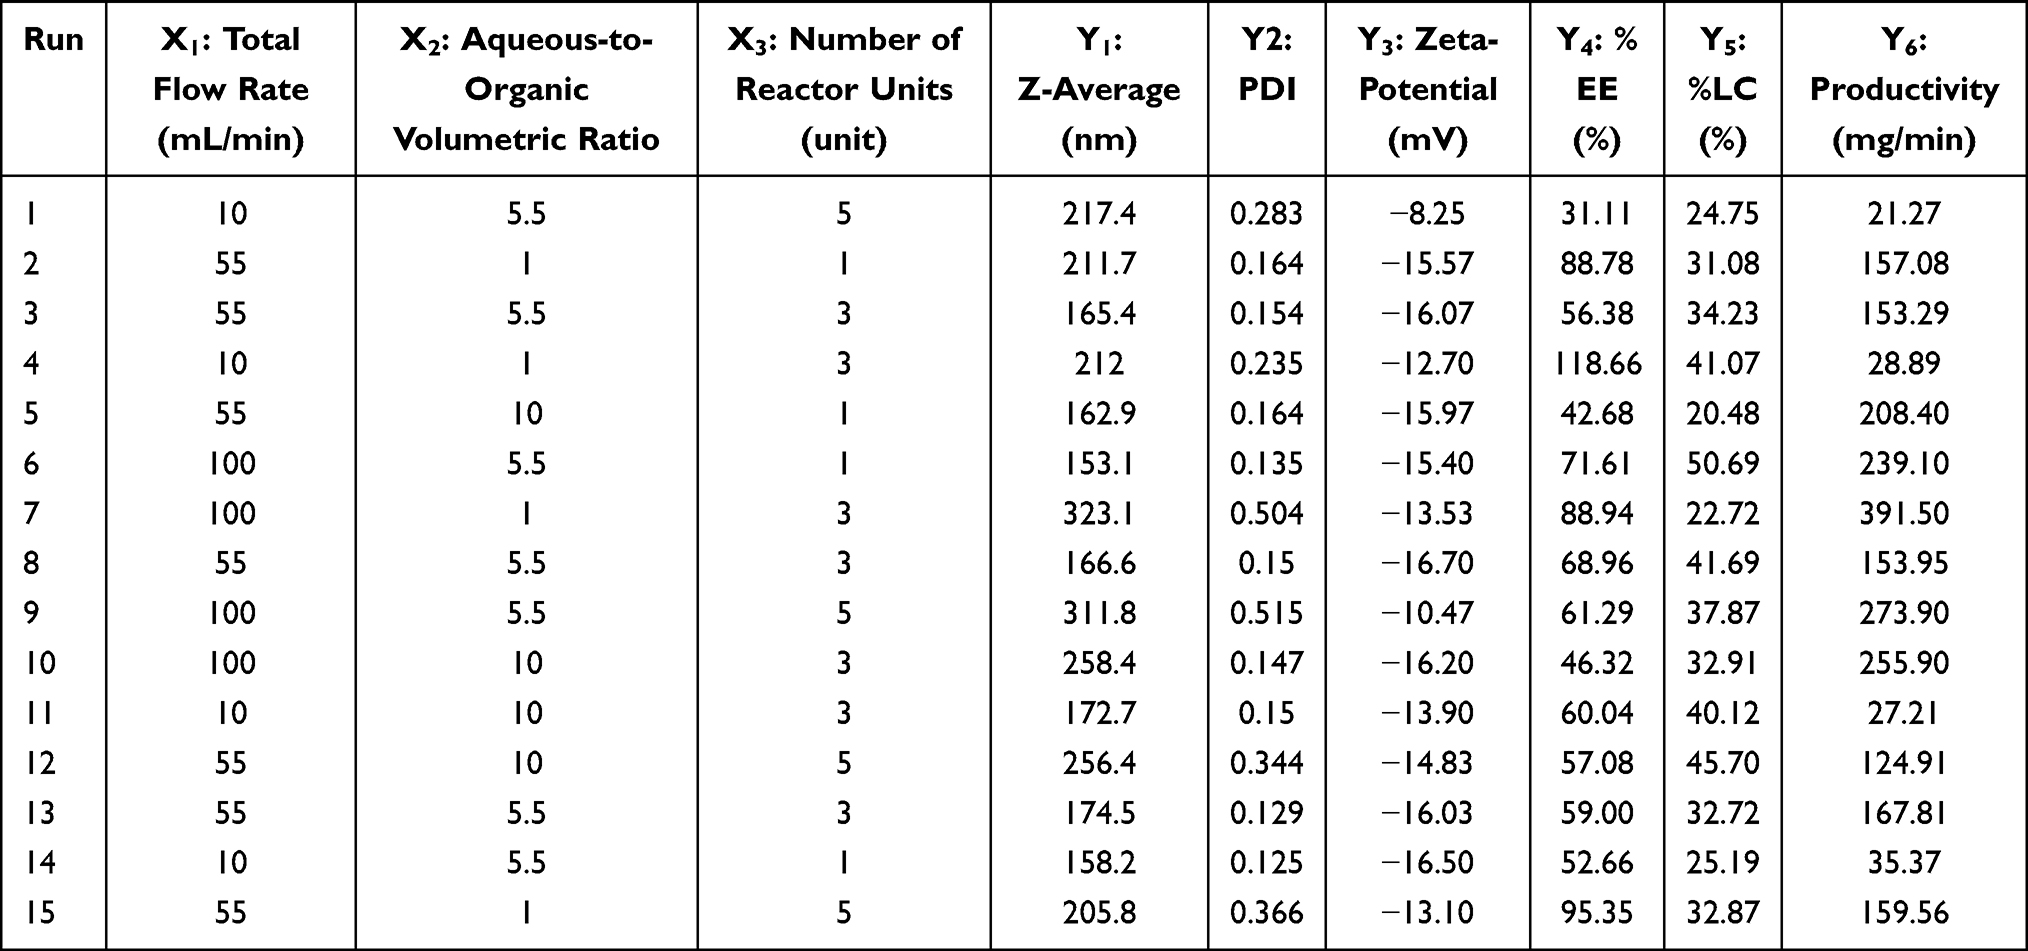 |
Table 3 Experimental Runs and Response Results in the Box-Behnken Design |
These experiments were analyzed using partial least square (PLS) regression to examine the correlations between the independent and dependent variables. Table 4 presents the findings regarding the relationships between the independent factors (X) and the responses (Y). The PLS model, which was built using coded factors for Y1: z-average, Y2: polydispersity index, Y3: zeta potential, Y4: % entrapment efficiency, and Y6: productivity, yielded significant results with p-values of 0.0069, 0.0460, 0.0424, 0.0167, and less than 0.0001, respectively. These p-values suggest that the model effectively explains the relationships between the independent variables and the dependent variables for these parameters. However, it’s important to note that the model found Y5: %loading capacity to be non-significant (p-value > 0.05) in each PLS analysis, indicating that it may not play a significant role in explaining the variation in the dependent variables.
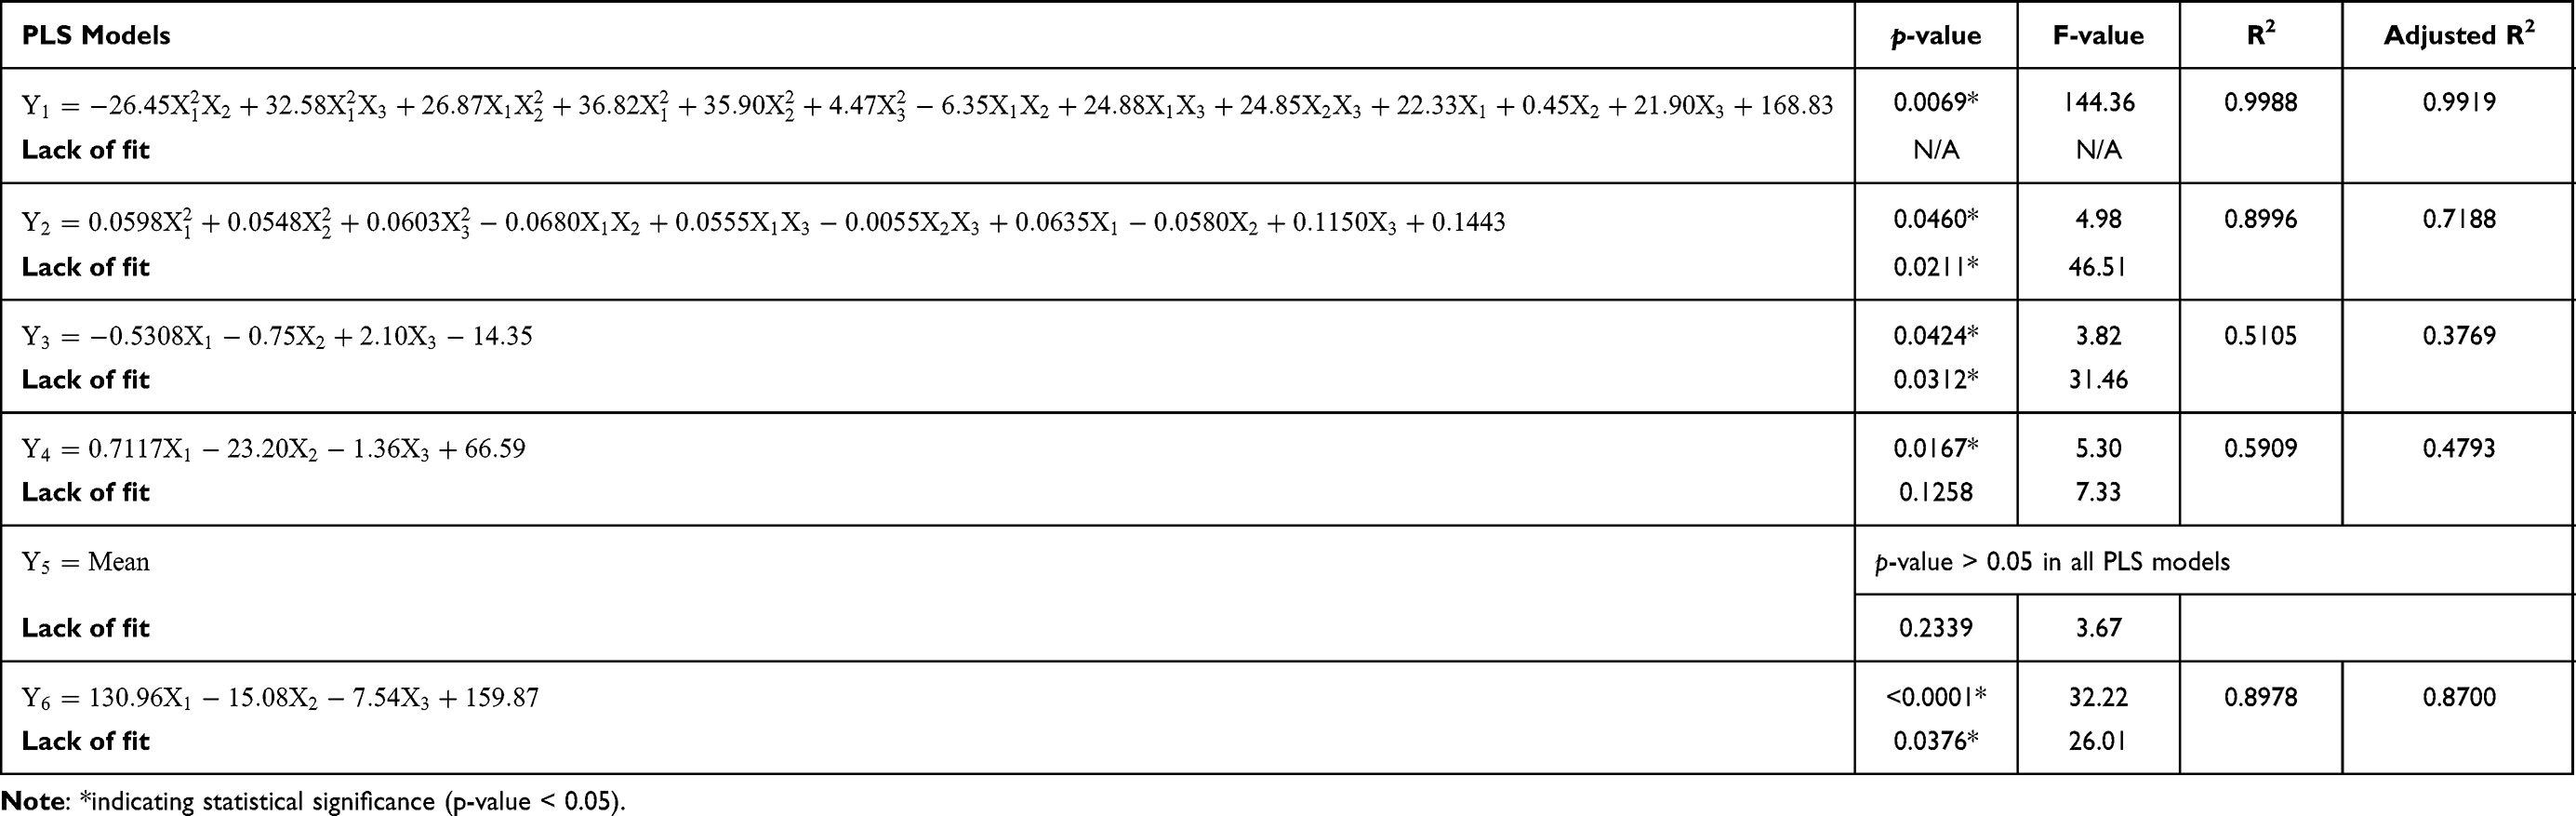 |
Table 4 Partial Least Square Regression Model in Terms of Coded Factors |
R² and adjusted R² values in the provided table assess the goodness of fit for various PLS models. Notably, the Y1 and Y6 models exhibit high R² and adjusted R-squared values, indicating a strong fit to the data. Conversely, the Y2, Y3, and Y4 models have lower R² values, suggesting a lesser degree of explained variability. The adjusted R² values account for the number of predictors, penalizing irrelevant variables.
Lack of fit refers to the inadequacy of a model to capture the true underlying relationship between the independent and dependent variables. A cubic model in terms of Y1, which represents a type of polynomial regression model of degree 3, may not explicitly report a lack of fit for several reasons. Cubic models are more flexible than linear models, as they can capture complex, nonlinear relationships. Due to their higher degree, these models can fit the data closely, which might make it seem like they are performing well even when there is a lack of fit. The p-values of lack of fit in terms of Y2, Y3, and Y6 suggest that the lack of fit is significant, indicating that the model might not be fully explaining the underlying relationships. Therefore, it may be necessary to find additional important variables or consider non-linear relationship patterns. In terms of Y4 and Y5, the p-values of lack of fit are not significant, indicating that the model fits the data well.
Z-Average (Y1)
Z-average serves as a critical parameter with significant implications for the performance of lipid-based nanoparticles (LNPs) in drug delivery applications. This study aims to assess the impact of three intriguing factors on bovine serum albumin (BSA)-loaded LNPs using a vortex tube reactor. The experimental results, summarized in Table 3, indicate substantial variations in z-average, ranging from 153.1 to 323.1 nm for LNPs under different combinations of X1, X2, and X3 The cubic model from partial least square (PLS) regression analysis, as presented in Table 4, reveals a highly significant relationship between the independent variables and Y1 (p-value = 0.0069), with an impressively high R2 (0.9988). This implies that the model effectively explains the variation in z-average, highlighting the robustness of the findings. Additionally, the response surface plots of key factors are depicted in Figure 2.
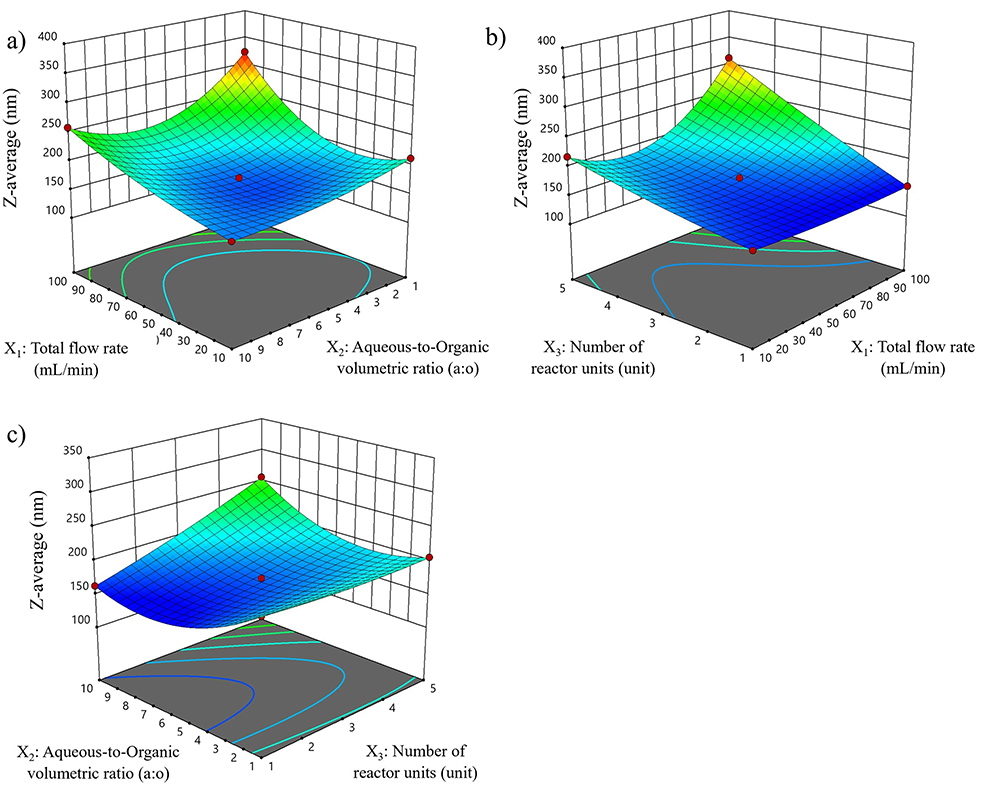 |
Figure 2 Response surface plot for z-average of lipid-based nanoparticles: (a) Total flow rate (X1) vs Aqueous-to-organic volumetric ratio (X2), (b) Total flow rate (X1) vs Number of reactor units (X3), and (c) Aqueous-to-organic volumetric ratio (X2) vs Number of reactor units (X3). These plots depict the impact of varying process parameters on the average particle size of the lipid-based nanoparticles. |
The coefficients of the PLS equation unveil the relative importance of each variable in predicting the z-average. Positive coefficients are found for  (p = 0.0113),
  (p = 0.0165),
  (p = 0.0048),
  (p = 0.0051), X1X3 (p = 0.0097), X2X3(p = 0.0098), X1(p = 0.0120), and X3 (p = 0.0125), indicating that these variables have the most significant positive influence on increasing the z-average. Conversely, a negative coefficient is found for
  (p = 0.0170), suggesting that these variables negatively impact the z-average. Other coefficients, such as
  (p = 0.2244), X1X2(p = 0.1240), and X1 (p = 0.8723), have smaller effects on the z-average. These factors may be less critical for predicting the z-average, and their influence may be overshadowed by the larger effects of other factors. In the PLS model for Y1, the factors X1 and X2 have both positive and negative coefficients in the difference term, indicating that increasing these factors can lead to a decrease in the z-average, but extreme values of these factors can increase it.
This study also examines how each factor, X1, X2, and X3, influences particle size individually while keeping the other factors constant. When solely increasing the total flow rate (X1), while holding X2 and X3 constant, intriguing insights emerge. The PLS model suggests that X1 has a quadratic effect on particle size, as indicated by the term  in the model equation. As X1 increases, particle size tends to grow non-linearly. Initially, there is a gradual increase in particle size, but beyond a certain point, the rate of particle size growth accelerates more rapidly, and may lead to increased collision frequency between the reactants, resulting in larger LNPs. Hence, meticulous control and optimization of the total flow rate are essential for achieving the desired particle size in LNPs synthesis.19
Exploring the impact of varying the aqueous-to-organic volumetric ratio (X2) while keeping X1 and X3 constant reveals a complex relationship. The PLS model indicates that X2 has both linear and quadratic effects on particle size. The term  implies that increasing X2 leads to a quadratic increase in particle size, suggesting that larger LNPs tend to form when the aqueous phase dominates the solvent ratio. LNPs are often formed through the self-assembly of lipids, and the size of the resulting particles can be influenced by the solubility of the components. A higher aqueous-to-organic volumetric ratio might change the solubility of lipids, affecting their self-assembly rate and leading to larger particle sizes. However, the presence of the negative term suggests that the interaction between X1 and X2 has a negative linear and quadratic effect on particle size. This interaction implies that while increasing X2 alone may promote larger particles, the presence of a higher X1 can partially counteract this effect. Achieving the desired particle size by adjusting X2 alone may require careful consideration of the X1 value, emphasizing the need to balance solvent ratios with other factors for precise control over particle size.20
Examining the impact of increasing the number of reactor units (X3) while keeping X1 and X2 constant provides further insights. The interaction term  in the PLS model indicates that X3 interacts with the squared total flow rate (
 ) to influence particle size. Increasing X3 alongside
  tends to have a quadratic effect on particle size, suggesting that more reactor units can lead to larger particle sizes, especially when combined with higher flow rates. Adding more reactor units provides additional residence time for particles to grow, resulting in larger LNPs. However, this effect is influenced by the flow rate (X1), so the choice of the number of reactor units should be considered in conjunction with the desired particle size and specific flow rate conditions.21
Polydispersity Index (Y2)
The polydispersity index (PDI) is a crucial metric for assessing the uniformity of particle size distribution within synthesized bovine serum albumin (BSA)-loaded lipid-based nanoparticles (LNPs). A lower PDI value indicates a more even distribution of particle sizes, while a higher PDI value suggests a broader range of particle sizes, which could potentially affect the stability and performance of LNPs. The experimental results, summarized in Table 3, reveal significant variations in the PDI, ranging from 0.135 to 0.366 for LNPs under different combinations of independent variables, denoted as X1, X2, and X3. Utilizing a quadratic model derived from partial least square (PLS) regression analysis, as presented in Table 4, demonstrates a substantial relationship between these independent variables and Y2 (p-value = 0.0460) along with an impressive R2 of 0.8996. This indicates that the model effectively explains the variation in PDI, underscoring the reliability of the findings. Moreover, the response surface plot of the key factors is illustrated in Figure 3.
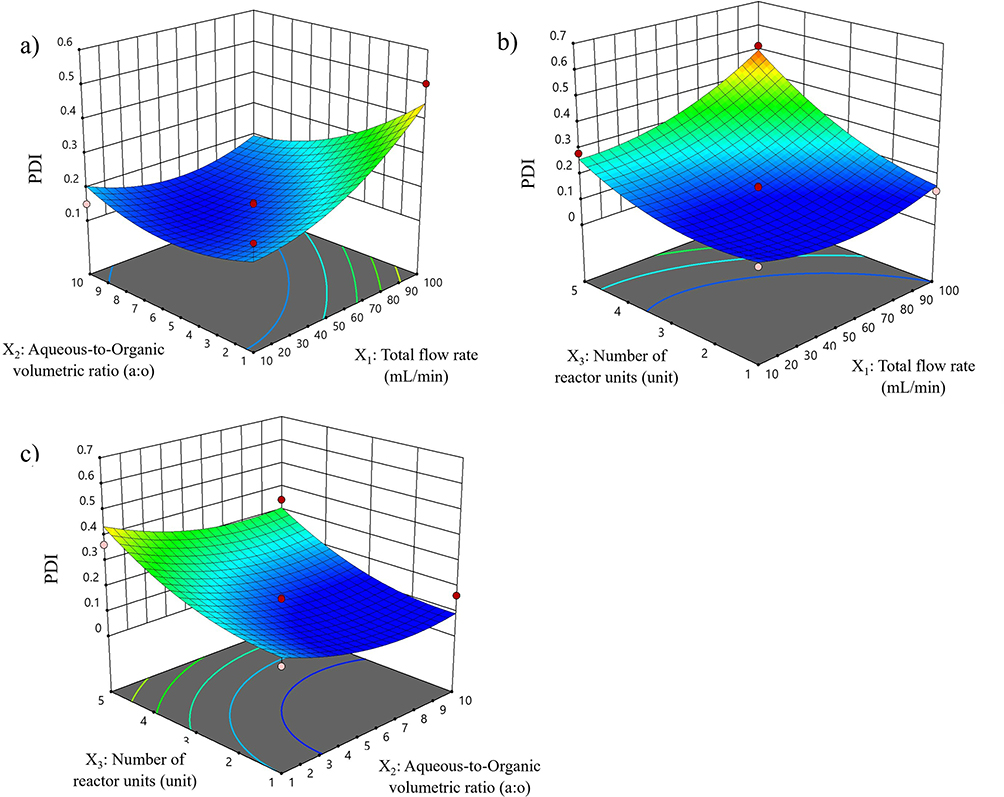 |
Figure 3 Response surface plot for polydispersity index of lipid-based nanoparticles: (a) Total flow rate (X1) vs Aqueous-to-organic volumetric ratio (X2), (b) Total flow rate (X1) vs Number of reactor units (X3), and (c) Aqueous-to-organic volumetric ratio (X2) vs Number of reactor units (X3). These plots show how changes in process parameters influence the uniformity of particle size distribution in the lipid-based nanoparticles. |
The coefficients of the PLS equation unveil the relative importance of each variable in predicting PDI. The variable X3 (p = 0.0061) stands out with the highest positive coefficient, suggesting that it has the most significant positive influence on increasing PDI. On the other hand, coefficients of non-significant variables exhibit smaller effects on PDI prediction, with po sitive terms like  (p = 0.1685),
  (p = 0.2003),
  (p = 0.1656), X1X3(p = 0.1810), X1 (p = 0.0536), as well as negative terms like X1X2 (p = 0.1153), X2X3(p = 0.8837), and X2 (p = 0.0701). These factors are likely less critical in predicting PDI, with their impact overshadowed by other variables. To further investigate the influence of the number of reactor units (X3) on PDI, experiments were conducted while maintaining X1 and X2 at constant levels. The PLS model for PDI (Y2) indicates that the linear effect of X3 significantly impacts PDI, as suggested by the coefficient of X3 in the model equation. This implies that increasing the number of reactor units (X3) has a direct, positive linear effect on PDI, resulting in a broader particle size distribution. These results underscore the importance of the number of reactor units (X3) in governing particle size uniformity within LNPs. Increasing the number of reactor units allows for additional residence time for particles to grow, potentially leading to a broader particle size distribution.21,22
Zeta Potential (Y3)
The zeta potential serves as a critical parameter for characterizing the surface charge of synthesized lipid-based nanoparticles (LNPs). The experimental results, summarized in Table 3, reveal substantial variations in the zeta potential, ranging from −16.70 to −8.25 mV for LNPs under different combinations of X1, X2, and X3. The linear model obtained from the partial least square (PLS) regression analysis, as presented in Table 4, demonstrates a highly significant relationship between the independent variables and Y3 (p-value = 0.0424), with an R2 of 0.5105. This finding effectively explains the variation in zeta potential, highlighting the robustness of the results. Additionally, Figure 4 depicts the response surface plot of the key factors.
 |
Figure 4 Response surface plot for zeta potential of lipid-based nanoparticles: (a) Total flow rate (X1) vs Aqueous-to-organic volumetric ratio (X2), (b) Total flow rate (X1) vs Number of reactor units (X3), and (c) Aqueous-to-organic volumetric ratio (X2) vs Number of reactor units (X3). These plots illustrate the effect of varying process parameters on the surface charge of the lipid-based nanoparticles. |
The coefficients in the PLS equation unveil the relative importance of each variable in predicting zeta potential. Notably, the variable X3 (p = 0.0101) stands out with the highest positive coefficient, indicating its significant positive influence on increasing zeta potential. Conversely, non-significant variables exhibit smaller effects on zeta potential prediction, with negative coefficients for X1 (p = 0.4490) and X2 (p = 0.2910). These factors are less critical in predicting zeta potential, with their impact overshadowed by other variables.
The PLS model for Y3 underscores the significant linear effect of X3 on zeta potential, as suggested by the coefficient of X3 in the model equation. This implies that an increase in X3 is expected to lead to a more positive zeta potential. In this context, a higher zeta potential indicates reduced electrostatic repulsion among particles and potentially decreased stability within the negatively charged system. It is essential to consider any surface modification or charge introduced due to prolonged residence time, which may involve dipalmitoylphosphatidylcholine (DPPC) molecules or interactions between DPPC and other components in the LNPs. Therefore, while an increase in X3 may still result in a more positive zeta potential, as discussed earlier. The specific behavior of DPPC in this context should be taken into account when analyzing the results and implications for LNPs. Consequently, the extended residence time associated with higher X3 values may promote weaker electrostatic repulsion, leading to a more positive zeta potential and potentially impacting the stability of LNPs.23,24 This underscores the significance of X₃ in controlling zeta potential and particle stability within negatively charged LNPs, emphasizing the need for careful consideration when optimizing X3 to achieve the desired electrostatic properties.
Entrapment Efficiency Percentage (Y4)
The entrapment efficiency percent (%EE) serves as a critical metric in the synthesis of lipid-based nanoparticles (LNPs) since it quantifies the proportion of encapsulated materials, such as drugs or bioactive compounds, within the LNPs. A higher %EE is desirable as it indicates the successful encapsulation of a greater quantity of the active ingredient within the LNPs. The experimental results, which are summarized in Table 3, demonstrate substantial variations in %EE, ranging from 31.11 to 118.66% for LNPs under different combinations of X1, X2, and X3. Through a partial least square (PLS) regression analysis, as presented in Table 4, a significant relationship between the independent variables and Y4 (p-value = 0.0167) has been established, with an R2 of 0.5909. This outcome effectively explains the variance in %EE and underscores the robustness of the results. Additionally, Figure 5 illustrates a response surface plot of the key factors.
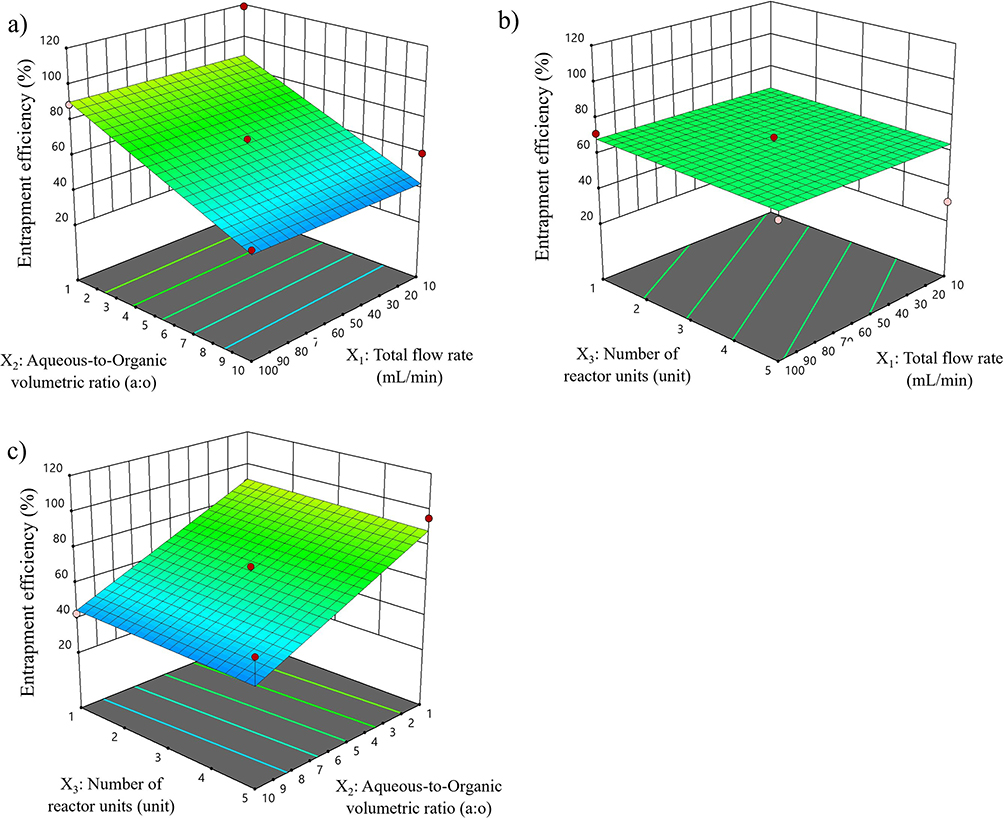 |
Figure 5 Response surface plot for entrapment efficiency of lipid-based nanoparticles: (a) Total flow rate (X1) vs Aqueous-to-organic volumetric ratio (X2), (b) Total flow rate (X1) vs Number of reactor units (X3), and (c) Aqueous-to-organic volumetric ratio (X2) vs Number of reactor units (X3). These plots show the relationship between process parameters and the percentage of encapsulated bovine serum albumin within the lipid-based nanoparticles. |
The coefficients in the PLS equation reveal the relative importance of each variable in predicting %EE. Notably, X2(p = 0.0022) stands out with the highest negative coefficient, signifying its substantial negative influence on reducing %EE. Conversely, non-significant variables exhibit smaller effects on %EE prediction, with positive coefficients for X1 (p = 0.9051) and negative coefficients for X3 (p = 0.8197). These factors play a less critical role in predicting %EE, with their impact overshadowed by other variables. The PLS model for Y4 underscores the significant linear effect of X2 on %EE, as indicated by the coefficient of X2 in the model equation. This suggests that the choice of this ratio plays a critical role in determining the encapsulation efficiency of BSA in LNPs.
The significance of X2 lies in its capacity to influence the emulsification process. Our findings suggest that maintaining a lower aqueous-to-organic volumetric ratio enhances encapsulation efficiency, aligning with the principle of emulsion stability. At lower ratios, the organic phase predominates in the mixture. This results in reduced interfacial tension between the aqueous and organic phases, which, in turn, promotes the formation of smaller and more stable organic droplets within the aqueous phase. Smaller droplets provide a larger surface area for interaction between BSA molecules and the lipid components, facilitating efficient encapsulation. Furthermore, lower values of X2 may lead to a higher concentration gradient between the aqueous and organic phases, effectively driving BSA molecules into the lipid bilayer and further enhancing encapsulation efficiency.25,26
Loading Capacity Percentage (Y5)
Investigating the crucial parameter of the percentage of loading capacity (%LC) and its relationship with various independent variables using partial least square (PLS) models, the study uncovered a surprising result that %LC did not exhibit statistical significance within these models. This lack of significance can be attributed to various factors within the experimental setup. Firstly, inherent experimental variability or noise in the data on weighting method for %LC may obscure any potential relationships with the independent variables. The dataset for %LC displayed notable variability, with a minimum value of 20.48%, a maximum value of 50.69%, and a mean value of 34.27%. Secondly, the encapsulation process in lipid-based nanoparticles (LNPs) is a multifaceted and intricate process influenced by numerous factors, and the variables considered in the PLS models may not fully capture the complexity of this system. There could be other unexplored variables that play a more substantial role in determining %LC. Additionally, the weighting method for low volume of lyophilized products in terms of %LC may have limitations, potentially diminishing the statistical power to identify significant relationships. Furthermore, the nature of the encapsulation process itself might not strongly depend on the factors under investigation. To gain deeper insights into the determinants of %LC in LNPs.
Productivity (Y6)
Productivity in a research context is a measure of the rate or efficiency at which a desired product or outcome is produced per unit of input, such as time, materials, or resources. It reflects the effectiveness of a given process or system. The experimental results presented in Table 3 reveal significant variations in productivity, ranging from 21.27 to 273.90 mg/min for lipid nanoparticles (LNPs), depending on the combinations of variables X1, X2, and X3. A comprehensive analysis, utilizing partial least square (PLS) regression as detailed in Table 4, has established a strong relationship between the independent variables and the dependent variable Y6 (p-value < 0.0001), yielding an impressive R2 of 0.8978. This outcome effectively explains the variance in productivity and underscores the robustness of the results. Moreover, Figure 6 visually represents the response surface plots of the key factors, providing a more intuitive understanding of their impact.
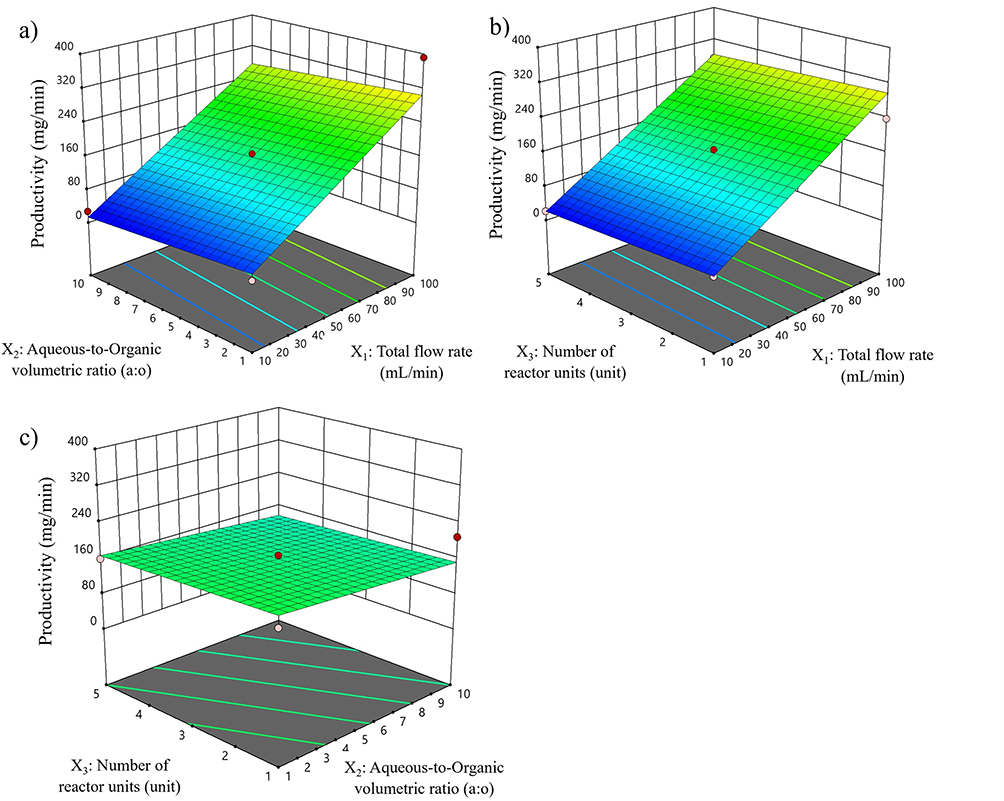 |
Figure 6 Response surface plot for productivity of lipid-based nanoparticles: (a) Total flow rate (X1) vs Aqueous-to-organic volumetric ratio (X2), (b) Total flow rate (X1) vs Number of reactor units (X3), and (c) Aqueous-to-organic volumetric ratio (X2) vs Number of reactor units (X3). These plots depict how variations in process parameters affect the production rate of lipid-based nanoparticles. |
Examining the coefficients within the PLS equation allows us to gauge the relative importance of each variable in predicting productivity. Remarkably, X1(p < 0.0001) emerges as the most influential variable with a significant positive coefficient, signifying its substantial positive effect on increasing productivity. Conversely, non-significant variables exhibit smaller effects on productivity prediction, with positive coefficients for X2 (p = 0.2855) and negative coefficients for X3 (p = 0.5858). These factors play a less critical role in predicting productivity, with their impact being overshadowed by other variables.
The PLS model has shed light on the critical role played by the total flow rate (X1) in shaping the productivity (Y6) of the LNPs synthesis process. The highest positive coefficient for X1 indicates that an increase in the total flow rate has a positive impact on productivity. One key factor contributing to this positive impact is the enhancement of mass transport and mixing within the reactor. As the flow rate increases, more reactants are introduced into the reaction zone, facilitating efficient diffusion and distribution of reactants, thus expediting reactions. Improved mixing ensures that reactants are consistently exposed to each other, minimizing concentration gradients and reducing the likelihood of localized areas with reduced reaction rates.
Optimization Condition for Lipid-Based Nanoparticles Formulation Using a Vortex Tube Reactor
After completing the experimental design, partial least square (PLS) models and response surfaces were generated and the constraints for all factors determined the desirability of all responses, as presented in Table 2. The optimization of lipid-based nanoparticles (LNPs) formulation using a vortex tube reactor followed, yielding prediction values for factors X1, X2, and X3, which were determined as 100 mL/min for the total flow rate, 5.278 for the aqueous-to-organic volumetric ratio, and 1 unit for the reactor, respectively. Subsequently, LNPs was prepared under these optimized conditions (optimized solution 1). Table 5 provides insight into the prediction accuracy, with percentages comparing predicted responses from the PLS regression models to actual test values. Remarkably, the actual values closely matched the predicted values, despite a low R2 and the presence of a significant lack of fit in some relationships. For the response variables, the prediction ability for Y1, Y2, Y3, Y4, Y5, and Y6 occurred at 93.50%, 96.48%, 94.78%, 97.05%, 96.49%, and 95.22%, respectively, resulting in the highest desirability value of 0.742. These high prediction percentages for both factors and response variables affirm the successful optimization process, indicating that the chosen conditions for LNPs formulation using a vortex tube reactor can significantly improve z-average, polydispersity index, zeta potential, percentage entrapment efficiency, percentage loading capacity, and productivity.
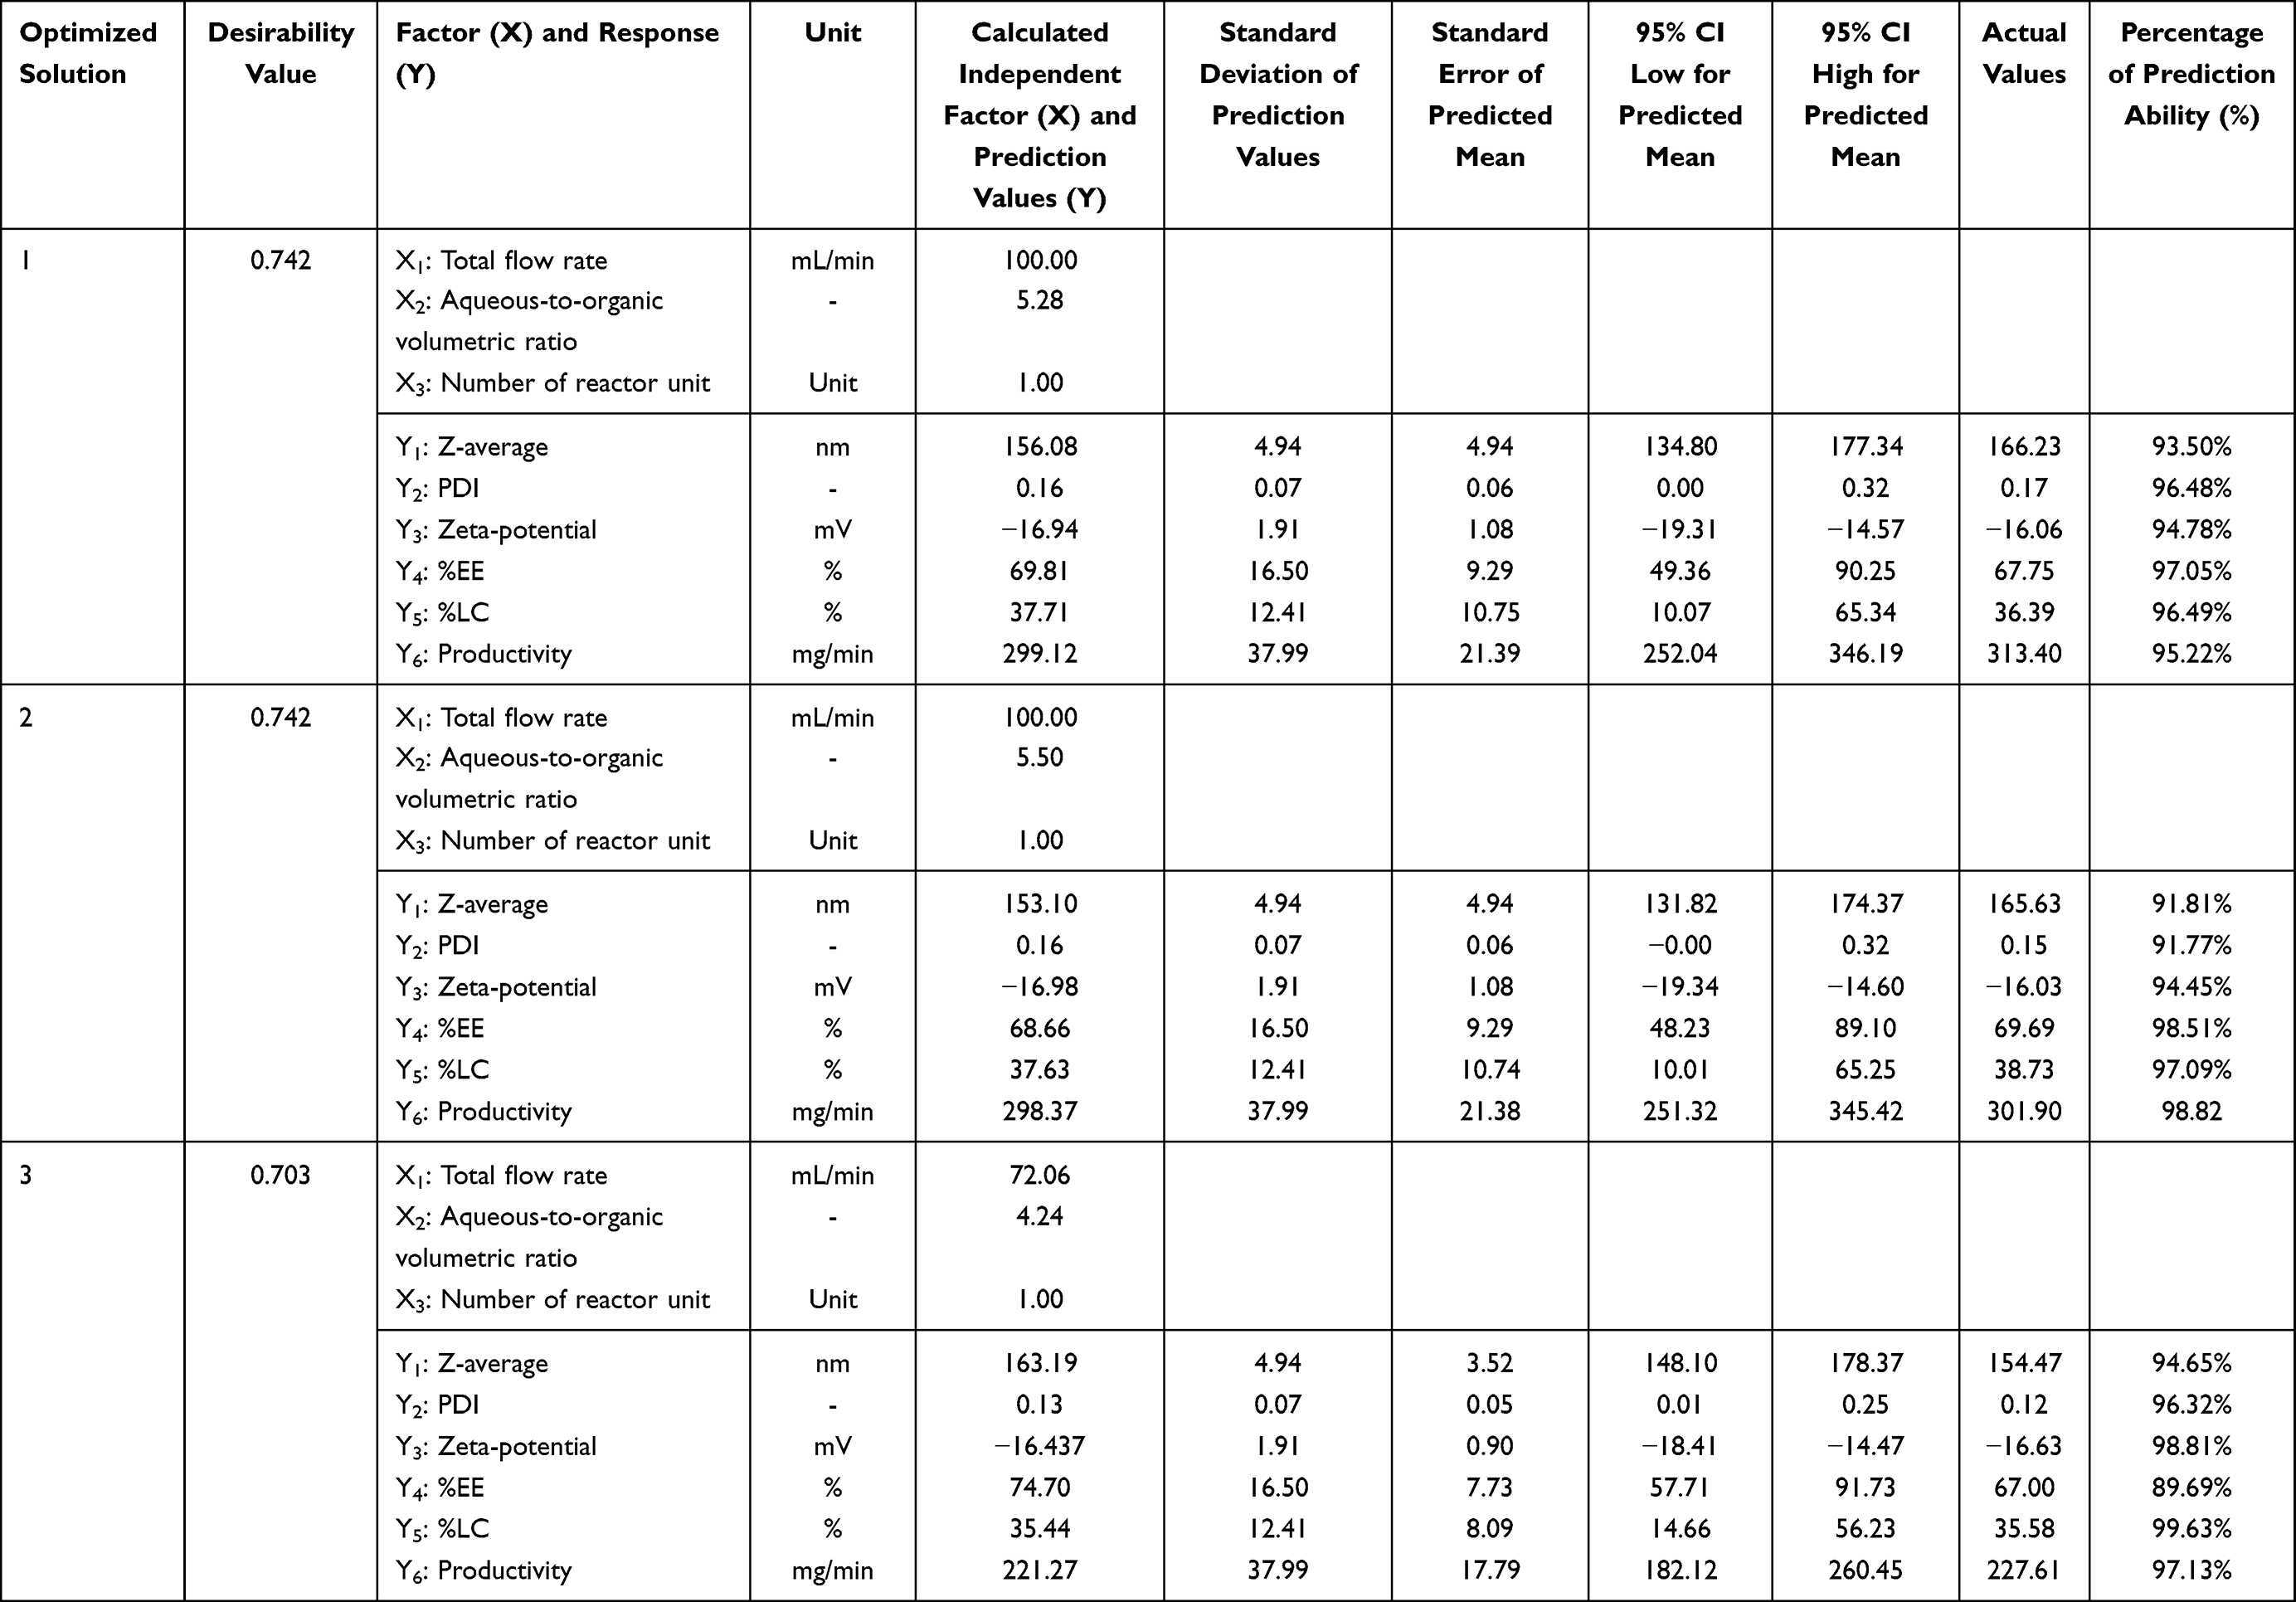 |
Table 5 Comparison Between the Predicted Values Form PLS Models and the Actual Values of Three Difference Optimized Condition for Lipid-Based Nanoparticle Using the Vortex Tube Reactor |
Figure 7 presents the morphology of LNPs that have been prepared under optimized conditions using a vortex tube reactor. Our examination of these nanoparticles through both transmission electron microscopy (TEM), as illustrated in Figure 7a and b, and scanning electron microscopy (SEM), as illustrated in Figure 7c and d, has revealed that they exhibit a spherical shape with a smooth surface texture of well-formed lipid nanoparticles. TEM images allowed us to observe the internal structure of the nanoparticles. The lipid layer of dipalmitoylphosphatidylcholine (DPPC) and cholesterol was clearly visible, surrounding the bovine serum albumin (BSA) core. This core-shell structure is consistent with the expected composition of the nanoparticles, where the hydrophobic lipid bilayer encapsulates the hydrophilic BSA cargo. The measurements of particle size obtained from TEM and SEM images were found to be 117.46 ± 23.74 nm and 152.74 ± 31.00 nm, respectively. Interestingly, these observations align with the data acquired from dynamic light scattering. However, it is worth noting that the particle sizes determined through TEM and SEM appeared to be smaller than those obtained using the dynamic light scattering method. This discrepancy may be attributed to the inherent differences in sample preparation techniques. Specifically, during the sample preparation process, the nanoparticles underwent drying and fixation procedures on a solid substrate. These steps could have introduced alterations in both the size and shape of the particles. As a result, the particle size data obtained from TEM and SEM should be interpreted in the context of the sample preparation steps, acknowledging the potential impact of these processes on the observed particle characteristics.27
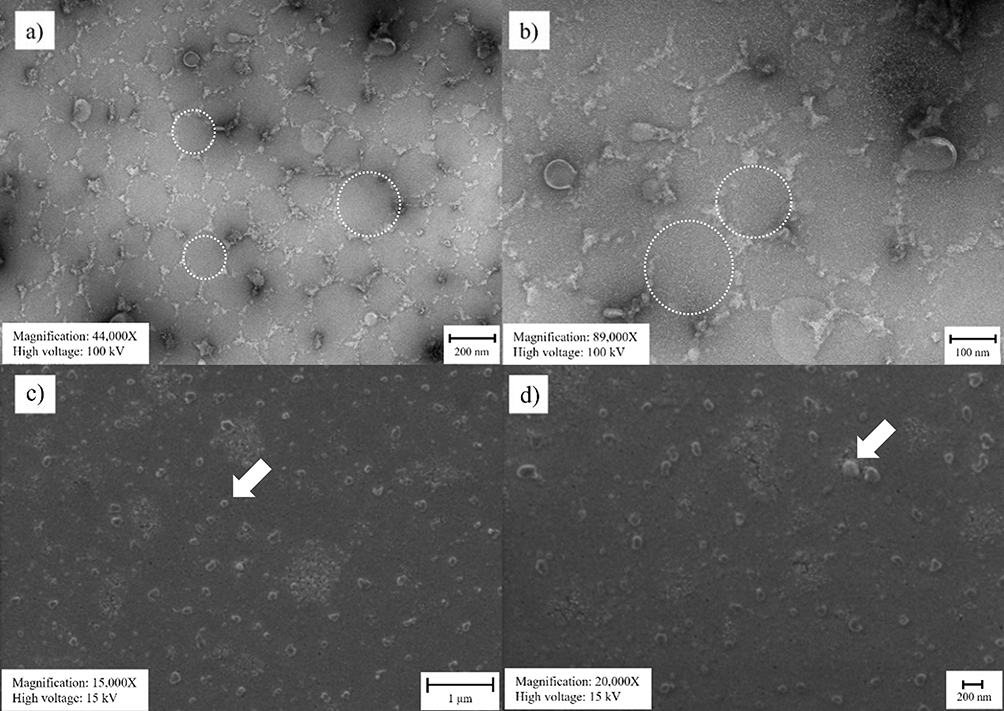 |
Figure 7 Transmission electron microscopy (TEM) and scanning electron microscopy (SEM) images of lipid-based nanoparticles synthesized using the vortex tube reactor: (a) TEM image at 44,000X magnification, (b) TEM image at 89,000X magnification, (c) SEM image at 15,000X magnification, and (d) SEM image at 20,000X magnification. The dotted circle highlights the lipid layer surrounding the bovine serum albumin core. The arrow indicates the nanoparticle surface. |
Prediction Performance
To assess the accuracy of the partial least square (PLS) equation derived from the design of experiment (DoE), the prediction performance was evaluated by comparing the predicted values with the actual values. Three optimized solution points were selected within the design space and subjected to triplicate sample evaluations. This comparison involved verifying that the percentage of prediction ability and the actual values fell within a 95% confidence interval of the predicted values, ensuring both the reliability of the PLS model and the effectiveness of the DoE approach in optimizing parameters for synthesizing the desired product.
Table 5 also provides a comparison between the predicted and actual values for various parameters in three different optimized solutions. In the results, the predicted values of all optimized solutions closely matched the actual values, demonstrating a high percentage of prediction ability. The results also indicated that the actual values fell within a 95% confidence interval of the predicted values (p-value > 0.05), as illustrated in Figure 8. These findings suggest that the PLS model developed through the DoE approach is effective in predicting the key parameters related to the synthesis of the desired product. The high percentage of prediction ability values across various parameters further demonstrates the model’s reliability. These findings underscore the value of employing a data-driven approach such as DoE in optimizing processes and ensuring product quality.
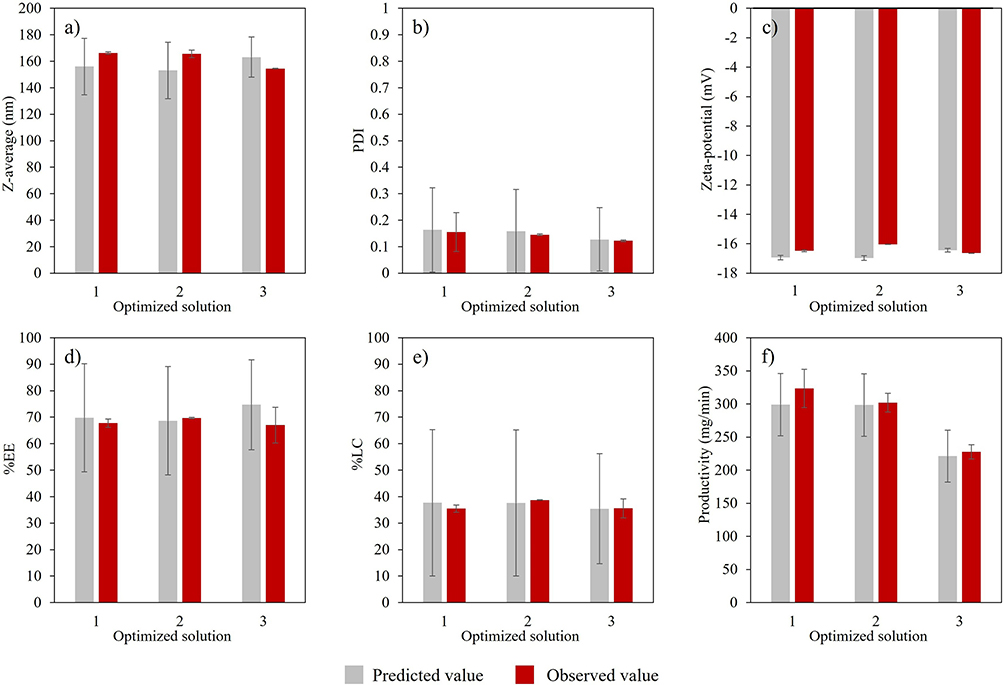 |
Figure 8 Comparison between the predicted values and the actual values of three difference optimized solutions for lipid-based nanoparticles using the vortex tube reactor based on (a) z-average, (b) polydispersity Index, (c) zeta potential, (d) entrapment efficiency, (e) loading capacity, and (f) productivity. The error bar represents a 95% confidence interval. |
Formulation Uniformity Over Formulated Time
Ensuring the uniformity of a formulation across multiple lots stands as a pivotal stage in the successful scale-up of any manufacturing process, particularly in industries as critical as pharmaceuticals and biopharmaceuticals. Control charts have emerged as indispensable tools for evaluating process performance, offering a means to measure, monitor, and control production processes effectively. Their widespread adoption within pharmaceutical and biopharmaceutical manufacturing underscores their significance.
The control chart of the moving range (MR) method played a central role in this study, where the objective was to validate the consistency of the optimized formulations. Over separate production runs, six lots of optimized lipid-based nanoparticles (LNPs) formulation (referred to as optimized solution 1) were generated. A rigorous analysis was conducted, meticulously calculating control limits (CL), encompassing the mean, upper control limit (UCL), and lower control limit (LCL). This rigorous approach ensured the process’s reliability and consistency.
The results depicted in Figure 9, which illustrates the z-average (Figure 9a), PDI (Figure 9b), zeta potential (Figure 9c), %EE (Figure 9d), %LC (Figure 9e), and productivity (Figure 9f) across various lots of LNPs, offer compelling evidence. Both the X-chart and MR-chart demonstrate a remarkable absence of variability across the sampled lots. Each measurement consistently falls within the confines delineated by the upper and lower control limits. Notably, no data points stray beyond the boundaries of system stability. These control charts provide strong indications that the parameters governing the operation of the vortex tube reactor remain steadfast for LNPs formulation.28,29
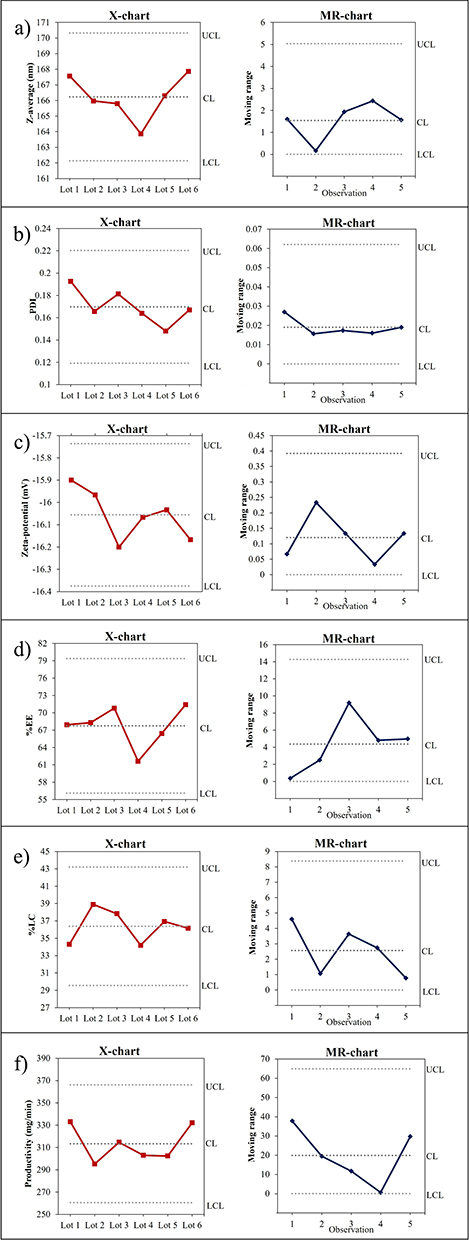 |
Figure 9 Control charts (X-chart and MR-chart) for six lots of lipid-based nanoparticles formulation: (a) z-average, (b) polydispersity Index, (c) zeta potential, (d) entrapment efficiency, (e) loading capacity, and (f) productivity. These charts demonstrate the consistency and reproducibility of the LNPs formulation process. |
Upon scrutinizing these experimental outcomes, the affirmation of the formulation process’s consistency becomes unequivocal. Further, the reproducibility of the optimized formulations stands clearly demonstrated. The insights gained from this study will serve as a cornerstone for future optimization efforts. They will be instrumental in maintaining consistent product quality throughout large-scale production, ensuring that the formulations continue to meet stringent standards of excellence in pharmaceutical and biopharmaceutical manufacturing.
Comparison of Lipid-Based Nanoparticles Formulation Between Vortex Tube Reactor and Batch Synthesis
To compare lipid-based nanoparticles (LNPs) formulation synthesized through a vortex tube reactor with the optimized condition (optimized solution 1) and a batch synthesis approach employing the conventional emulsification-solvent evaporation method. Both methods utilized the same aqueous phase-to-organic phase ratio and produced the same final product volume. In the batch synthesis, samples were collected at intervals ranging from 5 to 30 minutes for particle dispersion analysis using a zeta sizer until the desired product quality was achieved. Interestingly, after 15 minutes of synthesis, there was no observable change in particle dispersion. Therefore, it was assumed that the process had reached its optimal state at this point, and calculations of productivity were based on this 15-minute time frame.
The comparison between the two synthesis methods, as illustrated in Figure 10, reveals that the vortex tube reactor yielded LNPs with a lower z-average size (p-value = 0.0156, Figure 10a) and a lower polydispersity index (PDI) (p-value < 0.01, Figure 10b). Additionally, it exhibited higher percentages of entrapment efficiency (p-value < 0.01, Figure 10d), loading capacity (p-value < 0.01, Figure 10e), and productivity (p-value < 0.01, Figure 10f). However, there was no significant difference in zeta potential (p-value = 0.4953, Figure 10c) between the two methods. To provide more specific data, the vortex tube reactor resulted in LNPs with a z-average size of 166.23 ± 0.98 nm and a PDI value of 0.17 ± 0.01, whereas the batch synthesis method produced larger particles with a size of 192.67 ± 9.40 nm and a PDI value of 0.25 ± 0.01. The zeta potential measurements showed no significant difference, with values of −16.06 ± 0.27 mV for the vortex tube reactor and −16.07 ± 1.64 mV for the batch synthesis. Regarding % entrapment efficiency, % loading capacity, and productivity, the vortex tube reactor outperformed the batch synthesis method. Specifically, the vortex tube reactor achieved % entrapment efficiency, % loading capacity, and productivity values of 67.75 ± 1.55%, 36.39 ± 0.83%, and 313.4 ± 12.88 mg/min, respectively. In contrast, the batch synthesis method exhibited lower values for % entrapment efficiency (49.09 ± 0.65%), % loading capacity (28.99 ± 0.38%), and productivity (1.05 ± 0.13 mg/min).
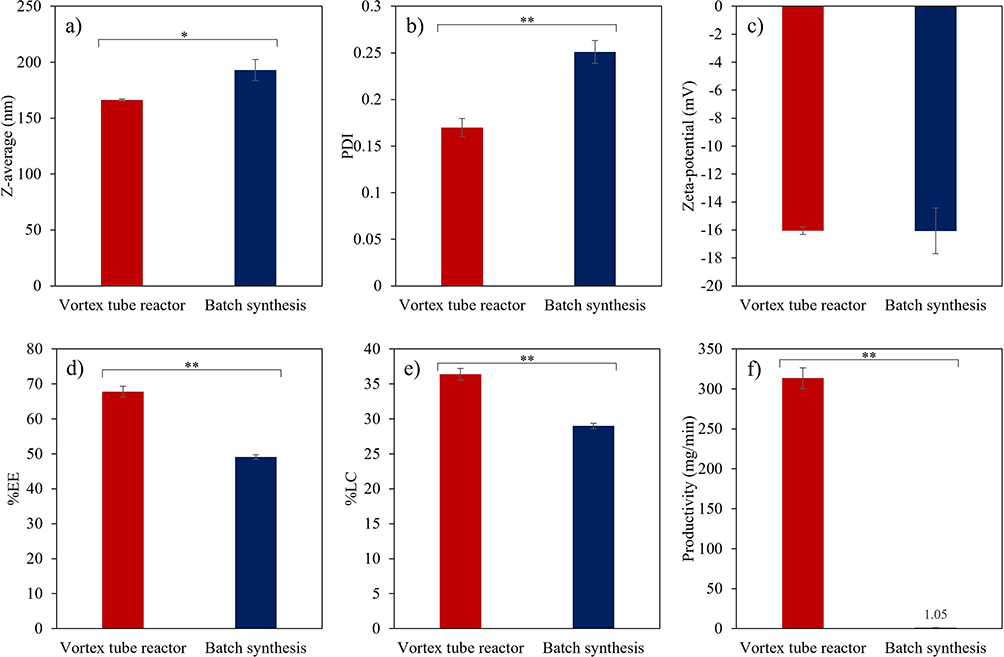 |
Figure 10 Comparison of lipid-based nanoparticles formulation: Vortex tube reactor vs batch synthesis; (a) z-average, (b) polydispersity Index, (c) zeta potential, (d) entrapment efficiency, (e) loading capacity, and (f) productivity. The error bar represents a 95% confidence interval. Notes: (*p-value < 0.05, and **p-value < 0.01). |
The vortex tube reactor demonstrates clear advantages over the batch synthesis method in terms of smaller particle size, more uniform nanoparticles, higher entrapment and loading capacity suggesting productivity compared to the batch synthesis method. Consequently, the enhanced productivity of the vortex tube reactor in generating LNPs with favorable properties reinforces its potential as an efficient and reliable method for LNPs synthesis.
Conclusion
The optimization of the vortex tube reactor conditions for lipid-based nanoparticles (LNPs) synthesis demonstrates a significant advancement in nanoparticle production efficiency and quality. By fine-tuning parameters such as flow rate ratio, aqueous-to-organic volumetric ratio, and reactor units, this study achieved superior LNPs properties compared to conventional batch synthesis methods. The predictive models derived from the design of experiments methodology offer valuable insights into the intricate relationship between reactor operating conditions and LNPs characteristics. The utilization of the vortex tube reactor facilitated the production of LNPs with smaller particle sizes, enhanced uniformity, and improved drug encapsulation efficiency. Remarkably, the productivity of LNPs synthesis was substantially increased with the implementation of flow chemistry, highlighting the scalability and efficiency of this approach. Also, continual monitoring of nanoparticle properties, encapsulation efficiency, drug-loading capacity, and productivity is crucial, suggesting that the vortex tube reactor’s superior mixing capabilities and reduced material retention time contribute significantly to the observed improvements. The study’s emphasis on the increased productivity of LNPs synthesis through flow chemistry underlines the potential scalability and industrial applicability of this approach. These findings also underscore the potential of advanced flow chemistry reactor designs in revolutionizing nanoparticle synthesis for drug delivery applications. To further validate the efficacy of this novel reactor design, future studies could enhance efficiency by altering pump types and examining the durability of the vortex tube reactor under high flow rates and pressure. The use of materials like stainless steel grades 314 or 316, common in the pharmaceutical industry, could bridge theoretical advancements with practical applications. Consideration of biological molecular conformation under high flow rates is crucial. Integrating in-line analysis could provide detailed insights into reactor performance under varying conditions. Controlled conditions can offer a more precise understanding of how changing conditions affect LNPs synthesis. The long-term stability and in vivo performance of these LNPs need to be thoroughly investigated to fully understand their potential in drug delivery applications. Moreover, future research should explore its application with a variety of drugs and alternative nanoparticle formulations, such as polymeric nanoparticles, and inorganic nanoparticles. Such investigations will contribute to advancing drug delivery systems and enhancing therapeutic efficacy in diverse biomedical applications.
Acknowledgments
We express our gratitude to the Faculty of Pharmaceutical Sciences at Burapha University for providing laboratory equipment and financial support, as well as to B and Brothers Co., Ltd. for their material support. Special thanks go to Mr. Supree Vichyavichien for his assistance with 3-D printing work.
Disclosure
The authors report no conflicts of interest in this work.
References
1. Weissig V, Pettinger TK, Murdock N. Nanopharmaceuticals (part 1): products on the market. Int J Nanomed. 2014;4357–4373. doi:10.2147/IJN.S46900
2. Schoenmaker L, Witzigmann D, Kulkarni JA, et al. mRNA-lipid nanoparticle COVID-19 vaccines: structure and stability. Int J Pharm. 2021;601:120586. doi:10.1016/j.ijpharm.2021.120586
3. Mitchell MJ, Billingsley MM, Haley RM, Wechsler ME, Peppas NA, Langer R. Engineering precision nanoparticles for drug delivery. Nat Rev Drug Discov. 2021;20(2):101–124. doi:10.1038/s41573-020-0090-8
4. Paliwal R, Paliwal SR, Kenwat R, Kurmi BD, Sahu MK. Solid lipid nanoparticles: a review on recent perspectives and patents. Expert Opin Ther Patents. 2020;30(3):179–194. doi:10.1080/13543776.2020.1720649
5. Fang RH, Aryal S, Hu C-MJ, Zhang L. Quick synthesis of lipid− polymer hybrid nanoparticles with low polydispersity using a single-step sonication method. Langmuir. 2010;26(22):16958–16962. doi:10.1021/la103576a
6. Roces CB, Lou G, Jain N, et al. Manufacturing considerations for the development of lipid nanoparticles using microfluidics. Pharmaceutics. 2020;12(11):1095. doi:10.3390/pharmaceutics12111095
7. de Jesus MB, Radaic A, Zuhorn IS, de Paula E. Microemulsion extrusion technique: a new method to produce lipid nanoparticles. J Nanopart Res. 2013;15(10):1–15. doi:10.1007/s11051-013-1960-3
8. Grossel SS. Guidelines for Process Safety in Batch Reaction Systems,(1999)-By Center for Chemical Process Safety, Center for Chemical Process Safety of the American Institute of Chemical Engineers, New York, NY, 171 pages, $139.00. J Loss Prev Process Ind. 2001;4(14):330. doi:10.1016/S0950-4230(00)00038-3
9. Maeki M, Kimura N, Sato Y, Harashima H, Tokeshi M. Advances in microfluidics for lipid nanoparticles and extracellular vesicles and applications in drug delivery systems. Adv Drug Delivery Rev. 2018;128:84–100. doi:10.1016/j.addr.2018.03.008
10. Huanbutta K, Suwanpitak K, Weeranoppanant N, et al. Continuous flow synthesis: a promising platform for the future of nanoparticle-based drug delivery. J Drug Delivery Sci Technol. 2023;105265.
11. Missen RW, Missen RW, Mims CA, Saville BA. Introduction to Chemical Reaction Engineering and Kinetics. John Wiley & Sons Incorporated; 1999.
12. Suwanpitak K, Sriamornsak P, Singh I, Sangnim T, Huanbutta K. Three-Dimensional-Printed Vortex Tube Reactor for continuous flow synthesis of Polyglycolic Acid Nanoparticles with High Productivity. Nanomaterials. 2023;13(19):2679. doi:10.3390/nano13192679
13. Huanbutta K, Sriamornsak P, Suwanpitak K, et al. Key Fabrications of Chitosan Nanoparticles for Effective Drug Delivery Using Flow Chemistry Reactors. Int J Nanomed. 2023;Volume 18:7889–7900. doi:10.2147/IJN.S433756
14. Maeki M, Uno S, Niwa A, Okada Y, Tokeshi M. Microfluidic technologies and devices for lipid nanoparticle-based RNA delivery. J Control Release. 2022;344:80–96. doi:10.1016/j.jconrel.2022.02.017
15. Yadav P, Yadav AB. Preparation and characterization of BSA as a model protein loaded chitosan nanoparticles for the development of protein-/peptide-based drug delivery system. Future J Pharm Sci. 2021;7(1):1–9. doi:10.1186/s43094-021-00345-w
16. Politis SN, Colombo P, Colombo G, Rekkas DM. Design of experiments (DoE) in pharmaceutical development. Drug Dev Ind Pharm. 2017;43(6):889–901. doi:10.1080/03639045.2017.1291672
17. Goswami R, O’Hagan DT, Adamo R, Baudner BC. Conjugation of mannans to enhance the potency of liposome nanoparticles for the delivery of RNA vaccines. Pharmaceutics. 2021;13(2):240. doi:10.3390/pharmaceutics13020240
18. Becker JM, Caldwell GA, Zachgo EA. Biotechnology: A Laboratory Course. Academic Press; 1996.
19. Zhang H-X, Wang J-X, Shao L, Chen J-F. Microfluidic fabrication of monodispersed pharmaceutical colloidal spheres of atorvastatin calcium with tunable sizes. Ind Eng Chem Res. 2010;49(9):4156–4161. doi:10.1021/ie901365w
20. Tucci ST, Seo JW, Kakwere H, et al. A scalable method for squalenoylation and assembly of multifunctional 64Cu-labeled squalenoylated gemcitabine nanoparticles. Nanotheranostics. 2018;2(4):387. doi:10.7150/ntno.26969
21. Bal V, Bandyopadhyaya R. Mechanistic aspects in the formation of nano-and submicron particles in a batch and a continuous microfluidic reactor: experiment, modeling and simulation. Chem Eng J. 2019;371:43–54. doi:10.1016/j.cej.2019.03.194
22. Yanar F, Mosayyebi A, Nastruzzi C, Carugo D, Zhang X. Continuous-flow production of liposomes with a millireactor under varying fluidic conditions. Pharmaceutics. 2020;12(11):1001. doi:10.3390/pharmaceutics12111001
23. Makino K, Yamada T, Kimura M, Oka T, Ohshima H, Kondo T. Temperature-and ionic strength-induced conformational changes in the lipid head group region of liposomes as suggested by zeta potential data. Biophys Chem. 1991;41(2):175–183. doi:10.1016/0301-4622(91)80017-L
24. Wiącek AE. Influence of dipalmitoylphosphatidylcholine (or dioleoylphosphatidylcholine) and phospholipase A2 enzyme on the properties of emulsions. J Colloid Interface Sci. 2012;373(1):75–83. doi:10.1016/j.jcis.2011.09.037
25. Desai D, Guerrero YA, Balachandran V, et al. Towards a microfluidics platform for the continuous manufacture of organic and inorganic nanoparticles. Nanomed Nanotechnol Biol Med. 2021;35:102402. doi:10.1016/j.nano.2021.102402
26. Fan H, Striolo A. Nanoparticle effects on the water-oil interfacial tension. Phys Rev E. 2012;86(5):051610. doi:10.1103/PhysRevE.86.051610
27. Hernández-Giottonini KY, Rodríguez-Córdova RJ, Gutiérrez-Valenzuela CA, et al. PLGA nanoparticle preparations by emulsification and nanoprecipitation techniques: effects of formulation parameters. RSC Adv. 2020;10(8):4218–4231. doi:10.1039/C9RA10857B
28. Albisa A, Piacentini E, Sebastian V, Arruebo M, Santamaria J, Giorno L. Preparation of drug-loaded PLGA-PEG nanoparticles by membrane-assisted nanoprecipitation. Pharm Res. 2017;34(6):1296–1308. doi:10.1007/s11095-017-2146-y
29. Długosz O, Banach M. Continuous production of silver nanoparticles and process control. J Cluster Science. 2019;30(3):541–552. doi:10.1007/s10876-019-01505-y
 © 2024 The Author(s). This work is published and licensed by Dove Medical Press Limited. The
full terms of this license are available at https://www.dovepress.com/terms.php
and incorporate the Creative Commons Attribution
- Non Commercial (unported, 3.0) License.
By accessing the work you hereby accept the Terms. Non-commercial uses of the work are permitted
without any further permission from Dove Medical Press Limited, provided the work is properly
attributed. For permission for commercial use of this work, please see paragraphs 4.2 and 5 of our Terms.
© 2024 The Author(s). This work is published and licensed by Dove Medical Press Limited. The
full terms of this license are available at https://www.dovepress.com/terms.php
and incorporate the Creative Commons Attribution
- Non Commercial (unported, 3.0) License.
By accessing the work you hereby accept the Terms. Non-commercial uses of the work are permitted
without any further permission from Dove Medical Press Limited, provided the work is properly
attributed. For permission for commercial use of this work, please see paragraphs 4.2 and 5 of our Terms.