")
Back to Journals » International Journal of Nanomedicine » Volume 20
Optimized Nanostructured Lipid Carriers for Metformin: Enhanced Anti-Inflammatory Activity and Protection Against Type 2 Diabetes-Induced Organ Damage
Authors Qushawy M , Alanazi MA , Hikal WM, Amirthalingam P , Abu-Gharbieh E, Almanzalawi WS, Mortagi Y, Elsherbiny N, Elsherbini AM
Received 14 November 2024
Accepted for publication 6 March 2025
Published 24 March 2025 Volume 2025:20 Pages 3765—3788
DOI https://doi.org/10.2147/IJN.S506631
Checked for plagiarism Yes
Review by Single anonymous peer review
Peer reviewer comments 4
Editor who approved publication: Dr Sachin Mali
Mona Qushawy,1,2 Mansuor A Alanazi,3 Wafaa M Hikal,4,5 Palanisamy Amirthalingam,6 Eman Abu-Gharbieh,7– 9 Wejdan Saleh Almanzalawi,10 Yasmin Mortagi,2 Nehal Elsherbiny,11 Amira M Elsherbini12
1Department of Pharmaceutics, Faculty of Pharmacy, University of Tabuk, Tabuk, 71491, Saudi Arabia; 2Department of Pharmaceutics, Faculty of Pharmacy, Sinai University, Alarish, North Sinai, 45511, Egypt; 3Department of Family and Community Medicine, Faculty of Medicine, University of Tabuk, Tabuk, 71491, Saudi Arabia; 4Department of Biology, Faculty of Science, University of Tabuk, Tabuk, 71491, Saudi Arabia; 5Parasitology Laboratory, Water Pollution Research Department, Environment and Climate Change Institute, National Research Centre (NRC), Giza, 12622, Egypt; 6Department of Pharmacy Practice, Faculty of Pharmacy, University of Tabuk, Tabuk, 71491, Saudi Arabia; 7Research Institute of Medical and Health Sciences, University of Sharjah, Sharjah, 27272, United Arab Emirates; 8Department of Clinical Sciences, College of Medicine, University of Sharjah, Sharjah, 27272, United Arab Emirates; 9School of Pharmacy, The University of Jordan, Amman, 11942, Jordan; 10PharmD Program, Faculty of Pharmacy, University of Tabuk, Tabuk, 71491, Saudi Arabia; 11Department of Pharmaceutical Chemistry, Faculty of Pharmacy, University of Tabuk, Tabuk, 71491, Saudi Arabia; 12Department of Oral Biology, Faculty of Dentistry, Mansoura University, Mansoura, 35516, Egypt
Correspondence: Mona Qushawy, Email [email protected]
Background: Diabetes is a chronic metabolic disease that causes serious consequences in different organs such as the heart, kidneys, pancreas, and liver. Metformin (MTF) is a common treatment for type 2 diabetes. It controls the blood glucose level by improving insulin sensitivity and glucose absorption. MTF belongs to BCS class III, which is characterized by high solubility and low permeability. Several types of nanoparticles have been developed to overcome the permeability problem of MTF.
Methods: In this study, we prepared nanostructured lipid carriers (NLCs) loaded with metformin (MTF) using hot melt homogenization-ultrasonication. To select the best formulation, the prepared MTF-NLCs were evaluated for entrapment efficiency % (EE%), particle size, zeta potential, polydispersity index (PDI), and in vitro drug release. The optimized formulation was selected based on the high EE%, small particle size, high absolute zeta potential, low polydispersity index, and high in vitro drug release. The optimized formulation was evaluated for surface morphology by transmission electron microscope (TEM) and for further biochemical and histological analyses in a high-fat diet-induced type 2 diabetes mellitus (T2DM) in vivo rat model; HFD was administered (44.3-kJ/kg total energy) for four weeks, followed by a single intraperitoneal injection of streptozotocin (STZ). Rats were allocated into four groups; Diabetic (DM), DM+MTF, DM+MTF-NLC, and control group. Serum and tissue samples were processed for inflammatory markers detection and histopathology.
Results: The prepared MTF-NLC formulation exhibited high EE% (80.65 ± 1.95% to 99.31 ± 3.25%), small particle size (247.72± 5.74nm-503.23± 7.26nm), high negative zeta potential (from − 31.83± 0.98mV to − 51.6± 2.64mV), PDI value less than 0.5 for all MTF-NLCs, and controlled drug release. MTF-NLC7 appeared spherical when examined by TEM. MTF and MTF-NLC groups significantly alleviated the degenerative effects of DM in both submandibular glands (SMG) and pancreas. Additionally, treatments improved kidney and liver function reduced serum inflammatory cytokines, and tissue SMG and pancreatic immunostaining of inflammatory cytokines with favorable effects of MTF-NLCs. Moreover, the MTF-NLCs showed a significant reduction of serum inflammatory cytokines, including (TNF-α and IL-1β) and pancreatic TNF-α expression, in addition to ameliorating liver and renal functions compared to MTF alone.
Conclusion: The preparation of MTF as NLCs improved its permeability, enhancing its anti-inflammatory activity and providing more protection against diabetes-induced organ injury.
Keywords: metformin, MTF, nanostructured lipid carriers, NLCs, submandibular glands, SMG, diabetes mellitus, DM, lipid nanoparticles, inflammation
Graphical Abstract:

Introduction
According to the International Diabetes Federation atlas (2021), the global prevalence of diabetes mellitus (DM) is anticipated to be 783 million by 2045 (1 in 8 adults) with half of them unaware of the condition. In the Middle East and North Africa, DM incidence was 73 million in 2021, with the expectation to rise to 136 million by 2045, with an 87% projected increase.1 DM is expected to be the seventh leading cause of death worldwide by 2030.2 Indeed, DM has been reported as one of the four major non-communicable diseases, along with cardiovascular diseases, cancer, and chronic respiratory disease. Among various types of DM, type 2 (T2DM) is the most common, accounting for around 90% of diabetic cases.3 The development of insulin resistance represents a major hallmark of T2DM pathogenesis, which is mainly caused by irregularities in hepatic glucose metabolism.4 Furthermore, oxidative stress and inflammation play a crucial role in the pathogenesis of T2DM and represent a risk factor for insulin resistance.5 Moreover, obesity and increased free fatty acids trigger β-cell failure.6
Metformin (MTF) is an oral hypoglycemic dimethyl biguanide that was approved by the FDA in 1994 for T2DM and is currently recommended as a first-line treatment. MTF does not normally enhance insulin secretion; therefore, it is associated with a reduced risk of hypoglycemia.7 Additionally, it does not cause weight gain. It acts by enhancing the body’s sensitivity to insulin, thus reducing hepatic glucose production. Additionally, it combats diabetes-associated oxidative stress and inflammation.8 Moreover, metformin has proven effects in the prevention and adjuvant treatment of tumors.9 Of note, MTF has been reported to alleviate T2DM-accompanied alteration in salivary microbiota partially10 and ameliorate the diabetic effect on orthodontic tooth movement.11,12 Despite metformin’s effectiveness, its limited permeability, bioavailability, and gastrointestinal side effects necessitate alternative delivery methods.9,13
Therefore, formulating MTF into a nano-drug delivery system would modify its physicochemical properties and endogenous delivery characteristics, thereby enhancing its absorption and therapeutic efficacy and improving patient compliance.14 One of the methods that can improve the permeability of the drugs and, as a result, their bioavailability is the use of nanostructured lipid carriers (NLCs) as a drug delivery system.15 NLCs are lipid nanoparticles prepared from both solid and liquid lipids and developed from oil-in-water emulsion.16 The inclusion of liquid lipids is advantageous because it reduces the ordered structure of solid lipids, which ultimately results in an increase in the loading capacity of nanoparticles as well as the entrapment efficiency of drugs within NLCs.17,18 NLCs offer a promising approach for enhancing the therapeutic efficacy of MTF by overcoming its pharmacokinetic limitations such as poor intestinal absorption and rapid renal excretion. NLCs, composed of solid and liquid lipids, improve drug encapsulation, stability, and controlled release, thereby enhancing bioavailability and prolonging systemic circulation. Additionally, NLCs facilitate targeted drug delivery, reducing systemic side effects and improving therapeutic outcomes. Their biocompatibility and ability to enhance permeability across biological membranes make them particularly suitable for improving MTF’s delivery to target tissues. Furthermore, NLCs provide a versatile platform for modifying drug release profiles, ensuring sustained therapeutic effects. Given these advantages, the incorporation of MTF into NLCs represents a novel strategy to optimize its pharmacological effects, particularly in conditions requiring improved bioavailability and prolonged drug action, such as diabetes and inflammatory disorders.
Numerous researchers prepared NLCs as a drug delivery system for anti-diabetic drugs. Piazzini et al developed silymarin-loaded NLCs using Cetyl palmitate and Lauroglycol 90 as the lipid combination and Brij as surfactant19 to improve its oral bioavailability. Also, Ilyas et al developed and optimized pioglitazone-loaded NLCs by utilizing various types of surfactants (Tween 80 and Span 80) as well as solid lipid (Compritol 888 ATO) and liquid lipid (Labrasol) to improve pioglitazone bioavailability and hence its antidiabetic efficacy.20 While several studies have developed metformin-loaded nanostructured lipid carriers (MTF-NLCs), this work demonstrates unique advancements in formulation and evaluation. The novelty lies in the optimized preparation method combining hot melt homogenization and ultrasonication to produce MTF-NLCs with superior entrapment efficiency, smaller particle size, high zeta potential, and sustained drug release. Unlike previous studies, this work specifically examines the protective effects of MTF-NLCs on diabetes-induced damage in the submandibular glands, pancreas, liver, and kidneys, addressing gaps in understanding the systemic benefits of metformin in advanced nano-formulations. The study also highlights the reduction of serum inflammatory cytokines (TNF-α and IL-1β) and the amelioration of pancreatic TNF-α expression, showing that MTF-NLCs significantly outperform free MTF in mitigating inflammation and tissue injury.
Nanostructured lipid carrier-loaded metformin hydrochloride demonstrated significant cytotoxicity and anticancer potential against oral cancer KB cell line. Increased intracellular reactive oxygen species and apoptosis were proposed for the anticancer effect.21
Moreover, metformin nanostructured lipid carriers were reported to bypass the blood–brain barrier, consequently reducing secondary injuries (like oxidative stresses, mitochondrial dysfunction, … etc) and inflammatory cytokines in cerebrospinal fluid and alleviating histological changes after brain injury.22
The effect of metformin nanostructured lipid carriers on submandibular salivary glands has not been fully elucidated. Given metformin’s poor permeability and associated side effects, this study aims to enhance its bioavailability and therapeutic efficacy using NLCs and test its functionality both in vivo and in vitro.
Materials and Methods
Materials
Metformin (MTF) was kindly provided by Tabuk Pharmaceutical Company (Tabuk, Saudi Arabia). Geleol was purchased from Sasol Germany GmbH (Witten, Germany), Stearic acid from Hi-Media Laboratories Pvt. Ltd. (Mumbai, India), Oleic acid and Pluronic F-68 from Sigma Aldrich (St. Louis, MO., USA), and Tween 80 from Sigma Chemical Company (St. Louis, MO., USA) (Taufkirchen, Germany). All other chemicals were of analytical grade.
Experimental Part
Design of Different Nanostructured Lipid Carrier Formulations of MTF
Factorial design is an important method used in the field of pharmaceutical preparation to obtain the best composition of the formulation ingredient that achieves the best performance of the drug. This study used 23 factorial design, using Design Expert Software version 11, to obtain different formulations of MTF-NLCs with different compositions. A three-factor, two-level factorial design (2³) is an efficient statistical approach used to optimize metformin-loaded NLCs by evaluating the effects of three independent variables, each at two levels.23 This design requires eight experimental runs (2³ = 8) to assess the main effects and interactions between factors.24 It helps identify optimal conditions for enhancing drug encapsulation, particle size, and controlled release. The factorial design also reveals synergistic or antagonistic interactions between variables, enabling precise formulation adjustments. This systematic approach minimizes experimental runs while maximizing data reliability, ensuring an optimized NLC system for improved metformin delivery.
Three independent variables were applied, X1; type of solid lipid, X2; type of surfactant, and X3; solid lipid to liquid lipid ratio. All previous independent variables were used in two levels. Five dependent variables were studied, Y1; entrapment efficiency %, Y2; particle size, Y3; zeta potential, Y4; polydispersity index, and Y5; drug release. The independent and dependent variables are represented in Table 1.
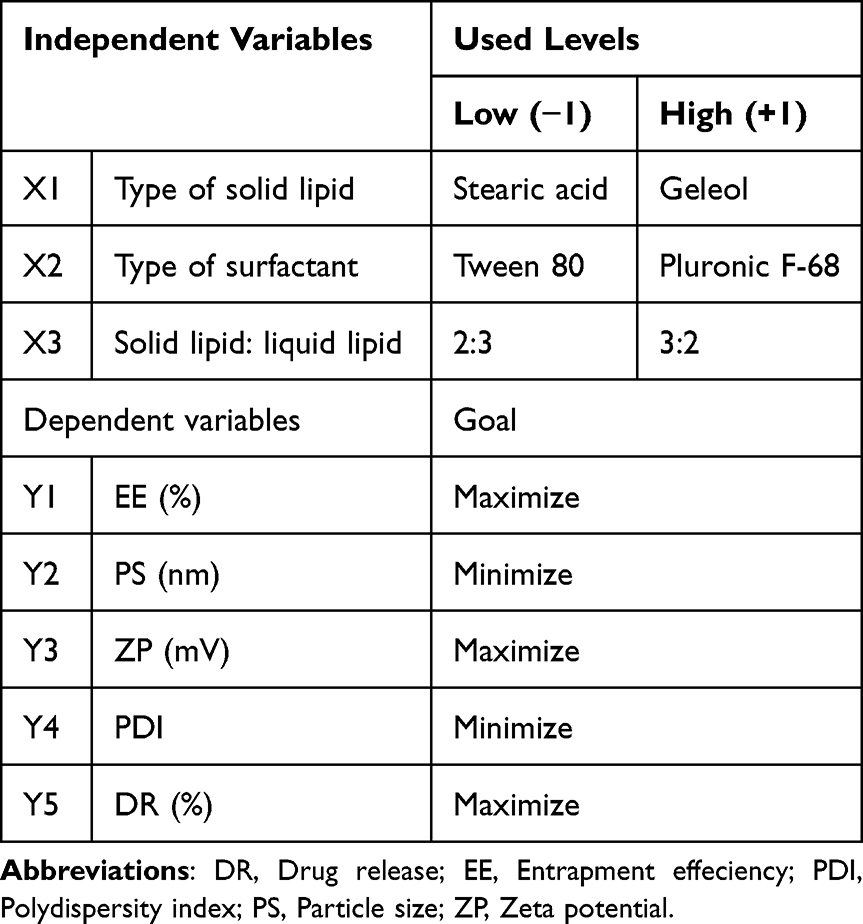 |
Table 1 The Independent and Dependent Variables of MTF-NLCs Using 23 Factorial Design |
Preparation of MTF-NLCs
Eight formulations of MTF-NLCs were designed and prepared by hot melt homogenization technique.25 An accurate amount of both solid and liquid lipids was added to a small beaker and melted at 80 °C using a hot plate (Barnstead/Thermolyne, Swedesboro, NJ, USA). In another small beaker, an accurate amount of MTF (20 mg) was dissolved in distilled water in presence of surfactant (Tween 80 or Pluronic F-68) and heated to the same temperature as the lipid phase. The aqueous phase was added dropwise to the heated lipid phase while homogenized at 15,000 rpm using a Heidolph Silent Crusher® homogenizer (Heidolph, Schwabach, Germany). The homogenization was continued for 10 min, after addition of the aqueous phase, to obtain a homogeneous O/W coarse emulsion. To reduce the size of oil droplets in the internal phase, the resultant preparation was sonicated for 5 min by probe sonicator (2 sec on and 2 sec off) using a digital sonifier (Branson, Danbury, CT, USA). The prepared formulations were then allowed to cool for 2 hours at room temperature to solidify the prepared MTF-NLCs.26 The composition of MTF-NLC formulations is represented in Table 2.
 |
Table 2 The Designed Nanostructured Lipid Carriers Loaded Metformin According to 23 Factorial Design |
Evaluation of the Prepared MTF-NLC Formulations
The effect of independent variables on EE%, PS, ZP, PDI, and DR of MTF-NLC formulations was studied.
Determination of the EE% (Y1)
Entrapment efficiency (EE%) is essential for evaluating the amount of drug effectively encapsulated within carriers, influencing therapeutic efficacy, release profile, and overall formulation performance. In this study, EE% of MTF was determined by indirect technique. Two milliliters of each formulation were transferred to Eppendorf and centrifuged for 30 min at 15,000 rpm with temperature control at 4°C using a cooling centrifuge (Biofuge, primo Heraeus, Germany).27 The centrifugation process allows the separation of entrapped drug in NLCs (the precipitate) and free drug (the supernatant). The clear supernatant (1 mL) was separated into a volumetric flask diluted with distilled water up to 100 mL. The resultant solution was analyzed spectrophotometrically at 232 nm, to determine the concentration of the free drug, using UV spectrophotometer (Shimadzu, Japan). The EE% of MTF was determined by applying the following equation:

Determination of PS (Y2), ZP (Y3) and PDI (Y4)
PS, PDI, and ZP are crucial for optimizing drug delivery, influencing stability, uniformity, bioavailability, and cellular uptake, ensuring effective and consistent therapeutic outcomes. The measurements of PS, ZP, and PDI were done by a dynamic light scattering technique using Zetasizer (Malvern Instruments Ltd., Malvern, UK). The prepared formulations of MTF-NLCs were diluted with distilled water before measurement (1:100). The measurements were done at room temperature and an angle of 90°.28
Study of in vitro Drug Release (Y5)
In vitro release study evaluates drug release from formulations, simulating biological conditions to predict in vivo performance. The release study of MTF from prepared NLC formulations was done using Franz cell diffusion apparatus (Maharashtra, Mumbai, India). A sample of each formulation was added to the donor cell (equivalent to 2 mg MTF). The receptor cell was filled with 10 mL of phosphate buffer saline pH 7.4. The donor and receptor cells were separated with a cellophane membrane (molecular weight cut off 12.000–14.000). The dissolution media was maintained at 37 ± 1 °C and was stirred at 100 rpm. At various time intervals (1, 2, 3, 4, 6, 8, 10, and 12 h), 1 mL was withdrawn from the receptor cell and analyzed using a UV spectrophotometer at 232 nm after suitable dilution with distilled water using water as a blank. The experiment was carried out in triplicate, and the Mean ± SD was calculated. The data of the in-vitro release study was kinetically treated, using multiple kinetic models, including Zero-order, First-order, Second-order, Higuchi, Korsmeyer–Peppas, Hixson-Crowell, and Baker-Lonsdale, to determine the best-fitted release mechanism.29
The Optimization Process
Design-Expert 11 software was used to find the best level of the independent variables (X1, X2, and X3) for preparing MTF-NLC with the desired dependent variables. Numerical optimization was performed using a desirability function to achieve an optimal balance between EE, PS, ZP, PDI, and DR. The goal of the optimization process was to maximize EE% (Y1), minimize the PS (Y2), maximize the absolute ZP (Y3), minimize the PDI (Y4), and maximize the DR (Y5).
The Surface Morphology Study of the Optimized MTF-NLCs
Transmission Electron Microscopy (TEM) provides high-resolution imaging to analyze nanoparticle morphology, size, and structural details, ensuring accurate characterization of pharmaceutical nanocarriers. The surface properties of the optimized MTF-NLC formulation (MTF-NLC7) were studied using a Transmission electron microscope (TEM) (JTEM model 1010, JEOL®, Tokyo, Japan). The optimized formulation was diluted with distilled water after that one drop was applied to a collodion-coated copper grid and kept for drying at room temperature. Uranyl acetate (2% w/v) was used to stain the sample then pictured with TEM at room temperature.30
Infra-Red Spectroscopy (IR)
IR spectroscopy is crucial for confirming drug-excipient compatibility, identifying functional groups, and detecting chemical interactions. It ensures formulation stability, structural integrity, and the absence of undesirable degradation or molecular changes in drug delivery systems. IR spectroscopy was applied to determine the drug’s compatibility with other formulation components. Samples of pure MTF, Geleol, and lyophilized MTF-NLC7 were compressed into discs with potassium bromide. Each disc was scanned using Fourier-Transform Infrared Spectroscopy (Shimadzu 435 U-O4 IR spectrometer, Japan), from 4000 to 400 cm−1.20
Thermal Analysis
Differential Scanning Calorimetry (DSC) analyzes thermal transitions, measuring heat flow differences to assess material crystallinity, purity, compatibility, and phase transitions in pharmaceutical formulations. The differential scanning calorimetry study (DSC) of pure MTF, Geleol, and lyophilized MTF-NLC7 was done using Shimadzu DSC-50 (Japan). Samples were subjected to heating at a temperature ranging from 25 to 250 °C after sealing in an aluminum pan. The scanning was done under a flow of nitrogen gas with a rate of 10 °C/min. The used standard was an empty aluminum pan.21,31
In vivo Study
The experimental design was conducted guided by the principles of the declaration of Helsinki, and the international ethical guidelines for biomedical research involving animal subjects developed by the council for international organization of medical science (CIOMS) and was approved by the scientific research ethics committee at the Faculty of Pharmacy, Sinai University, Arish, Egypt (approval number SU-SREC-3-02-23). Forty male Sprague Dawley rats (200–250 gm) were kept for one week of acclimatization with free access to food and water under standardized lab conditions. The sample size was calculated using F-test (ANOVA: fixed effect, omnibus, one way) with an alpha (0.05) and power (1-β) (0.85) using G*Power 3.1.9.4.32
High-fat diet (HFD)/streptozotocin (STZ, Sigma Aldrich, USA, S0130) was used to induce T2DM.33 The HFD (44.3-kJ/kg total energy) was composed of fat 22%, carbohydrate 48%, and protein 20%.34 Thirty rats (10 per group) were maintained on HFD for four weeks followed by a single intraperitoneal injection of STZ. After 72 hours, blood glucose was quantified in tail vein samples using a glucometer (Accu-Chek Performa, USA) to confirm the successful induction of the diabetic model. Blood glucose levels higher than 250 mg/dl were accepted, and animals were further randomly assigned to three experimental groups (n = 10) as follows: DM animals received no treatment. DM+MTF, animals received MTF for eight weeks. DM+MTF-NLC, animals received MTF-NLC for eight weeks. MTF and MTF-NLC were administered orally (50mg/kg) daily. An additional group of rats (n=10) were kept on a regular standard diet for eight weeks and served as a control group. The weight of rats from various experimental groups as well as blood glucose were weekly recorded.
Every week, blood glucose level was checked in tail vein samples using a glucometer. Twenty-four hours following the last dose of various treatments, rats were euthanized using thiopental sodium (40 mg/kg). Blood was withdrawn and then centrifuged for 10 min at 3000 rpm for serum separation. Serum was used for assessment of renal and liver function. Both pancreas and submandibular salivary glands were harvested and washed in ice-cold saline. The right salivary gland and one part of the pancreas were flash liquid nitrogen for further use in gene expression analysis by real-time polymerase chain reaction (RT-PCR). The left salivary gland and the other part of the pancreas were cut longitudinally and preserved in 10% buffered formalin for histological studies.
Assessment of the Effect of Treatments on Liver and Kidney Function Tests
Serum samples were assessed for quantitative determination of activity of both alanine aminotransferase (ALT) ((BEIS11-I, SPINREACT) detection range from 0 U/L to 400 U/L) and aspartate aminotransferase (AST) ((MDBEIS46-I, SPINREACT) detection limit of 0 U/L to linearity limit of 467 U/L.) as indicators of liver function. The optical densities were determined at the wavelength 340 nm for ALT and AST.
The colorimetric detection of creatinine ((MDBSIS13-I, SPINREACT) with detection limit of 0.000 mg/dL to linearity limit of 35 mg/dL) and blood urea nitrogen (BUN) ((TKBSIS47-I, SPINREACT) with detection range from 0.743 mg/dL to 400 mg/dL), was conducted according to manufacturers’ instructions (SPINREACT, Spain). The optical density was adjusted at primary wavelength of 550 nm for creatinine and 340 for blood urea nitrogen.
Assessment of the Effect of Treatments on Serum Inflammatory Markers
Serum concentration of inflammatory cytokines tumor necrosis factor-α (TNF- α), (catalog No E-EL-R2856 with a detection range 15.63–1000 pg/mL) and Interleukin-1β (IL-1β), (catalog No (E-EL-R0012) with detection range 31.25–2000 pg/mL) were measured by Sandwich-ELISA principle. (Biotinylated) detection antibody specific for each inflammatory cytokine (Rat IL-1β and Rat TNF-α) and Avidin Horseradish Peroxidase (HRP) conjugate were added successively to each microplate well containig the samples and incubated. The substrate solution was added to each well. The enzyme-substrate reaction was terminated by the addition of stop solution and the color turns from blue to yellow. The optical density (OD) was measured spectrophotometrically at a wavelength of 450 nm.
Assessment of the Effect of Treatments on Gene Expression of Inflammatory Markers
The Interleukin-1β (IL-1β) and Tumor necrosis alpha (TNF-α) gene expression levels were measured in both SMG and pancreas using quantitative Real-time PCR technique. Tissues were homogenized and purified, followed by RNA extraction and then cDNA synthesis using QuantiTect Reverse Transcription Kit, cat. No: 205310 (Qiagen, Hilden, Germany). The produced cDNA was then amplified using QuantiTect SYBR Green PCR Kit cat no: 204141 (Qiagen, Germany). All samples were analyzed using the 5 plex Rotor Gene PCR Analyzer (Qiagen, Germany). The relative expression level (for both genes) was normalized to internal control (β-actin) and relative to the calibrator (negative control sample) using the equation 2−∆∆Ct test control.
Histopathological Studies
Pancreas and submandibular salivary gland sections were fixed in 10% buffered formalin, washed and processed into paraffin blocks then cut into 3microns sections that are then deparaffinized, rehydrated, and stained by routine H&E stain.35 Regarding immunohistochemical staining, after antigen retrieval, the tissue sections were stained with primary antibodies against tumor necrosis factor-α (TNF- α) (Servicebio, GB11188) at dilution of 1:1000 and Interleukin-1β (IL-1β) (GB11113) at dilution of 1:800 followed by incubation with secondary antibody and counter stained with hematoxylin. Slides were photographed using Olympus® digital camera installed on Olympus® microscope with 1/2 X photo adaptor, using 20X objective. The result images were analyzed on Intel® Core I7® based computer using VideoTest Morphology® software (Russia) with a specific built-in routine for area, % area, measurement, object counting, and contact_Angle using software IMAGE J 1.5. The percentage of areas of positive reaction (areas of interest) was thresholded and calculated in relation to the total surface area.36
Statistical Analyses
Data were presented as mean ± SD Statistical analyses and graphical presentations were performed using GraphPad Prism 9. A p-value of less than 0.05 was considered statistically significant. Data were analyzed with one-way analysis of variance (ANOVA) to compare the different groups, followed by a Tukey posthoc test for multiple comparisons. Two-way ANOVA was used for the analysis of changes in blood glucose level and body weight.
Results and Discussion
Using Design Expert version 11, the 23 factorial design was used to design the composition of different formulations of MTF-NLCs based on the selected independent variables and their levels. All formulations of MTF-NLCs were prepared by the hot melt homogenization-ultrasonication technique and evaluated for Y1: EE%, Y2: PS, Y3: ZP, Y4: PDI, and Y5: DR. Table 3 represents the findings of the previous responses.
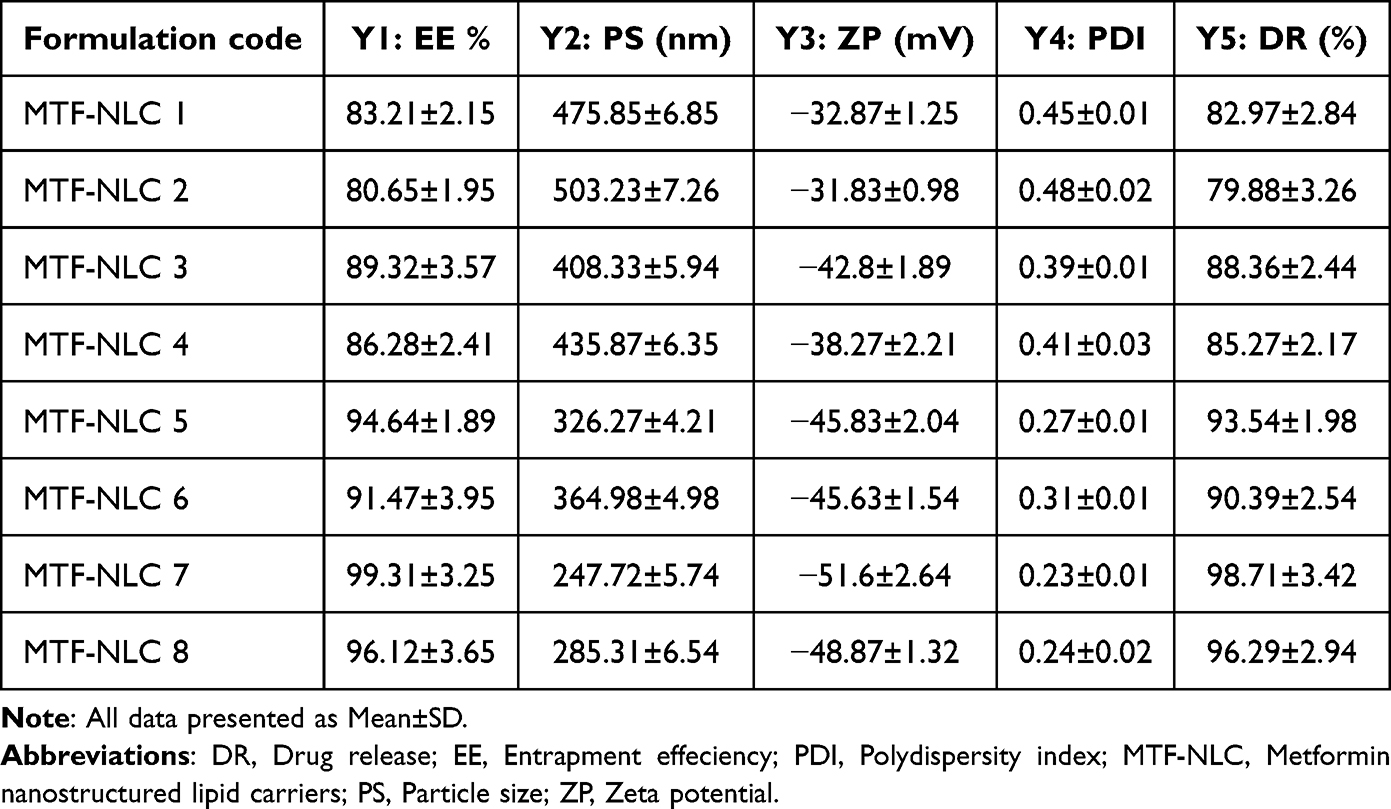 |
Table 3 The Determined Dependent Variables of MTF-NLCs |
As represented in Table 4, it was found that the suggested model for all responses was the linear one. The Model F-values of Y1, Y2, Y3, Y4, and Y5 were 455.81, 613.19, 38.62, 294.44, and 2117.82 implying a significant model with a p-value <0.01. Also, the data were well fitted on the suggested linear model with R2 values of 0.9971, 0.9978, 0.9666, 0.9955, and 0.9994 for Y1, Y2, Y3, Y4, and Y5, respectively, and the difference between Predicted R² and Adjusted R² were less than 0.2 for all responses which indicate best fitting by linear model. The adequate Precision, which measures the signal-to-noise ratio, were 57.1984, 64.5779, 16.1457, 41.6413, and 123.2883 for Y1, Y2, Y3, Y4, and Y5, respectively. All values greater than 4 indicated an adequate signal and the linear model could be used to navigate the design space.
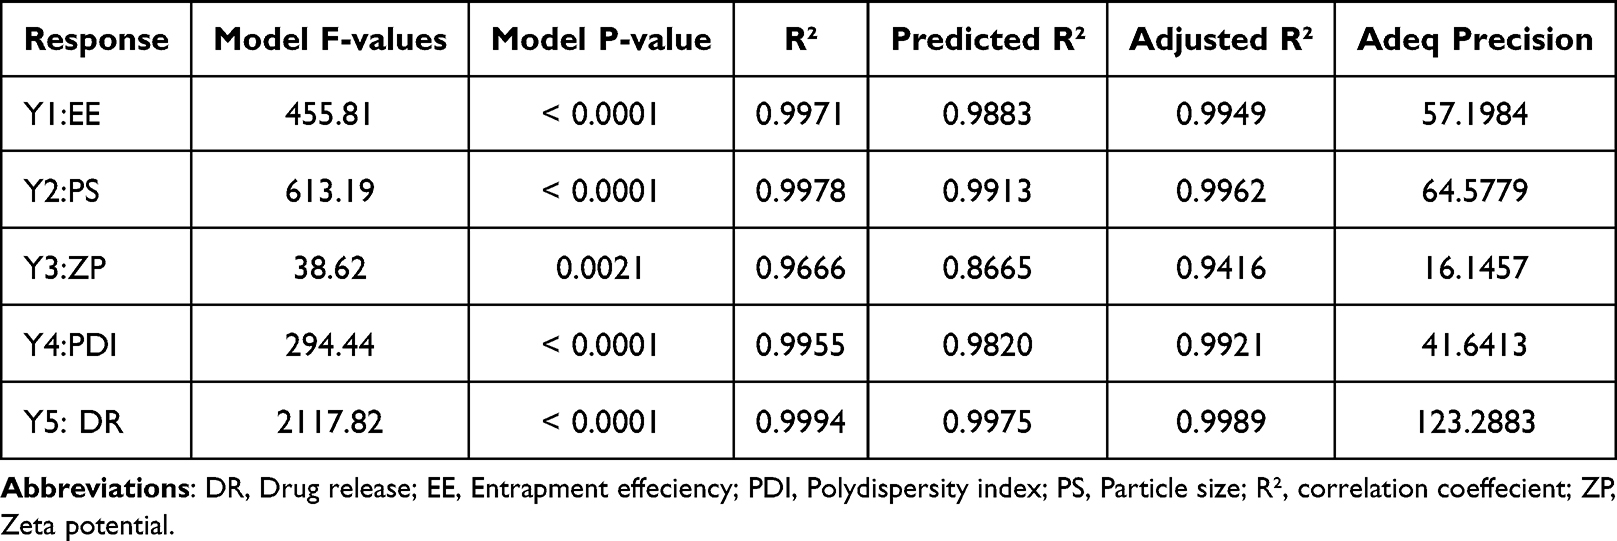 |
Table 4 Fit Statistic for the Dependent Variables Y1, Y2, Y3, and Y3 Regarding Linear Model |
Effect of Independent Variables on Y1: EE%
As represented in Table 3, it was found that EE% ranged from 80.65 ± 1.95 to 99.31 ± 3.25%. Figure 1, shows the effect of the independent variables in the different responses. As shown in Figure 1A, at an average value of X3, it was found that the EE% of MTF was increased using Pluronic F-68 rather than Tween 80 either using Geleol or stearic acid as a solid lipid. These outcomes could be explained by Pluronic F-68’s higher HLB.37 Also, the EE% increased using Geleol rather than stearic acid in all formulations either using Pluronic F-68 or Tween 80 as surfactant. These findings may be related to Geleol’s longer carbon chain than stearic acid, which led to a higher internal space for drug entrapment.38 At a fixed value of X1, the interactive effect of surfactant type and solid: liquid lipid was shown in Figure 1B. It was found that the EE% was increased in formulation prepared with Pluronic F-68 rather than Tween 80 either using a low or high ratio of solid to liquid lipid and also, EE% was higher at a low ratio of solid to liquid lipid (2:3) in all formulations. Figure 1C shows the interactive effect of solid lipid type and solid lipid to liquid lipid ratio on the EE% at a fixed value of X2. It was found that the EE% was increased using Geleol as a solid lipid instead of stearic at both levels of solid to liquid lipid. Also, EE% was increased using a low ratio of solid to lipid in all formulations either using Geleol or stearic acid as a solid lipid. These outcomes might be explained by the fact that the drug’s solubility in the lipid matrix increased as the ratio of liquid lipids increased and that the large imperfections in the solid lipid crystal lattice caused by an increase in liquid lipids led to more space for drug entrapment. According to other studies, adding liquid lipids made solid lipids more flexible, which helped to explain why the EE% was higher when the liquid lipid content was high.39 As represented in Table 5, all independent variables had a significant effect on EE% (P < 0.001).
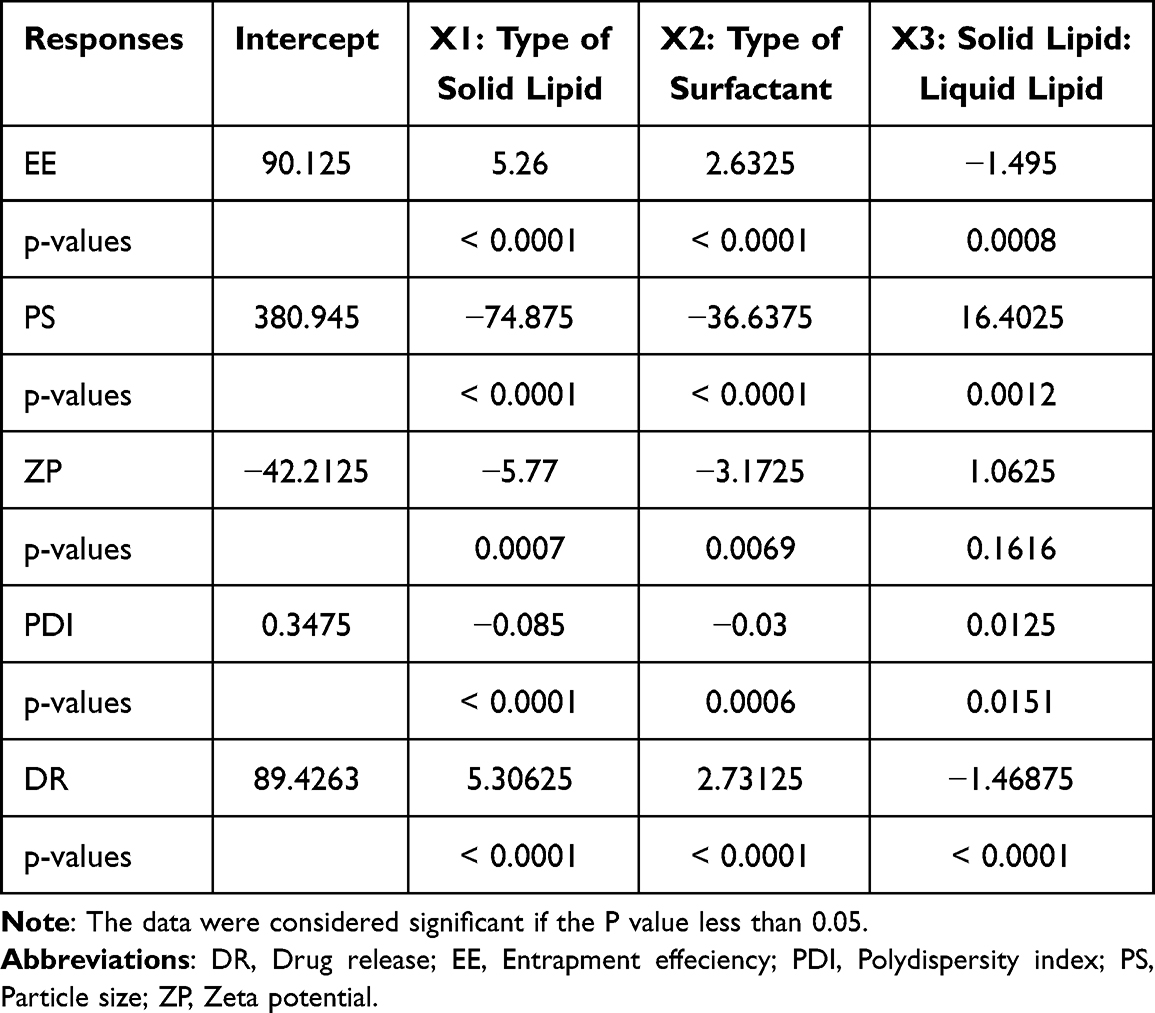 |
Table 5 Analysis of Variance for the Effect of Independent Variables in the Dependent Variables |
 |
Figure 1 Effect of independent variables in EE% (A) effect of type of solid lipid and type of surfactant, (B) effect of type of surfactant and solid to liquid lipid ratio, (C) effect of type of solid lipid and solid to liquid lipid ratio. |
Effect of Independent Variables on Y2: PS, Y3: ZP, and Y4: PDI
The concept of particle size was developed so that a comparison could be made between various formulations based on the dimensions of the dispersed particles. Based on the data presented in Table 3, it was observed that the particle size of all of the prepared MTF-NLC formulations fell within the nano range (247.72 ± 5.74 to 503.23 ± 7.26 nm). As shown in Figure 2A, at a fixed value of X3, it was observed that the formulation prepared by Geleol as a solid lipid had a smaller particle size than that prepared by Stearic acid either using Tween 80 or Pluronic F-68 as a surfactant. This may be due to the higher viscosity of stearic acid, which causes it to solidify into larger particles upon congealing during the preparation. Also, the type of surfactant had a substantial impact on the size of MTF-NLCs, where the PS of formulations prepared in the presence of Pluronic F-68 have smaller size than those prepared by tween 80 either the Geleol or stearic acid were used as solid lipid. This may be due to the difference in HLB value. The higher the HLB value of the surfactant, the more stable the prepared emulsion with a reduction in particle size.40 Similar results were obtained by Mura et al who found that NLCs of Hydrochlorothiazide prepared in the presence of Pluronic F-68 were smaller than those prepared with tween 80.41 At a fixed value of X1, it was found that PS was reduced using Pluronic F-68 instead of tween 80 at both low and high levels of solid-to-liquid lipid ratio, see Figure 2B. In addition, the PS was decreased using low solid lipid and high liquid lipid either in formulations prepared in the presence of Pluronic F-68 or tween 80. This could be attributable to the greater liquid lipid content, which decreases the viscosity inside of NLCs and, as a result, decreases surface tension, resulting in the formation of smaller and smoother surface particles. Figure 2C shows the interactive effect of X1 and X3 at a fixed value of X2. It was found that the PS of the MTF-NLCs decreased using Geleol instead of stearic acid either at low or high levels of X3 and also, decreased at low level of X3 either using Geleol or stearic acid. As represented in Table 5, all independent variables had a significant effect on PS.
 |
Figure 2 Effect of independent variables in PS (A) effect of type of solid lipid and type of surfactant, (B) effect of type of surfactant and solid to liquid lipid ratio, (C) effect of type of solid lipid and solid to liquid lipid ratio. |
Zeta potential refers to the electric potential, which exists in the interface of NLCs. The higher the value of ZP value, either positive or negative, the higher the repulsion between NLCs and hence higher stability. In general, 30 mV for ZP of nanoparticles is thought to be suitable for obtaining stable nanoparticle dispersion due to electrical repulsion between the particles.42 As shown in Table 3, all produced MTF-NLCs have a negative zeta potential value that ranges from −31.83 0.98 to −51.6 2.64 mV. The presence of oleic acid and the hydroxyl ions on the surface of NLCs may both contribute to the negative charge. It was observed in Figure 3 that ZP negative value was increased in formulations prepared in the presence of Geleol, Pluronic F-68, and a high ratio of oleic acid. Table 5 showed that both type of solid lipid and type of surfactant had significant effects on ZP.
 |
Figure 3 Effect of independent variables in ZP (A) effect of type of solid lipid and type of surfactant, (B) effect of type of surfactant and solid to liquid lipid ratio, (C) effect of type of solid lipid and solid to liquid lipid ratio. |
The polydispersity index, often known as the PDI, is a size-based indicator that is used to evaluate the homogeneity of a sample. According to the results provided in Table 3, the DPI value of all formulations occurred in the range of (0.23± 0.01 to 0.48± 0.02). Figure 4, demonstrates that the PDI value was increased in formulations that were prepared with stearic acid, Tween 80, and in a low ratio of liquid lipid. On the other hand, the value was decreased in formulations that were prepared with gelelol, pluronic F-68, and a higher amount of liquid lipid, with p value <0.0001, 0.0006, and 0.0151, respectively, see Table 5.
 |
Figure 4 Effect of independent variables in PDI (A) effect of type of solid lipid and type of surfactant, (B) effect of type of surfactant and solid to liquid lipid ratio, (C) effect of type of solid lipid and solid to liquid lipid ratio. |
Effect of Independent Variables on Y5: DR
The release of MTF was controlled by incorporation into NLCs. As represented in Table 3, it was found that drug release after 12 h ranged from 79.88±3.26% for MTF-NLC2 to 98.71±3.42% for MTF-NLC7. The release of MTF from NLCS was in controlled manner over 12 h, while the free MTF exhibited about 90% dissolution within 1h. The amount of drug release was higher in formulations prepared by Gelelol, Pluronic F-68, and a higher content of liquid lipid, see Figure 5. This could be owing to the small size of the prepared NLCs, which increased the surface area and thus the dissolving properties. Table 5 showed that all independent variables had a significant effect had significant effects on DR% (p < 0.0001).
 |
Figure 5 Effect of independent variables in DR% (A) effect of type of solid lipid and type of surfactant, (B) effect of type of surfactant and solid to liquid lipid ratio, (C) effect of type of solid lipid and solid to liquid lipid ratio. |
As represented in Table 6 and Figure 1supp, the best-fitted mechanism for the drug release from prepared NLCs was the Higuchi diffusion model based on the highest value of (r).
 |
Table 6 The Calculated Correlation Coefficients (r) for the Release of MTF From MTF-NLCs Using Different Kinetic Orders and Systems |
The Higuchi diffusion model suggests that the release of MTF from the prepared NLCs is controlled by diffusion through the matrix, with drug molecules gradually diffusing out over time. This mechanism is often observed for systems where the drug is homogeneously dispersed in the carrier, allowing for a controlled release profile.
On the other hand, free MTF follows a first-order release model where the release is driven by concentration gradients rather than matrix diffusion. This comparison highlights the difference in release behavior between the NLC-based formulation and the free drug, with the NLCs offering a more controlled release, which is beneficial for therapeutic efficacy, especially in chronic conditions like diabetes.
Optimization of Formulation Factors
For the optimization process, 23 factorial design was applied to obtain the optimal level of formulation variables that produce an optimized MTF-NLC with the appropriate response values. The objective of optimization was to maximize the EE% (Y1), minimize the PS (Y2), maximize the absolute value of ZP (Y3), minimize the PDI (Y4), and maximize the DR (Y5). As shown in Figure 6A, the optimal formulation was MTF-NLC7, which was made with a high level of X1 (+1, Geleol), a high level of X2 (+1, Pluronic F-68), and a low level of X3 (−1, 2:3). It was found that the predicted value was close to the actual value with desirability index equal to 0.996, indicating that the applied factorial design was valid to obtain an optimized formulation.43 Geleol and Pluronic F-68 were chosen for the optimized NLC formulation due to their complementary properties. Geleol, a solid lipid, serves as the core matrix for drug loading, offering controlled release and improved stability. Pluronic F68, a nonionic surfactant, provides steric stabilization, improving colloidal stability and drug encapsulation efficiency. Its hydrophilic nature ensures biocompatibility and enhances drug release profiles. Together, these excipients ensure small particle size, reduced aggregation, and controlled drug release, making them ideal for enhancing the performance of NLCs in drug delivery applications. The optimized MTFNLC7 formulation exhibits superior physicochemical properties, including small particle size, high entrapment efficiency, and stable zeta potential, which collectively enhance its biological performance. The nanosized particles facilitate improved cellular uptake and penetration across biological membranes, ensuring efficient drug delivery to target sites. High entrapment efficiency maximizes drug loading, prolonging metformin release and maintaining therapeutic concentrations for an extended period. Additionally, the stable zeta potential prevents particle aggregation, ensuring formulation stability and consistent bioavailability. These characteristics contribute to enhanced therapeutic efficacy, improving metformin’s anti-inflammatory and organ-protective effects, particularly in managing diabetes and related complications.
 |
Figure 6 The optimized formulation (A) The actual and predicted value of the optimized formulation (MTF-NLC7), (B) TEM image of MTF-NLC7. |
TEM Image of MTF-NLC
The TEM image of MTF-NLC7 revealed that the prepared nanoparticles were spherical with Nano size, see Figure 6B. The interface appeared with high contrast as a result of the adsorption of the uranyl acetate stain at the interface. The variation in size of NLCs appeared in the TEM may result from shrinking and drying of NLCs during sample preparation for TEM.44,45 Similar results were obtained by Shi et al who studied the surface morphology of Baicalin NLCs and found that the NLCs were spherical with nanosize.46
The IR Spectroscopy
IR spectroscopy is one way for determining the compatibility of a drug with other substances. Figure 7A shows the IR spectra of MTF, Geleol, and MTF-NLC7. The IR spectrum of pure MF revealed a characteristic peak at 3375 cm−1 and 3312 cm−1, corresponding to N-H primary stretching, and a peak at 3171 cm−1, corresponding to secondary N-H stretching vibration. Also, two bands at 1631 and 1570 cm−1 due to C=N stretching. The absorption band at wavenumber 1474 cm−1 associated with C-H asymmetric bending (-CH3), 1174 cm−1, and 1062 cm−1 corresponding to C-N stretching. Rostamkalaei et al studied the IR spectrum of metformin and found similar results.47 The IR spectrum of Geleol showed characteristic peaks 3419.17 cm−1, 2919.7 cm−1, 1735.62 cm−1 of O–H stretching, C–H stretching, and C=O stretching, respectively. The results are in good agreement with Khezri et al who studied the IR spectrum of Geleol.48 All characteristic peaks of the drug were found in the IR spectrum of the prepared MTF-NLC7 which gave an indication of the compatibility between drug and Geleol. Similar results were obtained by Ngwuluka et al who prepared metformin solid lipid nanoparticles and found that the IR spectrum of the prepared formulation showed the characteristic peaks of the drug and revealed the compatibility between MTF and other ingredients.49
 |
Figure 7 IR spectrum of Metformin, Geleol, and optimized MTF-NLCs (A), and DSC thermograms of Metformin, Geleol, and optimized MTF-NLCs (B). |
The Thermal Analysis of MTF in the Optimized Formulation MTF-NLC7
It is possible to determine the degree of crystallinity through thermal analysis by employing the differential scanning calorimetry method (DSC). As shown in Figure 7B, the pure MTF DSC thermogram exhibited a single endothermic peak at 230 °C corresponding to its melting point.50 Geleol’s DCS thermogram revealed a broad peak at 64 °C, which corresponds to its melting point.51 The MTF-NLC7 DSC thermogram showed a decrease in the intensity of the MTF peak, which may be owing to the MTF being entrapped in the lipid core of the NLCs. Similar results were obtained by Kenechukwu et al who prepared metformin as PEGylated lipid nanoparticles, and found that the DSC thermogram of the formulation exhibited two endothermic peaks one of the lipid and the second for the metformin.52 They explained the presence of metformin peak by dispersion of metformin in the lipid matrix.
Effect of MTF-NLC on Body Weight and Blood Glucose Levels
There was no statistical significant difference between the groups till 9 weeks where both DM+MTF & DM+ MTF-NLC groups showed a significant reduction of gained weight compared to the diabetic group (P < 0.05). Additionally, both DM+ MTF & DM+ MTF-NLC groups showed significant restoration of normal blood glucose levels compared to DM group starting from the 12th week (p < 0.05) with no significant difference between the MTF and its nanoformulation (MTF-NLC), Figure 8.
 |
Figure 8 Effect of MTF and MTF-NLC on diabetic changes in body weight (A) and blood glucose (B) levels. The data were reported as mean±SD. The data were analyzed using Two-way ANOVA. P value less than 0.05 was considered significant, n=3–6. |
Several studies have reported that HFD model increases body weight and blood glucose levels with insulin resistance development.53 The reduction of body weight gain with MTF intervention as previously reported was attributed to the reduction of visceral fat deposition and improved energy expenditure in human and animals.54,55 Indeed, 8-week treatment with MTF prevented HFD-induced weight gain and decreased fat deposition in HFD-fed rats.56 Of note, Momoh et al reported a similar reduction in blood glucose levels in an alloxan-induced diabetes model using solid lipid microparticles loaded with metformin hydrochloride.57 They attributed the hypoglycemic effect to the association of the drug in the core of the lipid and its stability in the acidic conditions of the stomach. Kenechukwu et al reported similar results with increased bioavailability of several surface-modified nanostructured lipid carriers based on solidified reverse micellar solutions loaded with metformin.31
MFT-NLC Improved Kidney and Liver Function
T2DM adversely affects various body organs with reduced cell mass and function. Elmahdy et al reported that oral administration of HFD for 12 and 18 weeks induced a significant increase in liver enzymes, with concomitant increases of liver TNF α, IL-1β, and IL-18.58 Likewise, our results showed marked elevation in markers of kidney and liver function in the diabetic group when compared to the control group. However, a significant reduction was observed with MTF and MTF-NLC treatment. Additionally, a significant difference was observed between MTF-NLC treated group compared to DM+MTF group (p < 0.05) Figure 9.
 |
Figure 9 Effect of MTF and MTF-NLC on diabetic alteration of serum (A) creatinine and blood urea nitrogen (BUN) (B) liver function markers (C) alanine amino transferase (ALT) and (D) aspartate aminotransferase (AST). Data were expressed as mean±SD. P < 0.05 was considered significant, compared to control (*), diabetic (#), significance between MTF-NLC and MTF ($), n=3. |
A similar protective effect of MTF was observed against the hepatotoxicity in STZ-induced diabetic model including restoration of serum ALT and AST activities, with a reduction of total lipid, sodium, and potassium levels.59 Ossai et al reported the ability of lipid vesicle-entrapped metformin to reduce insulin resistance effectively and increase creatinine levels.60
MTF-NLC Attenuated Serum and Tissue Inflammatory Cytokines
As shown in Figure 10, MTF and MTF-NLC showed a significant reduction of TNF-α and IL-1β in serum (p < 0.05) when compared to the diabetic group. DM+MTF-NLC group showed a significant reduction in serum concentration of both inflammatory cytokines compared to DM+MTF group (p < 0.05).
 |
Figure 10 Effect of MTF and MTF-NLC on diabetic alteration of expression levels of Interleukin-1β (IL-1β) (A, C and D) and Tumor necrosis factor-α (TNF- α) (B, E and F) in serum, pancreas and SMG respectively. Data were expressed as mean±SD. P < 0.05 was considered significant, compared to control (*), diabetic (#), significance between MTF-NLC and MTF ($). One Way ANOVA was used followed by Tukey post-hoc test, n=3. |
The HFD model is one of the most reliable used models as it simulates the most common route of obesity in humans and its associated metabolic effects such as insulin resistance and Beta cell mass reduction. Salivary glands and pancreas are among the affected organs.33,61,62 HFD model is associated with increased inflammatory cytokines including TNF-α and IL-1β with associated sequelae of fatty degeneration and insulin resistance.63,64 IL-1β stimulates hepatic fatty degeneration by enhancing triglycerides and cholesterol precipitation in liver parenchyma and the formation of lipid droplets.65,66 In addition, IL-1β stimulates local inflammation by inducing another pro-inflammatory cytokine production, IL-6.58 More importantly, these factors are believed to control salivary amylase release which has recently been reported to affect the progression of T2DM.67
Moreover, the anti-inflammatory effect of MTF has been well documented and has been attributed to various mechanisms including modulating anti-inflammatory genes and attenuating inflammatory cell infiltration with subsequent reduction in collagen deposition and organ fibrosis in the liver of HFD-fed rats.55 These findings are consistent with the current results as shown in Figure 10, where both MTF and MTF-NLC significantly reduced the gene expression of both TNF-α and IL-1β in salivary tissues compared to diabetic group (P < 0.05). Of note, a significant reduction in TNF-α gene expression was observed between MTF and MTF-NLC-treated groups. However, in pancreatic tissue, only MTF-NLC treatment significantly reduced the TNF-α gene expression. Meanwhile, a significant reduction was observed in pancreatic IL-1β gene expression by both MTF and MTF-NLC.
At the protein level, both MTF and MTF-NLC significantly reduced immunostaining of TNF-α and IL-1β in salivary and pancreatic tissues compared to the diabetic group. Figures 11 and 12 MTF-NLC significantly reduced pancreatic TNF-α immunostaining when compared to the MTF-treated group Figure 11. Likewise, MTF was previously reported to reduce salivary gland inflammation and restore the salivary flow rate. Moreover, MTF reduced TNF-α, IL-6, IL-17 mRNA, and protein levels in the salivary gland model of Sjögren’s syndrome.68 In parapancreatic adipose tissue of rats, MTF-mediated AMPK activation inhibited mTOR signaling, leading to a decrease in the levels of the inflammatory cytokine interleukin (IL)-1β.
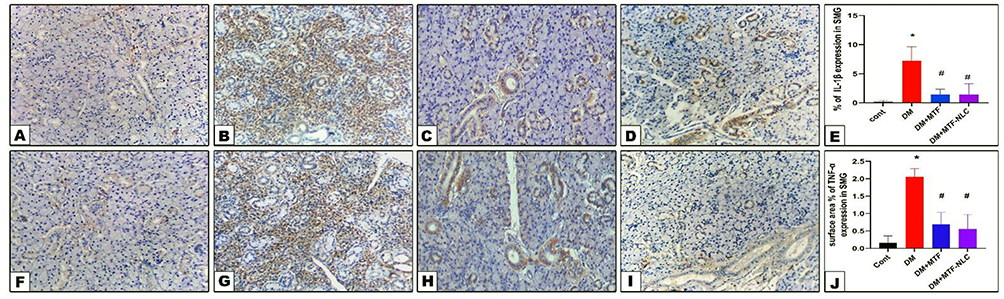 |
Figure 11 Effect of MTF and MTF-NLC on diabetic alteration of immunostaining of Interleukin-1β (IL-1β) (A–D) and Tumor necrosis factor-α (TNF- α) (F–I) in SMG. The data were expressed as mean±SD. P < 0.05 was considered significant, compared to control (cont) (A and F) (*), and diabetic (DM) (B and G) (#).MTF-NLC (C and H) and MTF (D and I). One Way ANOVA was used followed by Tukey post-hoc test (E and J), n=3. |
 |
Figure 12 Effect of MTF and MTF-NLC on diabetic alteration of immunostaining of Interleukin-1β (IL-1β) (A–D) and Tumor necrosis factor-α (TNF- α) (F–I) in the pancreas. The data were expressed as mean±SD. P < 0.05 was considered significant, compared to control (cont) (A and F) (*), diabetic (DM) (B and G) (#), significance between MTF-NLC (C and H) and MTF (D and I) ($). One Way ANOVA was used followed by Tukey post-hoc test (E and J), n=3. |
MTF-NLC Attenuated Diabetes-Induced Histopathological Alteration in Pancreas and SMG
DM group revealed disturbed parenchymal architecture, with multiple degenerative changes affecting the acinar cells as well as the duct system with vacuolated cytoplasm. Similar features were previously reported in the hyperglycemic salivary glands of diabetic rats.69 As shown in Figure 13, the intra-cytoplasmic vacuolations were attributed to the change of lipid profile and fatty degenerative changes of the SMG induced by the HFD model and generated insulin resistance.70 It was proposed that hyperglycemia enhances the generation of reactive species and oxidative stress that in turn induce damage to functional and structural macromolecules, disrupting the cell membrane and degenerative changes in the gland parenchyma and stroma as well.71,72 Additionally, dilatation of glandular ducts was observed in the HFD group, and this could be attributed to accumulation of salivary secretion and failure of its excretion due to glandular injury and dysfunction provoked by lipid accumulation.73 Altered ductal structure by diabetes was reported in STZ model directly due to hyperglycemia and indirectly due to diabetic angiopathy with reduced secretory granules and vacuolization similar to the present results.55,74 Chen et al, attributed the histopathological lesions of SG to inflammatory cell infiltration, oxidative stress, and down-regulated expression of secretory regulatory genes and proteins in salivary glands, especially in the parotid gland.75
 |
Figure 13 MTF and MTF-NLC treatment alleviated typical salivary gland and pancreatic changes in high-fat diet-induced T2DM model in rats. Alterations of the acinar and ductal structure of the submandibular gland in the diabetic group (arrows) (B) were ameliorated with better organization of ductal and acinar structure with MTF (C) MTF-NLC (D) (arrow head) compared to normal structure of control group (A). Alteration of pancreatic structure and islet cells in the diabetic group (arrows) (F) were enhanced by MTF (G) and MTF-NLC (H) (arrow head) compared to the normal structure of the control group (E) (H&E, A–H x20), n=3. |
Of note, lipid vesicle-entrapped metformin showed similar amelioration of pancreatic structure. The mechanism of action proposed included the antioxidant effect via increases in the activities of antioxidant enzymes or even initiating the synthesis of antioxidant enzymes. In addition to preventing glycogenolysis and gluconeogenesis through protein kinases and the three primary enzymes of gluconeogenesis inhibition.60
The present histological and biochemical results of the nanostructured lipid carriers (NLCs) nanoformulation, the new generations of lipid nanoparticles produced from solid lipids,21,46 are supported by Lupascu et al who reported improved biochemical and clinical parameters in the STZ-induced diabetes mellitus rat model.73 NLCs improved metformin physical properties and subsequently enhanced its anti-inflammatory activity and provided more protection against diabetes-induced organ injury. These results may pave the way for further translational experiments to test the effect of NLCs carrier and consider MTF-NLCs a promising candidate for clinical trials to overcome metformin side effects.
Conclusion
Authors successfully prepared MTF-NLCs with different compositions using hot melt homogenization-ultrasonication. Different formulations were designed with 23 factorial design. The factorial design approved its ability to optimize the formulation factors including the type of solid lipid, type of surfactant, and solid-to-liquid lipid ratio and obtain an optimized formulation with the required responses. The optimized formulation exhibited high EE% (99.31 ± 3.25%), small PS (247.72 ± 5.74 nm), high negative ZP (−51.6 ± 2.64 mV), low PDI (0.23 ± 0.01), and high drug release after 12 h (98.71±3.42%). Type 2 diabetes mellitus (T2DM) in vivo rat model was used to compare the MTF-NLCs with free MTF. It was concluded that both MTF and MTF-NLCs significantly alleviated the degenerative effects of DM in both submandibular gland (SMG) and the pancreas. Additionally, treatments improved kidney and liver function, reduced serum inflammatory cytokines, and reduced tissue SMG and pancreatic immunostaining of inflammatory cytokines with favorable effects of MTF-NLCs. Overall, the preparation of MTF as NLCs resulted in increased permeability, leading to greater anti-inflammatory action and enhanced protection against organ dysfunction related to diabetes. However, future stability studies of MTF formulations are recommended. Future directions include the stability study of NLC formulations, investigating the use of NLCs for encapsulating other antidiabetic agents to improve drug delivery and the drug outcomes. Also, developing NLC formulations combining metformin with other antidiabetic or anti-inflammatory agents to achieve synergistic effects.
Data Sharing Statement
Data available within the article or its Supplementary Material 1.
Ethical Approval
High-fat diet-induced type 2 diabetes mellitus (T2DM) in vivo rat model was used to assess the effect of optimized metformin formulation on hyperglycemia-induced organ injury. The model used was well-established experimental model for T2DM. Animals were kept in housing cages with free access to food and water under standardized lab conditions (12-hour light/12-hour dark cycle, temperature 20–24°C with a relative humidity of around 50–60%). The experimental design was approved by the scientific research ethics committee at the Faculty of Pharmacy, Sinai University, Arish, Egypt (approval number SU-SREC-3-02-23).
Acknowledgments
The authors extend their appreciation to the Deanship of Research and Graduate Studies at University of Tabuk for funding this work through research number. S-1443-0063. Additionally, the authors wish to thank Tabuk Pharmaceutical Company (Tabuk, Saudi Arabia) for kindly providing a Metformin sample.
Funding
The authors extend their appreciation to the Deanship of Research and Graduate Studies at University of Tabuk for funding this work through research number S-1443-0063.
Disclosure
No potential conflict of interest was reported by the author(s).
References
1. Facts & figures. International Diabetes Federation. Available from: https://idf.org/about-diabetes/diabetes-facts-figures/.
2. Basiak-Rasała A, Różańska D, Zatońska K. Food groups in dietary prevention of type 2 diabetes. Rocz Panstw Zakl Hig. 2019;70(4):347–357. doi:10.32394/rpzh.2019.0086
3. Nanda M, Sharma R, Mubarik S, Aashima A, Zhang K. Type-2 Diabetes Mellitus (T2DM): spatial-temporal patterns of incidence, mortality and attributable risk factors from 1990 to 2019 among 21 world regions. Endocrine. 2022;77(3):444–454. doi:10.1007/s12020-022-03125-5
4. Cesur S, Cam ME, Sayın FS, et al. Metformin-Loaded Polymer-Based Microbubbles/Nanoparticles Generated for the Treatment of type 2 diabetes mellitus. Langmuir. 2022;38(17):5040–5051. doi:10.1021/acs.langmuir.1c00587
5. Okulicz M, Hertig I, Król E, Szkudelski T. Effects of allyl isothiocyanate on oxidative and inflammatory stress in type 2 diabetic rats. Molecules. 2022;27(17):5568. doi:10.3390/molecules27175568
6. Chueire VB, Muscelli E. Effect of free fatty acids on insulin secretion, insulin sensitivity and incretin effect - a narrative review. Arch Endocrinol Metab. 2021;65(1):24–31. doi:10.20945/2359-3997000000313
7. Bailey CJ. Metformin: historical overview. Diabetologia. 2017;60(9):1566–1576. doi:10.1007/s00125-017-4318-z
8. Lehtonen S. Metformin protects against podocyte injury in diabetic kidney disease. Pharmaceuticals. 2020;13(12):E452. doi:10.3390/ph13120452
9. Della Corte CM, Ciaramella V, Mauro CD, et al. Metformin increases antitumor activity of MEK inhibitors through GLI1 downregulation in LKB1 positive human NSCLC cancer cells. Oncotarget. 2016;7(4):4265–4278. doi:10.18632/oncotarget.6559
10. Gu M, Wang P, Xiang S, et al. Effects of type 2 diabetes and metformin on salivary microbiota in patients with chronic periodontitis. Microb Pathog. 2021;161(Pt B):105277. doi:10.1016/j.micpath.2021.105277
11. Sun J, Du J, Feng W, et al. Histological evidence that metformin reverses the adverse effects of diabetes on orthodontic tooth movement in rats. J Mol Hist. 2017;48(2):73–81. doi:10.1007/s10735-016-9707-y
12. Teper Y, Ye L, Waldron RT, et al. Low dosage combination treatment with metformin and simvastatin inhibits obesity-promoted pancreatic cancer development in male KrasG12D mice. Sci Rep. 2023;13(1):16144. doi:10.1038/s41598-023-43498-9
13. Nabrdalik K, Hendel M, Irlik K, et al. Gastrointestinal adverse events of metformin treatment in patients with type 2 diabetes mellitus: a systematic review and meta-analysis with meta-regression of observational studies. BMC Endocr Disord. 2024;24(1):206. doi:10.1186/s12902-024-01727-w
14. Chinnaiyan SK, Karthikeyan D, Gadela VR. Development and characterization of metformin loaded pectin nanoparticles for T2 diabetes mellitus. Pharm Nanotechnol. 2018;6(4):253–263. doi:10.2174/2211738507666181221142406
15. Fang CL, Al-Suwayeh SA, Fang JY. Nanostructured lipid carriers (NLCs) for drug delivery and targeting. Recent Pat Nanotechnol. 2013;7(1):41–55. doi:10.2174/187221013804484827
16. Muchow M, Maincent P, Müller RH. Lipid nanoparticles with a solid matrix (SLN®, NLC®, LDC®) for oral drug delivery. Drug Dev Ind Pharm. 2008;34(12):1394–1405. doi:10.1080/03639040802130061
17. Shastri DH. Effective delivery routes and strategies for solid lipid nanoparticles (SLN) and nanostructured lipid carriers (NLC). Curr Pharm Des. 2017;23(43):6592–6601. doi:10.2174/1381612823666171122111132
18. Alatawi HM, Alhwiti SS, Alsharif KA, et al. Nanostructured Lipid Carriers (NLCs) as effective drug delivery systems: methods of preparation and their therapeutic applications. NANOTEC. 2024;18(2):179–189. doi:10.2174/1872210517666230120142439
19. Piazzini V, Micheli L, Luceri C, et al. Nanostructured lipid carriers for oral delivery of silymarin: improving its absorption and in vivo efficacy in type 2 diabetes and metabolic syndrome model. Int J Pharm. 2019;572:118838. doi:10.1016/j.ijpharm.2019.118838
20. Ilyas U, Asif M, Wang M, et al. Nanostructured lipid carrier-based delivery of pioglitazone for treatment of type 2 diabetes. Front Pharmacol. 2022;13.
21. Shete MB, Deshpande AS, Shende PK. Nanostructured lipid carrier-loaded metformin hydrochloride: design, optimization, characterization, assessment of cytotoxicity and ROS evaluation. Chem Phys Lipids. 2023;250:105256. doi:10.1016/j.chemphyslip.2022.105256
22. Ebrahimi H, Kazem Nezhad S, Farmoudeh A, et al. Design and optimization of metformin-loaded solid lipid nanoparticles for neuroprotective effects in a rat model of diffuse traumatic brain injury: a biochemical, behavioral, and histological study. Eur J Pharm Biopharm. 2022;181:122–135. doi:10.1016/j.ejpb.2022.10.018
23. Shina S. Three-level factorial design and analysis techniques. In: Industrial Design of Experiments. Springer International Publishing; 2022:187–215. doi:10.1007/978-3-030-86267-1_5
24. Berger PD, Maurer RE, Celli GB. Two-level factorial designs. In: Experimental Design. Springer International Publishing; 2018:295–342. doi:10.1007/978-3-319-64583-4_9
25. Patel D, Dasgupta S, Dey S, Roja Ramani Y, Ray S, Mazumder B. Nanostructured lipid carriers (NLC)-based gel for the topical delivery of aceclofenac: preparation, characterization, and in vivo evaluation. Sci Pharm. 2012;80(3):749–764. doi:10.3797/scipharm.1202-12
26. Cunha S, Costa CP, Loureiro JA, et al. Double optimization of rivastigmine-loaded nanostructured lipid carriers (NLC) for nose-to-brain delivery using the quality by design (QbD) approach: formulation variables and instrumental parameters. Pharmaceutics. 2020;12(7):599. doi:10.3390/pharmaceutics12070599
27. Swidan SA, Mansour ZN, Mourad ZA, et al. DOE, formulation, and optimization of repaglinide nanostructured lipid carriers. J Appl Pharm Sci. 2018;8(10):008–016.
28. Emad NA, Gupta P, Ahmad S, Sultana Y, Aqil M, Khan MA. Polyphenols-loaded beeswax-based lipid nanoconstructs for diabetic foot ulcer: optimization, characterization, in vitro and ex vivo evaluation. J Drug Delivery Sci Technol. 2023;88:104983. doi:10.1016/j.jddst.2023.104983
29. Qushawy M. Effect of the surfactant and liquid lipid type in the physico-chemical characteristics of Beeswax-based Nanostructured Lipid Carrier (NLC) of metformin. PNT. 2021;9(3):200–209. doi:10.2174/2211738509666210222143716
30. Jahan S, Aqil M, Ahad A, et al. Nanostructured lipid carrier for transdermal gliclazide delivery: development and optimization by Box-Behnken design. Inorg Nano-Metal Chem. 2022:1–14.
31. Kenechukwu FC, Nnamani DO, Momoh MA, Attama AA. Enhanced circulation longevity and pharmacodynamics of metformin from surface-modified nanostructured lipid carriers based on solidified reverse micellar solutions. Heliyon. 2022;8(3):e09100. doi:10.1016/j.heliyon.2022.e09100
32. Faul F, Erdfelder E, Buchner A, Lang AG. Statistical power analyses using G*Power 3.1: tests for correlation and regression analyses. Behav Res Methods. 2009;41(4):1149–1160. doi:10.3758/BRM.41.4.1149
33. Elsherbiny NM, Said E, Atef H, Zaitone SA. Renoprotective effect of calycosin in high fat diet-fed/STZ injected rats: effect on IL-33/ST2 signaling, oxidative stress and fibrosis suppression. Chem Biol Interact. 2020;315:108897. doi:10.1016/j.cbi.2019.108897
34. Qian C, Zhu C, Yu W, Jiang X, Zhang F. High-fat diet/low-dose streptozotocin-induced type 2 diabetes in rats impacts osteogenesis and Wnt signaling in bone marrow stromal cells. PLoS One. 2015;10(8):e0136390. doi:10.1371/journal.pone.0136390
35. Slaoui M, Fiette L. Histopathology procedures: from tissue sampling to histopathological evaluation. In: Gautier JC, editor. Drug Safety Evaluation. Vol 691. Methods in Molecular Biology. Humana Press; 2011:69–82. doi:10.1007/978-1-60761-849-2_4
36. Gao S, Gao T, Li L, et al. Exploring the therapeutic potential of garlic in alcoholic liver disease: a network pharmacology and experimental validation study. Genes Nutr. 2024;19(1):13. doi:10.1186/s12263-024-00748-3
37. Mokhtar HI, Khodeer DM, Alzahrani S, et al. Formulation and characterization of cholesterol-based nanoparticles of gabapentin protecting from retinal injury. Front Chem. 2024;12:1449380. doi:10.3389/fchem.2024.1449380
38. Qushawy M, Prabahar K, Abd-Alhaseeb M, Swidan S, Nasr A. Preparation and evaluation of carbamazepine solid lipid nanoparticle for alleviating seizure activity in pentylenetetrazole-kindled mice. Molecules. 2019;24(21):3971. doi:10.3390/molecules24213971
39. Apostolou M, Assi S, Fatokun AA, Khan I. The effects of solid and liquid lipids on the physicochemical properties of nanostructured lipid carriers. J Pharmaceut Sci. 2021;110(8):2859–2872. doi:10.1016/j.xphs.2021.04.012
40. Yeo S, Jung S, Kim H, Ahn JH, Hwang SJ. 4-Hexylresorcinol loaded solid lipid nanoparticles for enhancing anticancer activity. Pharmaceuticals. 2024;17(10):1296. doi:10.3390/ph17101296
41. Mura P, Maestrelli F, D’Ambrosio M, Luceri C, Cirri M. Evaluation and comparison of solid lipid nanoparticles (SLNs) and nanostructured lipid carriers (NLCs) as vectors to develop hydrochlorothiazide effective and safe pediatric oral liquid formulations. Pharmaceutics. 2021;13(4):437. doi:10.3390/pharmaceutics13040437
42. Houacine C, Adams D, Singh KK. Impact of liquid lipid on development and stability of trimyristin nanostructured lipid carriers for oral delivery of resveratrol. J Mol Liq. 2020;316:113734. doi:10.1016/j.molliq.2020.113734
43. Nagy MI, Darwish KM, Kishk SM, et al. Design, synthesis, anticancer activity, and solid lipid nanoparticle formulation of indole-and benzimidazole-based compounds as pro-apoptotic agents targeting bcl-2 protein. Pharmaceuticals. 2021;14(2):113. doi:10.3390/ph14020113
44. Safwat S, Ishak RAH, Hathout RM, Mortada ND. Nanostructured lipid carriers loaded with simvastatin: effect of PEG/glycerides on characterization, stability, cellular uptake efficiency and in vitro cytotoxicity. Drug Dev Ind Pharm. 2017;43(7):1112–1125. doi:10.1080/03639045.2017.1293681
45. Qushawy M, Soliman GM, Mortagi Y, El-Sherbiny M, Elsherbiny N. Development, optimization, and assessment of losartan nano-bilosomes to mitigate diabetes-induced microvascular complications in Sprague Dawley rats. J Drug Delivery Sci Technol. 2024;92:105295. doi:10.1016/j.jddst.2023.105295
46. Shi F, Wei Z, Zhao Y, Xu X. Nanostructured lipid carriers loaded with baicalin: an efficient carrier for enhanced antidiabetic effects. Pharmacogn Mag. 2016;12(47):198. doi:10.4103/0973-1296.186347
47. Rostamkalaei SS, Akbari J, Saeedi M, Morteza-Semnani K and Nokhodchi A. Topical gel of metformin solid lipid nanoparticles: a hopeful promise as a dermal delivery system. Colloids and Surfaces B: Biointerfaces. 2019;175. doi:10.1016/j.colsurfb.2018.11.072 150–157.
48. Khezri K, Saeedi M, Morteza-Semnani K, Akbari J, Rostamkalaei SS. An emerging technology in lipid research for targeting hydrophilic drugs to the skin in the treatment of hyperpigmentation disorders: kojic acid-solid lipid nanoparticles. Artif Cells Nanomed Biotechnol. 2020;48(1):841–853. doi:10.1080/21691401.2020.1770271
49. Ngwuluka NC, Kotak DJ, Devarajan PV. Design and characterization of metformin-loaded solid lipid nanoparticles for colon cancer. AAPS Pharm Sci Tech. 2017;18(2):358–368. doi:10.1208/s12249-016-0505-3
50. Ashames A, Ullah K, Al-Tabakha M, et al. Development, characterization and In-vitro evaluation of guar gum based new polymeric matrices for controlled delivery using metformin HCl as model drug. PLoS One. 2022;17(7):e0271623. doi:10.1371/journal.pone.0271623
51. Rarokar NR, Menghani SS, Kerzare DR, et al. Preparation of terbinafin-encapsulated solid lipid nanoparticles containing antifungal carbopol® hydrogel with improved efficacy: in vitro, ex vivo and in vivo study. Pharmaceutics. 2022;14(7):1393. doi:10.3390/pharmaceutics14071393
52. Kenechukwu FC, Nnamani DO, Duhu JC, et al. Potential enhancement of metformin hydrochloride in solidified reverse micellar solution-based PEGylated lipid nanoparticles targeting therapeutic efficacy in diabetes treatment. Heliyon. 2022;8(3):e09099. doi:10.1016/j.heliyon.2022.e09099
53. Maciejczyk M, Matczuk J, Żendzian-Piotrowska M, et al. Eight-week consumption of high-sucrose diet has a pro-oxidant effect and alters the function of the salivary glands of rats. Nutrients. 2018;10(10):1530. doi:10.3390/nu10101530
54. Zhang S, Li J, Nong X, et al. Artesunate combined with metformin ameliorate on diabetes-induced xerostomia by mitigating superior salivatory nucleus and salivary glands injury in type 2 diabetic rats via the PI3K/AKT pathway. Front Pharmacol. 2021;12:774674. doi:10.3389/fphar.2021.774674
55. Benjamin D, Colombi M, Hindupur SK, et al. Syrosingopine sensitizes cancer cells to killing by metformin. Sci Adv. 2016;2(12):e1601756. doi:10.1126/sciadv.1601756
56. Yasmin T, Rahman MM, Khan F, et al. Metformin treatment reverses high fat diet-induced non-alcoholic fatty liver diseases and dyslipidemia by stimulating multiple antioxidant and anti-inflammatory pathways. Biochem Biophys Rep. 2021;28:101168. doi:10.1016/j.bbrep.2021.101168
57. Momoh MA, Kenechukwu FC, Attama AA. Formulation and evaluation of novel solid lipid microparticles as a sustained release system for the delivery of metformin hydrochloride. Drug Delivery. 2013;20(3–4):102–111. doi:10.3109/10717544.2013.779329
58. ElMahdy MK, Helal MG, Ebrahim TM. Potential anti-inflammatory effect of dapagliflozin in HCHF diet-induced fatty liver degeneration through inhibition of TNF-α, IL-1β, and IL-18 in rat liver. Int Immunopharmacol. 2020;86:106730. doi:10.1016/j.intimp.2020.106730
59. Yanardag R, Ozsoy-Sacan O, Bolkent S, Orak H, Karabulut-Bulan O. Protective effects of metformin treatment on the liver injury of streptozotocin-diabetic rats. Hum Exp Toxicol. 2005;24(3):129–135. doi:10.1191/0960327104ht507oa
60. Ossai EC, Madueke AC, Amadi BE, et al. Potential enhancement of metformin hydrochloride in lipid vesicles targeting therapeutic efficacy in diabetic treatment. IJMS. 2021;22(6):2852. doi:10.3390/ijms22062852
61. Stott NL, Marino JS. High fat rodent models of type 2 diabetes: from rodent to human. Nutrients. 2020;12(12):3650. doi:10.3390/nu12123650
62. Ma X, Chen Z, Wang L, et al. The pathogenesis of diabetes mellitus by oxidative stress and inflammation: its inhibition by berberine. Front Pharmacol. 2018;9:782. doi:10.3389/fphar.2018.00782
63. Solinas G, Karin M. JNK1 and IKKβ: molecular links between obesity and metabolic dysfunction. FASEB j. 2010;24(8):2596–2611. doi:10.1096/fj.09-151340
64. Al-Mansoori L, Al-Jaber H, Prince MS, Elrayess MA. Role of inflammatory cytokines, growth factors and adipokines in adipogenesis and insulin resistance. Inflammation. 2022;45(1):31–44. doi:10.1007/s10753-021-01559-z
65. Mirea AM, Tack CJ, Chavakis T, Joosten LA, Toonen EJ. IL-1 family cytokine pathways underlying NAFLD: towards new treatment strategies. Trends Mol Med. 2018;24(5):458–471. doi:10.1016/j.molmed.2018.03.005
66. Kim S, Hwang J, Xuan J, Jung YH, Cha HS, Kim KH. Global metabolite profiling of synovial fluid for the specific diagnosis of rheumatoid arthritis from other inflammatory arthritis. PLoS One. 2014;9(6):e97501. doi:10.1371/journal.pone.0097501
67. Kołodziej U, Maciejczyk M, Miąsko A, et al. Oxidative modification in the salivary glands of high fat-diet induced insulin resistant rats. Front Physiol. 2017;8:20. doi:10.3389/fphys.2017.00020
68. Kim JW, Kim SM, Park JS, et al. Metformin improves salivary gland inflammation and hypofunction in murine Sjögren’s syndrome. Arthritis Res Ther. 2019;21(1):136. doi:10.1186/s13075-019-1904-0
69. Yasser S, Shon A. Histomorphometric and immunohistochemical study comparing the effect of diabetes mellitus on the acini of the sublingual and submandibular salivary glands of albino rats. Open Access Maced J Med Sci. 2020;8(A):49–54. doi:10.3889/oamjms.2020.3722
70. Matczuk J, Zalewska A, Łukaszuk B, et al. Insulin resistance and obesity affect lipid profile in the salivary glands. J Diabetes Res. 2016;2016:1–9. doi:10.1155/2016/8163474
71. Poljšak B, Fink R. The protective role of antioxidants in the defence against ROS/RNS-mediated environmental pollution. Oxid Med Cell Longev. 2014;2014:1–22. doi:10.1155/2014/671539
72. Farag DBE, Yousry C, Al-Mahallawi AM, El-Askary HI, Meselhy MR, AbuBakr N. The efficacy of Origanum majorana nanocubosomal systems in ameliorating submandibular salivary gland alterations in streptozotocin-induced diabetic rats. Drug Delivery. 2022;29(1):62–74. doi:10.1080/10717544.2021.2018522
73. Lupascu FG, Avram I, Confederat L, et al. Biological evaluation of chitosan-antidiabetic drug formulations for the treatment of diabetes mellitus. Farmacia. 2017;65(4):508–514.
74. Ersteniuk H, Kotyk T, Dey N, Yurakh O, Popadynets O. Effect of hyperglycemia on the excretory ducts of the submandibular gland (Histologic Study). Galician Med j. 2016;23(4):E201649. doi:10.21802/gmj.2016.4.9
75. Chen S, Wang Y, Zhang C, Yang Z. Decreased basal and stimulated salivary parameters by histopathological lesions and secretory dysfunction of parotid and submandibular glands in rats with type 2 diabetes. Exp Ther Med. 2020. doi:10.3892/etm.2020.8505
 © 2025 The Author(s). This work is published and licensed by Dove Medical Press Limited. The
full terms of this license are available at https://www.dovepress.com/terms.php
and incorporate the Creative Commons Attribution
- Non Commercial (unported, 3.0) License.
By accessing the work you hereby accept the Terms. Non-commercial uses of the work are permitted
without any further permission from Dove Medical Press Limited, provided the work is properly
attributed. For permission for commercial use of this work, please see paragraphs 4.2 and 5 of our Terms.
© 2025 The Author(s). This work is published and licensed by Dove Medical Press Limited. The
full terms of this license are available at https://www.dovepress.com/terms.php
and incorporate the Creative Commons Attribution
- Non Commercial (unported, 3.0) License.
By accessing the work you hereby accept the Terms. Non-commercial uses of the work are permitted
without any further permission from Dove Medical Press Limited, provided the work is properly
attributed. For permission for commercial use of this work, please see paragraphs 4.2 and 5 of our Terms.