")
Back to Journals » International Journal of Nanomedicine » Volume 20
PEG-Coated Ceria-Zirconia Nanoparticle Prevent Weight Gain and Obesity-Related Organ Damage Through Autophagy Flux Activation and ROS Scavenging
Authors Kim EK, Hong SE, Choi YS, Yu SL, Kang J , Park CG, Lee HY, Lee SK, Lee DC, Hwang WM, Yun SR, Park Y, Park MH, Lee J, Yoon KR, Lerman LO , Yoon SH
Received 21 December 2024
Accepted for publication 3 June 2025
Published 26 June 2025 Volume 2025:20 Pages 8305—8326
DOI https://doi.org/10.2147/IJN.S510541
Checked for plagiarism Yes
Review by Single anonymous peer review
Peer reviewer comments 2
Editor who approved publication: Professor Jie Huang
Eun Kyung Kim,1,* Sang-Eun Hong,2,* Yun Seok Choi,1 Seong-Lan Yu,3 Jaeku Kang,4 Chang Gyo Park,4 Hoi Young Lee,4 Sung-Ki Lee,3,5 Dong Chul Lee,6 Won-Min Hwang,1 Sung-Ro Yun,1 Yohan Park,1 Moon Hyang Park,7 Junguee Lee,7 Kuk Ro Yoon,2 Lilach O Lerman,8 Se-Hee Yoon1
1Division of Nephrology and Department of Internal Medicine, Myunggok Medical Research Institute, College of Medicine, Konyang University, Daejeon, Republic of Korea; 2Department of Chemistry, Hannam University, Daejeon, Republic of Korea; 3Myunggok Medical Research Institute, College of Medicine, Konyang University, Daejeon, Republic of Korea; 4Department of Pharmacology, College of Medicine, Konyang University, Daejeon, Republic of Korea; 5Department of Obstetrics and Gynecology, College of Medicine, Konyang University, Daejeon, Republic of Korea; 6Personalized Genomic Medicine Research Center, Korea Research Institute of Bioscience and Biotechnology (KRIBB), Daejeon, Republic of Korea; 7Department of Pathology, College of Medicine, Konyang University, Daejeon, Republic of Korea; 8Division of Nephrology and Hypertension, Mayo Clinic, Rochester, MN, 55905, USA
*These authors contributed equally to this work
Correspondence: Se-Hee Yoon, Division of Nephrology and Department of Internal Medicine, Myunggok Medical Research Institute, College of Medicine, Konyang University, 164 Gwanjeodong-ro, Seo-gu, Daejeon, 35365, Republic of Korea, Email [email protected]
Purpose: Obesity is becoming a global health problem that leads to serious complications. Despite numerous efforts to lose weight, achieving this goal is very difficult. Polyethylene glycol-coated ceria-zirconia nanoparticles (PEG-CZNPs) have attracted significant attention for their antioxidant properties, but they also have another valuable ability: restoring autophagy flux. In this study, we examined the therapeutic efficacy of PEG-CZNPs against obesity-induced organ complications and investigated the associated intracellular mechanisms.
Methods: Palmitate was used to establish a cellular model of obesity in HK-2 cells. An obesity mouse model was created by feeding a high-fat diet (HFD). PEG-CZNPs were successfully synthesized, and their physicochemical characteristics and antioxidant activity were confirmed. A concentration of 10 μg/mL PEG-CZNPs was used to treat HK-2 cells. For the in vivo experiment, PEG-CZNPs were administered intraperitoneally at a dose of 10 mg/kg (2 mL/kg), twice per week, with normal saline used as the vehicle control. Biochemical analysis, histological staining, and immunohistochemistry were performed on the liver, kidney and adipose tissue of the mice at 12 and 24 weeks after initiating the HFD.
Results: PEG-CZNPs successfully reduced lipid droplet accumulation palmitate-treated HK-2 cells by effectively restoring impaired autophagy flux. Reactive oxygen species (ROS), inflammation, and fibrotic changes caused by palmitate were also improved by PEG-CZNP treatment. In HFD-fed mice, PEG-CZNPs significantly reduced total body weight and the weights of the liver, kidney, and adipose tissue. They notably improved glucose tolerance and serum cholesterol levels while reducing tissue lipid accumulation. Additionally, PEG-CZNP treatment alleviated inflammatory cell infiltrations and fibrotic changes in the liver, kidney, and adipose tissue of HFD-fed mice. Autophagy flux was significantly enhanced, and ROS levels decreased in the tissue following PEG-CZNP treatment.
Conclusion: PEG-CZNPs alleviated obesity-induced organ damage by decreasing intracellular lipid accumulation through the restoration of autophagy flux and ROS-scavenging activity.
Keywords: polyethylene glycol-coated ceria-zirconia nanoparticles, autophagy flux, obesity, lipid
Introduction
The global prevalence of obesity has risen dramatically in recent decades, reaching pandemic proportions.1,2 Currently, over one-third of adults worldwide are classified as overweight or obese. A sedentary lifestyle, reduced physical activity, and the consumption of unhealthy diets (eg, a high sugar and refined carbohydrate diet), combined with genetic, endocrine, metabolic, and environmental factors, are the primary causes of obesity.3 When energy intake exceeds expenditure, it triggers metabolic stress by increasing inflammatory responses and elevating levels of fatty acids, triglycerides (TG), and low dense lipid (LDL) cholesterol, leading to a cascade of complications, such as nonalcoholic fatty liver disease (NAFLD), cardiovascular disease,1,4 diabetes mellitus,4 chronic kidney disease (CKD),4 among others.5–8 These complications collectively reduce quality of life, increase healthcare costs,9 and contribute to elevate morbidity and mortality.10
Despite the many efforts to overcome obesity, such as lifestyle modifications, pharmacotherapy, surgical interventions and palliative care, achieving and maintaining weight loss remains challenging. Although anti-obesity drugs have been developed, these treatments have not yet achieved complete success.11
While the precise mechanisms are not fully understood, obesity often prompts various pathological signals, such as oxidative stress, inflammation, apoptosis, lipotoxicity, increased sympathetic overflow of catecholamines, and altered autophagy.12 Autophagy plays a crucial role in maintaining cellular homeostasis. Under nutrient-rich conditions, the autophagy process is typically reduced by the inhibition of the mammalian target of rapamycin (mTOR) and AMP-activated protein kinase (AMPK) pathways.13 Impaired autophagy flux is thought to be a key pathological mechanism in obesity-induced metabolic disorders, including insulin resistance, diabetes mellitus, and atherosclerosis.14 Consequently, restoring autophagy flux may help mitigate organ damage resulting from obesity-induced metabolic disorders.
Several nanoparticles (NPs) are known to influence autophagy processes.15–18 However, few studies have investigated the role in obesity-induced complications. Ceria nanoparticles (CNPs) have attracted attention for their antioxidant properties and potential as therapeutic agents.19,20 Notably, ultrasmall CNPs (2–3nm) can cycle between Ce3+ and Ce4+ oxidation states. In the presence of ROS, Ce3+ oxidizes to Ce4+, reducing ROS.21,22
The incorporation of zirconia contributes to the prolonged stabilization of cerium in the Ce³+ state by enhancing thermal stability, promoting oxygen vacancy formation, and improving redox cycling. Zr4+ doping increases the specific surface area and structural stability of CeO2, thereby maintaining the Ce³+/Ce4+ balance under catalytic conditions (Figure S1). 21,23 Additionally, capping ceria-zirconia nanoparticles (CZNPs) with polyethylene glycol (PEG) improves their water dispersibility and stability.21,24 Beyond their antioxidants function, CNPs have also been shown to restore autophagy flux.25 When zirconia incorporation and PEG capping are combined, PEG-CZNPs are expected to exhibit a synergistic effect by functioning as both autophagy flux restorers and ROS scavengers.26–28 However, their efficacy in obesity-related conditions has not been fully explored. In this study, we examined the therapeutic potency of PEG-CZNPs as ROS scavengers and autophagy flux restorers in obesity-induced organ complications using both in vivo and in vitro models, exploring their intracellular mechanisms.
Materials and Methods
Materials
Cerium (III) acetylacetonate hydrate, zirconium (IV) acetylacetonate hydrate, oleylamine (technical grade, 70%), N-acetyl-L-cysteine (A7250), Oil Red O (ORO) solution (O1391), sodium palmitate (P9767), and anti-light chain 3B (LC3B) were purchased from Sigma Aldrich (St. Louis, MO, USA). 1,2-Distearoyl-sn-glycero-3-phosphoethanolamine-N--[methoxy(polyethylene glycol)-2000] (ammonium salt) (18:0 PEG2000) containing chloroform was purchased from Avanti® Polar Lipids, Inc. (Alabaster, AL, USA). Acetone (99.5%, extra pure) and chloroform (99.5%, extra pure) were obtained from SAMCHUN PURE CHEMICALS (Seoul, Korea). Deionized water (DW) was produced via HIQ-II® (CORETECH, Gimpo, Korea). Antibody against β-actin was purchased from Santa Cruz Biotechnology (Santa Cruz, CA, USA). Anti-p62 was purchased from Abcam (Cambridge, UK). Antibody against Transcription factor E binding protein (TFEB) was provided by Proteintech (Rosemont, IL, USA). Antibodies against phospho-extracellular signal-regulated kinase (p-ERK) (Tyr204), and c-Jun N-terminal kinase (JNK) were purchased from Santa Cruz Biotechnology (Santa Cruz, CA, USA). Anti- Histone deacetylase (HDAC)1, anti-ERK, anti-phospho-p38 (Thr180/Tyr182), and anti-phospho-JNK (Thr183/Tyr185) antibodies were obtained from Cell Signaling Technology (Beverly, MA, USA).
Synthesis of PEG-CZNPs
The PEG-CZNPs were synthesized following a previous report.26–28 Briefly, 50 mg of CZNP powder was mild stirred with 4 mL of 18:0 PEG 2000 PE (containing chloroform)29,30 at room temperature for overnight. The majority of the chloroform was then removed in a rotary evaporator and the sample was incubated at 80 °C for 2 h in a vacuum oven to ensure complete removal of this solvent. Next, 5 mL of deionized water was added to the sample to obtain a transparent colloidal suspension. After filtration using a 0.4 μM filter, the excess 18:0 PEG 2000 PE was removed by ultracentrifugation at 3000 rpm, 15 min. The purified phospholipid-PEG-capped sample was finally well dispersed in DW. The PEG-CZNPs were characterized via in situ transmission electron microscopy (in situ TEM, JEM-3011; JEOL Ltd., Japan) voltage condition of 300 kV, high-voltage electron microscopy (Bio-HVEM, JEM ARM 1300S; JEOL Ltd., Tokyo, Japan) theta value was 20~80 degree, high-resolution powder X-ray diffraction (XRD, SmartLab; RIGAKU, Japan), high-resolution Raman/PL spectroscopy (Ramam, LabRAM HR Evolution Visible_NIR; HORIBA; Japan), fourier transform infrared spectroscope (FTIR, Nicolet iS10, Thermo Fischer Scientific) wavenumbers range was 3500 cm−1 ~ 500 cm−1, dynamic light scattering with zeta potential measurements (DLS, Zetasizer Nano-ZS system; Malvern Instruments Ltd., Malvern, UK), and energy-dispersive X-ray spectroscopy (EDS; Oxford Instruments, Oxfordshire, UK) and In-situ X-ray photoelectron spectroscopy (XPS, Axis-Supra; Kratos). The antioxidant capacity was measured using 1,1-Diphenyl-2-picrylhydrazyl (DPPH) assay(26). The process of DPPH assay is briefly shown in supplementary methods.
Cell Culture
The renal proximal tubule epithelial cell line HK-2 from the human kidney was acquired from the Korean Cell Line Bank (KCLB, Seoul, Korea) and cultured in RPMI-1640 medium enriched with 10% (v/v) fetal bovine serum (FBS; GIBCO, Walthan, MA, USA) and 1% (v/v) penicillin‒streptomycin (100 U/mL penicillin and 100 μg/mL streptomycin, Hyclone, Logan, UT, USA). The cells were incubated in a humidified incubator with 5% CO2 at 37°C.
Preparation of Palmitate Solution
The palmitate was completely dissolved in sterile phosphate-buffered saline (PBS) to a concentration of 10 mm by heating to 70°C. The palmitate stock solution was then complexed with a 1.7% fatty acid-free bovine serum albumin (BSA, Sigma Aldrich) solution in RPMI 1640 medium to achieve a final palmitate concentration of 0.3 mM. The control vehicle was prepared with a 1.7% fatty acid-free BSA solution, with an equivalent volume of PBS added to match the final palmitate stock solution. The BSA-bound palmitate and control vehicle solutions were filtered through a sterile 0.22 µm syringe filter before the cells were treated. HK-2 cells were treated with 0.3 mM palmitate for 24 hours, with or without PEG-CZNPs.
Cell Exposure to PEG-CZNPs
A concentration of 10 μg/mL PEG-CZNPs was chosen for the treatment of HK-2 cells, as this concentration was determined to be nontoxic on the basis of the 3-(4,5-dimethylthiazole-2-yl)-2,5-diphenyltetrazolium bromide (MTT) assay, as described in previous studies.26,28 The process of MTT assay is briefly shown in supplementary methods.
Quantitative Real-Time Reverse Transcription Polymerase Chain Reaction (qRT‒PCR)
Total RNA was isolated from HK-2 cells and mouse tissues with TRIzol reagent (Invitrogen, Carlsbad, CA, USA) following the manufacturer’s protocol. The isolated RNA (1 μg) was reverse-transcribed to obtain cDNA via oligo-d(T) primers, a dNTP mixture, and M-MLV reverse transcriptase (Promega, Madison, WI, USA) in a Bio-Rad system. Real-time PCR analysis was conducted with a Bio-Rad CFX96 system using iQ SYBR Green Supermix (Bio-Rad, Hercules, CA, USA). Each mRNA level was normalized to that of glyceraldehyde-3-phosphate dehydrogenase (GAPDH). The primer sets were used for qPCR analysis of the indicated genes is shown in Additional file: supplementary methods. The data were normalized to the level of GAPDH as an internal control. Relative expression levels were determined via the 2−(ΔΔCt) method.
Preparation of Nuclear Extracts and Immunoblot Assay
HK-2 cells were seeded in 6-well plates at 5×10⁵ cells/well. After 24 hours of cell attachment in culture, the cells were exposed to palmitate or PEG-CZNPs for an additional 24 hours. The cells were then rinsed with ice-cold PBS. The preparation of the nuclear extract was conducted via a subcellular protein fractionation kit for cultured cells (Thermo Fisher Scientific, Waltham, MA, USA) in accordance with the instructions provided by the manufacturer. Briefly, the cells were harvested with trypsin-ethylenediaminetetraacetic acid (EDTA) and then subjected to centrifugation at 500 × g for 3 min. The resulting cell pellets in ice-cold cytoplasmic extraction buffer (CEB) containing protease inhibitors were incubated on ice for 10 minutes. The cytoplasmic extract was subsequently collected after centrifugation at 1000 × g for 5 minutes at 4°C. The pellets were then resuspended in nuclear extraction buffer (NEB) and incubated at 4°C for 30 minutes, followed by centrifugation at 5,000 × g for 5 minutes to obtain the supernatant containing the nuclear fractions. To obtain whole-cell lysates, HK-2 cells were lysed in radioimmunoprecipitation assay (RIPA) buffer. Immunoblot analyses were performed according to previously published methods.27 The process of immunoblot analysis is briefly shown in supplementary methods.
Measurement of Intracellular ROS in HK-2 Cells
The level of intracellular ROS production was determined via the use of 2′,7′- dichlorodihydrofluorescein diacetate (DCF-DA; Sigma–Aldrich), a nonfluorescent, cell-permeable probe that is cleaved by an intracellular esterase and becomes highly fluorescent 2′,7′-dichlorofluorescein upon oxidation. HK-2 cells were exposed to 10 μM DCF-DA for 3 hours at 37°C. The cells were examined via confocal fluorescence microscopy (LSM710; Carl Zeiss, Jena, Germany). The quantification of image was done using ImageJ. The fluorescence intensity for DCF-DA was measured via a microplate reader (Synergy HTX, BioTek Instruments, Winooski, VT, USA) at excitation and emission wavelengths of 485 nm and 525 nm, respectively.
Immunofluorescence Assay (IFA)
For IFA analysis, HK-2 cells were initially cultured on coverslips at a density of 2×10⁵ cells/well in 12-well plates. After 24 hours of culture for cell attachment, the cells were incubated with palmitate or PEG-CZNPs for 24 hours. The cells were then washed with PBS, fixed in 4% paraformaldehyde for 15 minutes, and permeabilized with 0.25% Triton X-100 for 10 minutes at room temperature. After a 1-hour block of nonspecific binding sites with 1% bovine serum albumin, the cells were incubated overnight at 4°C with primary antibodies diluted in 1% BSA. Cy2-conjugated secondary antibodies (Jackson ImmunoResearch Laboratories, West Grove, PA, USA) were then applied for 1 hour at room temperature. The cell nuclei were stained with 4′,6-diamidino-2-phenylindole (DAPI; Molecular Probes, Carlsbad, CA, USA) for 10 minutes. The stained slides were subsequently assembled via anti-fade fluorescence mounting medium (DAKO, Santa Clara, CA, USA). Images were captured via confocal microscopy (LSM710; Carl Zeiss, Jena, Germany) and analyzed with ImageJ software. The primary antibodies used were against the following antigen: LC3B (L7543, 1:100, Sigma Aldrich).
ORO Staining and Quantification of Cells
HK-2 cells were seeded at a density of 1×10⁵ cells/well in 24-well plates. After 24 hours in culture for cell attachment, the cells were incubated with palmitate or PEG-CZNPs for an additional 24 hours. The cells were then washed three times with PBS and fixed with 4% paraformaldehyde for 30 minutes at room temperature. The fixed cells were washed with deionized distilled water and then stained for 90 minutes at room temperature with a mixture of three volumes of 0.5% ORO solution in 2-propanol and two volumes of deionized water. Images were obtained via an inverted phase-contrast microscope (CKX53, Olympus, Tokyo, Japan). After the samples were washed and dried completely, 300 μL of isopropanol extraction solution was added to each staining well, and the absorbance was measured at 490 nm via a spectrophotometer (Synergy HTX; BioTek Instruments Inc., Winooski, VT, USA). All tests were performed in triplicate.
Animal Models and Experiments
All animal procedures adhered to the regulations set by the Institutional Animal Care and Use Committee (IACUC) of Konyang University and received approval (P-23-26-A-01). Male C57BL/6J mice at 5 weeks of age were obtained from Raon Bio (Yongin, Korea) and acclimatized for one week in a specific pathogen-free animal facility with a 12-hour light/dark cycle at 22°C, with access to water and food ad libitum. After a one-week acclimation period, the 6-week-old C57BL/6 mice were randomized into four groups, placed into separate cages, and given the following treatments. For the obesity model, the mice were fed a HFD (D12492; Research Diets Inc., New Brunswick, NJ, USA) consisting of 60% kcal fat, as described in previously published reports.31,32 The composition of the diets is shown in Table S1. The control group was maintained on a standard chow diet (EEGJ30060; Cargill Agri Purina, Seongnam, Korea), which contained 4.5% fat, 20% protein, 6% fiber, and 14% moisture. The experimental mice were fed their respective diets concurrently with the administration of PEG-CZNP. The dosage and timing of PEG-CZNP injections followed our previous experimental protocol.26–28 The Group 1 (control, normal saline treatment; n = 6 at 12 and 24 weeks), Group 2 (PEG-CZNP injection; n = 6 at 12 and 24 weeks), Group 3 (HFD with normal saline injection; n = 6 at 12 and 24 weeks), and Group 4 (HFD with PEG-CZNP injection; n = 6 at 12 and 24 weeks) were used in the present study. Groups 1 and 3 received 2 mL/kg of intraperitoneal normal saline twice per week starting at 6 weeks of age, whereas Groups 2 and 4 were administered 10 mg/kg (2 mL/kg) of PEG-CZNPs instead of normal saline (Scheme 1).
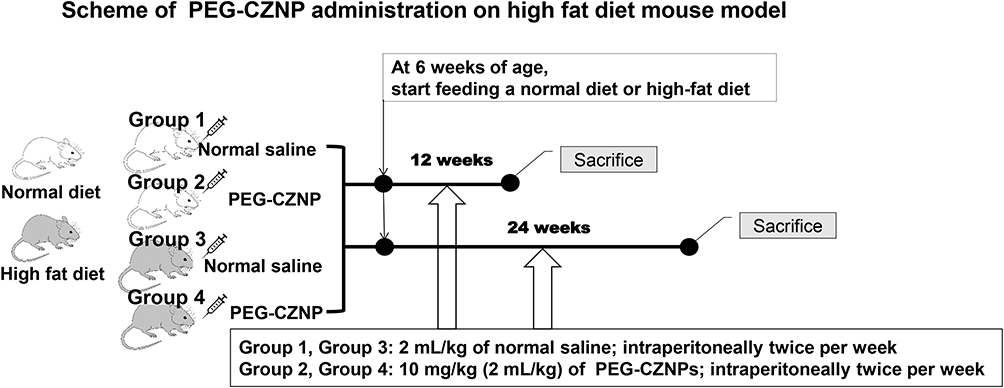 |
Scheme 1 Schema of PEG-CZNP treatments in the HFD mouse model. The HFD was initiated at 6 weeks of age. PEG-CZNPs (10 mg/kg) or normal saline (2 mL/kg) were administered intraperitoneally twice per week for 12 and 24 weeks. |
Body and Tissue Weight Measurements
The body weights and diet intakes of the mice were recorded weekly during the experimental period. Following the sacrifice of the mice, major organs were harvested, and their weights were measured. Five adipose tissues were analyzed: epididymal, inguinal, axillary, perirenal and brown adipose tissues.
Histological Observation of Liver, Adipose and Kidney Tissues
Tissues were collected and fixed in 10% formalin, embedded in paraffin, and then dehydrated in graded alcohol solutions. Sections of 4 µm thickness were prepared and stained with hematoxylin‒eosin (H&E) and Masson’s Trichrome stain (MT). Periodic acid-Schiff (PAS) staining was applied specifically to kidney tissues. The samples were observed under a light microscope. For ORO staining, the tissues were embedded in optimal cutting temperature compound. Frozen liver sections were dried at room temperature for 5 minutes, washed in 100% propylene glycol for 5 minutes, and then treated with immerse gum sucrose for 20 minutes. The slides were submerged in ORO for 7 minutes in a 60°C oven to stain the tissue and then treated 3 times with 85% propylene glycol and 20 times with distilled water. Next, the slides were stained for 2 minutes in hematoxylin, washed with running water for 5 minutes, and covered with a coverslip containing glycerin. The slides were observed under a light microscope.
Adipocyte Tissue Analysis
Adipocyte cell size was measured using ImageJ on H&E-stained adipose tissue sections.33 Briefly, individual adipocytes were outlined for area measurement. Cell size was calculated as the average area of the adipocytes in multiple randomly selected fields. Crown-like structure (CLS), whitening (the reduction of its characteristic multilocular appearance) and necrotic areas of adipose tissues in H&E-stained tissue sections as an indicative of inflammation and metabolic dysfunctions were manually identified and scored.34–36 The process of analysis is briefly shown in supplementary methods.
Immunohistochemistry
Formalin-fixed paraffin-embedded tissue sections were deparaffinized and rehydrated with xylene and ethanol. For the antigen retrieval process, tissue sections were heated in 10 mm sodium citrate buffer in a microwave oven. The tissue sections were subsequently washed with PBS-T, followed by incubation in 0.3% hydrogen peroxide blocking solution (ab64218, Abcam, Cambridge, UK) for 30 minutes to eliminate endogenous peroxidase activity. Nonspecific background samples were blocked with 5% normal goat serum for 60 minutes at room temperature. The sections were incubated with an anti-8-hydroxy-2′-deoxyguanosine (8-OHdG) monoclonal antibody (1 μg/mL, MOG-020P, JaICA, Japan, diluted in 2% NGS) overnight at 4°C in a humidified chamber. After washing three times in PBS-T, horseradish peroxidase (HRP)-conjugated goat anti-mouse secondary antibodies diluted in 2% NGS were applied for 90 minutes at room temperature. The HRP immunocomplexes were visualized via a 3,3′-diaminobenzidine (DAB) substrate kit (34002, Thermo Fisher Scientific), which facilitates chromogenic visualization of HRP activity through the action of DAB in tissue staining. The sections were subsequently counterstained with hematoxylin and cover slipped with mounting medium (DAKO). The slides were visualized with a light microscope at 200x magnification.
Immunofluorescence Analysis of Mouse Tissue
Sections of formalin-fixed, paraffin-embedded mouse kidney tissue were dewaxed in xylene and rehydrated in ethanol. The slides were rinsed with PBS and permeabilized with 0.3% Triton X-100 for 30 minutes. The tissue slides were subsequently placed in 5% normal goat serum for 60 minutes at room temperature to block nonspecific background staining. After washing once with PBS, the slides were incubated with primary antibodies in a humidified chamber overnight at 4°C. Cy2- or Cy3-conjugated anti-rabbit secondary antibodies (Jackson ImmunoResearch Laboratories, Cy2: 115–225-003; Cy3: 115–165-003; 1:200 dilution) in 2% normal goat serum were applied for 90 minutes at room temperature. The nuclei were counterstained with DAPI for 10 minutes, after which the stained slides were mounted in fluorescence mounting medium (DAKO). Images were obtained via a confocal microscope (LSM710; Carl Zeiss, Jena, Germany) and analyzed via ImageJ software. Immunofluorescence analyses of mouse tissue were performed using primary antibodies against LC3B (L7543, 1:100; Sigma Aldrich) and TFEB (13372-1-AP, 1:50, ProteinTech, Rosemont, IL, USA).
Glucose Tolerance Test and Biochemical Measurement
The intraperitoneal glucose tolerance test (IPGTT) was performed at 12 weeks after the initiation of the experiment according to a previously reported method.36 For the GTT, the mice were placed in cages with fresh bedding and had free access to water. After fasting for 12 hours, glucose (1 g/kg) was administered intraperitoneally. Blood glucose levels were measured via an Accu-Chek Performa (Roche Diagnostics GmbH, Mannheim, Germany) at 0, 15, 30, 60, 90, 120, 150, and 180 minutes after glucose injection. The area under the curve (AUC) of the IPGTT was calculated via GraphPad Prism.
At the end of the study, all the animals were fasted overnight. To measure blood parameters, blood samples were obtained from the retro-orbital plexus and incubated at room temperature for 1 hour. The serum was separated by centrifugation at 4°C for 15 minutes at 5000 rpm. Plasma levels of glucose, alanine aminotransferase (ALT), creatinine, total cholesterol, and LDL were measured via a dry chemistry analyzer (Fuji Dri-Chem 3500, Fujifilm, Tokyo, Japan) according to the manufacturer’s instructions.
Statistical Analysis
All data presented in the graph are presented as the means ± standard deviations, and statistical analysis was performed via Student’s t test. P values of < 0.05 were considered significant.
Results
Characteristics of the PEG-CZNPs
We successfully synthesized CZNPs with a uniform size of approximately 2–3 nm. These nanoparticles exhibited excellent dispersion stability, as confirmed by HR-TEM (Figure 1A). DLS analysis revealed hydrodynamic diameters of 7.09 nm for CZNPs and 11.95 nm for PEG-CZNPs (Figure 1B). EDS revealed an atomic composition of 72.3% Ce and 27.7% Zr (Figure 1C). Zeta potential measurements revealed surface charges of −1.36 mV for CZNPs and −33.92 mV for PEG-CZNPs (Figure 1D). The Raman spectra show the crystallinity and structural properties of the CZNPs compared with those of the CNPs. Compared with that of the CNPs, the Ce-O symmetric stretching mode of the CZNPs shifted from 457 cm-1 to 453 cm-1, with a broad shoulder at 642 cm-1 and significantly reduced intensity. These changes indicate structural modifications due to zirconium incorporation and the stabilization of CZNPs in a single-phase fluorite structure without a tetragonal zirconia phase (Figure 1E). Fourier transform infrared (FTIR) analysis confirmed the characteristic peaks of the PEG-CZNPs, which were similar to those of the 18:0 PEG2000 and bare CZNP reagents. The spectra displayed distinct C-H stretching peaks, as well as overlapping signals for amide bending (1,644 cm-1), carbonyl stretching (C=O, 1,741 cm-1), and C-O-C stretching (1,110 cm-1). These overlaps suggest interactions between the PEG chains and phosphate groups, indicating successful PEGylation of the CZNPs (Figure 1F). XRD patterns of the CZNPs and CNPs. The CNPs presented characteristic peaks corresponding to the cubic fluorite structure of CeO2. The absence of additional diffraction peaks confirmed the successful incorporation of Zr4+ into the CeO2 lattice, indicating the formation of a solid solution (Figure 1G). The chemical and elemental states of the CZNPs were analyzed via X-ray photoelectron spectroscopy (XPS). The Ce 3d spectrum revealed several peaks related to spin-orbit splitting, indicating the presence of both Ce3+ and Ce4+ oxidation states in CeO2. The predominant peak corresponds to Ce4+, suggesting that the main valence state of cerium in the sample is +4, whereas additional peaks indicate the presence of Ce3+ (Figure 1H). Furthermore, compared with N-acetyl-L-cysteine (NAC), PEG-CZNPs effectively scavenged free radicals in a dose-dependent manner in a DPPH assay (Figure 1I).
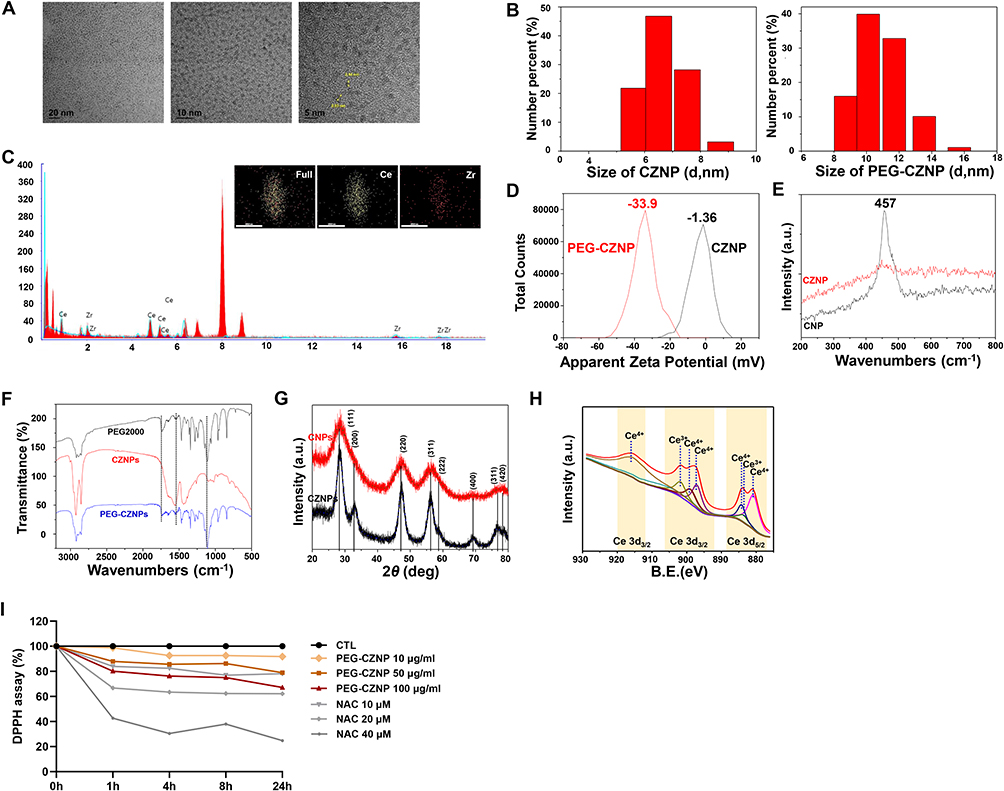 |
Figure 1 Characterization of the CZNPs and PEG-CZNPs. (A) HR-TEM images of the CZNPs (B) Hydrodynamic diameters of the CZNPs and PEG-CZNPs in chloroform and water measured by DLS (C) EDS spectrum confirming atomic compositions; 72.3 at% Ce and 27.7 at% Zr (D) Zeta potential analysis of CZNPs and PEG-CZNPs showing values of −1.36 mV and −33.9 mV, respectively (E) Raman spectra of the CZNP compared with those of the CNP (F) FT-IR spectra of the CZNPs and PEG-CZNPs compared with the PEG (G) XRD data of CZNPs compared with CNP (H) XPS data showing the Ce 3d states in the CZNP (I) DPPH data analyzing the antioxidant effects of PEG-CZNPs at a concentration of 10 μg/mL over 1, 4, 8 and 24 hours. |
PEG-CZNPs Decrease Intracellular Lipid Accumulation in a Palmitate-Induced Obesity Model in HK-2 Cells
We examined intracellular lipid accumulation in HK-2 cells after palmitate exposure, with and without PEG-CZNP treatment. Significant lipid accumulation was observed in HK-2 cells treated with 300 μM palmitate, as shown by ORO staining. Notably, PEG-CZNP treatment markedly reduced intracellular lipid accumulation (Figure 2A). To confirm these findings, we analyzed the expression of sterol regulatory element-binding factor 1 (SREBF1) and diacylglycerol O-acyltransferases 1 (DGAT1) genes via PCR, which are markers for de novo lipogenesis and glycerolipid biosynthesis. Expression levels of both markers significantly decreased after PEG-CZNP treatment (Figure 2B).
 |
Figure 2 Effects of PEG-CZNPs on lipid accumulation in palmitate-treated HK-2 cells. (A) Representative ORO staining microscopy images of control and palmitate-treated HK-2 cells, with or without exposure to PEG-CZNPs. Fluorescence intensities were quantified using ImageJ software. (B) Quantitative real-time RT‒PCR analysis of SREBF1 and DGAT1 expression in control and palmitate-treated HK-2 cells with or without PEG-CZNPs. Data were analyzed via Student’s t test and are presented as the means ± standard deviations (SDs). *p<0.05 and **p<0.01 ***p<0.001 versus the control; #p<0.05 and ##p<0.01 versus palmitate alone. |
PEG-CZNPs Enhance Autophagy Flux in a Palmitate-Induced Obesity Model of HK-2 Cells by Promoting TFEB Nuclear Translocation
We examined the autophagy response in HK-2 cells after palmitate treatment and subsequent exposure to PEG-CZNPs. To assess autophagy flux, we used chloroquine (CQ), an autophagy inhibitor that disrupts the fusion of autophagosome fusion with lysosomes, Analyses were conducted using PCR, immunoblotting, and IFA. The p62 protein level increased following palmitate exposure but decreased after PEG-CZNP treatment. When CQ was added, p62 levels further increased following PEG-CZNP treatment in the palmitate-exposed HK-2 cells. IF analysis revealed that LC3B puncta, indicative of autophagosome accumulation, significantly increased with CQ administration after PEG-CZNP treatment in palmitate-treated cells. These findings suggest that PEG-CZNPs restore impaired autophagy flux in palmitate-induced cellular models of obesity (Figure 3A and B). To investigate the mechanism by which PEG-CZNPs affect intracellular autophagy, we evaluated the nuclear translocation of TFEB through immunoblotting. Nuclear TFEB protein levels significantly decreased after palmitate exposure but were restored with PEG-CZNP treatment (Figure 3C).
 |
Figure 3 Effects of PEG-CZNPs on autophagy in palmitate-treated HK-2 cells. (A) Representative immunoblot analysis and quantification of p62 levels in HK-2 cells with or without PEG-CZNPs and CQ treatment. (B) Representative confocal immunofluorescence microscopy images of LC3 (green) with DAPI counterstaining (blue) in HK-2 cells, with or without PEG-CZNPs and CQ. Fluorescence intensities were quantified via ImageJ software. (C) Representative immunoblot analysis of nuclear TFEB with or without PEG-CZNPs. Data were analyzed via Student’s t test and are presented as the means ± SDs. **p<0.01 and ***p<0.001 compared to the group without CQ treatment in each experimental condition. |
PEG-CZNPs Alleviate the Levels of ROS, Inflammation and Fibrosis in a Palmitate-Induced Obesity Model in HK-2 Cells
We assessed ROS levels in HK-2 cells following palmitate treatment, with or without PEG-CZNP, using DCF-DA fluorescence measurement by microplate reader and staining analyzed with confocal microscopy. Palmitate treatment led to a notable increase in DCF-DA fluorescence, which was significantly reduced by PEG-CZNP treatment (Figure 4A). Staining with DCF-DA confirmed these results with confocal microscopy (Figure 4B).
 |
Figure 4 Effect of PGE-CZNPs on ROS, inflammation and fibrosis in palmitate-treated HK-2 cells. (A) Fluorescence levels of DCF-DA measured by microplate reader. (B) Representative confocal immunofluorescence microscopy images of DCF-DA (green). (C) Quantitative real-time RT‒PCR analysis of IL-6, IL-8 and TNFα expression levels. (D) Immunoblot analysis of the MAPK pathway. (E) MTT assay to assess the survival of palmitate-treated HK-2 cells with or without PEG-CZNPs. (F) qRT‒PCR analysis of TGFβ1 and ColIV expression. *p<0.05, **p<0.01 and ***p<0.001 versus the control; #p<0.05 and ###p<0.001 versus palmitate alone. |
The impact of PEG-CZNPs on palmitate-induced inflammation was assessed by measuring the expression of the inflammatory cytokines, including interleukin-6 (IL-6), IL-8, and tumor necrosis factor α (TNFα) via qRT‒PCR. The gene expression levels of these cytokines increased after palmitate exposure and significantly decreased after PEG-CZNP treatment (Figure 4C). To further elucidate the signaling mechanisms underlying palmitate-induced inflammation, we examined the stress-responsive mitogen-activated protein kinase (MAPK) pathway. Palmitate exposure increased the phosphorylation of p38 and JNK, and these effects were blocked by PEG-CZNP administration (Figure 4D). Additionally, PEG-CZNPs significantly improved the survival of palmitate-treated cells, as measured by the MTT assay (Figure 4E).
We investigated the effect of the PEG-CZNPs on fibrosis markers using RT‒PCR. The expression of fibrosis markers, such as transforming growth factor β1 (TGFβ1) and collagen type IV (ColIV), was significantly increased in the palmitate-treated HK2 cells but decreased after PEG-CZNP exposure (Figure 4F).
PEG-CZNPs Reduce Body Weight Along with the Weights of the Liver, Kidney, and Adipose Tissue in Mice Fed a HFD
HFD-fed mice showed a significant increase in body weight over time. However, PEG-CZNP treatment significantly reduced the body weight of these mice. Moreover, the liver, kidney and adipose tissue weights were notably decreased with PEG-CZNP treatment at 12 and 24 weeks (Figure 5). The weights of various WAT and BAT depots were also measured. Weight gain in perirenal, inguinal, axillary WATs, as well as in BAT was significantly reduced with PEG-CZNPs treatment at both 12 and 24 weeks post-HFD (Figure S2).
 |
Figure 5 Effect of PEG-CZNPs on weight gain in HFD-fed mice. (A) Total body weight changes over time with or without PEG-CZNPs. (B–D) Changes in adipose tissue, liver, and kidney weights at 12 weeks and 24 weeks after the start of HFD. Group 1: normal diet + normal saline injection; Group 2: normal diet + PEG-CZNP injection; Group 3: HFD + normal saline injection; and Group 4: HFD + PEG-CZNP injection. Data are presented as the means ± SDs; *p<0.05, **p<0.01 and ***p<0.001 versus Group 1; #p<0.05 and ##p<0.01 versus Group 3. |
PEG-CZNPs Improve Glucose Intolerance, Hepatic Enzyme Elevation, and Dyslipidemia
A IPGTT was performed by injecting regular insulin into the peritoneum of the mice. The plasma glucose concentration and the AUC were significantly elevated in the HFD-fed mice (Group 3), indicating glucose intolerance, which was significantly ameliorated by PEG-CZNP treatment. Plasma levels of fasting serum glucose, total cholesterol, and LDL were significantly higher in Group 3 but markedly improved after PEG-CZNP treatment. ALT levels were also elevated in Group 3 compared to Group 1, suggesting impaired liver function in HFD-fed mice, but PEG-CZNPs treatment successfully lowered ALT levels. Blood creatinine levels remained unchanged among all the study groups (Figure 6, Figure S3).
 |
Figure 6 Effects of PEG-CZNPs on biochemical parameters in HFD-fed mice. (A and B) Blood glucose levels during IPGTT and corresponding area under curve (AUC). (C‒F) Blood levels of fasting glucose, total cholesterol, ALT and creatinine. Group 1: normal diet + normal saline injection; Group 2: normal diet + PEG-CZNP injection; Group 3: HFD + normal saline injection; and Group 4: HFD + PEG-CZNP injection. The data are presented as the means ± SDs; *p<0.05, **p<0.01 and ***p<0.001 versus Group 1; #p<0.05, ##p<0.01 and ###p<0.001 versus Group 3. |
PEG-CZNPs Improve Steatosis and Inflammation in the Liver, Kidney and Adipose Tissues
Histologic changes in experimental mice were analyzed via H&E, PAS, and ORO staining. The number of intracellular vacuole lesions, indicative steatosis in the liver (Figure 7A) and kidney (Figure 7B) tissues, significantly increased in Group 3 but was successfully alleviated by PEG-CZNP treatment. Vacuolar degeneration in liver and kidney tissues was more severe 24 weeks after HFD than 12 weeks. The therapeutic effect of PEG-CZNP was sustained over time. ORO staining of liver and kidney tissues confirmed these findings. Additionally, infiltration of inflammatory cell infiltration was observed in Group 3 at both 12 weeks and 24 weeks post-HFD, but was markedly reduced in liver tissues following PEG-CZNP treatment (Figure 7A).
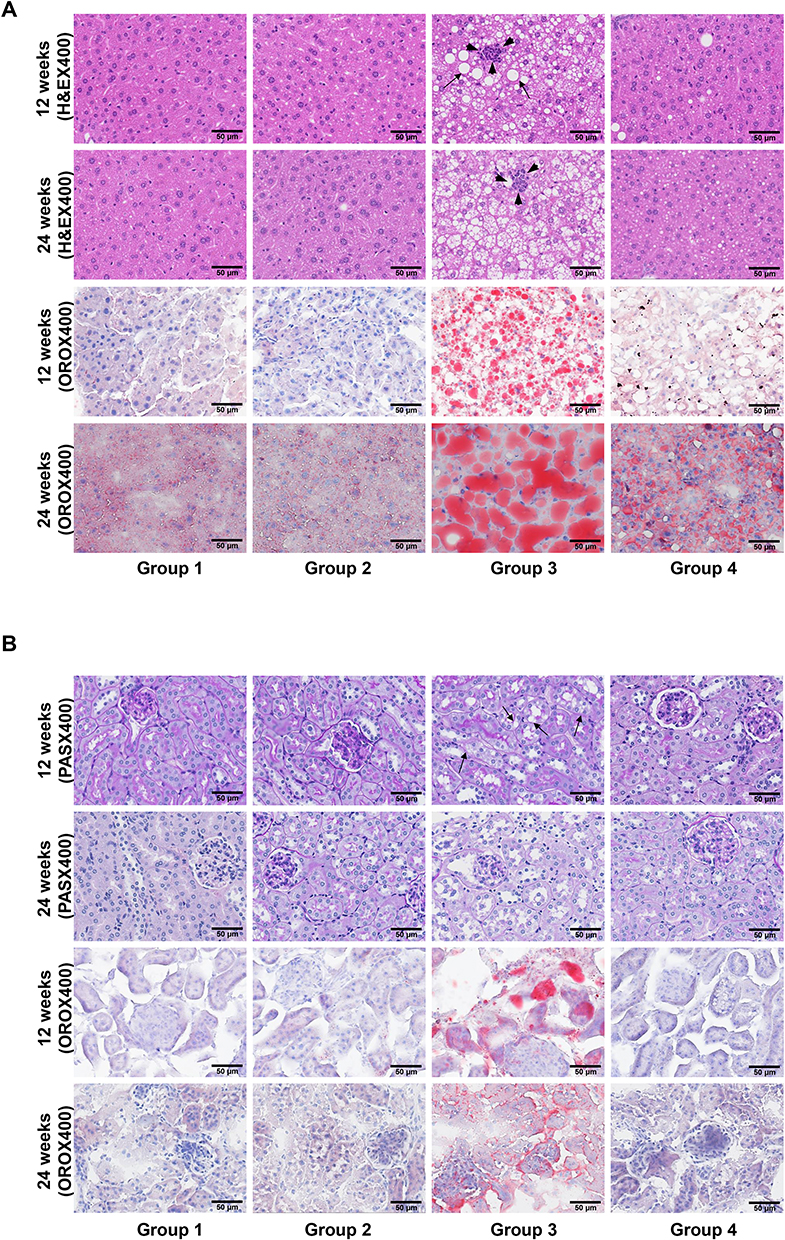 |
Figure 7 Effects of PEG-CZNPs on liver and kidney tissue in HFD-fed mice at 12 and 24 weeks. (A) Representative photomicrographs of H&E- and ORO-stained liver tissues sections. (B) Representative photomicrographs of PAS- and ORO-stained kidney tissue sections. Arrowheads indicate inflammatory cell infiltrations, and arrows indicate macrovesicular change in cells. Group 1: normal diet + normal saline injection; Group 2: normal diet + PEG-CZNP injection; Group 3: HFD + normal saline injection; and Group 4: HFD + PEG-CZNP injection. |
The adipocyte size in epididymal, inguinal, and retroperitoneal, perirenal WAT, as well as in BAT, markedly increased in Group 3, as observed via H&E staining (Figure 8A and B, Figure S4). PEG-CZNP treatment effectively reduced adipocyte size in both WAT and BAT. Furthermore, HFD-induced changes such as the whitening and necrosis of BAT were significantly improved following PEG-CZNP treatment. The number of CLS increased due to HFD, but PEG-CZNPs successfully decreased it. The expression of inflammation-related genes in the liver, kidney, and adipose tissue was assessed using RT‒PCR. mRNA levels of genes such as IL-1β, IL-6, IL-8, IL-10, and TNFα showed upward trend in response to the HFD, which decreased following PEG-CZNP treatment. However, these changes were not statistically significant (Figure S5).
 |
Figure 8 Effects of PEG-CZNPs on adipose tissue in HFD-fed mice. (A) Representative photomicrographs of H&E-stained epididymal WAT. Cell size was quantified using ImageJ, and CLSs were analyzed. Black arrows indicate CLS. (B) Representative photomicrographs of H&E-stained BAT with analysis of necrosis and whitening. Group 1: normal diet + normal saline injection; Group 2: normal diet + PEG-CZNP injection; Group 3: HFD + normal saline injection; and Group 4: HFD + PEG-CZNP injection. Data are presented as the means ± SDs; ***p<0.001 versus Group 1; ###p<0.001 versus Group 3. |
PEG-CZNPs Improve Autophagy Flux in HFD-Induced Obese Mice
The impact of PEG-CZNPs on autophagy was investigated in an obese mouse model. LC3 intensity was significantly greater in Group 3 compared to Group 4, indicating increased autophagy flux with PEG-CZNP treatment. This enhancement promotes the clearance of autophagosomes through autophagic degradation, leading to a reduction in the number of remaining LC3 autophagosomes (Figure 9A). The intranuclear intensity of TFEB was significantly increased by PEG-CZNPs suggesting that the enhanced autophagy flux occurs via TFEB activation (Figure 9B).
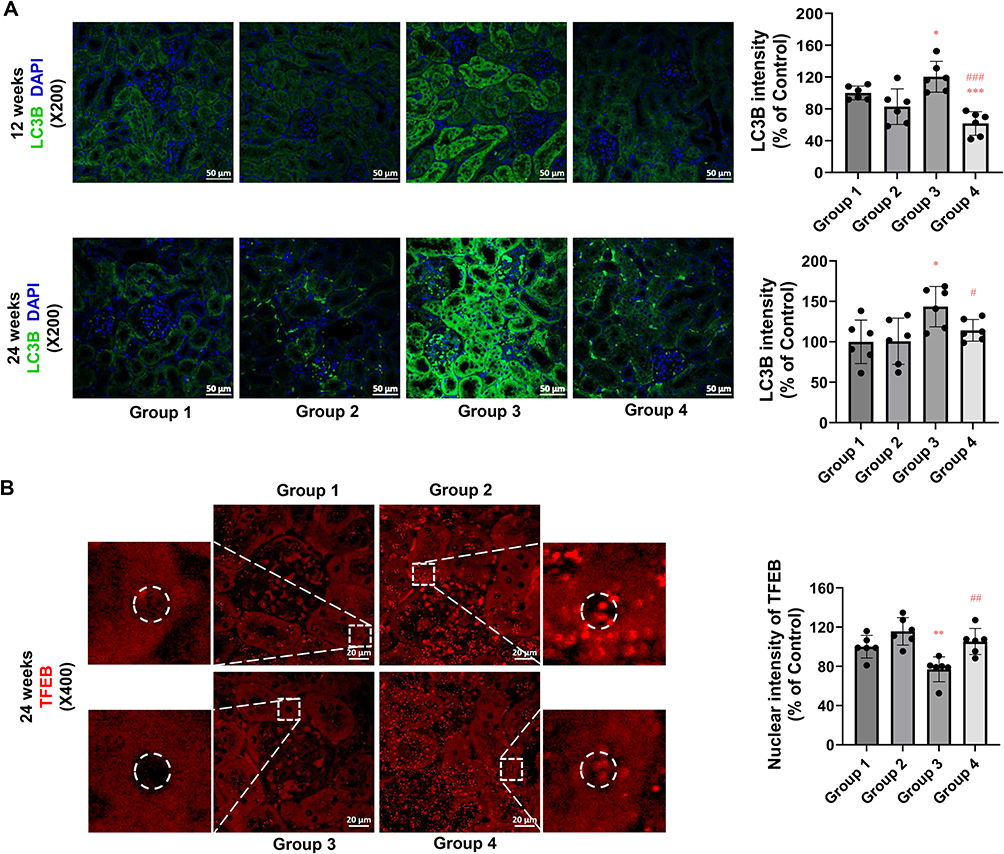 |
Figure 9 Effects of PEG-CZNPs on the autophagy response in kidney tissue from HFD-fed mice. (A) Representative confocal immunofluorescence microscopy image of LC3 (green) with DAPI counterstaining (blue) in control and HFD-fed mice, with or without PEG-CZNP exposure. LC3B intensity was quantified via ImageJ software. (B) Representative confocal immunofluorescence microscopy images of TFEB (red) in control and HFD-fed mice with or without PEG-CZNP exposure. TFEB intensity was quantified via ImageJ software. Group 1: normal diet + normal saline injection; Group 2: normal diet + PEG-CZNP injection; Group 3: HFD + normal saline injection; and Group 4: HFD + PEG-CZNP injection. Data are presented as the means ± SDs; *p<0.05, **p<0.01, and ***p<0.001 versus Group 1; #p<0.05, ##p<0.01 and ###p<0.001 versus Group 3. |
PEG-CZNPs Reduce Oxidative Stress and Fibrotic Changes in Liver and Kidney Tissue in HFD-Induced Obese Mice
We further evaluated oxidative stress in the liver and kidney using 8-OHdG staining. The intensity of 8-OHdG was significantly increased in Group 3 but markedly decreased in Group 4. This effect was more pronounced at 24 weeks compared to 12 weeks (Figure 10A and B). Fibrotic changes in the liver and kidney tissues were assessed using Masson’s trichrome staining. Fibrotic changes began to appear at 12 weeks in Group 3 mice and progressed further by 24 weeks after initiating the HFD. PEG-CZNP treatment significantly mitigated these changes in both liver and kidney (Figure 11A and B). Additionally, fibrosis-associated genes, αSMA and ColIV, were evaluated in the liver, kidney and adipose tissues using RT-PCR. The mRNA expression levels tended to be higher in Group 3 but were reduced by PEC-CZNP treatment in Group 4. However, these differences were not statistically significant (Figure S6).
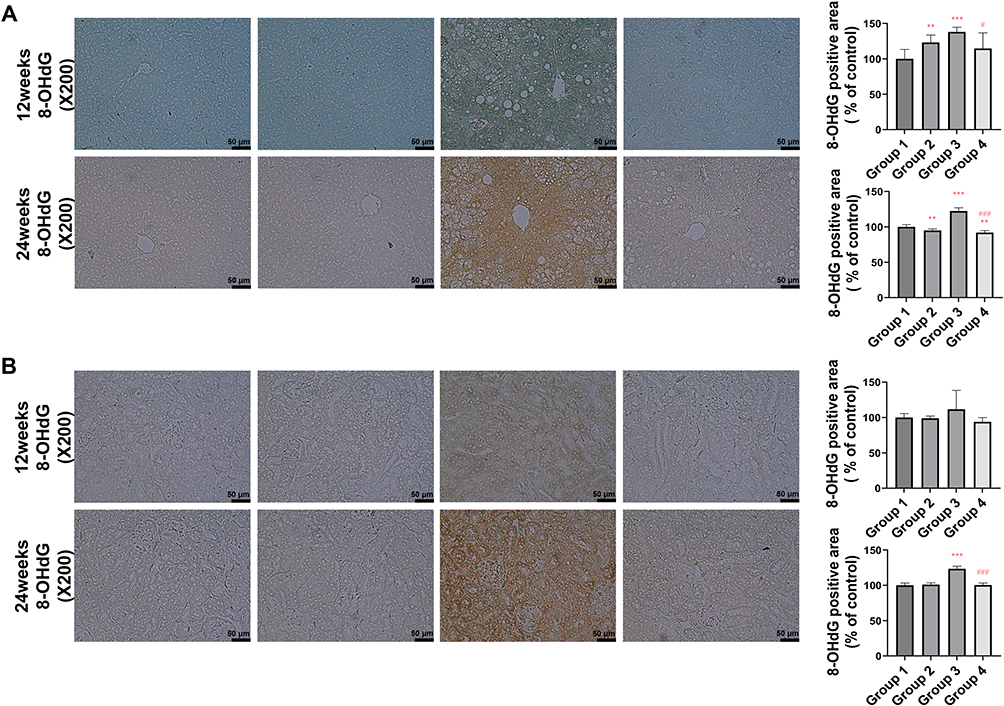 |
Figure 10 Effects of PEG-CZNPs on oxidative stress in the kidney and liver tissues of HFD-fed mice at 12 and 24 weeks after HFD feeding. Representative microscopy images of 8-OHDG staining in control and HFD-fed mice, with or without PEG-CZNP exposure. 8-OHDG intensity was quantified via ImageJ software. (A) Liver and (B) Kidney. Group 1: normal diet + normal saline injection; Group 2: normal diet + PEG-CZNP injection; Group 3: HFD + normal saline injection; and Group 4: HFD + PEG-CZNP injection. Data are presented as the means ± SDs; *p<0.05, **p<0.01, and ***p<0.001 versus Group 1; #p<0.05, and ###p<0.001 versus Group 3. |
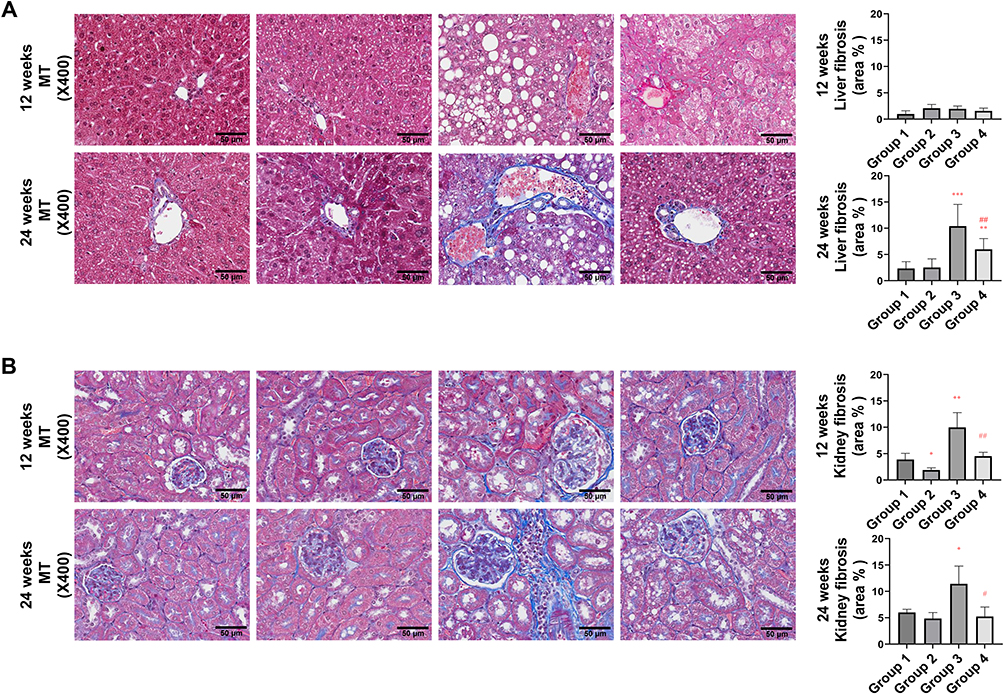 |
Figure 11 Effects of PEG-CZNPs on fibrotic changes in the kidney and liver tissues of HFD-fed mice at 12 and 24 weeks after HFD feeding. Representative microscopy images of Masson’s trichrome staining in control and HFD-fed mice, with or without PEG-CZNP treatment. Fibrosis lesions were quantified via ImageJ software. (A) Liver and (B) Kidney. Group 1: normal diet + normal saline injection; Group 2: normal diet + PEG-CZNP injection; Group 3: HFD + normal saline injection; and Group 4: HFD + PEG-CZNP injection. Data are presented as the means ± SDs; *p<0.05, **p<0.01 and ***p<0.001 versus Group 1; #p<0.05, and ##p<0.01 versus Group 3. |
Discussion
Our study demonstrated that PEG-CZNPs effectively restore autophagy flux dysfunction and exhibit antioxidant properties in cellular and animal models of obesity. These properties lead to decreased intracellular lipid accumulation and improved cellular survival by reducing inflammation. In our in vivo experiments, PEG-CZNPs significantly reduced total body and organ weight gain in HFD-fed mice. Additionally, plasma cholesterol levels decreased, and glucose intolerance markedly improved. Tissue inflammation and organ damage were also reduced (Scheme 2). To our knowledge, this is the first study to demonstrate that PEG-CZNPs alleviate obesity-related multiple organ damage and weight gain by restoring autophagy flux, rather than acting solely as ROS scavengers. Previous studies demonstrated that CNPs effectively ameliorated lipid accumulation, oxidative stress, and inflammation in NAFLD animal models by reducing hepatocyte lipid droplets and malondialdehyde levels through their antioxidant properties.37,38 However, these studies primarily focused on liver-specific effects without exploring the CNPs’ impact on extrahepatic tissues or autophagy mechanisms. In contrast, our current findings highlight that PEG-CZNPs provide broader therapeutic efficacy by simultaneously targeting liver, kidney, and adipose tissues, and by uniquely restoring autophagy flux, in addition to their ROS-scavenging effects. This combined action potentially offers superior therapeutic benefits for obesity-induced organ complications.
 |
Scheme 2 Schematic illustration of the effect of PEG-CZNPs in cellular and animal models of obesity, highlighting its antioxidant and pro-autophagy properties. PEG-CZNPs enhanced autophagy flux via TFEB activation, promoting lipolysis within cells. This resulted in decreased intracellular lipid accumulation and reduced weight gain in the body and critical organs in both cellular and animal models of obesity. Ultimately, PEG-CZNPs lowered serum cholesterol levels and attenuated the progression of inflammation and fibrosis by decreasing oxidative stress. |
Among the various pathological mechanisms underlying obesity’s effects on the body, autophagy plays a crucial role in obesity-related complications.2,39,40 Numerous studies have shown that autophagy is suppressed in obese individuals.41–45 Elevated lipid levels in obesity disrupt autophagosome‒lysosome fusion, lysosomal acidification, and hydrolase activity.46,47 Additionally, increased food intake and reduced energy expenditure in obese individuals enhance mTOR signaling, which suppresses autophagy processing.48 This dysfunction leads to further lipid accumulation and lipotoxicity, creating a vicious cycle in obesity.49,50 Consistent with previous studies, we found that although autophagy increased with palmitate exposure, autophagy flux process was impaired in palmitate-exposed cells, leading to intracellular lipid accumulation. Notably, this impairment was successfully reversed by PEG-CZNP treatment, as evidenced by changes in p62 and LC3 in response to CQ in palmitate-treated cells. PEG-CZNPs enhanced autophagy flux by activating TFEB nuclear translocation.19,28
TFEB, a member of the MiT/TFE (microphthalmia/transcription factor E) family, regulates autophagosomes and lysosomes synthesis by targeting autophagy-related gene promoters.51,52 It plays a critical role in lipid metabolism by increasing lysosomal hydrolases expression and enhancing autophagy function.53–55 Our study found that TFEB nuclear levels decreased following palmitate treatment, leading to increased lipid deposition in cells, suggesting that TFEB activation may prevent obesity-related complications.56 As shown in our previous research, PEG-CZNPs promote TFEB nuclear translocation via the protein kinase B (AKT)/glycogen synthase kinase 3β (GSK3β) pathway.27 PEG-CZNPs increased phosphorylation levels of Akt and p-GSK3β at serine 9 (p-Ser9-GSK3β), indicating inactive GSK3β. Increased p-AKT/p-Ser9-GSK3β activity promotes TFEB nuclear translocation by dephosphorylating TFEB, and PEG-CZNP treatment in this study successfully restored TFEB activity.
We analyzed three major organs-the liver, kidney, and adipose tissue– that are significantly impacted by obesity. PEG-CZNP treatment following HFD reduced weight gain in all these organs. We examined four types of WAT (epididymal, inguinal, perirenal, and axillary) as well as BAT. WAT stores energy as TG during energy excess (lipogenesis) and releases fatty acids when needed (lipolysis). In contrast, BAT is specialized for energy expenditure through thermogenesis.57 In obesity, inflammation and fibrosis in visceral WAT significantly contribute to pathologies in other vital organs, including cardiovascular disease, NASH, CKD and insulin resistance through inflammatory cytokines (eg, TNFα, ILs) and extracellular matrix components (ECM) such as ColIV.58 Our study suggests that the improvements observed in WAT and BAT following PEG-CZNP treatment may have contributed to lower blood cholesterol levels and reduced liver and kidney damage.
In our current study, PEG-CZNPs were injected intraperitoneally at a dose of 10 mg/kg twice per week for up to 24 weeks, with no significant toxicity observed. PEG-CZNPs are primarily cleared by the reticuloendothelial system (RES) and are mainly excreted in the feces through the liver and spleen, with approximately 10% excreted in urine via the kidneys.57 In a previous study, we examined the biodistribution of cerium and zirconium up to 48 weeks after PEG-CZNP injection using the same protocol. All mice treated with PEG-CZNPs survived, and no toxicity was observed for up to 12 months. The highest accumulation was observed in the spleen, followed by the liver, kidney, lung, and minimal accumulation in the brain.27 This accumulation increased in a time-dependent manner. In earlier studies, CNPs generally showed to be well tolerated at doses ranging up to as high as 750mg/kg for rat when administered intravenously with minimal acute toxicity observed. However, long-term exposure and accumulation raised concerns about granuloma formation and oxidative stress responses, suggesting that dosing should carefully balance therapeutic efficacy and potential biopersistence-related risks.59
Various efforts have been made to enhance autophagy as a treatment for obesity. Lifestyle-based approaches, such as caloric restriction strategies, low-calorie dietary regimens, and physical exercise, as well as bariatric surgery and pharmacological agents, have been suggested as activators of autophagy.60 Anti-obesity medications include direct autophagy activators, such as the mTOR inhibitor rapamycin.61–63 However, therapies focused on autophagy activation may paradoxically increase ROS production, which is a concern, as rapamycin itself elevates ROS levels.64–66 Consequently, agents with both pro-autophagic and antioxidant properties such as L-carnitine,45,67 polyamines,45,68 zinc,69,70 and phenolic compounds like garlic acid71 and resveratrol72 have recently been explored as potential therapies for obesity.40,49 Compared to these agents, PEG-CZNPs in our study demonstrated high efficacy in alleviating multiple obesity-related complications by functioning as both an autophagy flux activator and ROS scavenger. This dual action highlights their novelty and makes them particularly promising as therapeutic agents.
Conclusion
The results of our current study demonstrate that PEG-CZNPs effectively reduce intracellular lipid accumulation and limit weight gain in the body and multiple critical organs in cellular and animal models of obesity. These effects are achieved through enhanced autophagy flux via TFEB activation, coupled with the potent ROS-scavenging properties of PEG-CZNPs. Furthermore, PEG-CZNPs lowered serum cholesterol levels and mitigated the progression of inflammation and fibrosis. To the best of our knowledge, these findings provide first novel evidence that PEG-CZNPs can serve as a promising treatment for obesity-induced multi-organ injury, owing to their dual roles as both ROS scavengers and autophagy flux restorers.
Abbreviations
PEG-CZNPs, polyethylene-coated ceria-zirconia antioxidant nanoparticles; HFD, high‒fat diet; ROS, Reactive oxygen species; TG, triglycerides; LDL, low dense lipid; NAFLD, nonalcoholic fatty liver disease; CKD, chronic kidney disease; mTOR, the mammalian target of rapamycin; AMPK, AMP-activated protein kinase; NPs, nanoparticles; CNPs, ceria nanoparticles; CZNPs, ceria-zirconia nanoparticles; PEG, polyethylene glycol; ORO, Oil Red O; LC3B, anti-light chain 3B; DW, deionized water; TFEB, transcription factor EB; ERK, extracellular signal‒regulated kinase; JNK, c‒Jun N‒terminal kinase; HDAC, Histone deacetylase; TEM, transmission electron microscopy; XRD, X‒ray diffraction; FTIR, fourier transform infrared spectroscope; DLS, dynamic light scattering; EDS, energy-dispersive X‒ray spectroscopy; XPS, In-situ X‒ray photoelectron spectroscopy; DPPH, 1,1‒diphenyl‒2‒picrylhydrazyl; HK‒2, human renal proximal tubular epithelial cells; FBS, fetal bovine serum; PBS, phosphate‒buffered saline; BSA, bovine serum albumin; MTT, 3‒(4,5‒dimethylthiazole-2‒yl)‒2,5‒diphenyltetrazolium bromide; RT‒PCR, reverse transcription polymerase chain reaction; GAPDH, glyceraldehyde‒3‒phosphate dehydrogenase; CEB, cytoplasmic extraction buffer; NEB, nuclear extraction buffer; RIPA, radioimmunoprecipitation assay; DCF‒DA, dichlorodihydrofluorescein diacetate; IFA, Immunofluorescence assay; DAPI, 4’,6‒diamidino‒2‒phenylindole; IACUC, the Institutional Animal Care and Use Committee; H&E, hematoxylin‒eosin; MT, Masson’s Trichrome stain; PAS, Periodic acid-Schiff; 8‒OHdG, anti‒8‒hydroxy‒2‒deoxyguanosine; CLS, crown like structure; 8‒OHdG, anti‒8‒hydroxy-2’‒deoxyguanosine; HRP, horseradish peroxidase; DAB, 3,3’‒diaminobenzidine; IPGTT, intraperitoneal glucose tolerance test; AUC, area under the curve; ALT, alanine aminotransferase; BUN, blood urea nitrogen; NAC, N‒acetyl‒L‒cysteine; SREBF1, sterol regulatory element-binding factor 1; DGAT1, diacylglycerol O‒acyltransferases 1; CQ, chloroquine; IL, interleukin; TNFα, tumor necrosis factor α; MAPK, mitogen-activated protein kinase; TGFβ1, transforming growth factor; ColIV, collagen type IV; α‒SMA, α smooth muscle actin; WAT, white adipose tissue; BAT, brown adipose tissue; MiT/TFE, microphthalmia/transcription factor E; Akt, protein kinase B; GSK3β, glycogen synthase kinase 3β; p‒Akt, phosphorylation‒Akt; p‒Ser9‒GSK3β, p-GSK3β at serine 9; ECM, extracellular matrix components; RES, reticuloendothelial system.
Data Sharing Statement
All data are provided in the article and are available upon request from the corresponding author.
Acknowledgments
The present study was supported by the Basic Science Research Program of the National Research Foundation of Korea (NRF), funded by the Ministry of Education (grant no. NRF-2022R1I1A3069203, NRF-2019R1I1A3A01063833, NRF-2021R1I1A1A01059870, and NRF 2017R1A6A1A03015713) and the Ministry of Science and ICT (grant no. NRF-00350082).
Disclosure
The authors report no conflicts of interest in this work.
References
1. Boutari C, Mantzoros CS. A 2022 update on the epidemiology of obesity and a call to action: as its twin COVID-19 pandemic appears to be receding, the obesity and dysmetabolism pandemic continues to rage on. Metabolism. 2022;133:155217. doi:10.1016/j.metabol.2022.155217
2. Zhang Y, Sowers JR, Ren J. Targeting autophagy in obesity: from pathophysiology to management. Nat Rev Endocrinol. 2018;14(6):356–76.10.1038/s41574–018–0009–1.
3. Polyzos SA, Mantzoros CS. Obesity: seize the day, fight the fat. Metabolism. 2019;92:1–5. doi:10.1016/j.metabol.2018.12.011
4. Singh GM, Danaei G, Farzadfar F, et al. The age-specific quantitative effects of metabolic risk factors on cardiovascular diseases and diabetes: a pooled analysis. PLoS One. 2013;8(7):e65174. doi:10.1371/journal.pone.0065174
5. Lauby-Secretan B, Scoccianti C, Loomis D, et al. Body fatness and cancer--viewpoint of the IARC Working Group. N Engl J Med. 2016;375(8):794–8.10.1056/NEJMsr1606602.
6. Jiang L, Tian W, Wang Y, et al. Body mass index and susceptibility to knee osteoarthritis: a systematic review and meta-analysis. Joint Bone Spine. 2012;79(3):291–297. doi:10.1016/j.jbspin.2011.05.015
7. Jiang L, Rong J, Wang Y, et al. The relationship between body mass index and hip osteoarthritis: a systematic review and meta-analysis. Joint Bone Spine. 2011;78(2):150–5.10.1016/j.jbspin.2010.04.011.
8. Anstey KJ, Cherbuin N, Budge M, Young J. Body mass index in midlife and late-life as a risk factor for dementia: a meta-analysis of prospective studies. Obes Rev. 2011;12(5):e426–37. doi:10.1111/j.1467-789X.2010.00825.x
9. Andreyeva T, Sturm R, Ringel JS. Moderate and severe obesity have large differences in health care costs. Obes Res. 2004;12(12):1936–1943. doi:10.1038/oby.2004.243
10. Abdelaal M, le Roux CW, Docherty NG. Morbidity and mortality associated with obesity. Ann Transl Med. 2017;5(7):ARTN161. doi:10.21037/atm.2017.03.107
11. Caklili OT, Cesur M, Mikhailidis DP, Rizzo M. Novel anti-obesity therapies and their different effects and safety profiles: a critical overview. Diabet Metab Synd Ob. 2023;16:1767–1774. doi:10.2147/Dmso.S392684
12. Manna P, Jain SK. Obesity, oxidative stress, adipose tissue dysfunction, and the associated health risks: causes and therapeutic strategies. Metab Syndr Relat D. 2015;13(10):423–444. doi:10.1089/met.2015.0095
13. Alers S, Löffler AS, Wesselborg S, Stork B. Role of AMPK-mTOR-Ulk1/2 in the regulation of autophagy: cross talk, shortcuts, and feedbacks. Mol Cell Biol. 2012;32(1):2–11. doi:10.1128/Mcb.06159-11
14. Xu J, Kitada M, Ogura Y, Koya D. Relationship between autophagy and metabolic syndrome characteristics in the pathogenesis of atherosclerosis. Front Cell Dev Biol. 2021;9:ARTN641852. doi:10.3389/fcell.2021.641852
15. Duan JC, Yu YB, Yu Y, et al. Silica nanoparticles induce autophagy and endothelial dysfunction via the PI3K/Akt/mTOR signaling pathway. Int J Nanomed. 2014;9:5131–5141. doi:10.2147/Ijn.S71074
16. Mao BH, Tsai JC, Chen CW, Yan SJ, Wang YJ. Mechanisms of silver nanoparticle-induced toxicity and important role of autophagy. Nanotoxicology. 2016;10(8):1021–1040. doi:10.1080/17435390.2016.1189614
17. Peynshaert K, Manshian BB, Joris F, et al. Exploiting intrinsic nanoparticle toxicity: the pros and cons of nanoparticle-induced autophagy in biomedical research. Chem Rev. 2014;114(15):7581–7609. doi:10.1021/cr400372p
18. Ma XW, Wu YY, Jin SB, et al. Gold nanoparticles induce autophagosome accumulation through size-dependent nanoparticle uptake and lysosome impairment. Acs Nano. 2011;5(11):8629–8639. doi:10.1021/nn202155y
19. Kim YG, Lee Y, Lee N, Soh M, Kim D, Hyeon T. Ceria-based therapeutic antioxidants for biomedical applications. Adv Mater. 2024;36(10). doi:10.1002/adma.202210819
20. Nelson BC, Johnson ME, Walker ML, Riley KR, Sims CM. Antioxidant cerium oxide nanoparticles in biology and medicine. Antioxidants. 2016;5(2):15. doi:10.3390/antiox5020015
21. Soh M, Kang DW, Jeong HG, et al. Ceria-zirconia nanoparticles as an enhanced multi-antioxidant for sepsis treatment. Angew Chem Int Edit. 2017;56(38):11399–11403. doi:10.1002/anie.201704904
22. Zhu XY, Klomjit N, Conley SM, et al. Impaired immunomodulatory capacity in adipose tissue-derived mesenchymal stem/stromal cells isolated from obese patients. J Cell Mol Med. 2021;25(18):9051–9059. doi:10.1111/jcmm.16869
23. Tsai YY, Oca-Cossio J, Lin SM, Woan K, Yu PC, Sigmund W. Reactive oxygen species scavenging properties of ZrO-CeO solid solution nanoparticles. Nanomedicine UK. 2008;3(5):637–645. doi:10.2217/17435889.3.5.637
24. Karakoti AS, Singh S, Kumar A, et al. PEGylated nanoceria as radical scavenger with tunable redox chemistry. J Am Chem Soc. 2009;131(40):14144–14145. doi:10.1021/ja9051087
25. Song WS, Lee SS, Savini M, Popp L, Colvin VL, Segatori L. Ceria nanoparticles stabilized by organic surface coatings activate the lysosome-autophagy system and enhance autophagic clearance. Acs Nano. 2014;8(10):10328–10342. doi:10.1021/nn505073u
26. Hong SE, An JH, Yu SL, et al. Ceria-zirconia antioxidant nanoparticles attenuate hypoxia-induced acute kidney injury by restoring autophagy flux and alleviating mitochondrial damage. J Biomed Nanotechnol. 2020;16(7):1144–1159. doi:10.1166/jbn.2020.2948
27. Kim EK, Hong SE, Li Y, et al. PEG-capped ceria-zirconia nanoparticles improved renal fibrosis in cellular and animal models of Fabry disease. Acs Appl Nano Mater. 2024;7(3):2913–2928. doi:10.1021/acsanm.3c05170
28. An JH, Hong SE, Yu SL, et al. Ceria-Zirconia nanoparticles reduce intracellular globotriaosylceramide accumulation and attenuate kidney injury by enhancing the autophagy flux in cellular and animal models of Fabry disease. J Nanobiotechnol. 2022;20(1):125. doi:10.1186/s12951-022-01318-8
29. Allen TM, Cullis PR. Liposomal drug delivery systems: from concept to clinical applications. Adv Drug Deliv Rev. 2013;65(1):36–48. doi:10.1016/j.addr.2012.09.037
30. Edwards K, Johnsson M, Karlsson G, Silvander M. Effect of polyethyleneglycol-phospholipids on aggregate structure in preparations of small unilamellar liposomes. Biophys J. 1997;73(1):258–266. doi:10.1016/S0006-3495(97)78066-4
31. Chen L, Liu L, Li CX, et al. A mix of apple pomace polysaccharide improves mitochondrial function and reduces oxidative stress in the liver of high-fat diet-induced obese mice. Mol Nutr Food Res. 2017;61(3):ARTN1600433. doi:10.1002/mnfr.201600433
32. Li JL, Wu HS, Liu YT, Yang L. High fat diet induced obesity model using four strains of mice: Kunming, C57BL/6, BALB/c and ICR. Exp Anim Tokyo. 2020;69(3):326–335. doi:10.1538/expanim.19-0148
33. Osman OS, Selway JL, Kepczynska MA, et al. A novel automated image analysis method for accurate adipocyte quantification. Adipocyte. 2013;2(3):160–164. doi:10.4161/adip.24652
34. Kotzbeck P, Giordano A, Mondini E, et al. Brown adipose tissue whitening leads to brown adipocyte death and adipose tissue inflammation. J Lipid Res. 2018;59(5):784–794. doi:10.1194/jlr.M079665
35. Murano I, Barbatelli G, Parisani V, et al. Dead adipocytes, detected as crown-like structures, are prevalent in visceral fat depots of genetically obese mice. J Lipid Res. 2008;49(7):1562–1568. doi:10.1194/jlr.M800019-JLR200
36. Takaishi K, Oshima T, Eto H, et al. Impact of exercise and detraining during childhood on brown adipose tissue whitening in obesity. Metabolites. 2021;11:10. doi:10.3390/metabo11100677
37. Casals G, Perramón M, Casals E, et al. Cerium oxide nanoparticles: a new therapeutic tool in liver diseases. Antioxidants-Basel. 2021;10(5):ARTN660. doi:10.3390/antiox10050660
38. Carvajal S, Perramón M, Oró D, et al. Cerium oxide nanoparticles display antilipogenic effect in rats with non-alcoholic fatty liver disease. Sci Rep UK. 2019;9:ARTN12848. doi:10.1038/s41598-019-49262-2
39. Namkoong S, Cho CS, Semple I, Lee JH. Autophagy dysregulation and obesity-associated pathologies. Mol Cells. 2018;41(1):3–10. doi:10.14348/molcells.2018.2213
40. Behrooz AB, Cordani M, Fiore A, et al. The obesity-autophagy-cancer axis: mechanistic insights and therapeutic perspectives. Semin Cancer Biol. 2024;99:24–44. doi:10.1016/j.semcancer.2024.01.003
41. Settembre C, De Cegli R, Mansueto G, et al. TFEB controls cellular lipid metabolism through a starvation-induced autoregulatory loop (vol 15, pg 647, 2013). Nat Cell Biol. 2013;15(8):1016. doi:10.1038/ncb2814
42. Yang L, Li P, Fu SN, Calay ES, Hotamisligil GS. Defective hepatic autophagy in obesity promotes ER stress and causes insulin resistance. Cell Metab. 2010;11(6):467–478. doi:10.1016/j.cmet.2010.04.005
43. Singh R, Kaushik S, Wang YJ, et al. Autophagy regulates lipid metabolism. Nature. 2009;458(7242):1131–U64. doi:10.1038/nature07976
44. Quan W, Hur KY, Lim Y, et al. Autophagy deficiency in beta cells leads to compromised unfolded protein response and progression from obesity to diabetes in mice. Diabetologia. 2012;55(2):392–403. doi:10.1007/s00125-011-2350-y
45. Fernández AF, Bárcena C, Martínez-García GG, et al. Autophagy couteracts weight gain, lipotoxicity and pancreatic β-cell death upon hypercaloric pro-diabetic regimens. Cell Death Dis. 2017;8:ARTNe2970. doi:10.1038/cddis.2017.373
46. Wang KW. Molecular mechanism of hepatic steatosis: pathophysiological role of autophagy. Expert Rev Mol Med. 2016;18:ARTNe14. doi:10.1017/erm.2016.14
47. Koga H, Kaushik S, Cuervo AM. Altered lipid content inhibits autophagic vesicular fusion. FASEB J. 2010;24(8):3052–3065. doi:10.1096/fj.09-144519
48. Galluzzi L, Pietrocola F, Levine B, Kroemer G. Metabolic Control of Autophagy. Cell. 2014;159(6):1263–1276. doi:10.1016/j.cell.2014.11.006
49. Pietrocola F, Bravo-San Pedro JM. Targeting autophagy to counteract obesity-associated oxidative stress. Antioxidants. 2021;10(1):102. doi:10.3390/antiox10010102
50. Singh R, Cuervo AM. Lipophagy: connecting autophagy and lipid metabolism. Int J Cell Biol. 2012;2012:282041. doi:10.1155/2012/282041
51. Napolitano G, Ballabio A. TFEB at a glance. J Cell Sci. 2016;129(13):2475–2481. doi:10.1242/jcs.146365
52. Raben N, Puertollano R. TFEB and TFE3: linking lysosomes to cellular adaptation to stress. Annu Rev Cell Dev Bi. 2016;32:255–278. doi:10.1146/annurev-cellbio-111315-125407
53. Jaishy B, Abel ED. Lipids, lysosomes, and autophagy. J Lipid Res. 2016;57(9):1619–1635. doi:10.1194/jlr.R067520
54. Cai MY, Jiang XS, Wei YX, Wen RZ, Du XG. Role of TFEB-autophagy lysosomal pathway in palmitic acid induced renal tubular epithelial cell injury. Biochem Biophys Res Commun. 2024;696:ARTN149472. doi:10.1016/j.bbrc.2024.149472
55. Wang P, Li CG, Zhou X, Ding SZ. Transcription factor EB enhances autophagy and ameliorates palmitate-induced insulin resistance at least partly upregulating AMPK activity in skeletal muscle cells. Clin Exp Pharmacol P. 2022;49(2):302–310. doi:10.1111/1440-1681.13600
56. Nakamura J, Yamamoto T, Takabatake Y, et al. TFEB-mediated lysosomal exocytosis alleviates high-fat diet-induced lipotoxicity in the kidney. Jci Insight. 2023;8(4):ARTNe162498. doi:10.1172/jci.insight.162498
57. Walkey C, Das S, Seal S, et al. Catalytic properties and biomedical applications of cerium oxide nanoparticles. Environ Sci-Nano. 2015;2(1):33–53. doi:10.1039/c4en00138a
58. Jin X, Qiu TT, Li L, et al. Pathophysiology of obesity and its associated diseases. Acta Pharm Sin B. 2023;13(6):2403–2424. doi:10.1016/j.apsb.2023.01.012
59. Yokel RA, Hussain S, Garantziotis S, Demokritou P, Castranova V, Cassee FR. The Yin: an adverse health perspective of nanoceria: uptake, distribution, accumulation, and mechanisms of its toxicity. Environ Sci Nano. 2014;1(5):406–428. doi:10.1039/C4EN00039K
60. Khan F, Khan H, Khan A, et al. Autophagy in adipogenesis: molecular mechanisms and regulation by bioactive compounds. Biomed Pharmacother. 2022;155:ARTN113715. doi:10.1016/j.biopha.2022.113715
61. Lamming DW, Sabatini DM. A central role for mTOR in lipid homeostasis. Cell Metab. 2013;18(4):465–469. doi:10.1016/j.cmet.2013.08.002
62. Chang GR, Hou PH, Wang CM, et al. Chronic everolimus treatment of high-fat diet mice leads to a reduction in obesity but impaired glucose tolerance. Pharmacol Res Perspe. 2021;9(2):ARTNe00732. doi:10.1002/prp2.732
63. Ricoult SJH, Manning BD. The multifaceted role of mTORC1 in the control of lipid metabolism. EMBO Rep. 2013;14(3):242–251. doi:10.1038/embor.2013.5
64. Blagosklonny MV. Rapamycin for longevity: opinion article. Aging-Us. 2019;11(19):8048–8067. doi:10.18632/aging.102355
65. Woo Y, Lee HJ, Kim J, et al. Rapamycin promotes ROS-mediated cell death functional inhibition of xCT expression in melanoma under γ-irradiation. Front Oncol. 2021;11:ARTN665420. doi:10.3389/fonc.2021.665420
66. Sarparanta J, Garcia-Macia M, Singh R. Autophagy and mitochondria in obesity and type 2 diabetes. Curr Diabetes Rev. 2017;13(4):352–369. doi:10.2174/1573399812666160217122530
67. Askarpour M, Hadi A, Miraghajani M, Symonds ME, Sheikhi A, Ghaedi E. Beneficial effects of L-carnitine supplementation for weight management in overweight and obese adults: an updated systematic review and dose-response meta-analysis of randomized controlled trials. Pharmacol Res. 2020;151:ARTN104554. doi:10.1016/j.phrs.2019.104554
68. Madeo F, Hofer SJ, Pendl T, et al. Nutritional aspects of spermidine. Ann Rev Nutr. 2020;40:135–159. doi:10.1146/annurev-nutr-120419-015419
69. Liuzzi JP, Guo L, Yoo C, Stewart TS. Zinc and autophagy. Biometals. 2014;27(6):1087–1096. doi:10.1007/s10534-014-9773-0
70. Payahoo L, Ostadrahimi A, Mobasseri M, et al. Effects of zinc supplementation on the anthropometric measurements, lipid profiles and fasting blood glucose in the healthy obese adults. Adv Pharm Bull. 2013;3(1):161–165. doi:10.5681/apb.2013.027
71. Lee MS, Kim IH, Kim CT, Kim Y. Reduction of body weight by dietary garlic is associated with an increase in uncoupling protein mRNA expression and activation of AMP-activated protein kinase in diet-induced obese mice. J Nutr. 2011;141(11):1947–1953. doi:10.3945/jn.111.146050
72. Mongioì LM, La Vignera S, Cannarella R, et al. The role of resveratrol administration in human obesity. Int J Mol Sci. 2021;22(9):ARTN4362. doi:10.3390/ijms22094362
 © 2025 The Author(s). This work is published and licensed by Dove Medical Press Limited. The
full terms of this license are available at https://www.dovepress.com/terms.php
and incorporate the Creative Commons Attribution
- Non Commercial (unported, 4.0) License.
By accessing the work you hereby accept the Terms. Non-commercial uses of the work are permitted
without any further permission from Dove Medical Press Limited, provided the work is properly
attributed. For permission for commercial use of this work, please see paragraphs 4.2 and 5 of our Terms.
© 2025 The Author(s). This work is published and licensed by Dove Medical Press Limited. The
full terms of this license are available at https://www.dovepress.com/terms.php
and incorporate the Creative Commons Attribution
- Non Commercial (unported, 4.0) License.
By accessing the work you hereby accept the Terms. Non-commercial uses of the work are permitted
without any further permission from Dove Medical Press Limited, provided the work is properly
attributed. For permission for commercial use of this work, please see paragraphs 4.2 and 5 of our Terms.
Recommended articles
Effects of High-Fat Diet on Cardiovascular Protein Expression in Mice Based on Proteomics
Pan X, Zhang X, Ban J, Yue L, Ren L, Chen S
Diabetes, Metabolic Syndrome and Obesity 2023, 16:873-882
Published Date: 28 March 2023