")
Back to Journals » International Journal of Chronic Obstructive Pulmonary Disease » Volume 20
Plasma Levels of CXCL9 and MCP-3 are Increased in Asthma-COPD Overlap (ACO) Patients
Authors Escamilla-Gil JM, Torres-Duque CA , Llinás-Caballero K, Proaños-Jurado NJ, De Vivero MM , Ramirez JC , Regino R, Florez de Arco LT, Dennis R , González-García M , Caraballo L , Acevedo N
Received 30 November 2024
Accepted for publication 22 March 2025
Published 22 April 2025 Volume 2025:20 Pages 1161—1174
DOI https://doi.org/10.2147/COPD.S506517
Checked for plagiarism Yes
Review by Single anonymous peer review
Peer reviewer comments 2
Editor who approved publication: Dr Richard Russell
Jose Miguel Escamilla-Gil,1– 3 Carlos A Torres-Duque,2,3 Kevin Llinás-Caballero,1 Nadia Juliana Proaños-Jurado,2,3 María M De Vivero,1 Jonathan Camilo Ramirez,1 Ronald Regino,1 Lucila Teresa Florez de Arco,4 Rodolfo Dennis,5,6 Mauricio González-García,2,3 Luis Caraballo,1 Nathalie Acevedo1
1Institute for Immunological Research, University of Cartagena, Cartagena, Colombia; 2CINEUMO, Research Center, Fundación Neumológica Colombiana, Bogotá, Colombia; 3La Sabana University, School of Medicine, Bogotá, Colombia; 4Respiratory and Allergy Clinic, Cartagena, Colombia; 5Cardioinfantil Foundation, Bogotá, Colombia; 6Universidad del Rosario, Bogotá, Colombia
Correspondence: Nathalie Acevedo, Institute for Immunological Research. University of Cartagena. Health Sciences Campus Zaragocilla. Ed. Biblioteca Piso 1, Cartagena, 1300014, Colombia, Email [email protected]
Purpose: Asthma and chronic obstructive pulmonary disease overlap patients (ACO) have more exacerbations and a worse prognosis than pure asthma or COPD, and it is of great interest to identify differential biomarkers of ACO. We compared blood eosinophil counts, plasma IgE and protein levels among patients with asthma, ACO, COPD, and healthy subjects to identify those associated with ACO.
Patients and Methods: 397 adults (age 40– 90 years) were recruited from two Colombian cities: asthma (n=123), COPD (n=100), ACO (n=74) and healthy control (HC, n=100). Plasma protein levels were measured using the Proximity Extension Assay (Olink Proteomics).
Results: There were no differences in blood eosinophil counts between the patient groups. Total and specified IgE levels were higher in patients with ACO than in those with COPD. Ten plasma proteins showed significant differences between the patients with ACO and HC. In patients above 60 years old, CXCL9 discriminates ACO from asthma patients with AUC 0.73 (0.63– 0.82, DeLong test p=0.007), and in patients below 60 years old, MCP-3 discriminates ACO from COPD patients with AUC 0.84 (0.62– 1.0, DeLong test p=0.006). CUB domain-containing protein 1 (CDCP1) levels (OR, 0.47; p=0.008) and age > 60 years (OR, 0.25; p=0.001) were negatively associated with ACO.
Conclusion: CXCL9 levels could be used to discriminate ACO from asthma patients and MCP-3 to discriminate ACO from COPD. Protein inflammatory signatures in plasma of ACO patients were similar to the COPD group. This study revealed novel biomarkers that may help characterize patients with ACO.
Keywords: biomarkers, proximity extension assay, PEA, chronic obstructive pulmonary disease, COPD, circulating inflammatory mediators, CXCL9, MCP-3
Introduction
Asthma and chronic obstructive pulmonary disease (COPD) are common and have a highly negative impact on public health, economic burden and well-being of patients globally.1 Although, it is generally accepted that asthma and COPD are two distinct diseases with their own inflammation patterns, pathophysiological mechanisms, and clinical manifestations,2,3 both are heterogeneous and share common clinical and functional features, so in practice it is not always easy to distinguish between them.4,5 On the other hand, they are very prevalent conditions and could coexist in a person.6,7 The term asthma-overlap syndrome (ACOS) was created to group patients who simultaneously met diagnostic or defining criteria for asthma and COPD and it was suggested that it could be a different syndrome.8 Since no support was found for this concept, the word syndrome was abandoned, and the term asthma-COPD overlap (ACO) was kept as a simple overlap or coexistence,7,9 mainly including patients with early (before 35 years old) diagnosis of asthma who have been exposed to a risk factor of COPD (mainly smoking or biomass) and patients with diagnosis of COPD (non-reversible chronic airflow obstruction and risk factor) who have “asthmatic” traits as episodic wheezing, high bronchodilator response and/or eosinophilia.6,9,10 Consequently, patients with ACO usually present with a combination of reversible airway obstruction, typical of asthma, and persistent airflow limitation, characteristic of COPD. This can be seen on spirometry, which shows reversibility after administration of bronchodilators, which is consistent with asthma, along with persistent basal airflow limitation, more characteristic of COPD.11,12
However, under the term ACO, an even more heterogeneous group of patients is covered who generally have more symptoms, higher risk of exacerbation, accelerated loss of lung function, poorer quality of life and a worse prognosis than those with pure COPD or pure asthma.6,9,10,13 Therefore, in many cases ACO could be more than a simple coexistence and the identification of subgroups, more similar to COPD, more similar to asthma or definitely different from both, could be very important for a more personalized treatment. Thereby, there is great interest in identifying ACO biomarkers, especially those that might reflect the underlying molecular alterations.
Previous studies have shown high eosinophil counts in blood or sputum of ACO patients. In COPD, eosinophils can contribute to airway inflammation, are associated with decline in lung function, increased risk of exacerbations and mortality and, may indicate a favorable response to inhaled corticosteroid (ICS) treatment.14,15 A recent study by Sunata et al, used a multi-omics approach to analyze the inflammatory properties of eosinophils in patients with ACO and eosinophilic COPD, identifying pathways related to antiviral response and cholesterol metabolism as key factors in ACO/COPD.16 Furthermore, Guyatt et al, have suggested a causal relationship between elevated levels of eosinophils and an increased risk of ACO, reinforcing the idea that eosinophils may be a useful marker for identifying and treating this condition.17 On the other hand, Hiles et al found that the disease burden in eosinophilic ACO is high, similar to that of severe eosinophilic asthma and eosinophilic COPD, underscoring the importance of eosinophils in the characterization and management of these diseases.18 In addition to blood eosinophil counts, other biomarkers for ACO include total and specific IgE levels, fractional exhaled nitric oxide (FeNO) and neutrophil-lymphocyte ratio (NLR).19,20
Moreover, recent studies suggest that patients with ACO could have different pathogenic mechanisms,21,22 and the detection of some proteins could be indicative of ACO.23 For instance, elevated levels of NGAL24 and myeloperoxidase (MPO) in sputum can indicate ACO and may be a sign of airway inflammation and injury.23 Also elevated plasma levels of surfactant protein A (SP-A) can indicate overlap between asthma and COPD.23 High levels of periostin and YKL-40 indicate type 2 and neutrophilic inflammation and have been associated with ACO.25 MMP-3 and IL-1RA levels have been found increased in ACO patients compared to asthma patients.26
Recent advances in protein profiling using proximity extension assays allow the simultaneous measurement of several plasma proteins involved in inflammatory pathways with high accuracy and reproducibility in the same sample, and reduce variation between disease and healthy groups.27–29 The aim of this study was to compare blood eosinophil counts, IgE, and protein plasma levels between patients with asthma, ACO, COPD, and healthy controls and to analyze their association with the ACO group as potential biomarkers of ACO.
Materials and Methods
Study Participants
Patients were recruited from two reference respiratory health centers in Cartagena and Bogotá, which are representative of adult patients in an urban setting in a middle-income country. The study included a well-characterized group of adult subjects aged 40–90 years with asthma (n=123), COPD (n=100), or ACO (n=74) recruited between February 2018 and March 2020. Healthy controls (n=100) were recruited from the elderly homes during the same period. At the time of sampling, participants were queried about their current and past sociodemographic characteristics, symptoms, comorbidities, smoking habits, environmental exposure, history of allergies, and pharmacological treatments. Physical examination and pulmonary function tests were performed for all participants. The diagnosis of asthma, COPD, or ACO was performed by a pulmonologist according to the GEMA guidelines for asthma, GeseEPOC guidelines for COPD, and consensus GEMA/GESEPOC guidelines for ACO.30 A concomitant diagnosis of asthma and COPD supported a diagnosis of ACO; the diagnosis of asthma was supported by an early onset of symptoms (before 40 years old), episodic wheezing and post-bronchodilator improvement of forced expiratory volume in the first second (FEV1) ≥ 12% and 200 mL or, in patients without a previous diagnosis of asthma, by the presence of episodic wheezing, “high” reversibility [improvement in post-bronchodilator FEV1≥ 15% and 400 mL] and/or blood eosinophil counts ≥ 300 cells/µL). The diagnosis of COPD was supported on non-reversible (post-bronchodilator) airflow obstruction (FEV1/forced vital capacity [FVC] less than 0.7) and a documented risk factor for COPD: smoking history (more than 10 pack-years).30 As recently accepted,31 we included biomass (wood) smoke exposure ≥ 10 years as a risk factor for COPD. The inclusion criteria were as follows: 1) age ≥ 40 years; and 2) clinical diagnosis of asthma, COPD, or ACO confirmed by a pulmonologist according to the aforementioned criteria. Exclusion criteria were exacerbation of asthma or COPD in the last eight weeks, presence of uncontrolled comorbidities such as hypertension, coronary disease, hepatic and/or renal diseases, cancer, treatment with immunosuppressive drugs, human immunodeficiency virus (HIV) infection, report of respiratory or non-respiratory infection in the last eight weeks, and/or being under treatment with monoclonal antibodies. A group of healthy people was included as control. This study complies with ethical principles for medical research stated in the Declaration of Helsinki and was approved by the ethics committees of the University of Cartagena (Nr. 4169722017) and the Fundación Neumológica Colombiana (nr. 232–07122017), and written informed consent was obtained from all the participants.
Clinical and Functional Measurements
Pulmonary function was evaluated using spirometry pre- and post-bronchodilator according to the American Thoracic Society (ATS) guidelines.32 Quality of life was assessed using the COPD Assessment Test (CAT) and the Saint George’s Respiratory Questionnaire (SGRQ). Comorbidities were evaluated using the Charlson comorbidity index.
Sample Collection
Plasma samples were obtained from the IBACO study.33 Blood samples were collected by standard phlebotomy in heparinized tubes at inclusion, and plasma was separated by centrifugation at 1000 × g at 4°C for 15 min and stored at −80°C until analysis. Another sample was collected in an EDTA tube to measure leukocyte cell counts by hemocytometry.
IgE Measurements
Total IgE and specific IgE antibodies to the house dust mites Dermatophagoides pteronyssinus and Blomia tropicalis, a mix of mold species (mx2, Penicillium chrysogenum, Cladosporium herbarum, Aspergillus fumigatus, Alternaria alternata, Candida albicans y Setomelanomma rostrata) and the nematode Ascaris lumbricoides were measured using ImmunoCAP®, following the manufacturer’s instructions (Thermo Fisher, Uppsala, Sweden).
Periostin Measurement
Plasma periostin/OSF-2 levels were measured using a sandwich enzyme-linked immunosorbent assay (ELISA) with capture antibody in the solid phase (Cat. 844441) and detection antibodies (Cat. 844442), using a DuoSet® 2 kit (Cat. DY008, R&D systems). Briefly, 100 µL of plasma was added to each well and incubated with an anti-periostin capture antibody for 2 h in a humid chamber. After washing, the plates were incubated with the detection antibody for 2 h, incubated with streptavidin-HRP solution for 20 min, and washed. The reaction was performed using a solution of H2O2 and tetramethylbenzidine. The plates were read in a microplate reader at 540 nm and 450 nm, and periostin expression values were derived from the standard curve (Multiscan Go, Thermo Fisher).
Proximity Extension Assay
For plasma profiling, the samples were randomly distributed in 96-well plates, and protein levels were measured by Proximity Extension Assay (PEA) using the Target 96 Inflammation Panel (Olink Proteomics, Analysis Service Facility, Boston, USA), which includes a broad selection of proteins established as inflammatory signatures in diverse inflammatory diseases. A total of 67 out of 92 plasma molecules were detected in heparinized plasma (73%). Normalized Protein Levels are expressed as NPX units (log2 scale). The intra- and inter-assay average coefficients of variation (%CV) were 6% and 11%, respectively. Nine samples were removed because they did not meet the quality-control (QC). Twenty-five proteins with values below the limit of detection (LOD) were excluded from the analyses.
Statistical Analysis
Differences between protein levels among the study groups (asthma, COPD, and healthy controls) were first screened by the F-test (ANOVA) using the Olink Insights Stat Analysis Web tool and the non-parametric Kruskal–Wallis (KW) test. Given that some of the proteins with significant differences between groups did not have a normal distribution (Kolmogorov–Smirnov test), we implemented both independent sample t-tests and Mann–Whitney tests to compare protein levels between patients and controls. To determine the ability of different biomarkers to discriminate between ACO and asthma or COPD, receiver operating characteristic (ROC) curves were constructed for each biomarker, the area under the ROC curve was calculated, and the cut-off points were determined using the Youden index. Receiver operating characteristic (ROC) curves were compared using the DeLong test. To adjust for multiple testing, the Benjamini–Hochberg false discovery rate (FDR) correction was applied using the p.adjust function. Logistic regression models were used to determine independent variables between ACO-asthma and ACO-COPD, including protein levels, age, and sex. The model was evaluated in terms of goodness of fit and predictive capacity using the area under the curve. Statistical significance was set at p < 0.05. The effect of age on protein levels was modelled using linear regression. Correlation coefficients between biomarker levels and pulmonary function were calculated using Spearman’s correlation test. Statistical analyses were performed using R version 3.5.3 (https://www.r-project.org/).
Results
Clinical Characteristics and Type 2 Inflammation Biomarkers
A total of 397 adults were included, 123 patients with asthma (69.1% female, mean age: 60.2 ± 10.9 years), 100 patients with COPD (40% female, mean age: 71.9 ± 7.9 years), 74 patients with ACO (41.9% female, mean age: 67.4 ± 10.7 years) and 100 healthy volunteers (63% female, mean age: 56.3 ± 12.9 years). After data QC, 388 participants were included in the analysis. The demographic and clinical characteristics of patients are shown in Table 1. Patients with asthma were more frequently female and showed a higher body mass index and post-bronchodilator reversibility than patients with ACO and COPD (Table 1). Patients with COPD were older and those with ACO had a much higher prevalence of allergic rhinitis than those with COPD. Both COPD and ACO patients per protocol definition, had a post-bronchodilator obstructive pattern in lung function tests (Table 1).
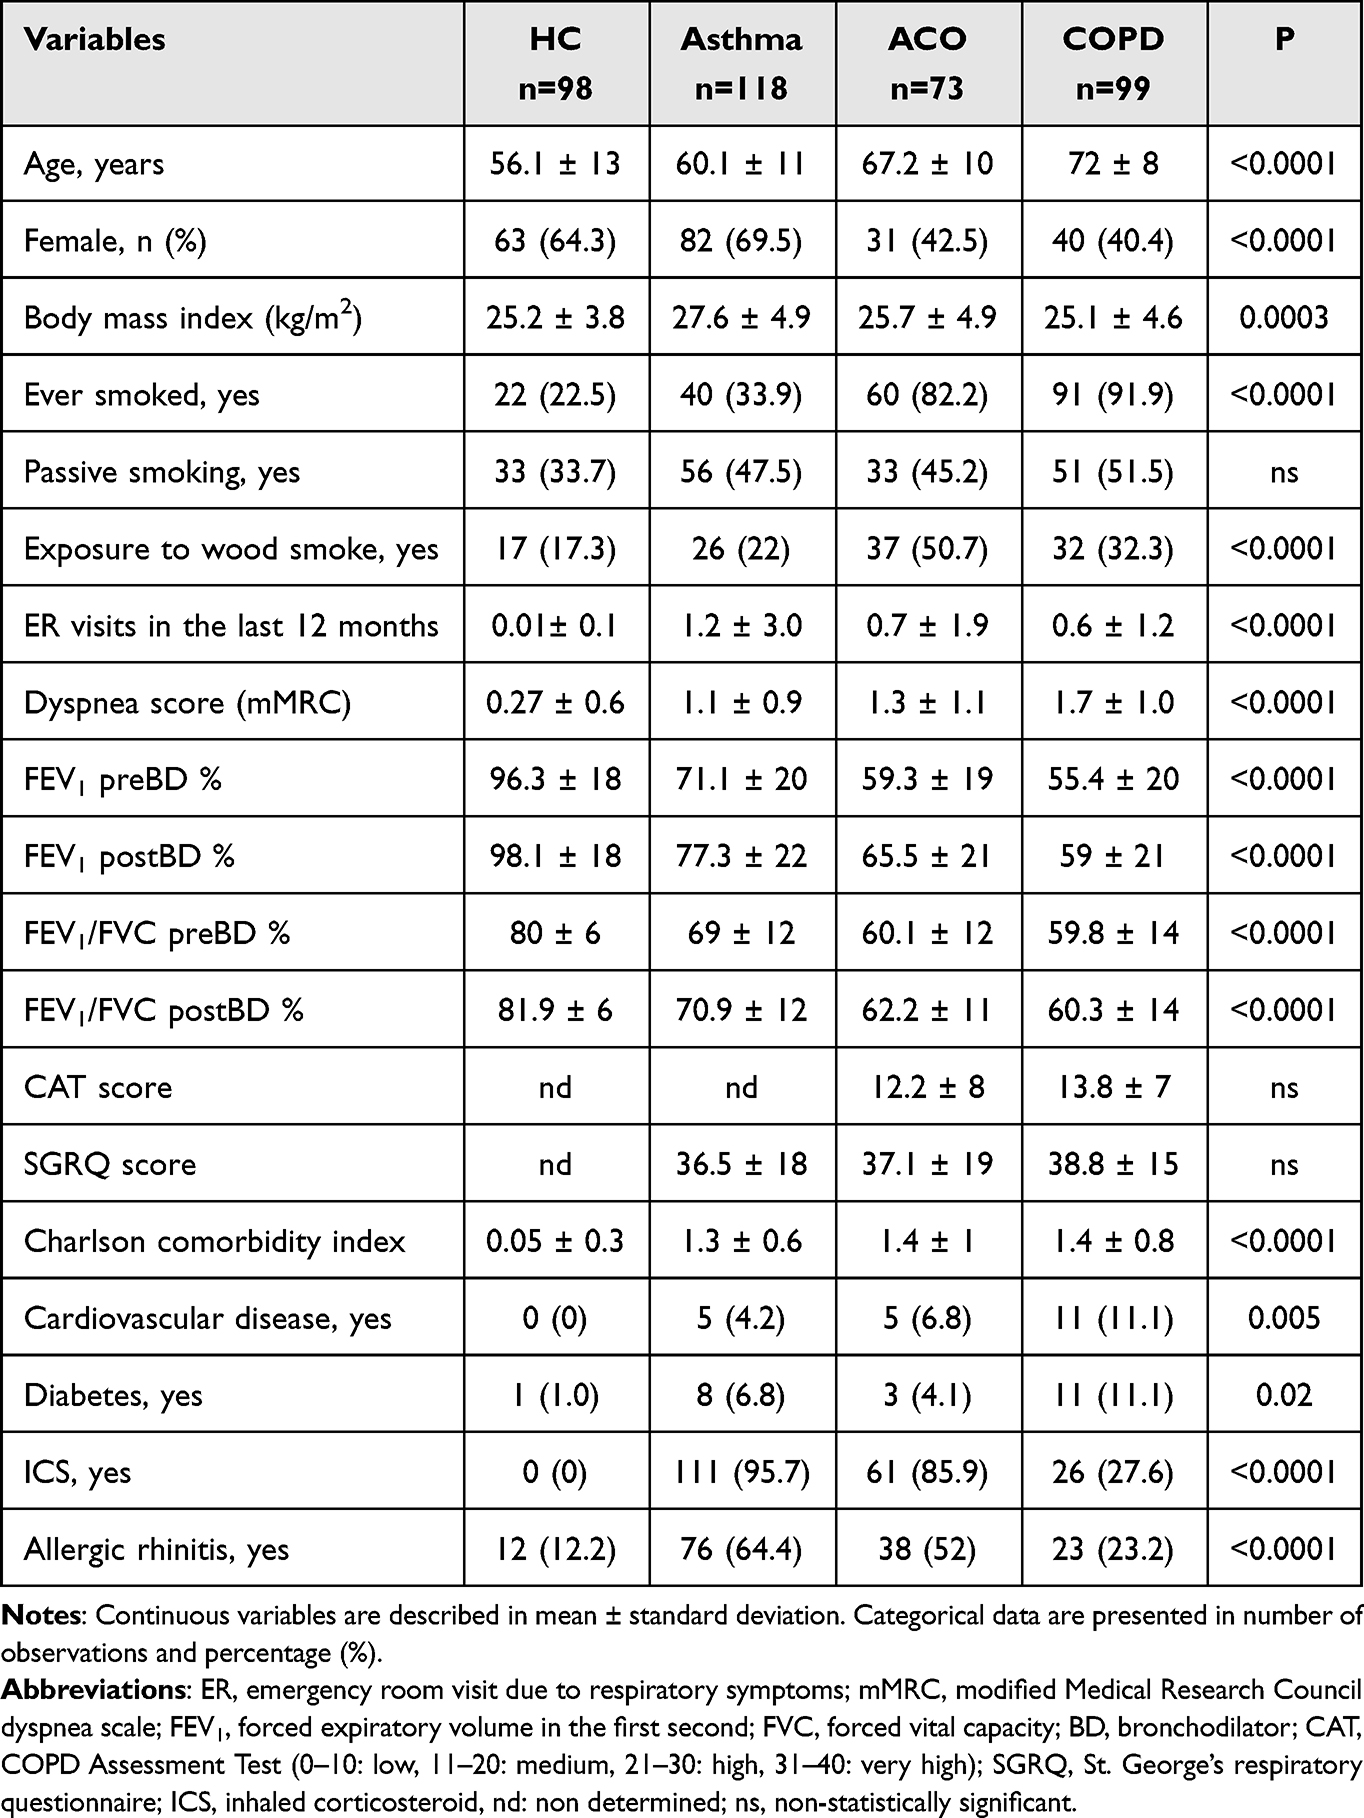 |
Table 1 Demographic and Clinical Characteristics of Study Participants |
There were no differences in peripheral blood leukocyte counts (including eosinophils) among patients with asthma, ACO, and COPD; however, neutrophil, monocyte, and eosinophil counts were higher in the three disease groups than in the HC group (Table 2). There were no differences in the lymphocyte and basophil cell counts between the groups. The neutrophil/lymphocyte ratio (NLR) was significantly higher in ACO patients compared to asthmatics (KW test, Dunn’s corrected p=0.026) and higher in COPD patients than in asthmatics (KW test, Dunn’s corrected p=0.03) (Table 2).
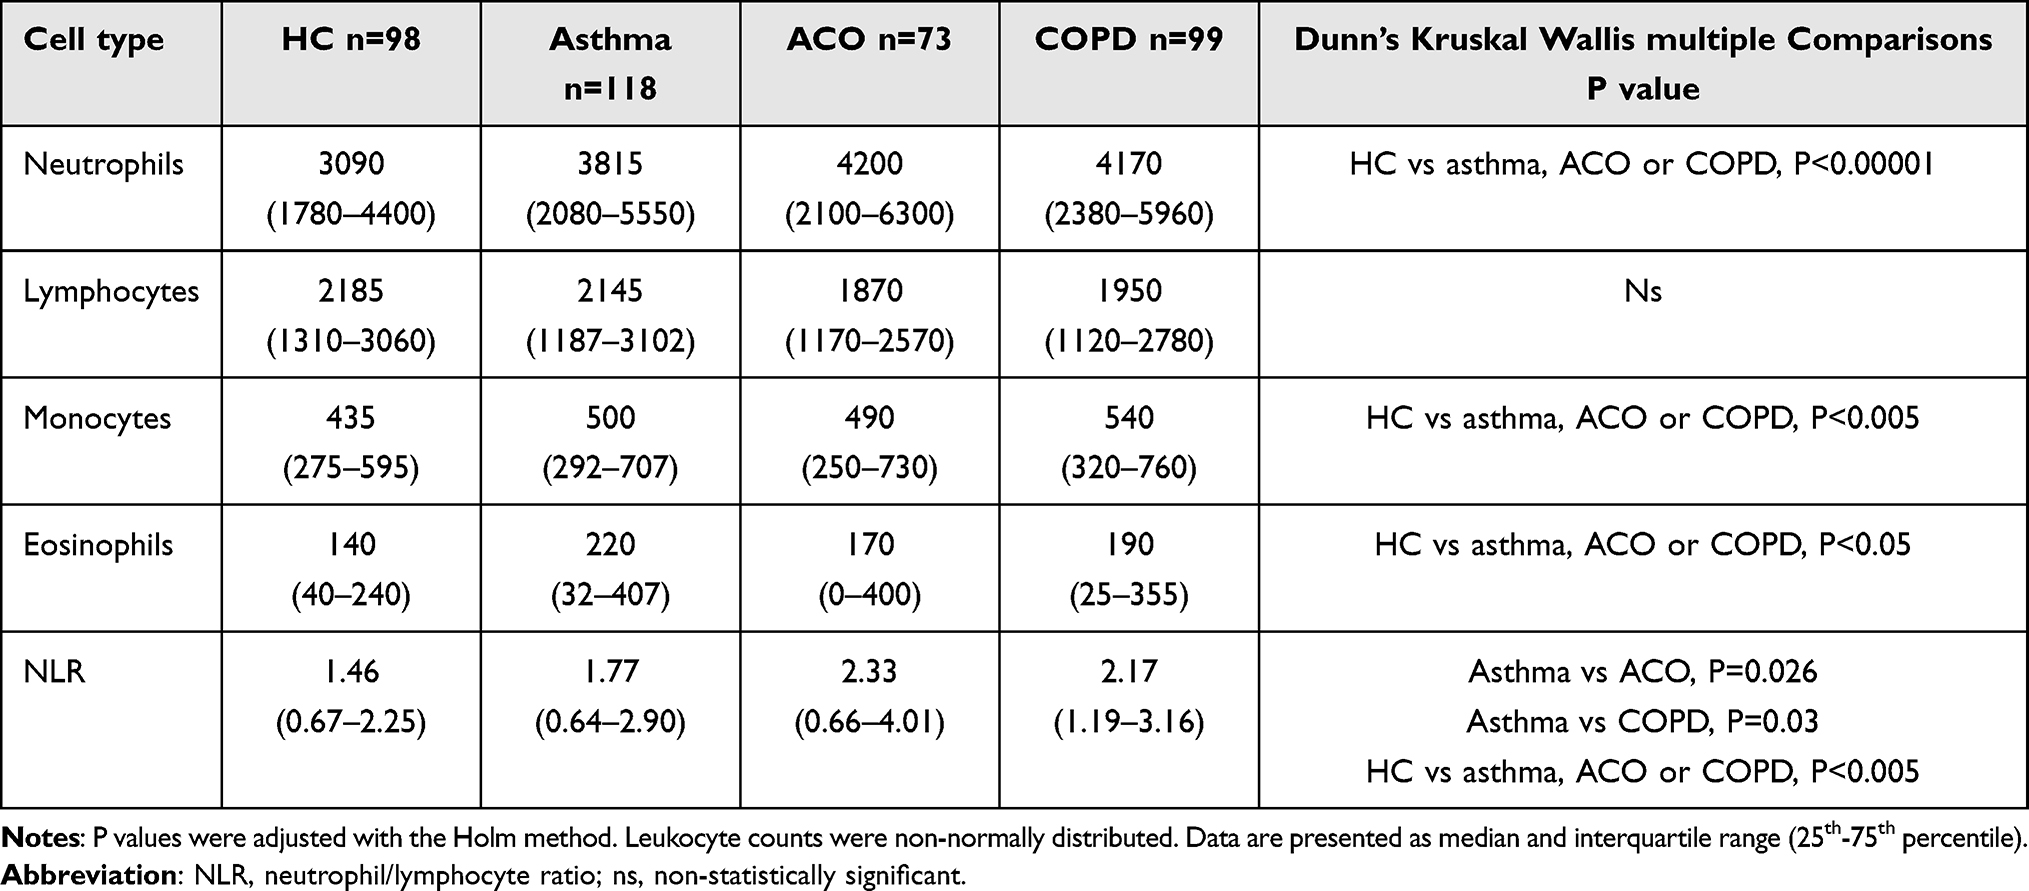 |
Table 2 Peripheral Blood Leukocyte Cell Counts in Asthma, ACO, COPD Patients and Healthy Controls (HC) |
Total IgE levels were similar between ACO and asthmatic patients but were significantly higher in ACO patients than in COPD patients (p<0.001) (Figure 1A), and total IgE was higher in asthmatic compared than in COPD patients (p=0.035). Specific IgE levels to the house dust mite D. pteronyssinus were significantly higher in patients with asthma and ACO than in patients with COPD (Figure 1B). Specific IgE levels to Blomia tropicalis and Ascaris lumbricoides were significantly higher in ACO compared to COPD patients (Supplementary Figure 1). IgE levels to molds were higher in asthma, ACO and COPD patients compared to HC (Supplementary Figure 1). Blood eosinophils counts were higher in all the disease groups compared to HC; however, there were no differences among the disease groups (Figure 1C). We did not find differences in the plasma levels of the type 2 biomarker periostin (Figure 1D).
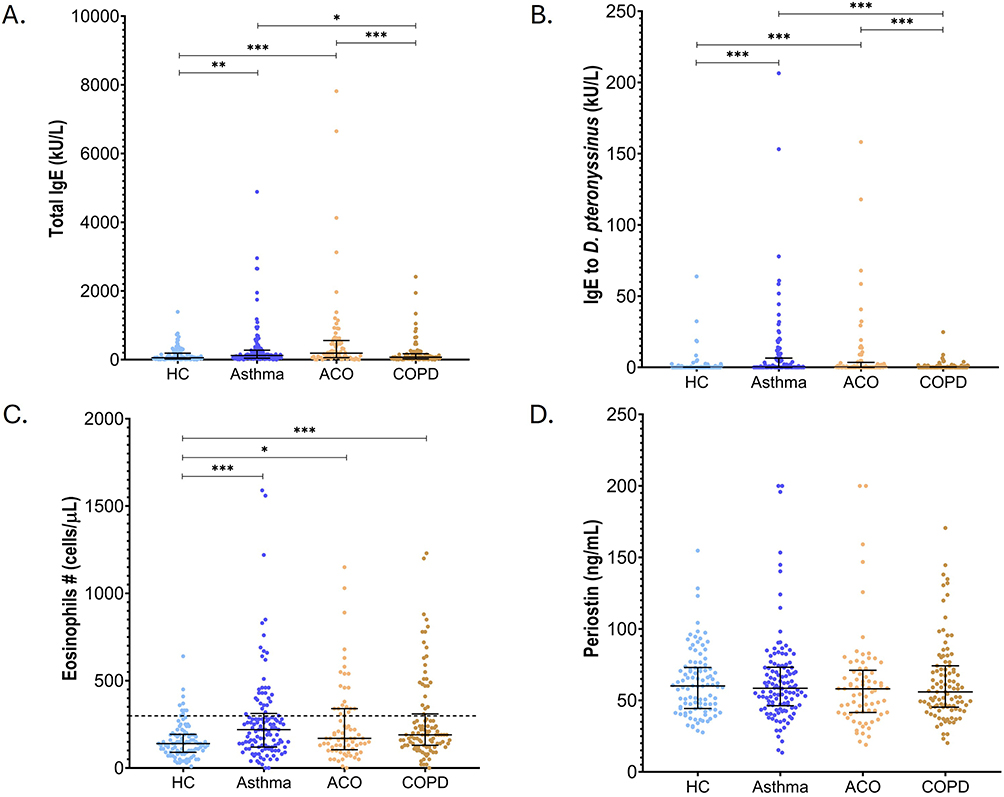 |
Figure 1 Type 2 biomarkers in healthy controls (HC), and patients with Asthma, ACO and COPD. (A) total IgE levels, (B) specific IgE levels to house dust mite Dermatophagoides pteronyssinus, (C) blood eosinophil counts, (D) periostin levels. Each dot corresponds to an individual, error bars indicate median and interquartile range; asterisk denote P values: *p < 0.05; **p < 0.01; ***p < 0.001. |
Comparative Analysis of Protein Plasma Levels in ACO Patients
When comparing the levels of 67 inflammatory biomarkers between the ACO group and HC group, we found higher levels of CCL23, CCL25, CXCL9, MCP-1, MCP-3, MCP-4, OPG, EN-RAGE, and IL-6 and lower levels of TRANCE in ACO patients (p <0.05, after correction for multiple tests and a “fold change” greater than 0.2) (Figure 2A). The levels of CSF-1, CCL3, CCL23, and IL-6 were higher in all patient groups (ACO, asthma, and COPD) than in the HC group. Twenty-one protein plasma mediators that were found to be high in patients with ACO were also found to be high in patients with COPD. There were no mediators that showed significant differences exclusively in ACO patients; and proteins increased in ACO were also found increased in COPD patients (Figure 2B). A comparative analysis of all study groups revealed that CXCL1 and CXCL9 levels were significantly higher in patients with ACO than in those with asthma (Figure 3A and B, respectively). MCP-3 levels were significantly higher in ACO patients than in asthma patients but lower in ACO patients than in COPD patients (Figure 3C). In addition, CDCP1 levels were higher in COPD patients than in ACO and asthma patients (Figure 3D).
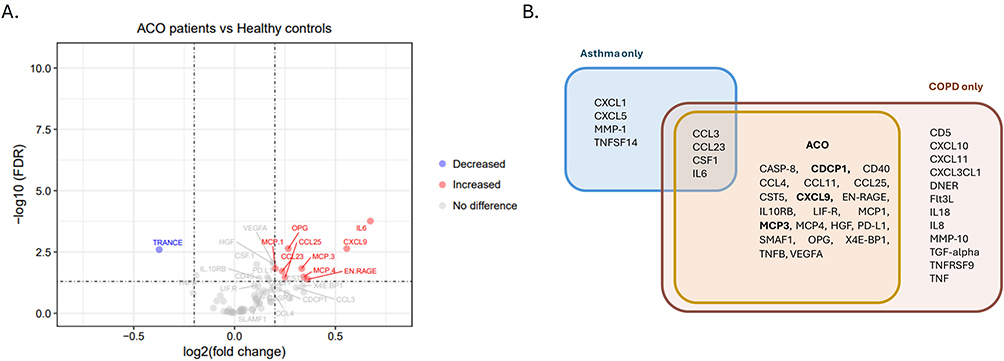 |
Figure 2 Differentially expressed proteins in ACO patients. (A) Volcano plot showing the differences of 67 inflammatory biomarkers between ACO patients and healthy controls. FDR: False Discovery Rate. (B) Venn diagram summarizing differentially expressed proteins in each disease group. |
 |
Figure 3 Comparison of plasma levels in immune mediators in healthy controls (HC) and patients with asthma, ACO and COPD. (A) CXCL1, (B) CXCL9, (C) MCP-3 (D) CDCP1. NPX: Normalized Protein Levels; asterisks denote P values: *P < 0.05; **P < 0.01; ***P < 0.001. |
Associations of Plasma Inflammatory Mediators in Adjusted Models and Age Effects
To determine the variables related to the presence of ACO versus asthma, protein levels, age, and gender were modelled using logistic regression. CXCL1 (OR 2.1; 95% CI (1.2–3.7]; p=0.005], CXCL9 (OR 1.58; 95% CI (1.01–2.48); p=0.041], and male sex (OR 2.3; 95% CI (1.5–5.7); p=0.001] were significantly associated with the presence of ACO (Table 3). Regarding the variables associated to the presence of ACO vs COPD, we found that CDCP1 levels [OR 0.47; 95% CI (0.27–0.82); p=0.008] and age over 60 years OR 0.25 95% CI (0.11–0.57); p=0.001] were negatively associated with ACO (Table 4). The predictive capacity of these models was evaluated in terms of the area under the ROC curve for ACO vs asthma (AUC=0.75, Hosmer-Lemeshow test p=0.28) and ACO vs COPD (AUC=0.73, Hosmer-Lemeshow test p = 0.37) (Figure 4A and B). We then performed AUC curve analysis stratifying the patients below and above the age of 60 years and found that CXCL9 could discriminate ACO from asthma in individuals older than 60 years, whereas MCP-3 could discriminate ACO from COPD in patients aged < 60 years (Figure 5A and B).
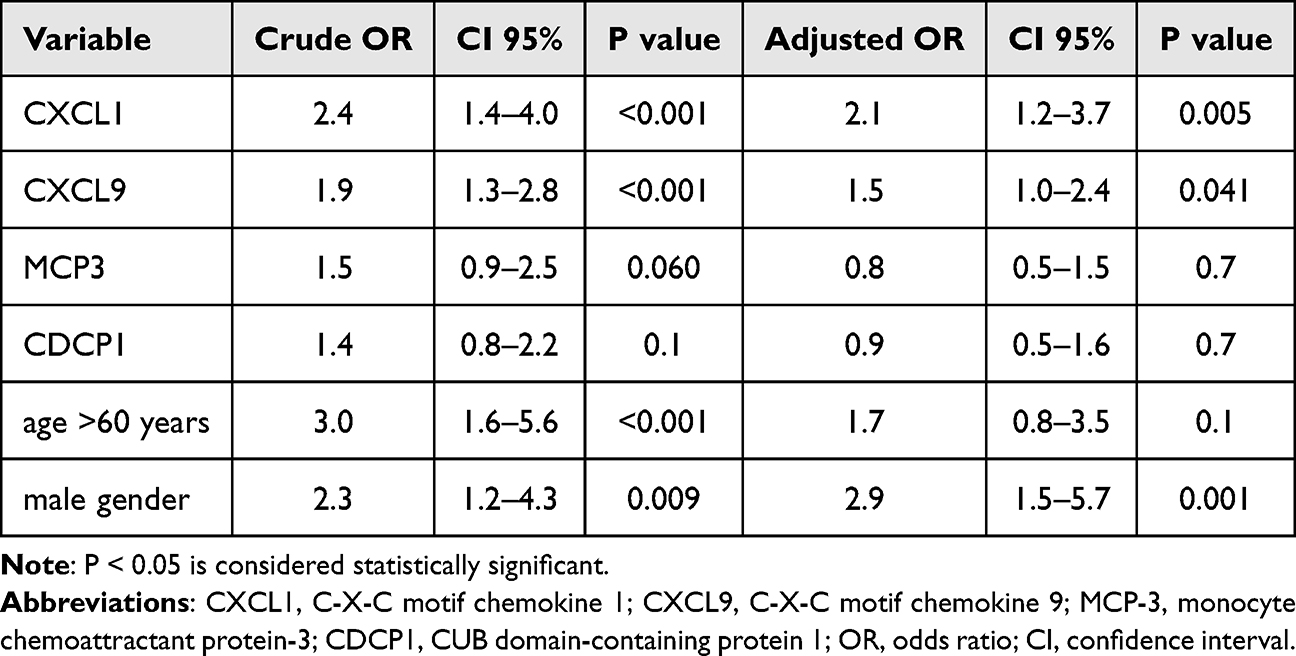 |
Table 3 Logistic Regression Analysis for the Association of Explanatory Variables (CXCL1, CXCL9, MCP-3 and CDCP1) with the Presence of Asthma Vs ACO |
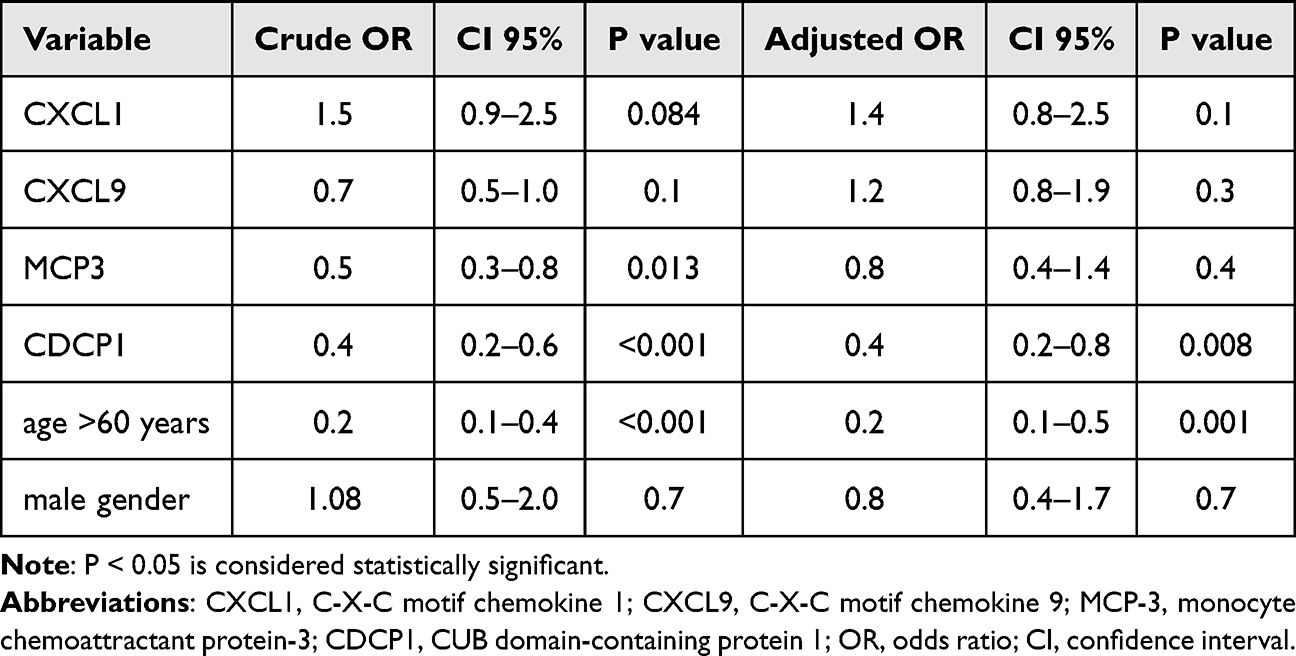 |
Table 4 Logistic Regression Analysis for the Association of Explanatory Variables (CXCL1, CXCL9, MCP-3 and CDCP1) with the Presence of COPD Vs ACO |
 |
Figure 4 Predictive capacity of the models for (A) Asthma vs ACO and (B) COPD vs ACO. |
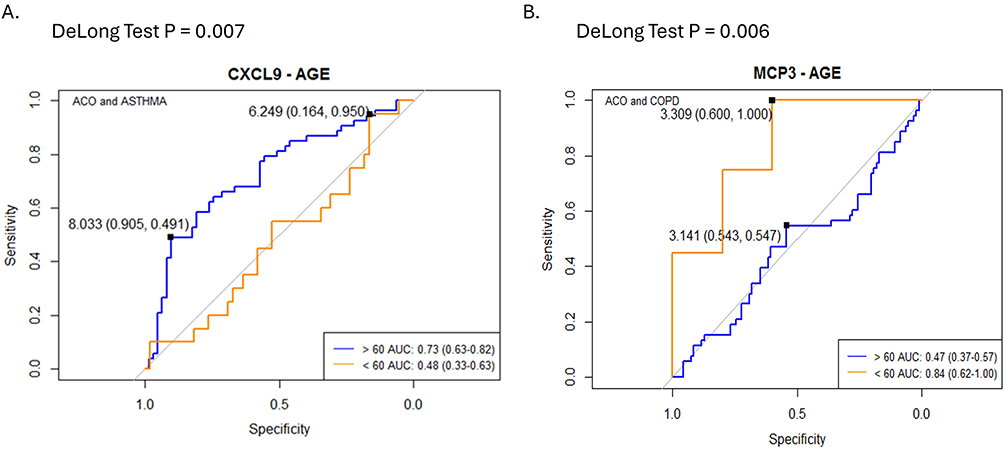 |
Figure 5 ROC curves for the predictive capacity of plasma mediators to discriminate respiratory phenotypes according to the age of patients: (A) CXCL9 in ACO vs Asthma. (B) MCP-3 in ACO vs COPD. Blue line indicates results in subjects with age above 60 years old and Orange line indicates results in subjects with age below 60 years old. The DeLong test P value denotes the difference between the AUC curves.Plasma levels of CXCL9 and MCP-3 are increased in asthma-COPD overlap (ACO) patients. |
Correlation of Plasma Inflammatory Mediators with Functional Lung Tests and Cell Counts
CXCL9, MCP-3, and CDCP1 levels were inversely correlated with the degree of lung obstruction in the entire sample (Table 5). A sub-analysis of with ACO patients (n=73) also showed an inverse and significant correlation between FEV1/FVC and plasma protein levels of MCP-3 (r = −0.32, p=0.006) and CDCP1 (r = −0.34, P=0.004). CXCL1 levels were not correlated with the results of lung function tests. Regarding cell counts, we found a direct and significant correlation between MCP-3 levels and the number of blood neutrophil counts (r=0.28, p= 1.00 × 10⁻⁸), blood monocyte counts (r=0.26, p= 2 × 10⁻⁷), and blood eosinophil counts (r=0.14, p=0.006). CDCP1 levels were directly correlated with blood eosinophil counts (r=0.16, p=0.001) and inversely correlated with lymphocyte cell counts (r= −0.13, p=0.01). Similarly, chemokine CXCL9 levels were directly correlated with monocyte counts (r=0.18, p=0.0004) and inversely correlated with lymphocyte counts (r= −0.18, p=0.0005). CXCL1 levels were not associated with peripheral blood leukocyte count.
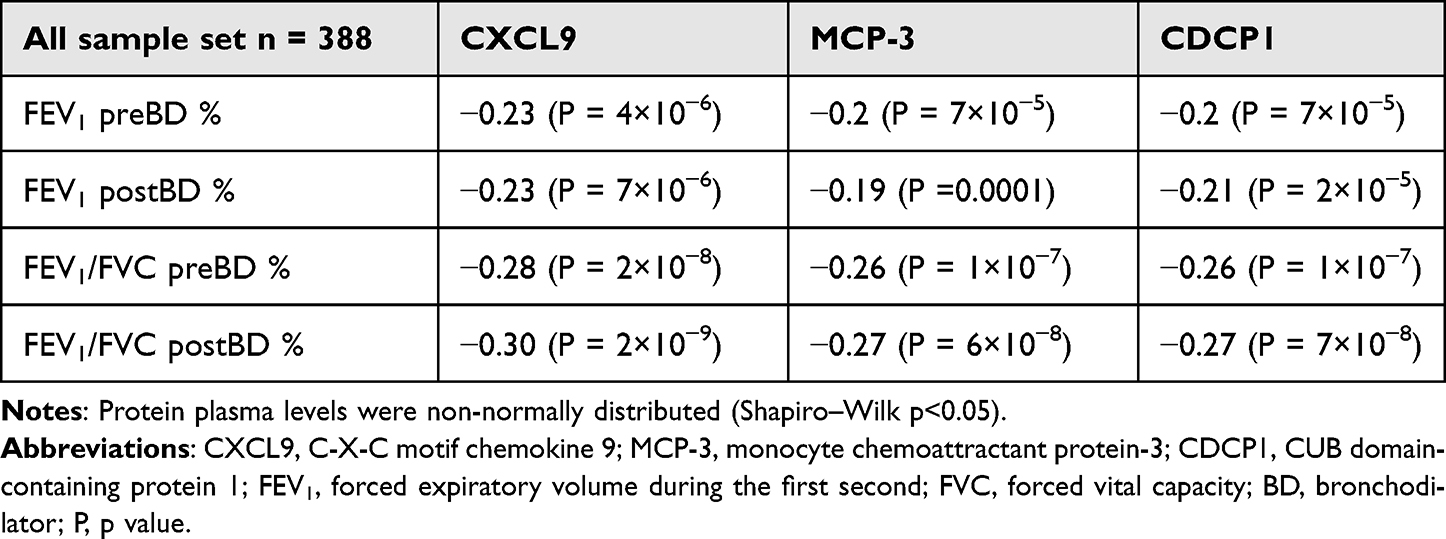 |
Table 5 Spearman Correlation Coefficients Between Protein Levels of CXCL9, MCP-3 and CDCP1 with Lung Function Measurements |
Discussion
In this study, we analyzed the levels of type 2 immune mediators and other 67 inflammatory proteins in adult patients diagnosed with asthma, COPD, or ACO and in healthy individuals from the urban environment of a middle-income country. We novelly found that CXCL9 and MCP-3 levels are increased in ACO patients; CXCL9 could discriminate ACO from asthma patients and MCP-3 from COPD. In addition, our results demonstrated that there were no differences in the levels of the evaluated type 2 biomarkers (eosinophils, total IgE, specific IgE, and periostin) between patients with asthma and ACO. However, the total and specific IgE levels were significantly higher in patients with ACO than in those with COPD, confirming that IgE measurements may be included in the diagnostic approach for patients with suspected ACO, as previously suggested by Hersh et al.34 Interestingly, we found that blood eosinophil counts did not differ between the disease groups, in contrast to recent ACO reviews6,9,10,13 and indeed, several ACO and COPD patients had blood eosinophil counts above the threshold for defining eosinophilia (Figure 1C). This finding is very interesting and aligns with the observation that not only asthma, a significant proportion of COPD and ACO patients have eosinophilia35–37 which has been recognized as eosinophilic phenotype. Increased blood eosinophil counts are recognized as an indicator of corticosteroid sensitivity and suggests that this cell type may be important in disease physiopathology.15,38,39 The significant difference between the neutrophil/lymphocyte ratio (NLR) of patients with ACO and those with asthma (Table 2) suggested that ACO involves a mixed inflammatory profile with high blood neutrophil counts, decreased blood lymphocyte counts, and prominent elevation of serum IgE levels. This mixed Th2 and non-Th2 inflammatory pattern has been described.40
When we further compared the levels of 67 inflammatory plasma proteins, we did not find any exclusive inflammatory mediators of ACO. Indeed, 21 inflammatory biomarkers were elevated in patients with ACO, which was also elevated in patients with COPD (Figure 2B). Comparative analysis, after adjusting for covariates, revealed that CXCL9, MCP-3, and CDCP1 were associated with the ACO phenotype (Table 3 and Table 4). Because COPD patients are older than those in other disease groups, we investigated the effect of age and found that the predictive capability of plasma protein mediators can be influenced by age. Indeed, CXCL9 and MCP-3 may help differentiate ACO from asthma and COPD, depending on whether the patients were below or above 60 years of age (Figure 5). Some protein plasma mediators change during aging, but it seems that in patients with COPD, these changes occur at different rates, promoting systemic inflammation.33 We also found a statistically significant correlation between the levels of CXCL9, MCP-3, and CDCP1 and the degree of lung obstruction (Table 5), suggesting that the increase in these proteins could be mechanistically implicated in airway disease. A previous study by our group found a significant and direct correlation between plasma levels of CXCL9, MCP-3 and CDCP1,33 but future cell functional studies are needed to evaluate the interaction between these molecules and their exact role in lung inflammation.
CXCL9 is a chemokine, also known as a Monokine Induced by Gamma interferon (MIG) which plays a role in chemotaxis and lymphocyte differentiation.41 Its effects are mediated by signaling pathways activated by its receptor, CXCR3, which acts mainly on lymphocytes, cytotoxic T cells, natural killer (NK) cells, and macrophages. This chemokine promotes type 1 inflammation through CXCR3, activating T-bet and RORγ, which leads to polarization of Th1, Th17, and M1 macrophages. CXCL9, released from bronchial epithelial cells in response to IFN-γ, is glucocorticoid-insensitive and has great relevance in COPD,42 which was found to be increased in the serum and sputum.43,44 Increased CXCL9 levels in COPD may play a role in disease pathogenesis by regulating T cell recruitment to the lungs.44 Increased expression of CXCL9 transcripts has been detected in alveolar macrophages of COPD patients, especially in non-smokers45 and several transcript datasets.46 Hao et al found that CXCL9 levels were markedly increased in the serum of patients with COPD and were associated with the extent of small airway disease and emphysema identified on high-resolution chest CT scans.43 Some studies have associated CXCL9 levels with vascular calcification and arteriosclerosis in COPD patients,47 suggesting that they participate in the aging mechanisms of COPD progression. Moreover, the release of CXCL9 from both airway epithelial cells and smooth muscles can be potentiated by synergistic interactions between TNFα and IFN-γ. In our study, we confirmed that plasma levels of CXCL9 were increased in patients with ACO (Figure 3B), showing a positive correlation with lung function (Table 5), suggesting that CXCL9 is a better marker of this pathway, since TNFα and IFNγ levels do not discriminate between these patient groups (data not shown). Our findings are interesting because CXCL9 can be inhibited by phosphodiesterase 4 inhibitors (roflumilast and tanimilast)48,49 and was partially decreased by formoterol.50 Janus Kinases inhibitors (JAKinibs) can also suppress steroid-insensitive CXCL9 production in airway epithelial cells from COPD patients with COPD.51
MCP-3 is a CC chemokine that binds to chemokine receptors CCR1, CCR2, CCR3, CCR5, and CCR10.52 It is expressed in many cell types including stromal cells, keratinocytes, airway smooth muscle cells, parenchymal cells, fibroblasts, and leukocytes. MCP-3 mainly acts as a chemoattractant for leukocytes including monocytes, eosinophils, basophils, dendritic cells (DCs), neutrophils, NK cells, and activated T lymphocytes. This protein has pleiotropic activities in both type 1 and type 2 inflammations.53 It has been described as a mediator of allergic inflammation and polymorphic variants of its gene have been associated with an increased risk of asthma.54 MCP-3 has been implicated in the induction of asthma in animal models55 and has been found to increase in patients with moderate to severe asthma.56 We previously described the increased expression of MCP-3 in COPD patients33 and in the present study, we found that this chemokine was also increased in ACO patients (Figures 2A and 3C) and could discriminate ACO from COPD patients, especially in those aged < 60 years (Figure 5B). Other authors have also reported increased MCP-3 levels in COPD patients,57 suggesting that smoking upregulates a systemic pattern of neutrophil and macrophage chemoattractant expression, which correlates with goblet cell hyperplasia.58 In our study, we found differences in several inflammatory markers in patients with ACO, including two other chemokines (MCP-1 and MCP-4) related to MCP-3 (Figure 2B), which replicates, at the protein level, the results of previous studies suggesting the existence of a transcriptomic inflammatory signature with CXCL9 and MCP-3 in COPD.59
In this study, we also report, for the first time, a significant increase in CDCP1 levels in COPD patients compared to those in ACO and asthma patients (Figure 3D). CDCP1 is a 140 kDa cell surface transmembrane glycoprotein that can be cleaved to promote the degradation of the extracellular matrix and cell migration. CDCP1 (aka. CD318) is also a ligand for CD6, a costimulatory receptor that promotes T-cell activation, proliferation, migration, and barrier integrity.60 The CD6 costimulatory receptor increases the number of ILC2 cells in human airways and is a candidate for targeted therapy in uncontrolled asthma.61 Elevated serum CDCP1 levels are associated with poor asthma control62 and other inflammatory diseases, with a predominance of dysregulated Th1 and Th17 responses. Indeed, IFN-γ has been shown to positively regulate CDCP1 in tissue microenvironments that are rich in Th1 cytokines. Our results confirmed that CDCP1 levels significantly increased in patients with COPD, although intermediate levels were observed in patients with ACO (Figure 3D). Further studies are needed to elucidate how CDCP1 contributes to airway disease in patients with COPD.
As mentioned above, the detected protein mediators are produced by several cell types, and we cannot dissect the origin of the levels measured in plasma. However, we performed correlation analysis to evaluate if they could be associated with any leukocyte counts. We found a direct and significant correlation between MCP-3 levels, neutrophil and eosinophil cell counts, CXCL9 levels, and monocyte cell counts, whereas an inverse relationship was observed with lymphocyte counts. CDCP1, which is elevated in patients with COPD, showed a direct correlation with blood eosinophil counts, suggesting that a dichotomy of type 2 and type 1 immune profiles and dysregulated mediators in ACO and COPD are pleiotropic molecules capable of promoting mixed inflammatory profiles.
Our study has the limitations of its cross-sectional design and those recognized for the definitions and diagnosis of asthma, COPD, and ACO. Asthma is, per definition, a variable condition, and consequently, biomarkers related to these conditions are expected to vary. Since ACO diagnosis results from a sum of asthma and COPD diagnoses (-using predefined functional tests, clinical and cellular criteria-), it would be expected that an overlap of mechanisms and biomarkers would occur, making ACO patients very heterogeneous and representing different phenotypes of asthma or COPD.10 Albeit all samples analyzed in this study were collected in patients with at least four weeks without exacerbations or hospital admissions due to respiratory symptoms, asthmatic patients were more frequently using inhaled corticosteroids (ICS) at high doses compared to ACO and COPD patients (Supplementary Table 1). There is a possibility that use of higher doses of ICS of oral corticosteroids in asthmatic patients may have influenced the plasma profiles in this patient group.
Moreover, since blood samples were obtained only at inclusion, our results should be interpreted with caution considering that they represent a unique time point. Also, blood samples may not reflect local inflammatory changes in the airways, and since we here did not evaluate protein profiles in induced sputum or bronchoalveolar lavage, more studies are needed to evaluate if ACO patients have altered protein profiles that are detectable in airway samples and if these protein profiles are modified during exacerbation or in response to treatments.
Conclusion
In conclusion, inflammatory biomarkers such as CXCL9 could help to differentiate ACO from asthma and MCP-3 could help to differentiate ACO from COPD. In this study, total IgE and specific IgE levels to house dust mites were higher in ACO compared to COPD patients; but there were no differences in blood eosinophil counts or periostin levels among the disease groups. At the plasma protein levels, our ACO patients seemed to predominantly represent a COPD inflammatory profile rather than an asthma one or a distinct inflammatory profile. We confirmed that levels of inflammatory chemokines in plasma are inversely correlated with the degree of lung obstruction. Therapeutic approaches targeting chemokine expression (CXCL9 and MCP-3) may be promising in ACO patients. Future studies elucidating the molecular mechanisms on how they participate in ACO could aid in the development of preventive and therapeutic interventions for personalized medicine.
Acknowledgments
We thank all the individuals who participated in this study. Mileidis Avila for support during sample collection in Cartagena. Ana Carolina Mercado and Patricia Parada for project coordination, recruitment, sample handling, and storage in Cartagena and Bogotá. Dina Ortiz for support with spirometry. Hector Espinoza for support with informatics analysis and database curation. Dr. Emily Rincón and the medical staff collaborated with the patients’ examinations and questionnaires.
Funding
This study was funded by the Ministry of Science of the Republic of Colombia (Grant 756-2017) and the University of Cartagena. Jose Miguel Escamilla received funding as a Young Regional Talent of Minciencias (Contract 806-2018). María De Vivero received funding as doctoral student from the Ministry of Science (Programa de Becas de Excelencia Doctoral del Bicentenario BB 2019-01).
Disclosure
Dr Kevin Llinás-Caballero reports grants from Ministry of Science of the Republic of Colombia, grants from University of Cartagena, during the conduct of the study. Dr Nathalie Acevedo reports grants from Ministry of Science, Republic of Colombia, during the conduct of the study. The author(s) report no conflicts of interest in this work.
References
1. Chen S, Kuhn M, Prettner K, et al. The global economic burden of chronic obstructive pulmonary disease for 204 countries and territories in 2020-50: a health-augmented macroeconomic modelling study. Lancet Glob Health. 2023;11(8):e1183–e1193. doi:10.1016/S2214-109X(23)00217-6
2. Buist AS. Similarities and differences between asthma and chronic obstructive pulmonary disease: treatment and early outcomes. Eur Respir J Suppl. 2003;39:30s–35s. doi:10.1183/09031936.03.00404903
3. Barnes PJ. Cellular and molecular mechanisms of asthma and COPD. Clin Sci. 2017;131(13):1541–1558. doi:10.1042/CS20160487
4. McDonald VM, Gibson PG. Treatable traits in asthma and COPD. Arch Bronconeumol. 2022;58(8):583–585. doi:10.1016/j.arbres.2021.07.003
5. Irusen EM, Meiring D, Koegelenberg CFN. Asthma-COPD overlap and asthma progressing to COPD: are we using the right diagnostic approaches and pathways? Respirology. 2024;29(9):756–758. doi:10.1111/resp.14731
6. Mekov E, Nunez A, Sin DD, et al. Update on asthma-COPD overlap (ACO): a narrative review. Int J Chron Obstruct Pulmon Dis. 2021;16:1783–1799. doi:10.2147/COPD.S312560
7. Asthma MDM. COPD and their overlap: coexistence or something more? Eur Respir J. 2021;58(5). doi:10.1183/13993003.01329-2021
8. Gibson PG, Simpson JL. The overlap syndrome of asthma and COPD: what are its features and how important is it? Thorax. 2009;64(8):728–735. doi:10.1136/thx.2008.108027
9. Fouka E, Papaioannou AI, Hillas G, Steiropoulos P. Asthma-COPD overlap syndrome: recent insights and unanswered questions. J Pers Med. 12(5). doi:10.3390/jpm12050708
10. Perez-de-Llano L, Cosio BG. group Cs. Asthma-COPD overlap is not a homogeneous disorder: further supporting data. Respir Res. 18(1):183. doi:10.1186/s12931-017-0667-x
11. Lange P, Colak Y, Ingebrigtsen TS, Vestbo J, Marott JL. Long-term prognosis of asthma, chronic obstructive pulmonary disease, and asthma-chronic obstructive pulmonary disease overlap in the Copenhagen City Heart study: a prospective population-based analysis. Lancet Respir Med. 2016;4(6):454–462. doi:10.1016/S2213-2600(16)00098-9
12. Marcon A, Locatelli F, Dharmage SC, et al. The coexistence of asthma and COPD: risk factors, clinical history and lung function trajectories. Eur Respir J. 2021;58(5). doi:10.1183/13993003.04656-2020
13. Alsayed AR, Abu-Samak MS, Alkhatib M. Asthma-COPD overlap in clinical practice (ACO_CP 2023): toward precision medicine. J Pers Med. 2023;13(4). doi:10.3390/jpm13040677
14. David B, Bafadhel M, Koenderman L, De Soyza A. Eosinophilic inflammation in COPD: from an inflammatory marker to a treatable trait. Thorax. 2021;76(2):188–195. doi:10.1136/thoraxjnl-2020-215167
15. Tashkin DP, Wechsler ME. Role of eosinophils in airway inflammation of chronic obstructive pulmonary disease. Int J Chron Obstruct Pulmon Dis. 2018;13:335–349. doi:10.2147/COPD.S152291
16. Sunata K, Miyata J, Kawashima Y, et al. Inflammatory profile of eosinophils in asthma-COPD overlap and eosinophilic COPD: a multi-omics study. Front Immunol. 2024;15:1445769. doi:10.3389/fimmu.2024.1445769
17. Guyatt A, John C, Williams AT, et al. Mendelian randomisation of eosinophils and other cell types in relation to lung function and disease. Thorax. 2023;78(5):496–503. doi:10.1136/thoraxjnl-2021-217993
18. Hiles SA, Gibson PG, McDonald VM. Disease burden of eosinophilic airway disease: comparing severe asthma, COPD and asthma-COPD overlap. Respirology. 2021;26(1):52–61. doi:10.1111/resp.13841
19. Kobayashi S, Hanagama M, Yamanda S, Ishida M, Yanai M. Inflammatory biomarkers in asthma-COPD overlap syndrome. Int J Chron Obstruct Pulmon Dis. 2016;11:2117–2123. doi:10.2147/COPD.S113647
20. Ma H, Yang L, Liu L, et al. Using inflammatory index to distinguish asthma, asthma-COPD overlap and COPD: a retrospective observational study. Front Med. 2022;9:1045503. doi:10.3389/fmed.2022.1045503
21. Chen YC, Chang YP, Huang KT, Hsu PY, Hsiao CC, Lin MC. Unraveling the pathogenesis of asthma and chronic obstructive pulmonary disease overlap: focusing on epigenetic mechanisms. Cells. 11(11). doi:10.3390/cells11111728
22. Dasgupta S, Ghosh N, Bhattacharyya P, Roy Chowdhury S, Chaudhury K. Metabolomics of asthma, COPD, and asthma-COPD overlap: an overview. Crit Rev Clin Lab Sci. 2023;60(2):153–170. doi:10.1080/10408363.2022.2140329
23. Iwamoto H, Gao J, Koskela J, et al. Differences in plasma and sputum biomarkers between COPD and COPD-asthma overlap. Eur Respir J. 2014;43(2):421–429. doi:10.1183/09031936.00024313
24. Gao J, Iwamoto H, Koskela J, et al. Characterization of sputum biomarkers for asthma-COPD overlap syndrome. Int J Chron Obstruct Pulmon Dis. 2016;11:2457–2465. doi:10.2147/COPD.S113484
25. Shirai T, Hirai K, Gon Y, et al. Combined assessment of serum periostin and YKL-40 may identify asthma-COPD overlap. J Allergy Clin Immunol Pract. 2019;7(1):134–145e1. doi:10.1016/j.jaip.2018.06.015
26. Takada K, Suzukawa M, Tashimo H, et al. Serum MMP3 and IL1-RA levels may be useful biomarkers for detecting asthma and chronic obstructive pulmonary disease overlap in patients with asthma. World Allergy Organ J. 2023;16(11):100840. doi:10.1016/j.waojou.2023.100840
27. Sun BB, Chiou J, Traylor M, et al. Plasma proteomic associations with genetics and health in the UK Biobank. Nature. 2023;622(7982):329–338. doi:10.1038/s41586-023-06592-6
28. Assarsson E, Lundberg M, Holmquist G, et al. Homogenous 96-plex PEA immunoassay exhibiting high sensitivity, specificity, and excellent scalability. PLoS One. 2014;9(4):e95192. doi:10.1371/journal.pone.0095192
29. Lundberg M, Eriksson A, Tran B, Assarsson E, Fredriksson S. Homogeneous antibody-based proximity extension assays provide sensitive and specific detection of low-abundant proteins in human blood. Nucleic Acids Res. 2011;39(15):e102. doi:10.1093/nar/gkr424
30. Plaza V, Alvarez F, Calle M, et al. Consensus on the asthma-COPD overlap syndrome (ACOS) Between the Spanish COPD Guidelines (GesEPOC) and the Spanish Guidelines on the Management of Asthma (GEMA). Arch Bronconeumol. 2017;53(8):443–449. doi:10.1016/j.arbres.2017.04.002
31. Torres-Duque CA, Jaramillo C, Caballero A, et al. Chronic obstructive pulmonary disease related to wood smoke and impact of the combined exposure to tobacco. IJTLD Open. 2024;1(3):130–135. doi:10.5588/ijtldopen.24.0004
32. Graham BL, Steenbruggen I, Miller MR, et al. Standardization of spirometry 2019 update an official American thoracic society and European respiratory society technical statement. Am J Respir Crit Care Med. 2019;200(8):e70–e88. doi:10.1164/rccm.201908-1590ST
33. Acevedo N, Escamilla-Gil JM, Espinoza H, et al. Chronic obstructive pulmonary disease patients have increased levels of plasma inflammatory mediators reported upregulated in severe COVID-19. Front Immunol. 2021;12:678661. doi:10.3389/fimmu.2021.678661
34. Hersh CP, Zacharia S, Prakash Arivu Chelvan R, et al. Immunoglobulin E as a biomarker for the overlap of atopic asthma and chronic obstructive pulmonary disease. Chronic Obstr Pulm Dis. 2020;7(1):1–12. doi:10.15326/jcopdf.7.1.2019.0138
35. Abe Y, Suzuki M, Kimura H, et al. Blood eosinophil count variability in chronic obstructive pulmonary disease and severe asthma. Allergol Int. 2023;72(3):402–410. doi:10.1016/j.alit.2022.11.012
36. Chen TT, Lee KY, Chang JH, et al. Prediction value of neutrophil and eosinophil count at risk of COPD exacerbation. Ann Med. 2023;55(2):2285924. doi:10.1080/07853890.2023.2285924
37. Miravitlles M, Soler-Cataluna JJ, Soriano JB, et al. Determinants of blood eosinophil levels in the general population and patients with COPD: a population-based, epidemiological study. Respir Res. 2022;23(1):49. doi:10.1186/s12931-022-01965-3
38. Komura M, Sato T, Suzuki Y, et al. Blood eosinophil count as a predictive biomarker of chronic obstructive pulmonary disease exacerbation in a real-world setting. Can Respir J. 2023;2023:3302405. doi:10.1155/2023/3302405
39. Liu H, Xie Y, Huang Y, et al. The association between blood eosinophils and clinical outcome of acute exacerbations of chronic obstructive pulmonary disease: a systematic review and meta-analysis. Respir Med. 2024;222:107501. doi:10.1016/j.rmed.2023.107501
40. Pérez de Llano, de Llano LP BG, Iglesias A, et al. Mixed Th2 and non-Th2 inflammatory pattern in the asthma–COPD overlap: a network approach. Int J Chron Obstruct Pulmon Dis. 2018;13:591–601. doi:10.2147/COPD.S153694
41. Tokunaga R, Zhang W, Naseem M, et al. CXCL9, CXCL10, CXCL11/CXCR3 axis for immune activation - A target for novel cancer therapy. Cancer Treat Rev. 2018;63:40–47. doi:10.1016/j.ctrv.2017.11.007
42. Henrot P, Prevel R, Berger P, Dupin I. Chemokines in COPD: from implication to therapeutic use. Int J mol Sci. 20(11):2785. doi:10.3390/ijms20112785
43. Hao W, Li M, Pang Y, Du W, Huang X. Increased chemokines levels in patients with chronic obstructive pulmonary disease: correlation with quantitative computed tomography metrics. Br J Radiol. 2021;94(1118):20201030. doi:10.1259/bjr.20201030
44. Costa C, Rufino R, Traves SL, ESJR L, Barnes PJ, Donnelly LE. CXCR3 and CCR5 chemokines in induced sputum from patients with COPD. Chest. 2008;133(1):26–33. doi:10.1378/chest.07-0393
45. Han L, Wang J, Ji XB, et al. Transcriptomics analysis identifies the presence of upregulated ribosomal housekeeping genes in the alveolar macrophages of patients with smoking-induced chronic obstructive pulmonary disease. Int J Chron Obstruct Pulmon Dis. 2021;16:2653–2664. doi:10.2147/COPD.S313252
46. Dhamodharan P, Arumugam M. Multiple gene expression dataset analysis reveals toll-like receptor signaling pathway is strongly associated with chronic obstructive pulmonary disease pathogenesis. COPD. 2020;17(6):684–698. doi:10.1080/15412555.2020.1793314
47. Bhatt SP, Nath HP, Kim YI, et al. Centrilobular emphysema and coronary artery calcification: mediation analysis in the SPIROMICS cohort. Respir Res. 2018;19(1):257. doi:10.1186/s12931-018-0946-1
48. Nguyen HO, Schioppa T, Tiberio L, et al. The pde4 inhibitor tanimilast blunts proinflammatory dendritic cell activation by SARS-CoV-2 ssRNAs. Front Immunol. 2021;12:797390. doi:10.3389/fimmu.2021.797390
49. Salvator H, Buenestado A, Brollo M, et al. Clinical relevance of the anti-inflammatory effects of roflumilast on human bronchus: potentiation by a long-acting beta-2-agonist. Front Pharmacol. 2020;11:598702. doi:10.3389/fphar.2020.598702
50. Buenestado A, Chaumais MC, Grassin-Delyle S, et al. Roflumilast inhibits lipopolysaccharide-induced tumor necrosis factor-alpha and chemokine production by human lung parenchyma. PLoS One. 2013;8(9):e74640. doi:10.1371/journal.pone.0074640
51. Fenwick PS, Macedo P, Kilty IC, Barnes PJ, Donnelly LE. Effect of JAK Inhibitors on Release of CXCL9, CXCL10 and CXCL11 from human airway epithelial cells. PLoS One. 2015;10(6):e0128757. doi:10.1371/journal.pone.0128757
52. Palomino DC, Marti LC. Chemokines and immunity. Einstein. 2015;13(3):469–473. doi:10.1590/S1679-45082015RB3438
53. Kaminuma O, Nishimura T, Kitamura N, Saeki M, Hiroi T, Mori A. T-helper type 2 cells direct antigen-induced eosinophilic skin inflammation in mice. Allergy Asthma Immunol Res. 2018;10(1):77–82. doi:10.4168/aair.2018.10.1.77
54. Lee JH, Park CS. Gene - gene interactions among MCP genes polymorphisms in asthma. Allergy Asthma Immunol Res. 2014;6(4):333–340. doi:10.4168/aair.2014.6.4.333
55. Mori A, Ogawa K, Kajiyama Y, Suko M, Kaminuma O. Th2-cell-mediated chemokine synthesis is involved in allergic airway inflammation in mice. Int Arch Allergy Immunol. 2006;140 Suppl 1:55–58. doi:10.1159/000092712
56. Sun L, Peng B, Zhou J, et al. Difference of serum cytokine profile in allergic asthma patients according to disease severity. J Asthma Allergy. 2022;15:315–326. doi:10.2147/JAA.S345759
57. Chen H, Song Z, Qian M, Bai C, Wang X. Selection of disease-specific biomarkers by integrating inflammatory mediators with clinical informatics in AECOPD patients: a preliminary study. J Cell mol Med. 2012;16(6):1286–1297. doi:10.1111/j.1582-4934.2011.01416.x
58. Kim V, Cornwell WD, Oros M, Durra H, Criner GJ, Rogers TJ. Plasma Chemokine signature correlates with lung goblet cell hyperplasia in smokers with and without chronic obstructive pulmonary disease. BMC Pulm Med. 2015;15:111. doi:10.1186/s12890-015-0103-2
59. Wang M, Song J, Yang H, Wu X, Zhang J, Wang S. Gut microbiota was highly related to the immune status in chronic obstructive pulmonary disease patients. Aging. 2024;16(4):3241–3256. doi:10.18632/aging.205532
60. Borjini N, Lun Y, Jang GF, et al. CD6 triggers actomyosin cytoskeleton remodeling after binding to its receptor complex. J Leukoc Biol. 2024;115(3):450–462. doi:10.1093/jleuko/qiad124
61. Corren J. New Targeted Therapies for Uncontrolled Asthma. J Allergy Clin Immunol Pract. 2019;7(5):1394–1403. doi:10.1016/j.jaip.2019.03.022
62. Kasaian MT, Lee J, Brennan A, et al. Proteomic analysis of serum and sputum analytes distinguishes controlled and poorly controlled asthmatics. Clin Exp Allergy. 2018;48(7):814–824. doi:10.1111/cea.13151
 © 2025 The Author(s). This work is published and licensed by Dove Medical Press Limited. The
full terms of this license are available at https://www.dovepress.com/terms.php
and incorporate the Creative Commons Attribution
- Non Commercial (unported, 4.0) License.
By accessing the work you hereby accept the Terms. Non-commercial uses of the work are permitted
without any further permission from Dove Medical Press Limited, provided the work is properly
attributed. For permission for commercial use of this work, please see paragraphs 4.2 and 5 of our Terms.
© 2025 The Author(s). This work is published and licensed by Dove Medical Press Limited. The
full terms of this license are available at https://www.dovepress.com/terms.php
and incorporate the Creative Commons Attribution
- Non Commercial (unported, 4.0) License.
By accessing the work you hereby accept the Terms. Non-commercial uses of the work are permitted
without any further permission from Dove Medical Press Limited, provided the work is properly
attributed. For permission for commercial use of this work, please see paragraphs 4.2 and 5 of our Terms.