")
Back to Journals » International Journal of Nanomedicine » Volume 20
Post-Transplant Liver Monitoring Utilizing Integrated Surface-Enhanced Raman and AI in Hepatic Ischemia-Reperfusion Injury Animal Model
Authors Lee S , Kwon H, Oh J, Kim KR, Hwang J, Kang S, Lee K, Namgoong JM , Kim JK
Received 25 September 2024
Accepted for publication 6 April 2025
Published 27 May 2025 Volume 2025:20 Pages 6743—6755
DOI https://doi.org/10.2147/IJN.S497900
Checked for plagiarism Yes
Review by Single anonymous peer review
Peer reviewer comments 2
Editor who approved publication: Dr Krishna Nune
Sanghwa Lee,1,* Hyunhee Kwon,2,* Jeongmin Oh,3 Kyeong Ryeol Kim,3 Joonseup Hwang,3 Suyeon Kang,3 Kwanhee Lee,3 Jung-Man Namgoong,2 Jun Ki Kim1,3
1Biomedical Engineering Research Center, Asan Medical Center, Seoul, 05505, Republic of Korea; 2Department of Surgery, Asan Medical Center, University of Ulsan College of Medicine, Seoul, 05505, Republic of Korea; 3Department of Convergence Medicine, University of Ulsan College of Medicine, Seoul, 05505, Republic of Korea
*These authors contributed equally to this work
Correspondence: Jun Ki Kim, Department of Convergence Medicine, University of Ulsan College of Medicine, Seoul, 05505, Republic of Korea, Email [email protected] Jung-Man Namgoong, Department of Surgery, Asan Medical Center, University of Ulsan College of Medicine, Seoul, 05505, Republic of Korea, Email [email protected]
Background: While liver transplantation saves lives from irreversible liver damage, it poses challenges such as graft dysfunction due to factors like ischemia-reperfusion (IR) injury, which can lead to significant cellular damage and systemic complications. Current diagnostic tools for detecting IR injury have limitations, necessitating advanced methods for timely intervention. This study explores the integration of surface-enhanced Raman spectroscopy (SERS) with artificial intelligence (AI) to improve diagnostic accuracy for liver IR injury.
Materials and Methods: IR injury was induced using a mouse model, and histopathological and hepatic functional evaluations were conducted alongside SERS measurements. Raman signals obtained via SERS chips, which selectively filter nano-biomarkers and enhance signals, were analyzed using machine learning algorithms.
Results: The PC-LDA derived from spectra achieved an accuracy of 93.13%, while a machine learning algorithm based on PC-derived PLS-DA improved accuracy to 98.75%.
Discussion: Our findings emphasize the potential of combining SERS with AI to detect and specifically identify dysfunction due to liver damage early, potentially advancing patient management in liver transplantation.
Keywords: liver ischemia-reperfusion injury, liver function, surface-enhanced Raman spectroscopy, discriminant analysis, machine learning algorithm
Graphical Abstract:

Introduction
In the context of liver transplantation, graft dysfunction can result from several causes, including graft loss, rejection, vascular complications, biliary complications, recurrent liver disease, and infection.1–4 Among these, liver ischemia-reperfusion (IR) injury is a primary concern during liver transplants and surgeries. It occurs when the liver’s blood supply is temporarily interrupted and then restored, leading to oxidative stress and a cascade of inflammatory reactions that cause significant cellular damage.5 The consequences of IR injury extend beyond localized liver damage, potentially leading to systemic complications that affect patient recovery and morbidity.1,4,6 Despite the profound impact of IR injury on clinical outcomes, its biological complexity makes it difficult to predict and manage effectively.3 Typically, clinicians monitor levels of blood bilirubin (BIL), aspartate aminotransferase (AST), and alanine aminotransferase (ALT) to assess whether liver function is recovering normally in the initial hours to days post-transplant. However, while these markers can assess liver function, they cannot elucidate the specific cause of graft dysfunction.7,8 Identifying the precise origin of liver dysfunction, such as through targeted immunosuppressive therapy for rejection or antibiotics for infection, allows for appropriate treatment and intervention, making the development of technologies to detect specific biomarkers crucial for the management of transplant patients.9
Traditional diagnostic approaches for detecting liver IR injury, like serum biomarker analysis and existing imaging technologies, face several limitations. Biomarkers such as transaminases may indicate liver cell injury, but they often lack the specificity necessary to distinguish IR damage from other hepatic pathologies. Meanwhile, imaging techniques, although useful for assessing gross structural changes, may fail to capture the early biochemical and cellular events indicative of IR damage. Consequently, there is often a significant delay in diagnosis, hindering timely therapeutic interventions that could minimize liver damage and improve patient outcomes. Recent advancements in biomedical technology, particularly the integration of surface-enhanced Raman spectroscopy (SERS) with artificial intelligence (AI), offer promising solutions to these diagnostic challenges.10 Raman spectroscopy, an analytical technique based on molecular vibrations and photon scattering, is particularly promising in this context. It generates unique spectra that reflect a sample’s molecular composition and structure.11,12 Advances in nanostructured metal technologies have dramatically enhanced Raman signal sensitivity, enabling the development of technologies that leverage SERS for superior signal enhancement.13
Diagnosis of various diseases, including cancer, infectious diseases, and metabolic/endocrine disorders, has traditionally relied on identifying diagnostic markers within the bloodstream. These targeted diagnostic markers range in size from tens of micrometers down to the nanometer scale. The breadth of applications is extensive, encompassing cancer diagnosis via circulating tumor cells (tens of micrometers), anemia assessment through red blood cell (approximately 8 micrometers) counts, sepsis detection by bacterial (approximately 1 micrometer) identification, and diabetes diagnosis using blood glucose (nanometer scale) levels. Targeting nanoscale diagnostic markers implies a high probability of their presence, even in minimally sampled liquid specimens, due to their widespread dispersion within the sample. Previous studies have used Au-coated ZnO nanorods to selectively diffuse nano-biomarkers into nanogaps, capturing Raman signals that are dramatically enhanced from these trapped nano-biomarkers.14 The gold coating of these nanostructures confers resistance to signal degradation resulting from oxidation, a phenomenon observed in other metals like silver. The use of ZnO also facilitates a straightforward fabrication process, enabling low-temperature solution-based synthesis and minimizing infrastructure demands. Notably, differences in amino acid metabolism were detected to assess renal function in cases of ischemic kidney injury.15 This approach also demonstrated its diagnostic precision for vascular stenosis due to atherosclerosis and rejection after kidney transplantation.16,17 The application of SERS technology for monitoring organ damage after liver transplantation is expected not only to facilitate liver function monitoring but also to trace the causes of liver damage.
Furthermore, integrating these spectroscopic technologies with AI algorithms enhances data interpretation, enabling more accurate and rapid diagnostics. While AI has traditionally been applied to medical imaging, other types of medical data remain largely unexplored. By applying AI to spectroscopic data, we can enhance diagnostic accuracy, develop sensitive detection technologies, provide insights for analyzing multidimensional variables, and automate the diagnostic process, paving the way for studies specifically tailored to Raman spectroscopy. Since Raman spectral data presents different data variable forms compared to traditional imaging-derived data, customized research tailored to Raman spectroscopy is required.
In this study, we developed an IR animal model to obtain blood samples and conducted both liver function assessments and Raman spectroscopy. We filtered nano-biomarkers from blood samples in each IR animal model group and obtained enhanced Raman spectra. Machine learning algorithms were applied to these spectra to perform discriminant analysis and evaluate diagnostic accuracy, as shown in Scheme 1.
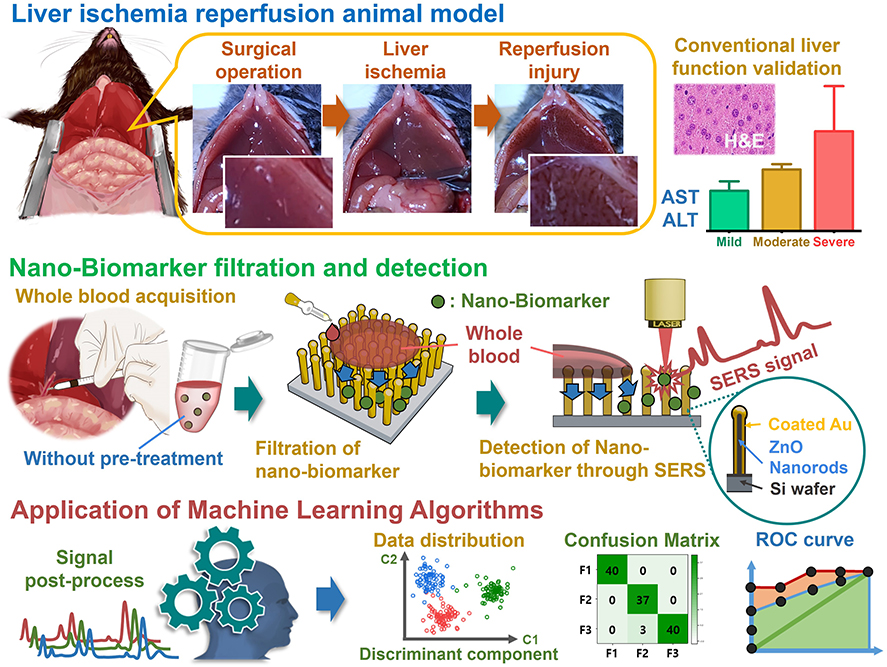 |
Scheme 1 Schematic diagram of the development of a diagnostic technique based on the convergence of surface-enhanced Raman spectroscopy and machine learning algorithms for evaluating liver ischemia-reperfusion animal model and liver damage/function. |
Materials and Methods
Group of Mouse Models of Hepatic Ischemia-Reperfusion Injury
The animal experiments were conducted in compliance with the Laboratory Animal Act of the Republic of Korea and received approval from the Institutional Animal Care and Use Committee (IACUC) of the Asan Institute for Life Sciences, Asan Medical Center (approval number: 2024–20-075). A total of 16 C57BL/6 mice were used in the study. These mice were divided into four groups, each consisting of four mice: a 0-hour, 2-hour, and 4-hour reperfusion following 45 minutes of induced ischemia and a sham group. A sham group underwent the same surgical procedure without hepatic portal vein ligation and subsequent blood collection. Following purchase at 8 weeks of age, C57BL/6 mice (Japan SLC, Japan) were maintained in standard housing for a period of one week to allow for acclimatization and stress reduction before commencement of the surgical protocol. Mice obtained from the vendor are subject to monthly health reports, and pre- and post-purchase microbiological monitoring confirmed the absence of abnormalities. Further assurance of the mice’s suitability was ensured through genetic monitoring and physiological parameter testing, thus maximizing the reliability of SERS monitoring of ischemia-reperfusion liver injury.
Anesthesia was administered through an intraperitoneal injection of a diluted anesthetic solution at a dosage of 100 µL/10 g of body weight. An anesthetic solution was prepared by mixing Zoletil (Zoletil 50, Virbac, Switzerland), Xylazine (Rompun, Elanco, USA), and Dulbecco’s Phosphate Buffered Saline (DPBS, Gibco, USA) at a volume ratio of 60:40:900. This ratio provided a dosage of 30 mg/kg Zoletil and 10 mg/kg Xylazine, based on the mouse weight. A mixture of this solution was administered intraperitoneally to induce deep anesthesia in 25–30 gram C57BL/6J mice, confirmed by the absence of response to foot pinch.
The mice were shaved from the anterior chest to the anterior umbilical region, followed by a horizontal incision below the diaphragm and a vertical incision from the xiphoid process to the umbilicus. A 3–0 Black silk suture thread (Ailee, Republic of Korea) was used to elevate the xiphoid process, and a retractor was employed to expose the liver. The left branch of the hepatic artery was ligated to induce ischemia in the left lobe of the liver. Two techniques were used for inducing ischemia: placing a clamp on the artery or using a 6–0 Prolene suture thread (Ethicon, United States) secured with a hanging weight. Ischemia was maintained for 45 minutes, after which reperfusion was allowed according to the designated experimental group times by removing the clamp or the suture thread. Throughout the procedure, DPBS was intermittently applied to the abdominal cavity to prevent desiccation of the organs.
Blood was collected from the inferior vena cava into a Heparin microtube (Beckton Dickinson and Company, USA) using a 26G 1 mL syringe (Kovax, Republic of Korea) after completing the reperfusion phase, resulting in the euthanasia of the animal. The left lobe of the liver was excised, rinsed in DPBS, and fixed in a 4% paraformaldehyde solution (Biosesang, Republic of Korea). Immediately following blood collection, 10 µL of the whole blood was pipetted onto a SERS chip for analysis.
Liver Histopathology and Functional Assessment of Ischemia-Reperfusion Injury
Blood samples were centrifuged at 4000g for 10 minutes to separate the plasma. The plasma was then measured for ALT (Alanine Transferase) and AST (Aminotransferase) levels using a chemistry analyzer (Clinical Analyzer 7180, Hitachi, Japan). Plasma ALT and AST values were plotted and analyzed to evaluate liver function.
The fixed mouse liver tissues were embedded in paraffin and sectioned at a thickness of 3 µm. The sections were then de-paraffinized and mounted on slide glasses for Hematoxylin and Eosin (H&E) and Masson’s Trichrome staining. Tissue slides were examined with a visible light microscope (Axioplan 2, Zeiss, Germany). Images were captured at 5× and 10× magnification using a digital camera (ProgRes CF scan, JENOPTIK, Germany) and ProgRes software (JENOPTIK, Germany).
Synthesis of ZnO Nanostructure-Based and Au-Coated SERS Sensing Chip
To isolate nanoscale biomarkers and enhance Raman signals, an SERS substrate was created by synthesizing vertically aligned ZnO nanorods using the hydrothermal method, in line with earlier studies.16,17 Specifically, ZnO nanostructures were fabricated by submerging a silicon wafer (LG Siltron Inc., Gumi, South Korea) in a mixture of 10 mM zinc nitrate hexahydrate (Sigma Aldrich Co., St. Louis, MO, USA), 0.9 mL ammonium hydroxide (Sigma Aldrich Co)., and 30 mL of deionized water at 90°C for 50 minutes. The resulting nanorods on the silicon substrate had lengths ranging from 400 to 600 nm and a diameter of 50 nm. A gold coating with a thickness of 200 nm was applied to the ZnO nanorods using a thermal evaporator (Alpha Plus Co., Seoul, South Korea). The performance of the Au-ZnO nanostructure-based SERS chips is known to vary depending on the gold deposition and ZnO nanorod growth conditions. The fabrication parameters for the SERS chips used in this study were optimized in our previous work.13,18 The morphology and structural details of the nanorods were examined through a field-emission scanning electron microscope (S-4700; Hitachi, Tokyo, Japan) operating at a beam voltage of 10 keV.
Raman Spectrum Acquisition and Post-Processing of Signals
Blood samples collected from the inferior vena cava were directly 10-uL dropped on the SERS chip. Without any additional pretreatment of whole blood, droplet was air-dried in a clean hood for 30 minutes. Blood samples, owing to surface tension effects, retained a droplet form throughout the drying process. As depicted in Scheme 1, nano-biomolecules diffused concentrically into the spaces between the nanostructures. Raman signals resulting from the scattering of laser light were then measured within this diffusion zone. The chips were then mounted on a confocal microscope (IX-73 with 75 μm pinhole; Olympus, Tokyo, Japan) and analyzed using a Raman spectroscopy system (FEX-INV; NOST, Gyeonggi-do, South Korea) with a 40× objective lens with NA=0.95. Spectral acquisition was performed using a 785 nm laser, with a power output of 1.2 mW measured at the sample stage. The use of a 532 nm laser was deemed unsuitable due to excessive background noise observed in the blood samples. For each blood drop, 20 Raman spectra were recorded, and one blood sample from each mouse was measured at each time point. A total of 320 Raman spectra were acquired (80 per group; four mice per group: Sham, 0, 2, and 4 hours post-ischemia/reperfusion). These data were processed to generate average spectra for each group and subsequently subjected to both principal component analysis (PCA) and machine learning algorithms to extract relevant spectral features and patterns. To ensure consistency across the Raman equipment and sensing chip, the spectrometer was calibrated using a high-purity single-crystal silicon (512 cm⁻¹ peak), and rhodamine B was measured on the SERS chip to confirm signal enhancement. The Raman spectral data were collected from 330 to 2480 cm⁻¹ with a spectral resolution of 2 cm⁻¹. Each spectrum represents 10 accumulations of 4-second laser exposures. Using software (RAON-Vu, Korea) that included the spectrometer, the data were post-processed using a fifth-order polynomial fitting to remove background noise.
Statistical Analysis of Signals and Evaluation of Classification Using Machine Learning Algorithms
Principal Component Analysis (PCA) was applied to reduce the data’s dimensionality and extract correlated signals from the statistical variables, enabling more accurate identification of significant peaks and shifts within the Raman spectra. The entire spectral range was used as input, comprising 1000 intensity measurements from 330 to 2480 cm⁻¹ with ~2 cm⁻¹ intervals. The average Raman spectrum for each group was plotted, with standard deviations from the group’s average spectrum represented as error bars. For visual differentiation, the Raman data were plotted based on the initial principal components (PCs), using the cross-product with the PCs to highlight separation.
The LDA and PLS-DA machine learning algorithm was implemented to enhance the diagnostic criteria derived from the principal components. The resulting score distributions and confusion matrices were created to evaluate diagnostic sensitivity in differentiating mouse groups according to reperfusion time after hepatic ischemia from the sham mouse group. For the PLS-DA analysis and receiver operating characteristic (ROC) curve generation, 80 random data points were selected from each group. The ROC curves were constructed based on the calculated sensitivity and specificity, with the diagnostic accuracy determined by the area under the ROC curve (AUC). PCA, LDA, and PLS-DA analyses were performed using XLSTAT 2022 software (Lumivero, Denver, CO, USA).
Results and Discussion
Histopathological and Hepatic Functional Characteristics in Liver Ischemia-Reperfusion Mouse Groups
Through surgical processing, vascular ligation was performed on a portion of the hepatic lobes in mice, with sham groups subjected to identical procedures without ligation. A 45-minute vascular ligation induced hepatic ischemia, forming reperfusion mouse groups at 0, 2, and 4 hours (4 mice per group as a baseline). As shown in the first column of Scheme 1, the ligated hepatic lobes displayed an increasingly mottled appearance during the ischemia-reperfusion process. After each reperfusion time, blood samples were applied (10 µL drop) to a SERS sensing chip, with the remaining blood used for AST and ALT measurement. Liver tissues sliced from sacrificed mice underwent H&E and Masson trichrome staining. Validation of liver damage and function in mice obtained through these processes is shown in Figure 1, with characteristic features indicated with arrows and circles and major explanations added in the lower right section of the figure.
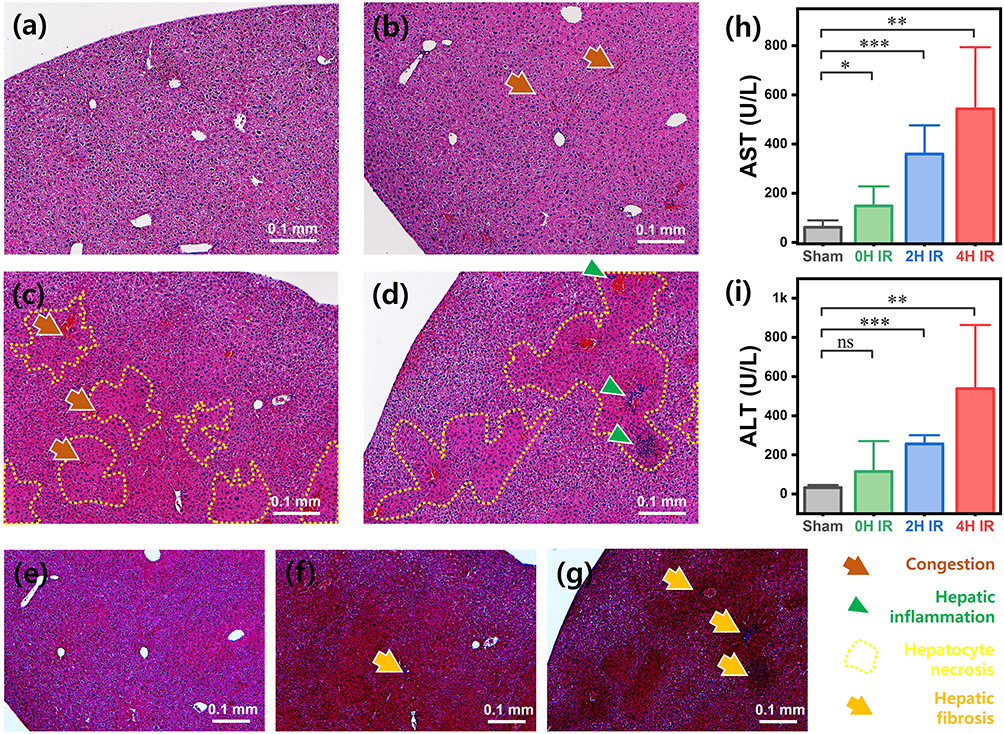 |
Figure 1 Histopathological staining images of H&E and Masson’s trichrome for sham and ischemia-reperfusion animal groups. (a) sham, (b) 45 minutes of ischemia, (c) 2 hours of reperfusion after ischemia, and (d) 4 hours of reperfusion liver tissue H&E staining images. (e–g) Masson’s trichrome staining images of the same location of liver tissue with H&E staining image location according to reperfusion time (0, 2, and 4 hours). Bar graphs showing the mean levels of (h) AST and (i) ALT with lines for deviation and significance for each animal group. Statistical significance is indicated as follows: not significant (ns); * = P < 0.05; ** = P < 0.01; *** = P < 0.001. |
In Figure 1a–d, H&E staining revealed sinusoidal congestion by red blood cells (marked by brown arrows) in ischemic injury tissue images. Hepatocyte necrosis observed during the reperfusion progress is marked by blue circles, characterized by faint or missing nuclei and ruptured membrane boundaries.19 As reperfusion time increased, more hepatic inflammation zones (marked by green arrowheads) appeared, as shown in Figure 1d. Liver cell damage was evaluated using Masson’s trichrome staining, as seen in Figure 1e–g. The synchronized trichrome images with H&E images in Figure 1b–d showed increasingly broad and dark red regions as reperfusion time increased to 0, 2, and 4 hours. Biebrich scarlet-acid fuchsin, used in Masson trichrome stain, is cytoplasm protein-affine, serving as an indicator by intensely staining necrotic hepatocyte regions. Inflammation zones were also observed in these red regions, with blue intensifying during fibrosis progression, as also found in this study (yellow arrows).20
AST and ALT levels from sham and 0, 2, and 4-hour IR mouse blood are plotted in Figure 1h and i. The deviation within each group is shown as a line from the average bar value for comparison of liver function indices. Liver function indices increased with reperfusion time in parallel with individual mouse liver damage extent, with statistical significance represented as stars for the sham group. Statistical significance (p-values) was determined using analysis of variance, comparing liver function parameters at 0, 2 and 4 hours post-ischemia induction for each experimental group against the corresponding sham group. The statistical significance relative to the sham group is indicated in Figure 1h and i. Aiming for automated analysis through a machine learning algorithm application, Raman spectra were labeled based on group categorization by liver damage and function distinction.
Surface-Enhanced Raman Signal and Peak Assignments in Liver Ischemia-Reperfusion Mouse Groups
Raman spectroscopy works by irradiating target nano-biomarkers with a laser to scatter light energy distribution into spectra, serving as a fingerprint for bio-samples. Surface-enhanced Raman spectroscopy, particularly utilized for its dramatic signal enhancement, involves molecules near rough metals like gold or silver. This study employed SERS sensing chips with gold-coated ZnO nanorod structures to acquire enhanced Raman signals. As seen in the “Nano-Biomarker filtration and detection” section of Scheme 1, nano-biomarkers in blood filter and diffuse between nanostructures, where Raman measurements capture enhanced Raman signals exclusively from nano-biomarkers in diffused regions. Gold-coated ZnO nanorod arrays have porous spaces of several tens to 100 nanometers, only enhancing Raman signals from biomarkers within this gap size in nanoscale. Figure 2a shows FESEM images illustrating the morphology of the ZnO nanorods before and after gold coating, confirming the presence of porous spaces with dimensions below 100 nm.
 |
Figure 2 (a) FESEM micrographs showing the ZnO nanorod array before (left) and after (right) gold coating. (b) Photo (The minimum unit of the ruler is 0.5mm.) and microscopic images illustrating the blood sample deposited on the SERS chip, with the latter showing the interface between the nanostructures and the sample. The red marker indicates the area targeted for Raman spectroscopic analysis, from which scattered signals were collected. (c) Average SERS spectra (colored lines) and standard deviation (shaded in the same color) for sham and liver ischemia-reperfusion animal groups. Vertical Orange bars represent the Raman peak regions corresponding to key assignments indicated in Table 1. (d) Plot of the variability when the spectra of each group are converted to principal components, with the inset plotted on a logarithmic scale. (PC number is indicated as PC#). |
Blood dropped on the SERS chip maintains a droplet shape due to surface tension, with concentric nanostructure diffusion confirmed by microscopy after 30 minutes. Figure 2b (left panel) shows an optical image of a blood droplet deposited and dried on the SERS chip. Raman spectra were obtained by irradiating diffused regions with a 785 nm laser, sending scattered light to a spectrometer. Figure 2b (right panel) shows a magnified microscopic image of the droplet interface region, clearly showing the diffusion of the analyte into the nanostructure array. The laser excitation (red marker) was precisely focused onto this diffusion zone for Raman signal acquisition. Prior investigations have established that the acquisition of reliable signals is achievable within a 50 μm radius of the droplet periphery. Spectra were sorted into four groups (sham, 0h IR, 2h IR, and 4h IR) as illustrated in Figure 2c, showing the average (bold line) and standard deviation (color around lines) for each group’s 80-point spectra. Spectra acquisition for each group (20 points each from 4 animals) reflected inter- and intra-animal variation. To establish a correlation between Raman spectral data and liver function, a dual-approach was employed for blood analysis. Blood samples collected from each animal model were divided into two portions: one for direct deposition onto SERS chips, and the second for the determination of AST/ALT levels. The twenty spectra acquired for each animal represent measurements from twenty different locations within the diffusion zone of the nano-biomarkers on the SERS chip. Notable peaks in Raman spectra from the liver ischemia-reperfusion animal model varied, as indicated by the orange vertical bars in Figure 2c, with center Raman shifts noted. Vibrational modes corresponding to indicated peaks with references are listed in Table 1.10,15,17,21–33 The standard deviations of the Raman spectra exhibit significantly narrow bandwidths in the regions near 600, 1100, and 1750 cm⁻¹. These narrow bandwidths demonstrate high reproducibility and consistent background levels across the spectra. Figure 2c presents the spectra without normalization. Analysis of the standard deviation at 1000 cm⁻¹ (commonly used for normalization) shows a clear broadening of the bandwidth as the ischemia-reperfusion time increases. This observation suggests that variations in the phenylalanine peak at 1000 cm⁻¹ are potentially involved in the development of liver ischemia-reperfusion injury.
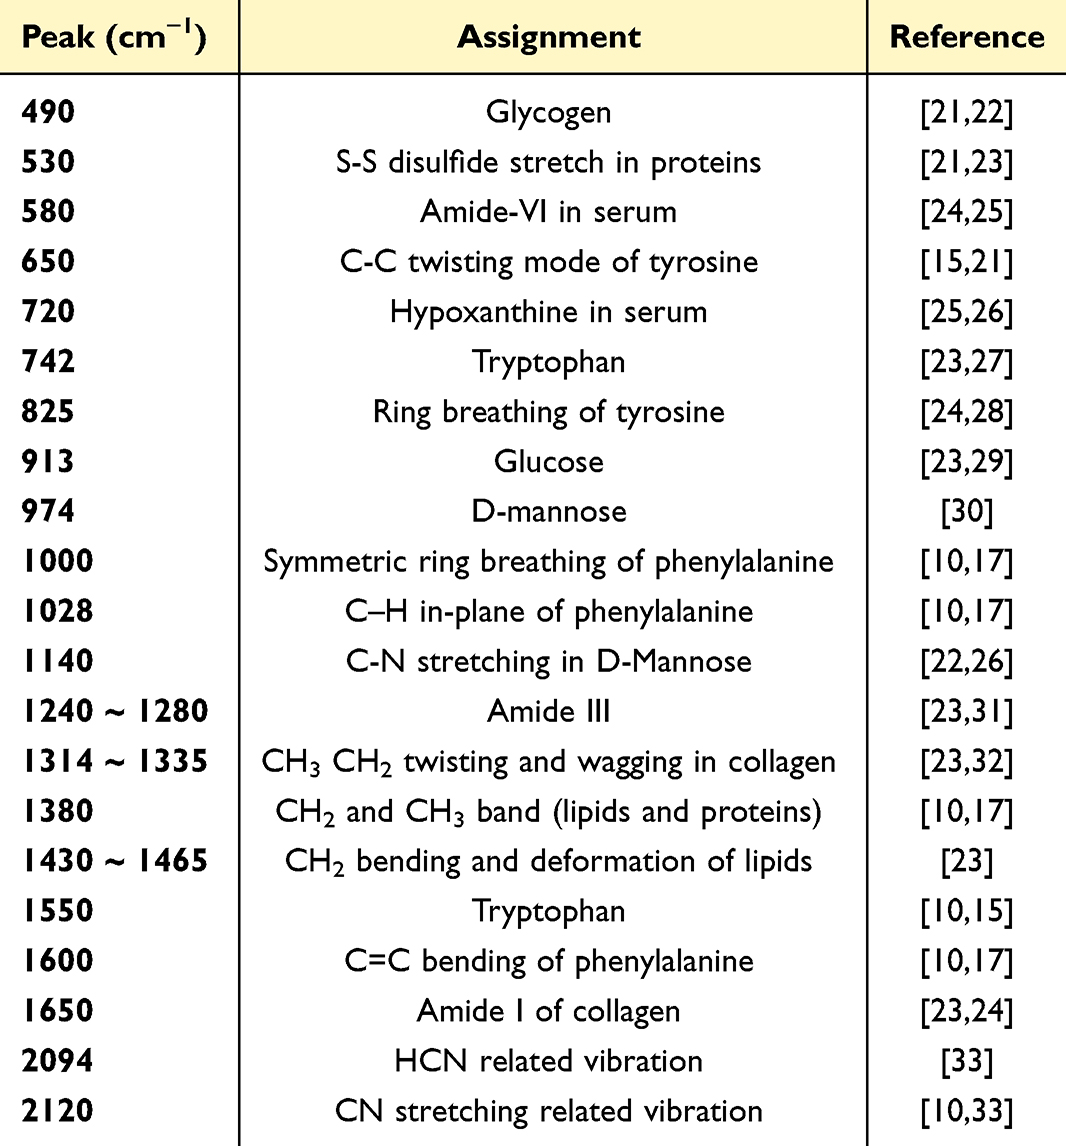 |
Table 1 Major Raman Peak Assignments for Blood Derived from Liver Ischemia-Reperfusion Animals |
Diagnostic Accuracy per Mouse Liver Ischemia-Reperfusion Group Through Machine Learning Algorithms
Principal component analysis (PCA), a technique for reducing high-dimensional data to lower dimensions, was introduced for dimension reduction of Raman spectra with 1000 steps of Raman shift values as variables. Previous studies confirmed efficient high diagnostic performance with applied DA on low-dimensional variables derived via PCA. In Figure 2c, raw spectra are presented after background noise reduction using fifth-order polynomial fitting. Normalization was applied to the entire dataset prior to analysis of data distribution in PC space. Figure 2d displays the PC occupancy calculated from the normalized data. In Figure 2d, numbering from PC1 was based on axes exhibiting high variances for high-dimensional variables per spectrum using PCA. Despite PC1~3’s combined variance of 62.6% (49.3, 7.6, and 5.7%, respectively), animal group data distribution was indistinguishable in PC space. This limited diagnostic contribution reflected an accuracy of 41.56% by even LDA with those PCs.
Although peaks at 1000, 1335, 1465, 1550, and 1650 cm⁻¹ in Figure 2c appear to differentiate the animal groups, the large standard deviations at these frequencies, coupled with the presentation of average peak values, could lead to misinterpretations. While average spectra show apparent differences between groups in the 2094 and 2120 cm⁻¹ spectral regions (outside the typical Raman fingerprint range), this observation may be misleading. Analysis of individual spectra demonstrates reproducible patterns within the standard deviation bands. Improved separation of these bands would be expected to enhance the ability to distinguish between groups, highlighting the limitations of relying solely on average spectral values. Analysis of individual spectra indicates that the variations in average peak intensities are not strongly correlated with group distinctions. The significant overlap in standard deviations among groups is the main factor limiting the diagnostic performance, explaining the lower diagnostic accuracy (despite visible differences in the average spectral profiles) from the principal component analysis (PCA). To overcome this limitation and improve diagnostic performance, we employed AI-based algorithms to identify diagnostic criteria from even low-variance regions. Linear and non-linear discriminant algorithms were then used to further enhance diagnostic accuracy, as detailed below.
Alternatively, PC-LDA, a linear discriminant analysis on PCs, was conducted for per-animal group data distribution, confusion matrix analysis, and accuracy assessment, as shown in Figure 3. Using up to 150-dimensional PCs as variance variables, plotting of PC-LDA revealed graphically depicted PC-LDA component space distribution in per-animal group per Figure 3a. Clustering per animal group in the PC-LDA1~3 space was observed, with sham, 0h IR, 2h IR, and 4h IR sequentially progressing along the vector synthesis direction of PC-LDA1 and 2. This progression aligns with liver damage sequencing by reperfusion and AST/ALT liver function indices. The confusion matrix in Figure 3b achieved an overall 93.13% accuracy with LDA on 100 used PCs, increasing to 97.81 on 150 used PCs. It was well plotted for accuracy increase linked to PC usage count in Figure 3c. Individual animal group accuracy per PC usage is provided in the inset. Sham versus each IR group ROC curves are plotted in Figure 3d–f, with AUC values reflecting accuracy changes by PC usage count. As reperfusion time increased from 0h to 4h, accuracy improved with fewer PCs required, indicating enhanced discriminatory power parallel to the growing magnitude of liver tissue damage and function decrement as time progressed.
 |
Figure 3 (a) 3D data distribution plot of linear discriminant analysis using PCs as variables for liver ischemia-reperfusion animal groups derived from Raman spectra. (b) Confusion matrix for LDA obtained with 100 PCs, with the total of true labels for each group being 80. (c) Graph showing changes in accuracy according to the number of PCs used in LDA, with inset showing accuracy changes for individual groups. ROC curves and AUC expressed predictions for each reperfusion group compared to sham at (d) 0h, (e) 2h, and (f) 4h post-ischemia. Parenthetical values represent AUC; LOOCV denotes Leave-One-Out Cross-Validation for 50PCs. |
In comparing machine learning algorithm performance, PLS-DA, partial least squares discriminant analysis, judged accuracy with PC characteristics limited to 50. Outcome animal group data distribution via PPD (PLS-DA) and confusion matrix are shown in Figure 4a and b. Despite employing half the PCs in PPD, total accuracy surpassed PC-LDA at 98.75%. Accuracy rapidly converged towards 100% better than PC-LDA, as depicted progression in Figure 4c and inset. Sham versus individual IR stage ROCs in Figure 4d–f demonstrated AUC-based accuracy values, improving with fewer PC numbers as reperfusion extended. These accuracy improvements as reperfusion increased paralleled the progression of liver tissue damage magnitude and liver function deterioration. In addition to determining the accuracy of each discriminant analysis model, cross-validation was performed across datasets to mitigate concerns about overfitting and ensure objective performance evaluation. The cross-validation accuracy is shown as insets in Figures 3d–f and 4d–f. Leave-One-Out Cross-Validation (LOOCV), which involves iterative cross-validation of all observations, was used to assess the generalization performance of the discriminant analysis. The accuracy trend of the cross-validation increased with increasing differences in liver function indicators.
 |
Figure 4 (a) 3D data distribution of animal groups through PC-based PLS-DA. (b) Confusion matrix for PLS-DA obtained with 50 PCs. (c) Graph showing changes in accuracy according to the number of PCs used in PLS-DA, with inset showing accuracy changes for individual groups. ROC curves and AUC expressed predictions for each reperfusion group compared to sham at (d) 0h, (e) 2h, and (f) 4h post-ischemia. Parenthetical values represent AUC; LOOCV denotes Leave-One-Out Cross-Validation for 10PCs. |
Discussion and Conclusion
This study successfully demonstrates the use of SERS combined with AI algorithms to enhance the detection and diagnosis of liver IR injury in a mouse model. Ischemia was induced by surgically ligating the hepatic vasculature in mice, with reperfusion times controlled to regulate the degree of liver damage. Histopathological analysis and AST/ALT liver function values were obtained to evaluate the mouse model. The animal model was grouped according to ischemic reperfusion time points: sham, 0, 2, and 4 hours. Significant differences were observed in histopathological images, and the patterns of AST/ALT changes also clearly differentiated the groups. Significant differences (p<0.05) in liver function indicators were observed across the animal groups, providing a meaningful basis for evaluating the discriminatory power of AI-based SERS. Each group utilized four mouse models, and we have confirmed the efficacy in groups of 4 to 6 animals in models of bladder cancer,10 atherosclerosis,17 and ischemic kidney injury.21 Even in clinical patients, which encompass various variables, disease-representative patterns were effectively detected in some patient groups as small as three individuals.16 The acquisition of 20 spectral points per animal, coupled with the application of machine learning algorithms, ensured the utility of this animal model in assessing inter- and intra-animal discriminatory ability.
Untreated blood samples were directly drop-cast onto Au-ZnO nanostructure-based SERS chips. The inert gold surface of the Au-ZnO SERS chip facilitates size-selective diffusion of nano-biomolecules into its nano-porous structure. This diffusion process is coupled with localized surface plasmon resonance (LSPR)-mediated Raman signal enhancement through interaction with the surrounding gold nanoparticles. Raman scattering was measured from the regions where the nano-biomolecules had diffused using microscopic laser positioning. This integrated SERS chip design therefore combines sample filtration and Raman signal enhancement capabilities.
For animal groups categorized by reperfusion time, high diagnostic accuracy was achieved. Various stages of liver damage were identified by leveraging the molecular specificity of Raman spectroscopy and the analytical power of machine learning. Dimensionality reduction of Raman spectra with 1000 variables was achieved via PCA, and machine learning algorithms were applied using up to 150 PCs. Diagnostic accuracy through PC-LDA was 93.13%, and a machine learning algorithm based on PC-derived PLS-DA showed an accuracy of 98.75%. The AI algorithm in this study was employed to simultaneously identify numerous spectral patterns and distinguish subtle differences undetectable by the human eye. The achievement of high diagnostic accuracy suggests a significant synergy between the nano-marker SERS diagnostic technology and the AI algorithm, enhancing both the convenience and performance of the method. In addition, this diagnostic accuracy is derived from analyzing SERS spectral patterns in the blood of animals with ischemic liver injury. Importantly, changes in the levels of established liver function markers, such as AST and ALT, are also detectable within these spectral patterns. Although the use of an animal model, induction of liver injury, and monitoring of AST/ALT liver function markers enabled the creation of well-defined experimental groups, interpreting the resulting SERS data presents inherent complexities. The observed spectral patterns represent a composite signature arising from the intricate interplay of numerous nano-biomarkers, making it difficult to directly ascribe specific spectral features to particular individual biomolecules. The quantification of individual biomarker contributions to the diagnostic process requires further investigation and is suggested as a focus for future work.
Our results suggest that this integrated approach not only improves sensitivity in detecting minor variations indicative of IR injury but also provides a pathway to distinguishing between various causes of liver graft dysfunction. This innovative diagnostic framework holds significant potential to improve clinical outcomes in liver transplantation by facilitating timely and precise therapeutic interventions. In addition to its high diagnostic accuracy and inherent potential for improved performance, the use of whole blood eliminates the need for pre-processing, leading to significant time and procedural efficiencies. Continued research and development in this area could lead to broader applications in other forms of organ transplantation and disease monitoring. The SERS chips, fabricated on silicon wafers and subsequently diced, can be mass-produced or optimized at the unit-chip level to reduce measurement costs. Furthermore, the use of a motorized Raman system enables automated acquisition of spectral signals. The validation of AI-based diagnosis presented in this study demonstrates the potential for a low-cost, one-click diagnostic technology using a single drop of blood. Furthermore, this approach holds potential for monitoring liver dysfunction caused by ischemia-reperfusion injury, a common complication in liver transplantation, using blood samples from clinical patients. While the animal model simplifies certain aspects of the disease, liver dysfunction in transplant recipients can stem from bile duct injury and immune rejection. Future work will focus on validating this approach by assessing liver function and classifying disease types using samples from clinical patients.
Abbreviations
IRI, ischemia-reperfusion injury; SERS, surface-enhanced Raman spectroscopy; AI, artificial intelligence; ML, machine learning; PCA, principal component analysis; PC, principal component; DA, discriminant analysis; LDA, linear discriminant analysis; PC-LDA, linear discriminant analysis for principal components; ROC, receiver operating characteristic; AUC, area under the ROC curve.
Acknowledgments
Sanghwa Lee and Hyunhee Kwon are co-first authors for this study. This study was supported by the Ministry of Science, ICT and Future Planning (MSIP) through the National Research Foundation of Korea (NRF) (RS-2024-00450201), also supported by a grant from the Korea Health Technology R&D Project through the Korea Health Industry Development Institute (KHIDI), funded by the Ministry of Health and Welfare, Republic of Korea (HI22C1374) and grants from the Asan Institute for Life Sciences, Asan Medical Center, Seoul, Korea (2024IF0007, 2024IP0057, 2023IE0004).
Disclosure
The authors have no competing interests to declare for this work.
References
1. Nastos C, Kalimeris K, Papoutsidakis N, et al. Global consequences of liver ischemia/reperfusion injury. Oxid Med Cell Longev. 2014;2014:906965.
2. Chen XB, Xu MQ. Primary graft dysfunction after liver transplantation. Hepatob Pancreat Dis. 2014;13(2):125–137. doi:10.1016/S1499-3872(14)60023-0
3. Zhai Y, Petrowsky H, Hong JC, Busuttil RW, Kupiec-Weglinski JW. Ischaemia-reperfusion injury in liver transplantation--from bench to bedside. Nat Rev Gastroenterol Hepatol. 2013;10(2):79–89. doi:10.1038/nrgastro.2012.225
4. Weinbroum AA. N-acetyl-L-cysteine mitigates aortic tone injury following liver ischemia-reperfusion. J Cardiovasc Pharm. 2005;45(6):509–515. doi:10.1097/01.fjc.0000159640.36900.5d
5. Weigand K, Brost S, Steinebrunner N, Buchler M, Schemmer P, Muller M. Ischemia/Reperfusion injury in liver surgery and transplantation: pathophysiology. HPB Surg. 2012;2012:176723. doi:10.1155/2012/176723
6. Takeuchi D, Yoshidome H, Kurosawa H, et al. Interleukin-18 exacerbates pulmonary injury after hepatic ischemia/reperfusion in mice. J Surg Res. 2010;158(1):87–93. doi:10.1016/j.jss.2008.08.009
7. Lock JF, Schwabauer E, Martus P, et al. Early diagnosis of primary nonfunction and indication for reoperation after liver transplantation. Liver Transplant. 2010;16(2):172–180. doi:10.1002/lt.21973
8. Maring JK, Klompmaker IJ, Zwaveling JH, Kranenburg K, Ten Vergert EM, Slooff MJ. Poor initial graft function after orthotopic liver transplantation: can it be predicted and does it affect outcome? An analysis of 125 adult primary transplantations. Clin Transplant. 1997;11(5 Pt 1):373–379. doi:10.1111/j.1399-0012.1997.tb00837.x
9. Ronca V, Wootton G, Milani C, Cain O. The immunological basis of liver allograft rejection. Front Immunol. 2020;11:2155. doi:10.3389/fimmu.2020.02155
10. Lee S, Jue M, Lee K, et al. Early-stage diagnosis of bladder cancer using surface-enhanced Raman spectroscopy combined with machine learning algorithms in a rat model. Biosens Bioelectron. 2024;246:115915. doi:10.1016/j.bios.2023.115915
11. Wen XJ, Cheng H, Zhang WL, You LJ, Li JM. Multifunctional Ni(OH)/Ag composites for ultrasensitive SERS detection and efficient photocatalytic degradation of ciprofloxacin and methylene blue. Talanta. 2024;266:125140. doi:10.1016/j.talanta.2023.125140
12. Tang YJ, Ding JN, Zhou WX, et al. Design of uniform hollow carbon nanoarchitectures: different capacitive deionization between the hollow shell thickness and cavity size. Adv Sci. 2023;10(9). doi:10.1002/advs.202206960
13. Lee S, Lee SH, Paulson B, Lee JC, Kim JK. Enhancement of local surface plasmon resonance (LSPR) effect by biocompatible metal clustering based on ZnO nanorods in Raman measurements. Spectrochim Acta A Mol Biomol Spectrosc. 2018;204:203–208. doi:10.1016/j.saa.2018.06.045
14. Lee S, Namgoong JM, Jue M, et al. Selective detection of nano-sized diagnostic markers using Au-ZnO nanorod-based Surface-Enhanced Raman Spectroscopy (SERS) in ureteral obstruction models. Int J Nanomed. 2020;15:8121–8130. doi:10.2147/IJN.S272500
15. Lee S, Oh J, Lee K, Cho M, Paulson B, Kim JK. Diagnosis of ischemic renal failure using surface-enhanced raman spectroscopy and a machine learning algorithm. Anal Chem. 2022;94(50):17477–17484. doi:10.1021/acs.analchem.2c03634
16. Lee SH, Kim JM, Lee KH, Cho HY, Shin S, Kim JK. Diagnosis and classification of kidney transplant rejection using machine learning-assisted surface-enhanced Raman spectroscopy using a single drop of serum. Biosens Bioelectron. 2024;261:116523. doi:10.1016/j.bios.2024.116523
17. Lee S, Jue M, Cho M, et al. Label-free atherosclerosis diagnosis through a blood drop of apolipoprotein E knockout mouse model using surface-enhanced Raman spectroscopy validated by machine learning algorithm. Bioeng Transl Med. 2023;8(4). doi:10.1002/btm2.10529
18. Jue M, Lee S, Paulson B, et al. Optimization of ZnO nanorod-based surface enhanced raman scattering substrates for bio-applications. Nanomaterials. 2019;9(3):447. doi:10.3390/nano9030447
19. Yaron JR, Zhang L, Guo Q, Chen H, Lucas AR. A mouse model of acute liver injury by warm, partial ischemia-reperfusion for testing the efficacy of virus-derived therapeutics. Methods Mol Biol. 2021;2225:275–292.
20. Liu Y, Lu TF, Zhang C, et al. Activation of YAP attenuates hepatic damage and fibrosis in liver ischemia-reperfusion injury. J Hepatol. 2019;71(4):719–730. doi:10.1016/j.jhep.2019.05.029
21. Stone N, Kendall C, Shepherd N, Crow P, Barr H. Near-infrared Raman spectroscopy for the classification of epithelial pre-cancers and cancers. J Raman Spectrosc. 2002;33(7):564–573. doi:10.1002/jrs.882
22. Chen N, Rong M, Shao XG, et al. Surface-enhanced Raman spectroscopy of serum accurately detects prostate cancer in patients with prostate-specific antigen levels of 4–10 ng/mL. Int J Nanomed. 2017;12:5399–5407. doi:10.2147/IJN.S137756
23. Talari ACS, Movasaghi Z, Rehman S, Rehman IU. Raman Spectroscopy of Biological Tissues. Appl Spectrosc Rev. 2015;50(1):46–111. doi:10.1080/05704928.2014.923902
24. Lin D, Feng SY, Pan JJ, et al. Colorectal cancer detection by gold nanoparticle based surface-enhanced Raman spectroscopy of blood serum and statistical analysis. Opt Express. 2011;19(14):13565–13577. doi:10.1364/OE.19.013565
25. Guo L, Li YP, Huang FR, et al. Identification and analysis of serum samples by surface-enhanced Raman spectroscopy combined with characteristic ratio method and PCA for gastric cancer detection. J Innov Opt Health Sci. 2019;12(2). doi:10.1142/S1793545819500032
26. Tan YY, Yan B, Xue LL, Li Y, Luo XY, Ji P. Surface-enhanced Raman spectroscopy of blood serum based on gold nanoparticles for the diagnosis of the oral squamous cell carcinoma (vol 16, 73, 2017). Lipids Health Dis. 2019;18. doi:10.1186/s12944-019-0959-x
27. Huang NY, Short M, Zhao JH, et al. Full range characterization of the Raman spectra of organs in a murine model. Opt Express. 2011;19(23):22892–22909. doi:10.1364/OE.19.022892
28. Kim HS, Lee T, Yun J, Lee G, Hong Y. Cancer protein biomarker identification and quantification using nanoforest substrate and hand-held Raman spectrometer. Microchem J. 2021;160:105632. doi:10.1016/j.microc.2020.105632
29. Krafft C, Neudert L, Simat T, Salzer R. Near infrared Raman spectra of human brain lipids. Spectrochim Acta A Mol Biomol Spectrosc. 2005;61(7):1529–1535. doi:10.1016/j.saa.2004.11.017
30. Dumouilla V, Dussap CG. Online analysis of D-glucose and D-mannose aqueous mixtures using Raman spectroscopy: an in silico and experimental approach. Bioengineered. 2021;12(1):4420–4431. doi:10.1080/21655979.2021.1955550
31. Wang H, Huang N, Zhao J, Lui H, Korbelik M, Zeng H. Depth-resolved in vivo micro-Raman spectroscopy of a murine skin tumor model reveals cancer-specific spectral biomarkers. J Raman Spectrosc. 2011;42(2):160–166. doi:10.1002/jrs.2677
32. Huang ZW, McWilliams A, Lui H, McLean DI, Lam S, Zeng HS. Near-infrared Raman spectroscopy for optical diagnosis of lung cancer. Int J Cancer. 2003;107(6):1047–1052. doi:10.1002/ijc.11500
33. van Wilderen LJGW, Kern-Michler D, Muller-Werkmeister HM, Bredenbeck J. Vibrational dynamics and solvatochromism of the label SCN in various solvents and hemoglobin by time dependent IR and 2D-IR spectroscopy. Phys Chem Chem Phys. 2014;16(36):19643–19653. doi:10.1039/C4CP01498G
 © 2025 The Author(s). This work is published and licensed by Dove Medical Press Limited. The
full terms of this license are available at https://www.dovepress.com/terms.php
and incorporate the Creative Commons Attribution
- Non Commercial (unported, 4.0) License.
By accessing the work you hereby accept the Terms. Non-commercial uses of the work are permitted
without any further permission from Dove Medical Press Limited, provided the work is properly
attributed. For permission for commercial use of this work, please see paragraphs 4.2 and 5 of our Terms.
© 2025 The Author(s). This work is published and licensed by Dove Medical Press Limited. The
full terms of this license are available at https://www.dovepress.com/terms.php
and incorporate the Creative Commons Attribution
- Non Commercial (unported, 4.0) License.
By accessing the work you hereby accept the Terms. Non-commercial uses of the work are permitted
without any further permission from Dove Medical Press Limited, provided the work is properly
attributed. For permission for commercial use of this work, please see paragraphs 4.2 and 5 of our Terms.