")
Back to Journals » International Journal of Nanomedicine » Volume 20
Potential of Liposomal FTY720 for Bone Regeneration: Proliferative, Osteoinductive, Chemoattractive, and Angiogenic Properties Compared to Free Bioactive Lipid
Authors Mouzoura P, Marazioti A, Gkartziou F, Metsiou DN , Antimisiaris SG
Received 9 October 2024
Accepted for publication 17 December 2024
Published 7 January 2025 Volume 2025:20 Pages 239—265
DOI https://doi.org/10.2147/IJN.S494512
Checked for plagiarism Yes
Review by Single anonymous peer review
Peer reviewer comments 2
Editor who approved publication: Dr Kamakhya Misra
Panagiota Mouzoura,1 Antonia Marazioti,1,2 Foteini Gkartziou,1 Despoina-Nektaria Metsiou,1 Sophia G Antimisiaris1,3
1Pharmaceutical Technology Laboratory, Department of Pharmacy, University of Patras, Rion, 26504, Greece; 2Laboratory of Basic Sciences, Department of Physiotherapy, University of the Peloponnese, Sparti, 23100, Greece; 3FORTH/ICE‑&EEgr;&Tgr;, Institute of Chemical Engineering Sciences, Platani, 26504, Greece
Correspondence: Sophia G Antimisiaris, Laboratory of Pharm Technology, University of Patras, Pharmacy Building, Rio Campus, Rio Patras, 26504, Greece, Tel +30-2610-962332, Email [email protected]
Introduction: FTY720 bioactive lipid has proliferative, osteoinductive, chemo attractive, and angiogenic properties, being thus a potential exogenous administered agent for promotion of bone regeneration. Herein we developed FTY720-loaded liposomes as a potential delivery system that could retain and prolong the bioactivity of the bioactive lipid and at the same time reduce its cytotoxicity (at high doses).
Methods: FTY720 liposomes were prepared by thin-lipid hydration and microfluidic flow focusing, and evaluated for their ability to induce proliferation, osteoinduction, and chemoattraction in three cell types: MC3T3-E1 pre-osteoblast cells, L929 fibroblast cells, and ATDC5 chondrogenic cells. The angiogenic activity of free and liposomal FTY720 was investigated using a chick chorioallantoic membrane assay. NBD-FTY720 cellular uptake was quantitated using flow cytometry and morphologically assessed by confocal microscopy. Implicated cellular signaling mechanisms were investigated by quantifying phosphorylated MAPK and CREB proteins.
Results: FTY720 liposomes (~80– 110 nm) with low polydispersity and ~100% loading were prepared using both methods. FTY720 demonstrated the ability to increase cell proliferation at 10– 300nM doses but was cytotoxic at doses> 400nM while the corresponding liposomal-FTY720 doses were non-cytotoxic, proving its reduced toxicity. In several cases (cells and doses), FTY720 liposomes demonstrated increased osteogenic differentiation of cells, proliferation, and migration compared to free FTY720, whereas both FTY720 forms demonstrated substantial angiogenic activity. Liposomal FTY720 cellular uptake was substantially higher than that of free FTY720 in some cases, a fact that may be connected to its higher bioactivity. Increased phosphorylated MAPK and CREB protein concentrations provided information about the potential cellular signaling mechanisms involved in FTY720-induced osteogenesis.
Discussion: The current results confirm the high potential of FTY720 bioactive lipid, especially in its liposomal form, that demonstrated substantial reduction of cytotoxicity and prolonged preservation of the lipids bioactivity (compared to the free lipid), for accelerated treatment of bone defects. Interestingly, the current studies prove the potential of FTY720, especially in its liposomal form, to promote reprogramming of L929 fibroblasts into osteoblasts, a novel finding deserving future exploitation.
Keywords: microfluidics, bioactive lipid, osteogenesis, re-programming, mineralization, chemotaxis, proliferation, MC3T3-E1, L929, ATDC5
Graphical Abstract:

Introduction
FTY720 is a small molecule bioactive lipid, that has been developed as an alternative to S1P with increased stability and half-life, being thus an ideal candidate for clinical applications.1 Indeed, Fingolimod (FTY720) (Gilenya, Novartis) has been approved by FDA as an orally administered treatment for multiple sclerosis (MS) since it reduces inflammation and prevents nervous system damage.2 It exerts its biological effect thorough S1P signaling pathways, where FTY720 is rapidly phosphorylated by sphingosine kinase 2 (SphK2) and SphK1 (at lower levels) to form FTY720-phosphate (FTY720-p);3 FTY720-p acts as an agonist of S1P receptors S1PR1, 3, 4 and 5 and simultaneously as a functional antagonist of S1PR1 receptor, resulting in inhibition of pro-inflammatory cytokine release, neuroprotective effects and myelin regeneration.2,4
Treatment with FTY720 was also found to attenuate ovariectomy-induced osteoporosis in clinical studies, indicating a potential role of FTY720 in bone regeneration.5,6 Other studies showed that FTY720 improves endothelial integrity, promotes osteogenesis, and inhibits osteoclastogenesis.7 Elsewhere it was reported, that FTY720 markedly upregulates the mRNA expression levels of osteogenesis-associated proteins (ALP, OCN, Runx2, and Sp7) within weeks post-treatment, and induces osteogenic differentiation of bone marrow mesenchymal stem cells. Therefore, it could be investigated as a potential small molecule therapeutic agent for the prevention of bone resorption and for the treatment of bone defects.8
Based on the knowledge that tissue regeneration is generally controlled (at the molecular level) by different types of bioactive agents, such as short peptides and chemokines, neurotransmitters, and growth factors (GFs) (that are large soluble bioactive peptides, secreted by cells and functioning as critical signaling molecules that affect numerous cellular functions during development), current strategies explored for bone regeneration try to replicate the natural regenerative pathways by exogenous administration of such bioactive agents and/or growth factors (GFs) or combinations of different bioactives.9–11 Nevertheless, several drawbacks for the realization of optimal tissue regeneration by delivery of exogenous agents exist, such as: (i) their short half-life/rapid degradation and consequent loss of activity (in some cases); (ii) their rapid clearance from diseased sites due to diffusion; and (iii) the serious toxicities caused by delivery of high concentrations of exogenous agents (when high concentrations are delivered as a strategy to overcome their rapid clearance). In addition to the aforementioned drawbacks, the spatiotemporal characteristics of GF delivery are crucial for the final outcome.12
To overcome the many problems related to the optimal delivery of bioactive molecules, they are usually delivered within biocompatible biomaterials for prolonged retention at the diseased site, control of their release kinetics (in order to minimize the chances of toxicity at high concentrations), and protection of the bioactive molecules from detrimental substances or conditions (such as proteases) present at the site of administration and/or action. Recently, nanocarriers have been considered for delivery of bioactive agents. The most biocompatible drug delivery system, liposomes, may be an excellent delivery vehicle for spatiotemporal control of bioactive molecule release at the site of the defect.13 Liposomes can be easily immobilized on scaffold surfaces or integrated into scaffold materials, providing an additional method to control their release and prolong their retention at the site. Furthermore, they can protect encapsulated molecules from degradation and protect the biological environment against the toxicities caused by high amounts (doses) of GFs or other types of bioactive molecules.12
In this context, we studied the potential of FTY720 liposomal formulations, and evaluated the proliferative, osteoinductive, chemoattractive, and angiogenic properties of liposomal FTY720 compared to the free bioactive lipid. For FTY720 liposome preparation, we initially identified lipid compositions that allowed high FTY720 loading by using the conventional thin-film hydration method (TFH), and then optimized the preparative variables for FTY720 liposome preparation by a microfluidic flow focusing (MFF) technique. The latter methodologies are highly repeatable and readily scalable, complying with GMP regulations for the manufacturing of drug products.
Finally, after evaluating the bioactivity of FTY720 liposomes compared to the free bioactive lipid, we studied the potential of liposomal FTY720 to prolong the lipids bioactivity (due to protection against degradation), by measuring the proliferative and osteoinductive activities of free and liposomal FTY720 after 1, 2.5, and 6 months of incubation at 37°C.
FTY720 nanotechnologies and in some cases liposomes have been proposed before for improved delivery (or targeting) of the bioactive lipid at the site (or cells) of interest,14–16 and/or as a method to lower the toxicity of high doses of FTY720, such as the serious cardiovascular effects observed due to its interaction with S1P receptors.16,17 In more detail, Mao et al, reported the development of FTY720 liposomes by the ethanol injection method,14 as an improved treatment of chronic lymphocytic leukemia (CLL) by targeting the FTY720 liposomes towards CLL cells; the same group prepared dual-ligand immunoliposomes with even higher affinity for the target cells.15 Others prepared RGD-targeted FTY720 liposomes by the thin-film hydration method, that additionally co-encapsulated superparamagnetic iron oxide nanoparticles, as theragnostic platforms against hepatocellular carcinoma,16 while for the same indication a more complex multifunctional platform system including (as one of its components) hybrid FTY720 liposomes, was recently reported.18 To the best of our knowledge, the preparation of FTY720 liposomes by MFF methods has not been reported up-to-date.
Materials and Methods
Materials
Egg phosphatidylocholine (PC), 1,2-Distearoyl-sn-glycerol−3-phosphatidyl choline (DSPC) and 1,2-Distearoyl-sn-glycerol−3-phosphatidyl-ethanolamine-N- [methoxy (polyethylene glycol) −2000] (PEG) were purchased from Lipoid, Germany. Cholesterol (Chol) was purchased from Sigma-Aldrich (Darmstadt, Germany). All solvents (methanol, ethanol, isopropyl alcohol, distilled water, and trifluoroacetic acid) were of analytical or HPLC grade and were purchased from Merck (Germany). A Spectrapor dialysis membrane with an MWCO of 12–14 kDa was obtained from Serva, Germany. FTY720 (fingolimod hydrochloride) was purchased from Cayman Chemical. Alizarin Red staining solution (ARS), and alkaline phosphatase activity measuring kit, were purchased from Millipore, Cell Counting Kit - 8 (CCK-8 assay) was purchased from Sigma Aldrich, and 3-(4,5-dimethylthiazol-2-yl)-2,5-diphenyltetrazolium bromide (MTT), was purchased from Sigma Aldrich.
Preparation of FTY720 Liposomes
Two methods were evaluated for FTY720 liposome preparation: the thin-film hydration (TFH)/sonication method (which uses probe sonication to downsize the initial large vesicles formed by the TFH method) and a microfluidic flow focusing method (MFF). As mentioned above, MFF methods have the advantage of one-step liposome preparation, are repeatable, and can be readily scaled up for industrial manufacturing under GMP-compliant conditions.12,13
Thin Film Hydration /Sonication Method
Liposomes with different lipid compositions were prepared using the thin-film hydration method followed by probe sonication as previously reported.19 Liposomes with different lipid compositions were prepared in order to evaluate the effect of lipid composition on liposome properties, especially the effect of liposome coating with PEG on the incorporation of FTY720. Briefly, appropriate amounts of all lipids to give final lipid membrane compositions of: (i) (PC or DSPC)/Chol/PEG/FTY720 (20:10:2.5:4 mol/mol); and (ii) PC/Chol/FTY720 (20:10:3.7 mol/mol) were dissolved in a chloroform/methanol (2:1 v/v) mixture and placed in a round-bottom flask at a final total lipid amount of 20 mg. The flask was connected to a rotor evaporator to remove the solvent under reduced pressure and to form a thin lipid film on the flask walls. Organic solvent residues were removed by placing the flask under N2 flow and connecting it overnight to a freeze-drier. The film was hydrated with 1 mL phosphate buffered saline (PBS) (pH 7.4) to form multilamellar vesicles (MLV). To reduce vesicle size, the MLV dispersion was subjected to probe sonication (Sonics Vibra Cell) to obtain homogeneous small unilamellar liposome (SUV) dispersions. Sonication was applied for 5 min or until the initially milky dispersion became clear. During sonication, the liposome tube was placed on ice to avoid overheating. Finally, liposomes were purified from the non-encapsulated material by size exclusion chromatography, on a Sephadex G-50 (Millipore) column (1 × 30 cm) using PBS (pH 7.40) as the elution solvent.
Microfluidic Flow Focusing Method
The microfluidic device NanoAssemblr® Benchtop System (Precision NanoSystems) was employed for liposome preparation using the microfluidic flow-focusing method. Initially, multiple preparative parameters were tested, by modulating the flow rate ratio (FRR), the total flow rate (TFR), and the organic solvent used, using a constant FTY720/lipid (ratio) of 1:8 (mol:mol) and as lipid composition PC/Chol/PEG (2:1:0.25 mol/mol), as seen in Table 1, in order to identify the preparative parameters for formation of liposomes with optimal physicochemical characteristics. Appropriate amounts of all lipids were dissolved in the organic solvent (used in each case) and then mixed with the bioactive lipid FTY720 at a molar drug/lipid ratio of 1:8. This mixture (organic phase) was pumped into the microfluidic chip with phosphate buffered saline (PBS) (aqueous phase). Immediately after formation, the liposomes were diluted with aqueous phase to dilute the organic solvent remnants in the sample. Following preparation, liposomes were purified from the non-encapsulated material as previously described, and the encapsulation efficiency was calculated.
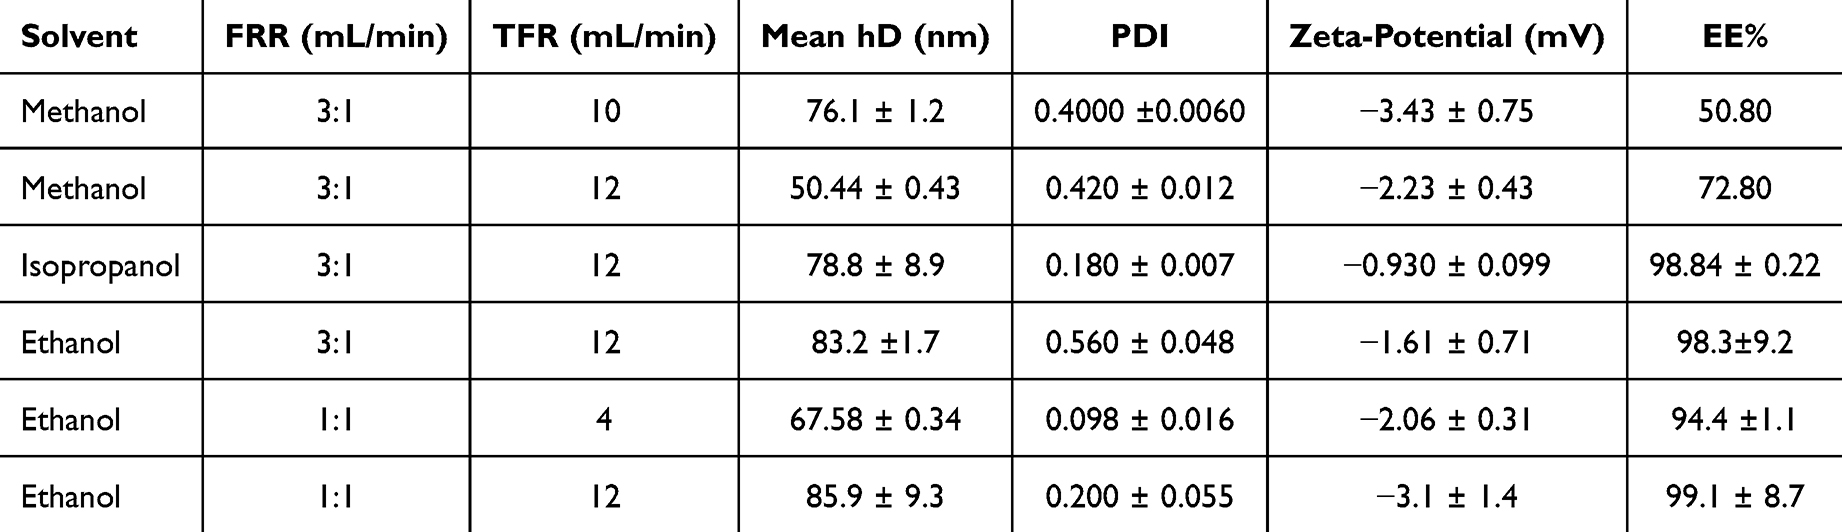 |
Table 1 Physicochemical Properties of PC/Chol/PEG/FTY720 (20:10:2.5:4) Liposomes Prepared by MFF Method Using Different Preparative Conditions (Solvent/Organic Phase, FRR (the Flow Rate Ratio [Flow Rate of Aqueous Phase/Flow Rate of Lipid Phase], TFR (Total Flow Rate)). Each Value is the Mean of Measurements Performed on at Least Three Independent Formulations and SD of Each Mean is Reported (with Exception of Methanol Solvent That Was Tested Only Once) |
Physicochemical Characterization
Following liposome preparation, the vesicles were characterized for their physicochemical properties such as drug loading, size distribution, zeta potential, physical stability, and FTY720 release kinetics. The details of the corresponding methods are described below.
FTY720 Loading into Liposomes
The encapsulation efficiency % (EE%) of liposomes is an index of the bioavailability and efficacy of the liposomal drug delivery system, which reveals the percentage of encapsulated or incorporated drug into the liposomes. EE% was calculated using the following equation:

In equation (1), D/L is the molar ratio, where D denotes the drug concentration and L is the phospholipid concentration, and the initial and final indices imply prior to, and after, liposome purification, respectively.
The phospholipid concentration of liposomes was measured using the Stewart assay, a colorimetric method for quantification of phospholipids.20 FTY720 incorporation into liposomes was quantified by an isocratic high-performance liquid chromatography (HPLC) technique using a Shimadzu 20A5 Gradient HPLC system coupled to an SPD- 20A Prominence UV/VIS detector operating at 207 nm. A LiChrospher 100 RP-18 (5μm) column was used. The mobile phase was a mixture of 20% acidified water (0.1% trifluoroacetic acid) and 80% methanol (0.1% trifluoroacetic acid). The column was eluted at a flow rate of 1 mL/min at 25°C, and FTY720 was eluted for 6 min. The sample injection volume was 100 μL. Liposomes were analyzed after lysis by methanol. One volume of the sample was mixed with ten volumes of methanol, and the mixture was agitated by vortexing, until clear. A calibration curve in the range of 1.25–50 μg/mL was constructed by preparing standard solutions of FTY720 in medium with a composition similar to that of the samples (spiked with dissolved empty liposomes).
Size Distribution and z-Potential Measurements
The particle size distribution of liposome dispersion (mean hydrodynamic diameter and polydispersity index) was measured as previously described in phosphate-buffered saline (10 mm) at pH 7.40, at 25°C, at a 173° angle via dynamic light scattering (DLS) (Malvern Nano-Zs, Malvern Instruments, Malvern, UK).19,21 All dispersions were measured at phospholipid concentration of 0.4 mg/mL. Each sample was measured ten times; three independent samples were measured. Zeta potential (in mV) was measured also in the same dispersions at 25°C, utilizing the Doppler electrophoresis technique, available in the same device.
Transmission Electron Microscopy (TEM)
For morphological assessment of liposomes (at phospholipid concentration between 0.5–1 mg/mL) were re-suspended them in HEPES (10 mM) in order to eliminate potential artifacts from phosphate salts. Liposome samples were placed on grids and negatively stained with freshly prepared 1% phosphotungstic acid in dH2O; after washing 3 times with dH2O and draining excess liquid with the tip of a tissue paper. Vesicles were observed at 100,000 eV with a JEM-2100 (Jeol, Tokyo, Japan) transmission electron microscope (TEM).22
FTY720 Release from Liposomes
FTY720 release from liposomes was studied using the dialysis membrane method during the incubation of liposome dispersions at 37°C with shaking (at 60rpm). For this 0.5 mL of FTY720-LIP (at a lipid concentration of 3 mg/mL) were placed in dialysis bags prepared using dialysis tubing with MW cutoff of 12–14 kD (Spectrapore, Serva, Germany). The dialysis bags were placed in screw-capped tubes containing 15 mL of PBS buffer (pH 7.40) in a mixing incubator (Stuart, SI500, Keison, UK). At defined time points, dialysis bags were retrieved and liposomes contained in the bags were characterized for phospholipid and FTY720 concentrations. At each time point, the medium in the remaining tubes was discarded and replaced with fresh buffer.
Physical Stability of FTY720- Liposomes
The physical stability of FTY720-LIPs was studied during the storage of liposomes (at lipid concentration of 3 mg/mL) at 4°C for up to 4months. Liposomes were stored, and at predefined time points, samples were characterized for their size distribution, PDI, and zeta potential, as described above. The physical stability of liposomal formulations depends on their physicochemical stability.
FTY720 Liposome Bioactivity Studies
Cell Culture
In the present study, the proliferative, calcium deposition and alkaline phosphatase, chemo-attractive (cell migration), and angiogenetic differentiation activities induced by FTY720 liposomes were evaluated using methods routinely applied in the relevant literature. In all cases, FTY720 in solution (at the same concentration) was studied in parallel for comparison with FTY720 liposomes (LIPs), while cells incubated under identical conditions without FTY720 were also studied as controls. Three cell types were used: NCTC clone 929 (mouse connective tissue, L929 fibroblasts), MC3T3 (mouse pre-osteoblast cells, 3T3), and ATDC5 (mouse chondrogenic cells, ATDC5). L929 and 3T3 cell lines were obtained from the American Type Culture Collection (Manassas, VA, USA), and ATDC5 cells were provided by Prof. Martina Anton (TUM, Munich, Germany). The use of the gifted cells was approved by the Research Ethics & Ethics Committee of the University of Patras (approval number 19603/09-03-2020). L929 cells were grown in DMEM medium (PAN-Biotech, Germany) supplemented with 10% FBS (PAN-Biotech, Germany) and 1% antibiotic–antimycotic solution (Invitrogen, Carlsbad, CA, USA). ATDC5 cells were grown in DMEM.F12 medium (PAN-Biotech, Germany) supplemented with 5% FBS (PAN-Biotech, Germany) and 1% antibiotic–antimycotic solution (Invitrogen, Carlsbad, CA, USA). 3T3 cells were grown in Α-MEM medium (PAN-Biotech, Germany) supplemented with 15% FBS (PAN-Biotech, Germany) and 1% antibiotic–antimycotic solution (Invitrogen, Carlsbad, CA, USA). The cells were cultured at 37°C, 5% CO2/saturated humidity. The medium was changed every 2–3 days. To evaluate FTY720 osteogenic differentiation activity, the cells were cultured in supplemented media, as described below.
In all cases, the bioactivities of FTY720 in free and liposomal forms were expressed as the percentage of the control bioactivity, which is the corresponding reading/value for untreated cells cultured under identical experimental conditions.
Proliferative Activity of FTY720 Liposomes
The proliferative activity of the FTY720 liposomes was evaluated by quantifying cell viability after exposing the cells to different concentrations of FTY720 liposomes. The 3-(4,5-dimethylthiazol-2-yl)-2,5-diphenyltetrazolium bromide (MTT) assay was used for L929 cells and the CCK8 assay for ATDC5 and 3T3 cells. In both cases, 1×10⁴ cells per well were plated in 24-well plates, after which incubation, medium was replaced with 1–1000nM of free or liposomal FTY720 and incubated at 37°C and in 5% CO2 for 96h (4d). After this, 0.5 mL of MTT or CCK8 solution (10%) was added in all wells, and after 4h, acidified isopropanol was used to dissolve the formazan crystals that were formed (in case of MTT assay), and OD measurement was performed at 570 nm on a Multiskan-EX plate reader (Thermo). For the CCK8 assay, after the 4h incubation, OD-450nm of samples was measured.
Cell viability (%) was estimated based on the equation:

where the control or OD of untreated cells and the OD of the background were measured at a specific wavelength for each test.
Activity of FTY720 Liposomes to Induce Osteogenic Differentiation of Cells
The ability of FTY720 liposomes to induce osteogenic differentiation of cells was evaluated by measuring the mineralization (calcium deposits) of cells, that was quantified following ARS staining of the calcium deposits, and measurement of the OD-405nm of the extracted red color, from each sample. Additionally, alkaline phosphatase (ALP) activity was measured in some cases, to confirm (by another method) the induction of osteogenesis in the cells by free and liposomal FTY720.
For mineralization experiments 2x10⁴ cells were seeded in 12-well plates in DMEM F.12 with 5% FBS or, DMEM with 10% FBS, or A-MEM medium with 15% FBS, regarding ATDC5, L929 and 3T3 cell lines, respectively. When ≥80% confluence was reached, the cells were incubated with medium supplemented with osteoinductive agents, together with FTY720-LIPs or free FTY720 at different concentrations (ranging between 10–1000nM). Cells without FTY720 (in free or liposomal form) were also tested as controls. We used two types of osteoinductive media: “Full” osteoinductive media, containing 2mM L-glutamin (PAN-Biotech, Germany), 50 μg/mL L-Ascorbic acid (AA) (Millipore, USA), 10 mM β-glycerol phosphate (Millipore, USA) and 100nM Dexamethasone (Millipore, USA),23 and “low” osteoiductive media containing 2 mM β-glycerol phosphate (Millipore, USA) and 10nM Dexamethasone (Millipore, USA) in the case of 3T3 cells,20 since when they were grown in “full” media the 21-day mineralization of control cells was very high and any effect of FTY720 was masked.24
After 3 days of co-incubation of cells with FTY720, the medium containing FTY720 (in free or liposomal form) was replaced with fresh medium (without FTY720), and cells were incubated for 21 more days (medium was replaced 2 times per week). After 21 days, Alizarin Red (ARS) staining was carried out, as previously reported.25 For this, the cell monolayers were washed with PBS and fixed in 10% (v/v) formalin at room temperature for 30 min. The monolayers were then washed twice with excess dH2O before the addition of 0.5mL of ARS solution (40mM) per well. The plates were incubated at room temperature for 45 min under gentle shaking. After aspiration of the non-incorporated dye, the wells were washed four times with dH2O, and the stained monolayers were first visualized using optical microscopy (only for morphological observation of mineralization, and not for quantification). For highest accuracy, cell mineralization was quantified after extracting the stain from each cell sample by addition of 0.4 mL of acetic acid (10% v/v) to each well and incubation at room temperature for 30 min. Cell monolayers were then scraped from the plates with a cell scraper and transferred with acetic acid (10% v/v) to 1.5-mL micro centrifuge tubes. After vortexing for 30 sec and heating to 60°C for 15 min, samples were cooled to 4°C for 15 min, and then centrifuged at 15000g for 20 min. Then 0.25 mL of the supernatant was transferred to a new microcentrifuge tube and 0.188 mL of NaOH (1M) were added to neutralize the acid. The ODs of the neutralized samples were then measured in duplicate at 405 nm by a plate reader (Thermo, Multiskan EX). Finally, the percent of Cell mineralization (ARS staining) was calculated by the following equation:25

Where, ODsample, ODcontrol and ODbackground, correspond to OD-405nm of treated cells, untreated cells and acetic acid 10% /NaOH 1M (without cells), respectively.
For measurement of ALP activity all cell lines were cultured (2x10⁴ cells were seeded in 12-well plates) in the media mentioned above (for each case), and ALP activity was measured by the Alkaline phosphatase assay kit (Millipore) in non-treated cells (controls) as well as in L929 cells and ATDC5 cells, after treatment with 100nM FTY720 (free and liposomal), and in 3T3 cells following treatment with 1000nM of free and liposomal FTY720. The FTY720 doses used for each cell line were selected due to the fact that they were found to induce significant osteogenesis (according to ARS staining) even as free bioactive lipid. In brief, after 3 days of treatment and 21 days of incubation (following removal of FTY720 containing media), the cell medium (used in each case) was removed, cells were gently washed with PBS, and 1mL of cell lysis buffer (50mM Tris-HCl pH 7.40, 150mM NaCl, 1% Triton X-100, 5mM EDTA) was added in each well. Cells were then scraped from the plate with a cell scraper and transferred to a 1.5 mL micro centrifuge tube, where samples were incubated at 4°C for 30 min and centrifuged at 15000g for 20 min. In the next step, 5μL of the supernatant was placed in a 96-well plate and in each well a mixture of reagents provided with the kit (5μL NiCl2, 5μL BSA (5mg/mL), 5μL phosphopeptide stock solution (1mM) and 5μL pNPP Ser/Thr assay buffer) was added. The plate was incubated for 15 min at 37°C and then 100μL of Malachite Green solution was added. Following incubation at room temperature for 20 min the OD-620 nm of each sample was measured by a plate reader (Thermo, Multiskan EX), and ALP activity was quantified using an equation as equation 3, where, the ODs of samples correspond to treated cells, ODs of control to untreated cells, and ODs of background correspond to blank samples without cells.
Activity of FTY720 Liposomes to Induce Cell Migration/Chemo Attraction
The chemotaxis potential of ATDC5, L929 and 3T3 cells was measured in Boyden chamber units with transwell inserts (6.5 mm in diameter, with 3 μm pore size filters). FTY720, free and liposomal, in serum-free medium were added to the lower wells and covered with a chemotaxis filter. Cells (1 × 10⁵) in serum-free medium were cultured in upper wells. After 20h of incubation the filter was carefully removed and non-migrated cells on the upper side were eliminated by rinsing with cold PBS and scraping over a rubber wiper. The remaining migrated cells on the lower side of the filter were fixed with 4% formaldehyde, stained with Giemsa stain, and visualized using a microscope.26 Control wells with medium only in the bottom well were also measured (as controls). The migrated cells on the bottom of the chamber were photographed under a light microscope at a magnification of x20 and counted manually in a blinded manner over the entire area of each filter membrane that was zoomed in (in order for colored cell to be distinguished from pores and any cells remaining on the top side of the filter) using the ImageJ 1.53k software (to overwrite each counted cell and avoid counting errors). Care was taken not to measure any cells that remained on the top side of the filter, which were still stained, and seen in the micrographs in lighter color.
Chick Chorioallantoic Membrane Assay (CAM)
Fertilized White Leghorn chicken eggs, as soon as embryogenesis began, were disinfected and incubated under constant humidity at 37°C. On day 4, a square window was opened in the shell and sealed with an adhesive tape. On day 9, a 1 cm2 sterilized rubber O-ring was placed on the surface of the CAM, and 50 μL PBS or bioactive lipid solutions were added inside the restricted area of the ring. After 48 h, CAM tissues were fixed in Carson’s solution (saline-buffered formalin) and angiogenesis was evaluated using a stereomicroscope attached to a digital camera.
The newly formed blood vessels were viewed, photographed, and quantified by counting the number of blood vessel branching points using ImageJ software (version1.53k).
FTY Liposome Uptake by Cells
To evaluate of the uptake of FTY720-LIP by L929, 3T3 cells and ATDC5 cells, NBD-FTY720-loaded vesicles were incubated with ~60% cell confluent monolayers (200nmoles of liposomal lipid/105 cells, corresponding to 150ng/mL of NBD-FTY720, a dose equivalent to the 100nM dose used in the bioactivity studies) in DMEM, AMEM and DMEM F.12 medium, respectively. For comparison, control liposomes with the same lipid composition (without FTY720) were evaluated under identical conditions. 24 hours after seeding, cells were incubated with liposomes for 1h, 2h and 4h at 37°C. After incubation, the cells were washed 2 times with ice-cold PBS, detached from plates with trypsin 0.25%, re-suspended in 1 mL of medium, washed with PBS, and re-suspended in 1mL.
The cell suspensions were analyzed using flow cytometry (BD Accuri™C6) and the Folch method.27
For FACS analysis, we used as laser excitation wavelength 488 nm and as emission wavelength 533/30 nm (FL-1 channel) for measurement of the NBD-FTY720 vesiclerelated fluorescence. A minimum of 20.000 cells per sample were analyzed, the cell population was identified using the side and forward scatter Histogram and a Gate P1 was set to separate living cells from debris and dead cells. The living cells were further separated from the doublets using the forward scattering area (FSC-A) against the forward scattering height (FSC-H). Only the signals in this gate were used for quantification. Untreated cells with no particles were used as negative controls (L929, 3T3 or ATDC5). Cells were counted as positive if their fluorescence (FL1) was higher than that of 99.6% of cells from the untreated cell suspension. Data were analyzed using FlowJo software (v 10.8.1).
For the Folch method, each sample (0.5 mL of each sample) was transferred to a tube and 2 mL of a CHCl3/MeOH (2:1 v/v) mixture was added. The samples were then vigorously vortexed, incubated for 1 h at 25°C and centrifuged for 5 min at 5000rpm (for phase separation). The water phase was removed immediately before measuring the fluorescence intensity (FI) of NBD (EX-467 nm/EM-539 nm, 5-nm slits) in the organic phase by Shimadzu RF-5301PC Fluorescence Spectrophotometer. Cell auto-fluorescence was always subtracted.25 Sample protein content was measured using a BCA kit to confirm that in all cases, the same number of cells was analyzed. For BCA assay, after cell lysis in 2% Triton X-100, 1mL of A:B (50:1v/v) reagent was added to 50ul of lysed cells, incubated for 30 min at 60°C, left at RT for 15 min, and the OD 620nm was measured.
Confocal Microscopy Study
Cellular uptake of free and liposomal forms of NBD-FTY720 in ATDC5, L929 and 3T3 cells was morphologically assessed using confocal microscopy. Cells were grown in 12-well plates as mentioned before at a cell density of 1×10⁵ cells/well on sterile glass cover slides, at 37°C overnight. Cells were then treated with 150 ng/mL of NBD-FTY720 (Cayman) (free) or NBD-FTY720 liposomal formulation for 1h, 2h and 4h in serum-free media. The fixation protocol was applied after the cells were washed with PBS 1x for 5 min at RT. Briefly, control and treated cells were fixed with 4% paraformaldehyde for 10 min at RT, following 2 washes with PBS 1x for 5 min. Cell nuclei were counterstained with Hoechst 33342 (1:2000; Invitrogen). Finally, all the cover slides were washed with distilled water, gently dried on paper, and mounted with Mowiol-based medium. Three repeated experiments were performed for each control and treated cells. Z-stack imaging was conducted using a Leica SP5 TCS confocal microscope equipped with a x 63/1.40 numerical aperture (NA) oil immersion lens. Hoechst fluorescence was excited using a UV laser at 405 nm and fluorescence NBD-FTY720 was excited using an argon laser at 488 nm. Finally, the high-resolution images (1024 × 1024 pixels) were recorded and collected.
FTY720-LIP Bioactivity Prolongation Studies
The ability of FTY720-LIP and free FTY720 to induce L929 cell proliferation (at 10nM and 100nM concentration) as well as their ability to induce osteogenic differentiation of the same cells (at 10nM and 100nM concentration) was measured after the FTY720 formulations were subjected to prolonged incubation at 37°C for 1, 2.5, and 6 months. This study was conducted to investigate the potential advantages of liposome incorporation in protecting the integrity of FTY720 and prolonging the duration of its bioactive properties (compared to free FTY720) following in vivo administration.
Cellular Signaling Studies - Quantification of Phosphorylated Proteins
To evaluate the cellular signaling mechanisms and pathways involved in the effects conferred by FTY720 on cells, we incubated L929 and 3T3 cells with free or liposomal FTY720 and measured the concentrations of phosphorylated MAPK (ERK1/2, JNK1, and P38) and CREB proteins. Briefly, 2×10⁶ cells per well were seeded onto 6-well plates. After overnight incubation with full medium, the medium was replaced with serum-free medium. After overnight incubation, medium was replaced again by the addition of 10μM (0.005nM/cell, a dose equivalent to the 100nM dose used in the bioactivity studies) of free or liposomal FTY720 and cells were incubated (37°C and in 5% CO2) for 2h. Cells were then lysed with 200μL/well of cell lysis buffer containing 0.1% of phosphatase and protease inhibitors (Peprotech, UK). The concentration of each phosphorylated protein in each sample was determined using two Sandwich ELISA kits (Abcam, Phospho-ERK1/ERK2/JNK1/P38 and Phospho-CREB (S133) and Total CREB ELISA Kits, ab279855 and ab279764), supplied with positive controls as standards. The protocols provided by the kits were followed. Finally, the concentration of the phosphorylated proteins was normalized to the total concentration of each protein.
Statistical Analysis
Statistical analyses were performed using GraphPad Prism software (version 6.0). All data in this study are expressed as mean ± SD from at least four independent experiments (unless otherwise mentioned). Statistical significance was evaluated using one-way analysis of variance (ANOVA) followed by Bonferroni post-hoc test or two-way ANOVA for multiple comparisons between groups. Statistical significance was considered at p < 0.05, whereas the significance of comparisons is presented in all graphs as: a,*$ p < 0.05, b,**$$ p < 0.01, c,***$$$ p < 0.001, and d,****$$$$ p < 0.0001.
Results
FTY720 Liposome Preparation and Properties
Two methods were used for FTY720 SUV liposome preparation: TFH/probe sonication and MFF.
The physicochemical properties of the liposomes prepared using the TFH/probe sonication method are listed in Table 2. As seen, for all lipid compositions used the vesicle size ranged between 91 and 100 nm, PDI was between 0.14–0.27, zeta potential ranged between −2.6 and −6.0 mV, and the loading efficiency of FTY was always close to 100% (ranging between 94 and 97.2%), as anticipated since FTY720 is a lipid and is expected to easily integrate into the vesicle lipid bilayer. When liposomes were PEGylated, the zeta potential values were lower (up to −2.9 mV) than those of the non-PEGylated liposomes (−6.0 mV), which is in good agreement with previously reported values for PEG and non-PEG-containing liposomes.28,29 Although such liposomal properties are acceptable for in vivo applications, we selected to additionally investigate the potential of preparing FTY720 liposomes by MFF methods, which are more repeatable, readily scalable, and consist of one step, making them ideal for large-scale liposome manufacturing under GMP rules.12,13,30 For this, we used the lipid composition that contained PEG, since PEGylated liposomes are well known to be more stable after in vivo administration.31
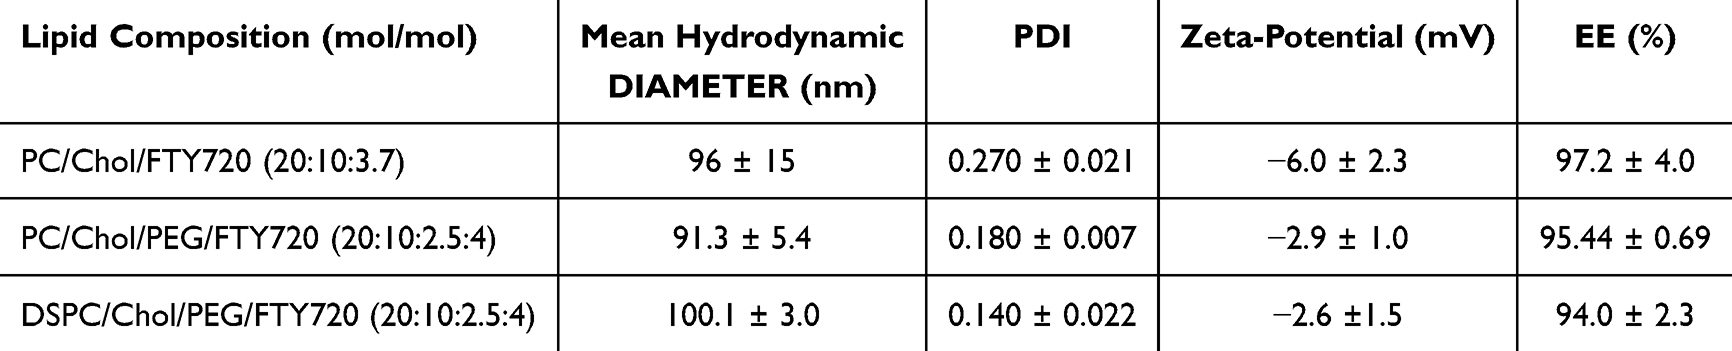 |
Table 2 Physicochemical Properties of FTY720 Liposomes with Different Lipid Compositions, Prepared by the Thin Film Hydration/Sonication Method. Each Value is the Mean of Measurements Performed on at Least Three Independent Formulations and SD of Each Mean is Reported |
As seen in Table 1, methanol and ethanol were not suitable solvents when an FRR of 3:1 was applied, because the liposomes produced incorporated a low amount of FTY720 (in the case of methanol) and/or they were highly polydispersed (PDI values ≥ 0.4 in all cases). In contrast, isopropanol as a solvent with 3:1 FRR succeeded in producing SUV liposomes with low PDI, and high incorporation of FTY720. Because methanol is more toxic and difficult to remove from samples (slower evaporation), we did not repeat liposome formation by the MFF method using this solvent, and further investigated only the use of ethanol by applying an FRR of 1:1. In the former case, liposome dispersions with low PDIs (≤ 0.2) were produced; the FTY loading % was the highest at a TFR of 12 mL/min (compared to 4 mL/min), at which all FTY720 was incorporated into the liposomes. Therefore, we selected as optimal preparative parameters, FRR = 1:1, TFR = 12 mL/min, and ethanol (as organic solvent), to use for FTY720-LIP preparation in subsequent studies. Nevertheless, our results demonstrate that isopropanol may also be used as an alternative solvent to ethanol, in good agreement with previous reports.32
FTY720 Liposome Morphology and Physical Stability
The morphology of PC/Chol/PEG/FTY720 (20:10:2.5:4) liposomes prepared under optimal conditions (Figure 1A) was observed using TEM as described above. As seen in Figure 1B, TEM confirmed the presence of round-shaped and similarly nanosized liposomes with diameters less than 100 nm, which is in good agreement with the DLS-measured size and low PDI (Figure 1A).
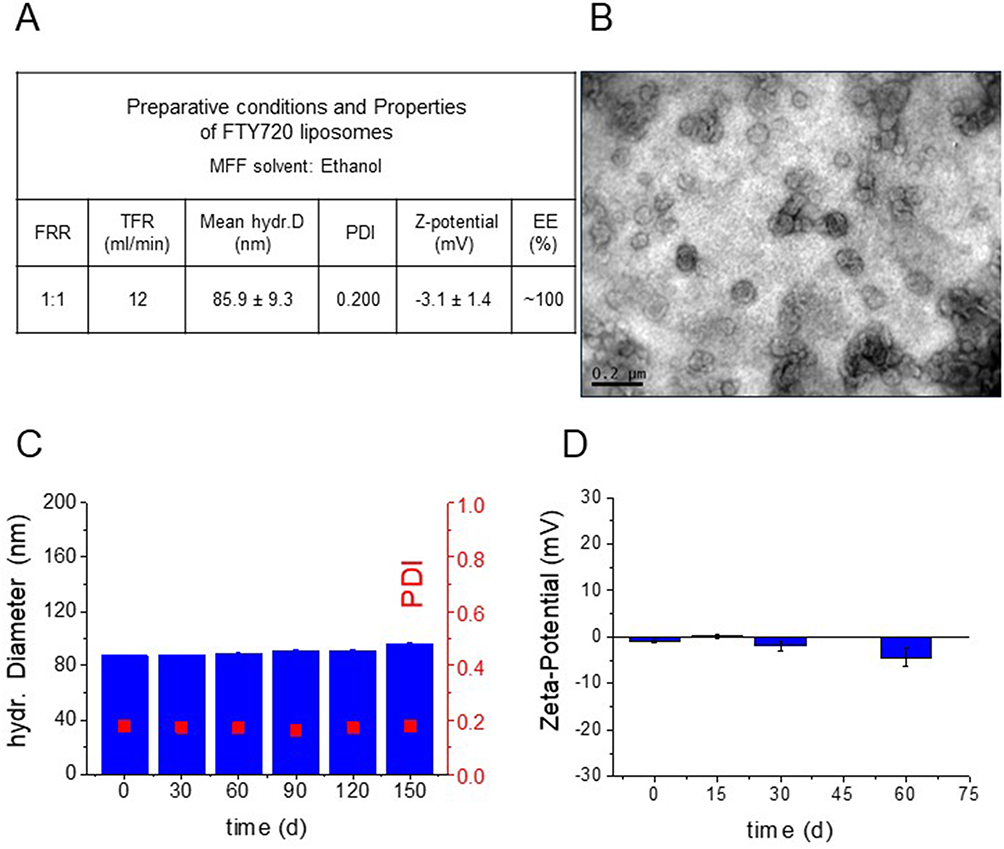 |
Figure 1 (A) Optimal MFF conditions and physicochemical properties of FTY720 liposomes (PC/Chol/PEG/FTY720, 20:10:2.5:4 (mol/mol)). (B) Representative TEM micrographs of LipFTY720. (C). Stability of FTY720 liposome mean hydrodynamic diameter and PDI during storage for up to 150 d at 4°C. (D). Stability of FTY720 liposome zeta potential values during storage for up to 60 d at 4°C. No statistically significant differences between groups were detected. |
In Figure 1C and D the FTY720 liposome physical stability during storage at 4°C is reported. The liposome mean-diameters and PDI values remained practically unchanged (no significant modulation) for the entire 150-day period (Figure 1C). Furthermore, the zeta potential values of liposomes were similar up to 2 M storage. These results demonstrate the stability of the FTY720 liposomes under storage conditions.
The release of FTY720 from liposomes was studied by dialysis method, and as seen in Figure 2, FTY720 is highly retained in the liposomes, as anticipated for a lipid molecule; about 50% of the total amount incorporated in the liposomes is retained after 28 days. A lag-time of approx. 3 d for initiation of FTY720 release is explained by the fact that there is no free bioactive lipid in the liposome dispersion when the experiment is initiated.
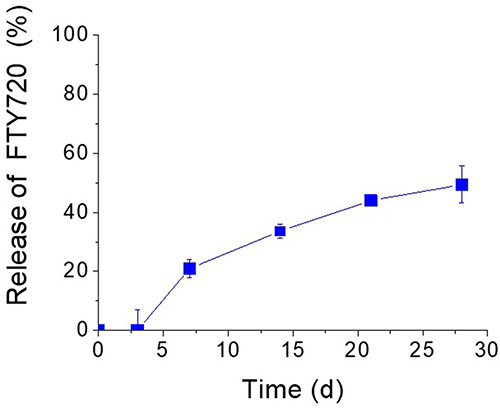 |
Figure 2 Release of FTY720 from LIP (PC/Chol/PEG/FTY720, 20:10:2.5:4 (mol/mol)), expressed as percent (%) of Total FTY720 loaded in the liposomes, under the conditions described in the Methods section. |
Cell Proliferative and Mineralization Activity
We investigated the effects of FTY720 (different doses) on (i) the viability of cells as a measure of proliferative activity, (ii) cell mineralization (quantified by ARS staining) as a measure of the osteogenic differentiation of cells (in osteo-inductive media), and (iii) cell chemo-attraction (migration) after treating cells with varying doses of free and liposomal FTY720. The results for cell proliferation and ARS staining are presented in Figures 3–5, for ATDC5, L929 and 3T3 cells, respectively. As shown in Figures 3–5 in most cases (especially at lower FTY720 doses of 10nM and 100nM) bioactive lipid treatment resulted in increased cell proliferation and ARS staining compared to the corresponding control (no treatment). Furthermore, in some cases (500nM dose in ATDC5 cells; 100nM dose in L929 cells; and all doses used in 3T3 cells) the effect of FTY720 was significantly higher when FTY720 liposomes were used (compared to free bioactive lipid at the corresponding dose(s)).
 |
Figure 3 (A) Viability (% of Control) of ATDC5 cells and (B) ARS staining quantification (% of control) of ATDC5 cells after treatment with various concentrations of FTY720 (in free or liposomal form). Asterisks denote significant differences between Liposomal and free FTY720 and letters denote significant differences with control: ap < 0.05, b,**p < 0.01, cp < 0.001, and d,****p < 0.0001. |
 |
Figure 4 (A) Viability (% of Control) of L929 cells and (B) ARS staining quantification (% of control) of L929 cells after treatment with various concentrations of FTY720 (in free or liposomal form). Asterisks denote significant differences between Liposomal and free FTY720 and letters denote significant differences with control. a,*p < 0.05, b,**p < 0.01, c,***p < 0.001, and d,****p < 0.0001. |
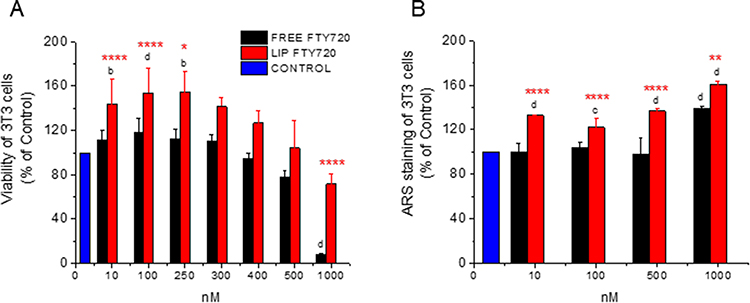 |
Figure 5 (A) Viability (% of Control) of 3T3 cells and (B) ARS staining quantification (% of control) of 3T3 cells after treatment with various concentrations of FTY720 (in free or liposomal form). Asterisks denote significant differences between Liposomal and free FTY720 and letters denote significant differences with control. *p < 0.05, b,**p < 0.01, cp < 0.001, and d,****p < 0.0001. |
In more detail, concerning the effect of FTY720 on proliferation of ATDC5 cells (at doses of 10 and 100nM), increases between 14–32% were measured, while liposomal FTY720 conferred significantly higher effect at the 100nM dose (Figure 3A). Higher increases were measured in L929 cell proliferation by treatment with 10nM or 100nM FTY720 (between 32–50%), while the liposomal FTY720 conferred a significantly higher proliferative effect (compared to free FTY720) at the dose of 100nM (Figure 4A). Increases in 3T3 cell proliferation by FTY720 treatment were also observed (ranging between 11–54%), at FTY720 doses between 10 and 300 nM, and the effect of liposomal FTY720 was again much higher (compared to free FTY720) at the corresponding doses (Figure 5A). Treatment with higher doses of free FTY720 (from 250nM to 1000nM) was additionally investigated, and as seen free FTY720 was cytotoxic (viability <80%) towards ATDC5 cells at doses ≥250nM (Figure 3A), towards L929 cells at doses ≥ 400nM (Figure 4A), and towards 3T3 cells at doses ≥500nM (Figure 5A). However, in all cell types, liposomal FTY720 was cytotoxic (viability <80%) only at the highest LIP FTY720 dose of 1000nM, and toxicity was highest towards ATDC5 cells, intermediate for L929 and lowest for 3T3 cells, in line with the known capability of liposome incorporation to reduce the toxicity of high doses of bioactive molecules.33,34. Concerning the difference between free and liposomal FTY720 cytotoxicity at the highest dose tested (1000nM), in ATDC5 cells toxicity of liposomal FTY720 was 2 times lower (compared to free FTY720), in L929 cells toxicity of liposomal FTY720 was 4 times lower (compared to free FTY720), and in 3T3 cells toxicity of liposomal FTY720 was 7 times lower (compared to free FTY720). Overall, cell viability results from all cell lines enhance the argument of the protective role of liposomes towards the toxicities conferred by high doses of free drug forms.
Regarding dose-response results for osteogenesis, all cells were stained with Alizarin Red post treatment with liposomal and free FTY720, as depicted from the results presented in Figures 3B, 4B and 5B, and examples of corresponding optical microscopy micrographs presented in Figure S1 (see Supplementary Data File), for ATDC5 cells, L929 cells and 3T3 cells. The results indicate that all cell lines (following osteogenic media induction) generated mineralized matrix, that was further enhanced by FTY720 treatment. Since ARS staining values were normalized to the corresponding values of untreated cells in all cases (and presented as % of Control) (Figures 3B, 4B and 5B), it should be mentioned that the corresponding OD values (for ARS staining) were between 0.698 and 1.037 for ATDC5 cells, between 0.380–0.624 for 3T3 cells, and much lower, between 0.031 and 0.055 for L929 cells (see Supplementary Figure S2), indicating a substantially lower capability of L929 cells to form mineral deposits compared to the other two cell types. Nevertheless, it is a very interesting and surprising finding that mineralization of L929 fibroblast cells occurs following induction by osteogenic media, confirming the findings of one previous report, we found in the relevant literature.35
The increased ARS staining of the three cell types as a result of FTY720 treatment (compared to the corresponding control value in each case), as well as the differences observed between free and liposomal FTY720 ability to induce cell mineralization, were different between the cell lines studied. ARS staining of ATDC5 cells was marginally increased by 18–30% with a significant difference between FTY720 liposomes and free FTY720 recorded only at the 500nM dose (Figure 3B). Oppositely, FTY720 conferred significantly higher increases in ARS staining of L929 cells (compared to ATDC5 cells) ranging between 25–86% (Figure 4B), and at the 100nM dose liposomal FTY720 induced significantly higher cell osteogenic differentiation than free FTY720. Finally, in the case of 3T3 cells (Figure 5B), significant increases (between 22–61%) in ARS staining were observed only after treatment with liposomal FTY720 (at all the doses studied), with the exception of the highest dose studied (1000nM), at which free FTY720 also induced increased cell mineralization (compared to the control).
Indeed, treatment with free FTY720 affected osteogenesis evolution differently in the different cell lines, as a very high dose of (free) FTY720 (1000nM) was required to enhance the mineralization of 3T3 cells (compared to the corresponding control), while in contrast, free FTY720 at much lower doses (such as 10 and 100nM) was observed to enhance mineralization of the other two cell lines. A possible explanation for these differences between the three cell lines, lies in the different norms of the 3T3 cells, which as pre-osteoblasts are already differentiated when grown in the presence of a medium containing osteoinductive agents. As mentioned in the Materials section, when grown in full osteoinductive media (containing AA), no effect of FTY720 treatment was observed. Furthemore, liposomization of FTY720 resulted in significant increase of osteogenic differentiation of 3T3 cells, compared to the free bioactive lipid (and the corresponding control in each case), at all concentrations evaluated, while the differences between free and liposomal FTY720 were demonstrated only at one concentration of the lipid, in the cases of chondrogenic and fibroblast cells and were not as pronounced (as in the case of 3T3 cells).
In the case of chondrogenic ATDC5 cells, our results showed a median increase in the osteogenic capacity of cells after FTY720 treatment, which is in agreement with previous reports.36–38
In order to further confirm the osteogenic effect of FTY720 towards the three cell types with another method, we additionally measured its effect on alkaline phosphatase (ALP) activity produced by each cell type after treatment with a bioactive lipid dose that conferred significant cell mineralization (ARS staining) for each cell type (100nM for ATDC5 and L929 cells and 1000nM for 3T3 cells). As seen in Figures 6A–6C, where ALP activity and ARS staining are compared side by side for each cell line, ALP activity results fully confirm the corresponding cell mineralization results, and in fact ALP activity is enhanced even more by liposomal FTY720 (compared to free FTY720) in the cases of L929 cells (Figure 6B) and 3T3 cells (Figure 6C), compared to the corresponding increases of cell mineralization (ARS staining) as a result of bioactive lipid liposomization in these two cell lines.
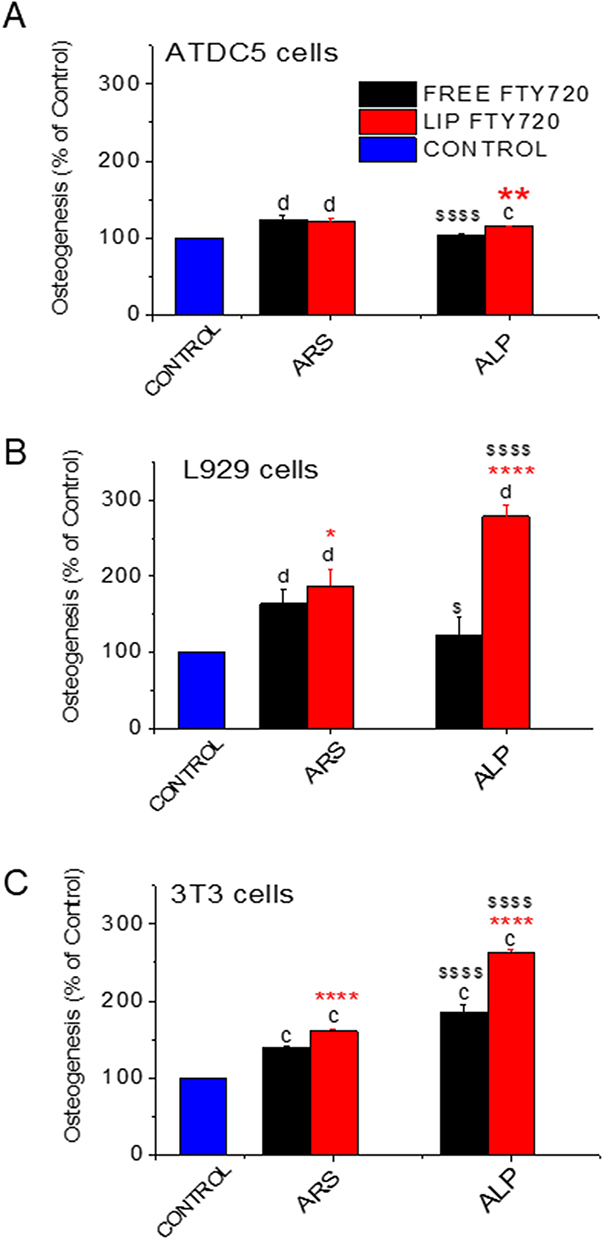 |
Figure 6 Comparison of cell Osteogenic differentiation (% of control) measured by ARS staining and ALP activity measurements in: (A) ATDC5 cells (treated with 100nM FTY720). (B) L929 cells (treated with 100nM FTY720) and (C) 3T3 cells (treated with 1000nM FTY720). Asterisks denote significant differences between Liposomal and free FTY720, letters denote significant differences with control and $ denote differences between ARS and ALP. *p<0.05, **p < 0.01, cp < 0.001, and d,****$$$$p < 0.0001. |
By comparing the cytotoxic and corresponding osteogenic effect of the highest dose of FTY720 (1000nM) towards the three cell lines (Figure 3A and 3B, 4A and 4B and 5A and 5B) we conclude that the very high toxicity induced (especially by free) FTY720 may potentially be somehow correlated with osteogenic differentiation induced at this dose only in the case of L929 cells (Figure 4), which is the only cell line where a significant decrease of ARS staining following treatment with 1000nM FTY720 (compared to the ARS staining after treatment with lower doses) was observed. In fact, we could not directly compare the two sets of results (proliferation and mineralization) also due to the fact that while cell proliferation was measured after 4d treatments, for mineralization the cells were treated for 3d, and after that cells were washed and media was replaced (2 times per week) allowing the cells to recover. In order to understand the effect of treatment time on the cytotoxicity of FTY720 (free and liposomal) towards the three cell lines, we carried out a time response cell proliferation study (at identical conditions used before for each cell type) following treatment of the cells with 1000nM (bioactive lipid) for 1d, 2d, 3d and 4d. From the results of the later study seen in Figure S3 (see Supplementary Data File) we observe that the time course of FTY720 toxicity towards the three cell lines differs, and at the 3d time point, toxicity per cell line follows the order: ATDC5 cells > L929 cells > 3T3 cells. Since the highest cytotoxicity (after 3d treatment) was observed towards ATDC5 cells and not L929 cells, we cannot be sure about the above-mentioned suggestion (that in L929 cells the mineralization result at 1000nM FTY720 is influenced by cytotoxicity), while on the other hand the low cytotoxicity of 1000nM (of free) FTY720 after 3d treatment towards 3T3 cells, corresponds well with the highest mineralization (measured) for these cells at this dose (Figure 5B).
To conclude, we cannot be sure about how and to what degree cytotoxicity may potentially affect ARS staining results, although it should be mentioned that ARS staining as well as ALP activity are indeed influenced by the final number of cells in the corresponding measured samples.
Chemoattractive and Angiogenetic Activity
The effects of free and liposomal FTY720 on ATDC5, L929 and 3T3 single-cell migration were estimated using a chemotaxis assay (Figures 7A–7C, respectively). As mentioned in methods section, cell migration was measured manually in zoomed-in micrographs, in order to avoid errors due to the background of the filter pores, as well as potential erroneous counting of any cells remaining adhered on the top side of the filter that were stained (by dye that passed through the filter) and were observed in lighter color (compared to the migrated cells), in some micrographs. In Figure S4 (see Supplementary Data File), representative micrographs of filter pores, migrated cells, and cells remaining on the top-side of the filter (and stained in lighter color, compared to migrated cells), are reported.
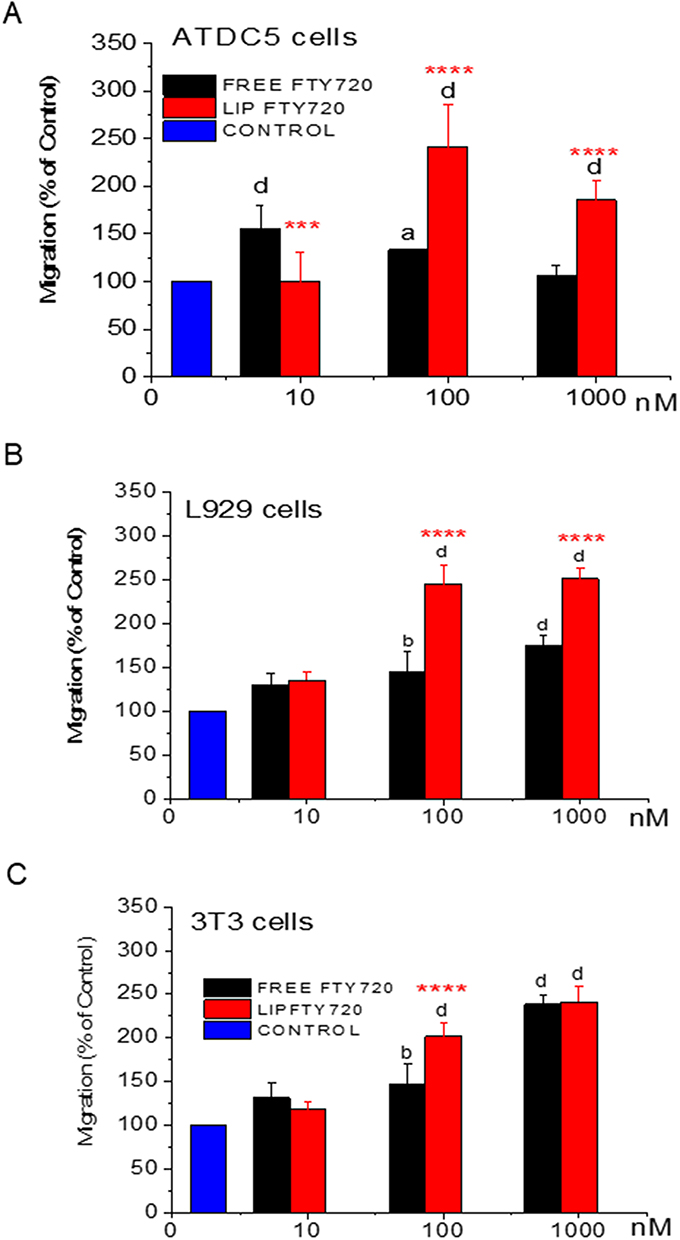 |
Figure 7 (A) Number of Migrated ATDC5 cells, (B) Number of Migrated L929 cells, and (C) Number of Migrated 3T3 cells, all (expressed as % of Control) following treatment of cells with various FTY720 concentrations (in free and liposomal form). Asterisks denote significant differences between Liposomal and free FTY720, letters denote significant differences with control. a< 0.05, bp < 0.01, ***p < 0.001, and d,****p < 0.0001. |
In general, under the conditions applying cell migration was enhanced by 5–141% in ATDC5 cells, by 30–150% in L929 cells, and by 17–141% in 3T3 cells (Figure 7). Our results indicate that the liposomal form of FTY720 promoted cell migration more (compared to free FTY720) in most cases, specifically in ATDC5 cells (Figure 7A) and L929 cells (Figure 7B). More analytically, in ATDC5 cells, at the higher doses of 100nM and 1000nm liposomal FTY720 had a significantly higher effect on single cell migration, than the free form (Figure 7A), and a similar picture was observed in L929 cells where, fingolimod acted as an efficient chemoattractant also in its free form. However, at higher doses of 100nM and 1000nM liposomal FTY720 had a significantly higher effect than the free form (Figure 7B). Additionally, chemo-attractive effects were demonstrated at higher doses (100nM and 1000nM) of both free and liposomal FTY720 towards 3T3 cells (Figure 7C); specifically, at the 100nM dose the effect was significantly increased by the liposomal form compared to the free form. Summarizing the above, free and liposomal FTY720 act as efficient chemo attractants for all cell types studied, which is a very interesting finding for promotion of bone regeneration, since the same bioactive lipid highly promotes the mineralization of L929 fibroblasts and 3T3 pre-osteoblasts (in its liposomal form).
The effect of FTY720 on angiogenesis was assessed using the chick chorioallantoic membrane (CAM) assay after treatment with FTY720 at three different doses 10nM, 100nM, and 1000nM (Figure 8). The free and liposomal forms of fingolimod were tested side-by-side. The analysis was performed by measuring the newly formed vessels that developed after treatment in the same area of the egg membrane (Figure 8A). After 48h of treatment, either with liposomes or free FTY720, enhanced capillary formation was observed, revealing the angiogenic properties of the bioactive lipid. Statistically significant differences were observed by both formulations (free and liposomal) and in all FTY720 doses compared to the control (PBS) (Figure 8B), revealing the high angiogenetic activity of FTY720 both, in its free and liposomal form.
 |
Figure 8 (A). Representative microscopy captions of effect of various doses of free and liposomal FTY720 on angiogenesis as evaluated by CAM assay compared to control; (B). Quantification of the CAM assay results, expressed as branching points (BP) of sample/ BP of control x 100. Letters denote significant differences with control. ap < 0.05, bp < 0.01, cp < 0.001, and dp < 0.0001. |
Uptake of Free and Liposomal FTY720 by Cells
One suggestion to explain (at least partially) the higher bioactivity exerted towards the various cell types by liposomal FTY720, compared to free FTY720 (in some of the in vitro studies performed (Figures 3–7)), could be that liposomization of FTY720 may result in higher uptake of the bioactive lipid by the cells (compared to cellular uptake of free FTY720), which may be beneficial or not, depending on the particular mechanism of action of the bioactive lipid in the particular cell type, and if internalization of the lipid in the cells is required or not. In order to investigate the latter hypothesis, the uptake of NBD-FTY720 by ATDC5, L929, and 3T3 cells was evaluated by FACS (to measure the percent of NBD-positive cells, after treatment of cells with NBD-FTY720 (free and liposomal)) and by the Folch assay (to measure the total percent of uptake of the fluorescent molecule by the cells) (Figure 9). Representative overlaid FACS histograms for non-treated and treated cells, for all cell lines, are additionally presented in Figure S5 (see Supplementary Data File). As shown in Figure 9A, the uptake of both liposomal and free FTY720 by ATDC5 cells was very high, close to 100% of the cells were measured as NBD+, at all time points, while the percent uptake at the 4h time point was marginally increased in liposomal FTY720 compared to free form (Figure 9A). On the other hand, uptake of free FTY720 by L929 cells was much lower compared to the corresponding values for ATDC5 cells (approx. ~50% NBD+ cells) and also significantly decreased after 4h incubation; while liposomal FTY720 uptake by L929 cells (Figure 9C) was approximately between 0.25–3 times higher than the corresponding uptake of free FTY720 at all time-points tested (1, 2 and 4h), the highest difference appearing at the 4h time point. In contrast, in 3T3 cells (Figure 9E) (as in ATDC5 cells) NBD-FTY720 uptake was high (appr. 70–80% NBD+ cells) in all cases (free and liposomal form and time points); a marginal increase of liposomal FTY720 uptake (compared to the free form) was observed only at the 4h time point. The results of the flow cytometry (FACS) study, were confirmed by measuring the fluorescence intensity (FI) of cells (following treatment with NBD-FTY720) after extraction of NBD-FTY720 from samples (by the Folch method) (Figures 9B, 9D and 9F). For quantification after extraction, the total protein concentration of all samples was also measured in order to be sure that all samples had similar cell counts. Since protein concentrations were similar between the samples (see Supplementary Data and Figure S6), the results presented in Figures 9B, 9D and 9F were not normalized. As seen the later results are in absolute agreement with flow cytometry results and the cellular uptake of FTY720 at different time points differs between the three cell types evaluated. While uptake is high (approx. 1.5% of total FTY720 incubated with cells) and not substantially influenced by time (in the time frame evaluated) or FTY720 form (free or liposomal) in the cases of 3T3 and ATDC5 cells, in L929 cells free FTY720 uptake is lower (ranging between 0.3%-0.75%) and substantially decreased as the incubation time increased (from 1h to 4h), while the opposite is observed for liposomal FTY720 uptake which is higher than that of free FTY720 (between 1% and 1.7%) and increases with time of incubation, suggesting that liposomization of FTY720 modifies the mechanism of uptake of FTY720 in L929 cells and/or the intracellular fate of the bioactive lipid.
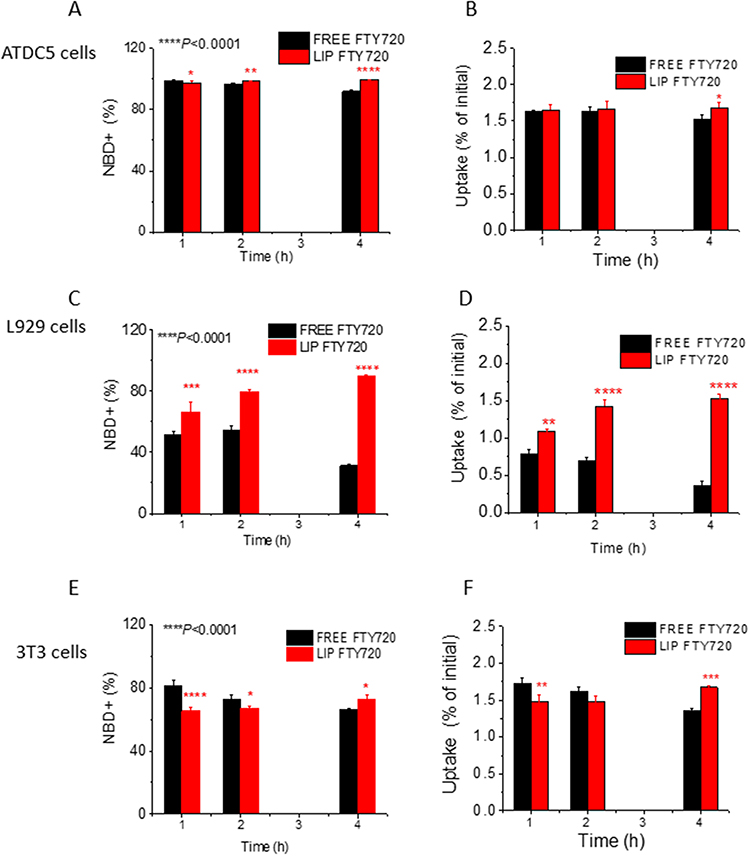 |
Figure 9 Uptake of NBD labeled FTY720 by ATDC5, L929 and 3T3 cell lines was evaluated with FACS flow cytometry assay in the FL1 detector for NBD dye; (A, C and E) Bar graphs of NBD-FTY720 positive cells (%) at each Incubation time, from corresponding FACS results. (B, D and F) Uptake (% of Fluorescence Intensity [FI] values of NBD-FTY720 measured after extraction from the cells by Folch method, and expressed as percent of total FI of the corresponding sample incubated with the cells (in each case). Asterisks denote statistically significant differences between groups: *p<0.05, **p<0.01, ***p<0.001 and ****p<0.0001. |
Confocal microscopy was also carried out for visual verification of NBD-FTY720 (free and liposomal) uptake by the cells (but not for quantification of cellular uptake). The morphological assessment of the cellular uptake of liposomal and free NBD-FTY720 (by ATDC5, L929 and 3T3 cells) confirmed that NBD-FTY720 in its free and liposomal form is taken up by all three cell types, as shown in Figure 10. In all cases the fluorescence is observed to be in the cell cytoplasm, surrounding the cell nuclei.
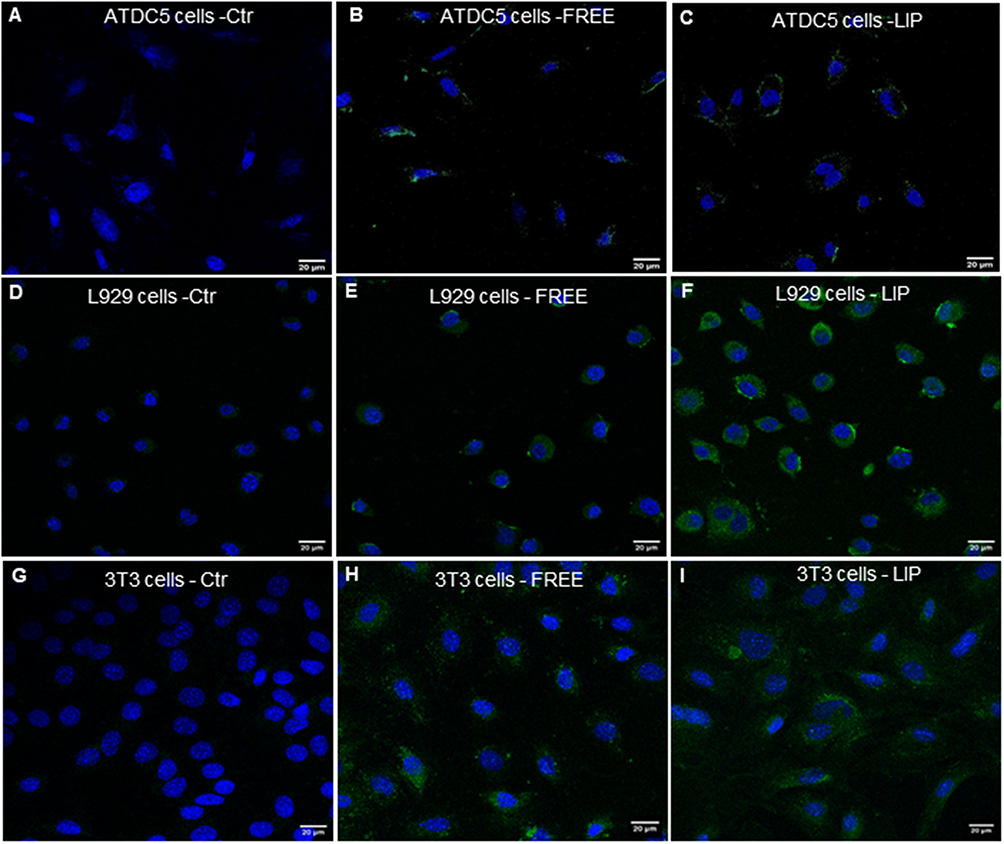 |
Figure 10 Representative microscopy captions of Confocal microscopy study showing the uptake of NBD-FTY720 in free (B, E and H) and liposomal form (C, F and I) by ATDC5, L929 and 3T3 cells, respectively. Corresponding control cells (not incubated with NBD-FTY720) are also shown ((A) for ATDC5 cells, (D) for L929 cells and (G) for 3T3 cells). The scale-bar corresponds to 20µm. |
Stability of Free and Liposomal FTY720 at 37°C
As liposomal encapsulation of FTY720 was found to reduce the cytotoxicity of the bioactive lipid towards ATDC5, L929 and 3T3 cells at high doses (Figures 3A, 4A and 5A), we further investigated whether it could also extend the biological activities (cell proliferation and mineralization) of this bioactive lipid, following its in vivo administration. To this end, we evaluated the cell proliferation and mineralization activities of free and liposomal FTY720 (towards L929 cells) at two doses, following prolonged incubation of the formulations at 37°C, to simulate the conditions that would apply following in vivo administration. The results are shown in Figure 11. As seen in Figure 11A and 11B, the proliferative activity of 10nM and 100 nm FTY720 (respectively) was retained up to 6M in the case of liposomal FTY720, while the free bioactive lipid gradually lost its cell proliferative activity (during incubation at 37°C) at both doses evaluated, and after 2.5 months (in the case of 10nM dose) and only 1 month (in the case of 100nM) did not induce a significant increase in cell proliferation (compared to the control).
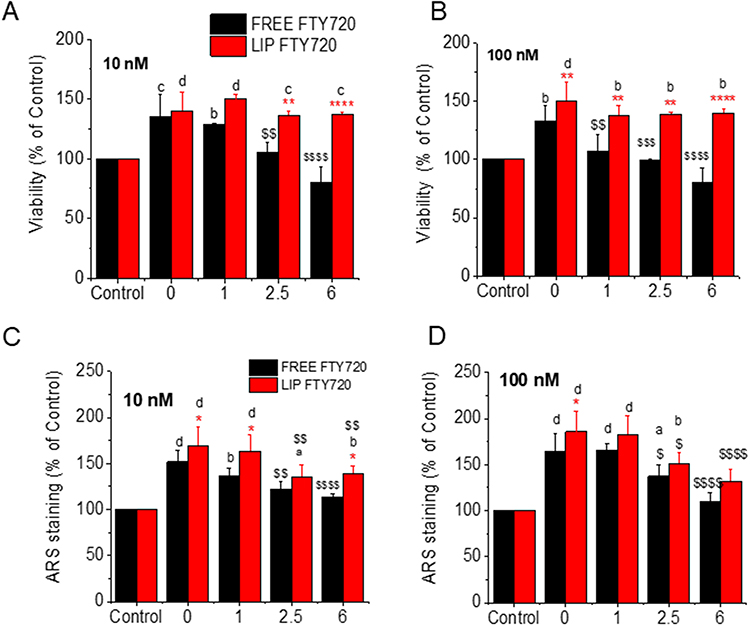 |
Figure 11 Viability (% of Control) of L929 cells following treatments with 10nM (A) and 100nM (B) of free or liposomal FTY720 before (0) and after 1, 2.5 and 6 M incubation of the formulations at 37°C. ARS staining of L929 cells following treatments with 10nM (C) and 100nM (D) of free or liposomal FTY720 before (0) and after 1, 2.5 and 6 M incubation of the formulations at 37°C. Asterisks denote significant differences between liposomal and free FTY720, letters denote significant differences with control and $ denote differences between initial (time 0) corresponding activity. *a,$p<0.05, **b,$$p < 0.01, c,$$$p < 0.001, and ****d,$$$$p < 0.0001. |
With respect to the ability of free and liposomal FTY720 to induce cell mineralization, as shown in Figure 11C (10nM dose) and 11D (100nM dose), both liposomal and free FTY720 demonstrated a gradual decrease in their ability to increase L929 cell mineralization over time; however, the liposomal form retained higher activity (compared to untreated cells) even after 6 months of incubation at 37°C, at the 10nM dose, whereas free FTY720 (at the same dose) did not significantly increase cell mineralization (compared to untreated cells) after 2.5 months. At the higher dose however (100nM), both free and liposomal FTY720 retained increased mineralization effect (compared to control) up to 2.5 months, but did not after 6 months, although the activity of liposomal FTY720 was slightly (but not significantly) higher than that of free FTY720. The current results indicate the potential of liposome incorporation to retain (especially) the proliferative and to a lower percent also the osteo-inductive activities of FTY720 towards cells for longer periods following in vivo administration (compared to free FTY720).
Cell Signaling of FTY720
Phosphorylated MAPK (ERK1/2, JNK1, and P38) and CREB proteins are involved in regeneration and osteosynthesis signaling pathways.39 Regarding cell signaling in L929 cells, free FTY720 intervention resulted in increased phosphorylation of ERK1/2, JNK1, and CREB factor proteins in a statistically significant manner compared to the untreated cells (Figure 12A). However, liposomal FTY720 intervention resulted in a significant increase in CREB protein levels. In 3T3 cells (Figure 12B), a statistically significant increase in the phosphorylation rates of ERK1/2, P38 and CREB was observed after incubation with free or liposomal FTY720. However, in almost all the cases, the effect was greater when the cells were treated with free FTY720. It is unclear why the effect of liposomal FTY720 on MAPK protein phosphorylation was not as profound as that of free FTY720; perhaps the specific incubation time used herein (2 h) was not optimal for liposomal FTY720 to increase MAPK protein activation, since higher cellular amount of liposomal FTY720 in both cell types were measured after 4h of co-incubation (compared to 2h).
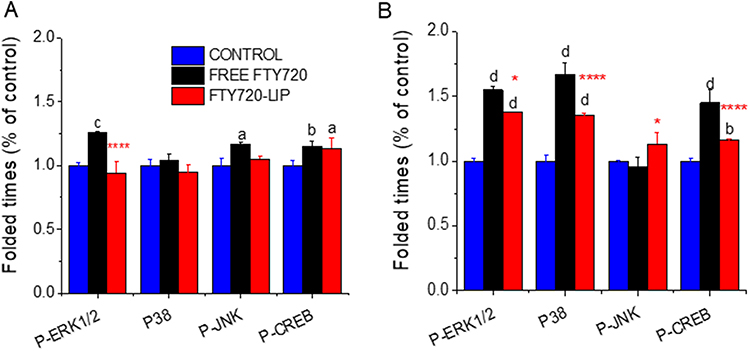 |
Figure 12 (A) Expression of phosphorylated proteins (ERK1/2; P38; JNK; CREB) (normalized to total protein) in L929 cells and (B) 3T3 cells, before (ctr) and after 2h incubation with FTY720 in free and liposomal form. Asterisks denote significant differences between liposomal and free FTY720, letters denote significant differences with control. a,*p < 0.05, bp < 0.01, cp < 0.001, and d,****p < 0.0001. |
Discussion
In this study, we sought to investigate whether a liposome formulation of FTY720 prepared by an optimal MFF method could induce cellular molecular pathways contributing to enhanced cell viability, osteogenesis, migration, and angiogenesis. Optimal microfluidic conditions were identified, and SUV liposomes with diameter<100 nm, low polydispersity, and ~100% FTY720 incorporation were prepared and characterized for physicochemical properties, stability, and FTY720 release. More specifically, liposomal FTY720 size distribution and surface charge remained stable for at least four months under storage conditions, while sustained release of the bioactive lipid from the liposomes was demonstrated. Such attributes have been reported for other liposomal drug formulations previously, and they are basic requirements for the potential applicability of liposomal drugs as pharmaceutical products.28,33,40
For early-stage preclinical evaluation of bioactive substances such as growth factors, it is a common practice to use immortalized fibroblast and pre-osteoblast cell lines, which are relatively easy to obtain and manipulate. The cell lines most commonly used in such studies are L929 fibroblasts and MC3T3-E1 pre-osteoblasts. These cells are useful for investigating the effects of materials on cell attachment, morphology, spreading and alignment, viability, cytotoxicity, and proliferation. In addition, osteogenic media is often used to induce osteoblastic differentiation, which is commonly detected by measuring alkaline phosphatase activity and calcium deposition enhancement in 3T3 pre-osteoblasts.41–44 ATDC5 cells are commonly considered as cellular models for chondrocyte regeneration research and have also been used in the past to study osteogenic induction of cells cultured in osteoinductive media, by evaluating the calcium deposition and changes in osteogenic gene expression, such as Runx2.36,38 In fact, in the previous study by Newton et al36 it was reported that consistent chondrogenesis and physiological mineralization of ATDC5 cells can be regulated by culturing the cells in full osteoinductive media, whilst in other media (containing only Ascorbic acid) only chondrogenic differentiation was observed, suggesting that the degree of mineralization and chondrogenic differentiation (and the equilibrium between the two processes) is dependent on the culturing medium ingredients.
Herein, we used 3T3 pre-osteoblasts which are known to be differentiated into osteoblasts and have been used in many studies as cellular models to evaluate the capability of growth factors (and other bioactive agents) to accelerate bone regeneration, in order to evaluate such potential of FTY720 (in free and liposomal form). L929 fibroblast cells were initially selected as cells for evaluation of FTY720 cytotoxicity, and as control cells for the evaluation of osteogenic potential of FTY720, since we were not aware of their potential to differentiate to osteoblast-like cells when cultured under specific conditions.35 Finally, ATDC5 chondrocytes were used to investigate the cytotoxic/proliferative effect of FTY720, and additionally to understand if FTY720 can further promote the mineralization of chondrocytes and thus potentially influence the equilibrium between physiological mineralization and chondrogenesis, which would most possibly have implications when FTY720 is used clinically for bone regeneration. Furthermore, all three cell types were studied in order to find out if the cell migration activity of FTY720 is different for different cell types.
Regarding the viability studies of ATDC5, L929 and 3T3 cells (Figures 3A, and 5A), our results indicate that free FTY720 has a cytotoxic effect at the high doses of 500 and 1000nM, a finding which is in line with the study of Chen et al on bone marrow cells.45 Furthermore, FTY720 promoted cell viability at lower doses, in agreement with a previous report where the effect of FTY720 on neural stem cells was evaluated.46 Interestingly, in the current study we report for the first time that liposomal FTY720 can induce–in most of the cases evaluated- higher cell proliferation, compared to free FTY720 at the same doses. Moreover, liposomal encapsulation highly reduces the cytotoxicity of FTY720, towards all cell types.
Regarding the effects of FTY720 on the osteogenic differentiation of cells and the treatment of bone defects, it has been already established that free FTY720 induces osteogenesis in an indirect way that has been attributed to the inhibition of osteoclastogenesis via the NF-κΒ and HDAC4/ATF pathway.38 Moreover, Huang et al showed statistically significant increase of calcium deposits (~1.5 times more than control sample) by Alizarin Red staining after the treatment with 100nM FTY720.47 In another case, implantation of FTY720 (dispersed in a polymer) in a bone defect animal model resulted in significant acceleration of bone growth in a dose-dependent manner;48 while a polyethylene glycol gel containing (1μΜ) FTY720 was demonstrated to increase the bone volume after implantation in mice with bilateral cortical tibia defects.49
Our results (Figures 3B, 4B and 5B) prove the osteogenic properties of free FTY720 in all three cell lines evaluated, and particularly for ATDC5 cells (at a lower degree) and L929 cells (at a higher degree) at low FTY720 doses (10 −100nM) and for 3T3 cells at the highest dose of 1000nM. Interestingly, liposomal FTY720 was demonstrated to confer higher osteoinductive activity towards 3T3 cells (at doses between 10nM and 1000nM) and also towards L929 cells (at doses of 10nM and 100nM), compared to its free form. In the case of ATDC5 cells (Figure 3B), no statistically significant difference was found between the two forms of FTY720 (free and liposomal) with regard to cellular mineralization, although a very slight (but significant) increase in ALP activity by FTY720 liposomes (compared to free FTY720 and control cells) is reported (Figure 6A).
FTY720 also enhanced the migration of all cell types studied, more than the corresponding control (osteoinductive medium alone), while liposomization of FTY720, is reported (for the first time) to further increase its chemo attractive activity towards all cell types (studied) at the dose of 100nM (and also higher doses for some cells) (Figure 7). These results are in line with the study of Tan et al, in which similar doses of free FTY720 markedly promoted the migration of neuronal stem cells and upregulated cell chemotaxis-associated F-actin.46 Elsewhere, it was reported that FTY720 did not increase the migration of osteoblast cells compared to control samples; however, a dose of 33nM was evaluated, much lower than the dose found to increase cell migration herein (100nM).47
Additionally, FTY720 (both, free and liposomal) was proven to significantly enhance angiogenesis (at doses of 10, 100 and 1000nM) (Figure 8). The angiogenic activity of FTY720 was demonstrated for the first time (to the best of our knowledge) in the ex-vivo CAM model. In agreement with the current findings, others have previously reported increased angiogenesis after cell treatment with FTY720 (~83nM) and suggested that FTY720 promotes angiogenesis and improves the microenvironment of vessel growth by inducing the transformation of microglial phenotype towards an anti-inflammatory condition.49 The angiogenetic effect of FTY720 was also demonstrated previously in an in vivo study on a cranial defect model.47
Taken together, the current results involving FTY720-induced increase of proliferative, osteogenic and migratory activity towards pre-osteoblast cells, together with its significant angiogenetic activity (at the same doses), confirm its potential as an exogenous small molecule to accelerate bone regeneration and concurrently heal bone defects. Furthermore, the advantages offered by liposomization of FTY720, such as the decreased cytotoxicity of high FTY720 doses (that has been proven towards three different cell types), the enhancement of osteogenic differentiation of pre-osteoblasts and the increased chemoattraction of pre-osteoblast (and other cells that may to some degree differentiate into osteoblast-like cells), together with the slow release of FTY720 from the liposomes (Figure 2) and the prolonged preservation of its bioactivities (under conditions that simulate in vivo administration, Figure 11), add interesting attributes towards the clinical use of liposomal FTY720.
In addition to the above mentioned potential of liposomal FTY720, we have surprisingly found that FTY720 both, in its free and liposomal form induces the differentiation of L929 fibroblasts into osteoblast-like cells that form calcium deposits and demonstrate enhanced alkaline phosphatase activity, confirming the results of a previous report where it was stated for the first time that L929 fibroblasts can form calcium deposits when cultured in the presence of osteoinductive media.35 This finding is particularly useful in respect to the recently proposed novel strategy for bone regeneration in elderly individuals suffering from osteoporosis. In more detail, particularly in elderly populations where balance shifts more to bone resorption than formation, finding ways to increase bone repair by differentiation of progenitor cells into osteoblasts, promotion of endochondral ossification, and increasing cartilage formation, are main objectives of current bone research. In fact, the direct reprogramming of fibroblasts into osteoblasts has been proposed as a potential treatment for bone fractures in elderly, and in vitro as well as in vivo studies have already proved the concept.50 In this context, the current finding that FTY720 can promote fibroblast differentiation into osteoblast-like cells, (and also enhance chondrocyte mineralization) is highly interesting and deserves further exploitation.
Regarding the potential mechanism(s) of FTY720 induced bioactivities towards the different cell types demonstrated herein, according to the relevant literature, two potential mechanisms have been proposed for the cellular action of FTY720. The most studied mechanism involves FTY720 phosphorylation by sphingosine kinases and its subsequent binding to sphingosine 1-phosphate receptor(s) (S1PRs), followed by internalization of the receptor(s) which results in stimulation of different pathways of bone regeneration.51 A second mechanism proposes that FTY720 transport across cell membranes may occur (via specific transporters for S1P analogues), which eventually results in the efflux of (phosphorylated) FTY720 from the cells.52 Since 3T3 and ATDC5 cells are known to express S1PR receptors, the first mechanism is probably most possible, in these cell lines. The later suggestion is also in agreement with the fact that the amounts of NBD-FTY720 taken up by 3T3 and ATDC5 cells were not observed to be significantly reduced with time (in the 1h–4 h period studied) (Figure 9), implying that no, or minimum efflux of FTY720 from the two cell types happens. However, it is interesting that slight decreases of intracellular amounts of NBD-FTY720 were noticed in both, ATDC5 cells (Figures 9A and 9B) and 3T3 cells (Figures 9E and 9F) when free FTY720 was used, and the opposite was observed for liposomal FTY720 in both cell types (the amount of (liposomal) FTY720 in the cells slightly increased with time). The difference between free and liposomal FTY720 intracellular amounts at the various time periods evaluated (1h, 2h and 4h) are strikingly more pronounced in the case of L929 cells (Figures 9C and 9D). These observations may indicate that different mechanisms (or combinations of the two mechanisms at different degree) are taking place for cellular action of free FTY720 and liposomal FTY720, especially in L929 cells. The increased and prolonged intracellular localization and accumulation of liposomal FTY720 in the cells is probably somehow implicated in the higher osteogenic, proliferative and migratory activities recorded by the liposomal form of FTY720 compared to the free molecule, in all three cell types. Nevertheless, we cannot be sure how many and which other mechanisms are implicated.
According to the signaling pathway-related protein measurement results (Figure 12), we have proved that FTY720 (free and liposomal form) induces a significant increase of ERK1/2, JNK and CREB in L929, compared to the untreated cells, while in 3T3 cells a significant (and higher) induction of ERK1/2, p38 and CREB is reported. In more detail, mitogen activated protein kinases (MAPKs) are a set of well-described kinases: extracellular signal-regulated kinase 1/2 (ERK1/2), stress-activated protein kinase / c-Jun N-terminal kinase (JNK1/2), and p38 MAPK (p38). Previous reports have shown that MAPK signaling is implicated in osteogenesis.39 Specifically, osteogenic factors, such as BMP-2, activate the ERK1/2,p38, and JNK1/2 signaling pathways to promote the expression and activation of crucial osteogenic genes such as Runx2, osteocalcin (OCN), type I collagen (COL1A1), and osteopontin (OPN).53–55 On the other hand, the cAMP/PKA/CREB signaling pathway has also been implicated in osteogenic processes.56–59 Interestingly, Zhang et al showed that osteoblast-specific CREB deficiency decreases both, postnatal bone mass and BMP-2 expression in osteoblasts in mice.60 The current results presented the first indication that FTY720 osteogenic signaling is transduced through the MAPK pathway, which activates the transcription of specific osteogenic genes in the studied cell lines (Figure 12). However, this result should be confirmed by other molecular methods, such as my measuring the specific genes. Nevertheless, we proved the activation of the cAMP/PKA/CREB pathway and showed that this pathway is activated and potentially participates in the proliferation, chemotactic, and osteogenic properties of the bioactive lipids. Interestingly, the induction of both signaling pathways in 3T3 pre-osteoblasts was significantly higher than that in L929 cells, possibly because of the osteoblast origin of the former cells.
Conclusions
In conclusion, the present study demonstrated that the liposomal FTY720 formulation enhanced most of the biological activities of this bioactive lipid, such as proliferation, chemotaxis, angiogenesis, and osteogenic differentiation, which are necessary for bone regeneration. Furthermore, the ability of free and especially liposomal FTY720 to induce re-programming of L929 fibroblasts into osteoblast-like cells, is a very interesting finding that deserves future exploitation for potential clinical applications. Further in vivo preclinical studies are required to corroborate the therapeutic potential of this novel liposomal formulation of FTY720 bioactive lipid, as a multimodal therapeutic for bone-healing applications.
Acknowledgments
The authors are grateful to Prof. Emeritus Elias Panagiotopoulos, coordinator of the H2020 project, for assistance and valuable suggestions and discussions. The authors are particularly thankful to Dr. Maria Kollia and the Laboratory of Electron Microscopy and Microanalysis, University of Patras, Rio-Patras, Greece, for assistance in TEM microscopy studies. The help provided in the Confocal Microscopy studies by Prof. S. Taraviras, Laboratory of Physiology, Dept. of Medicine, School of Health Sciences, University of Patras, is highly acknowledged.
Funding
This research received funding from the European Union’s Horizon 2020 (H2020) Research and Innovation Program under grant agreement No. 874896; Project Title: Smart Bone Regeneration (SBR).
Disclosure
The authors report no conflicts of interest in this work.
References
1. Sharma S, Mathur AG, Pradhan S, Singh DB, Gupta S. Fingolimod (FTY720): first approved oral therapy for multiple sclerosis. J Pharmacol Pharmacother. 2011;2(1):49–51. doi:10.4103/0976-500X.77118
2. White C, Alshaker H, Cooper C, Winkler M, Pchejetski D. The emerging role of FTY720 (Fingolimod) in cancer treatment. Oncotarget. 2016;7(17):23106–23127. doi:10.18632/oncotarget.7145
3. Li X, Wang MH, Qin C, Fan WH, Tian DS, Liu JL. Fingolimod suppresses neuronal autophagy through the mTOR/p70S6K pathway and alleviates ischemic brain damage in mice. PLoS One. 2017;12(11):e0188748. doi:10.1371/journal.pone.0188748
4. Yu H, Herbert BA, Valerio M, Yarborough L, Hsu LC, Argraves KM. FTY720 inhibited proinflammatory cytokine release and osteoclastogenesis induced by Aggregatibacter actinomycetemcomitans. Lipids Health Dis. 2015;14:66. doi:10.1186/s12944-015-0057-7
5. Ishii M, Egen JG, Klauschen F, et al. Sphingosine-1-phosphate mobilizes osteoclast precursors and regulates bone homeostasis [published correction appears in Nature. 2010 Jun 17;465(7300):966]. Nature. 2009;458(7237):524–528. doi:10.1038/nature07713
6. Kikuta J, Iwai K, Saeki Y, Ishii M. S1P-targeted therapy for elderly rheumatoid arthritis patients with osteoporosis. Rheumatol Int. 2011;31(7):967–969. doi:10.1007/s00296-010-1634-8
7. Das A, Segar CE, Chu Y, et al. Bioactive lipid coating of bone allografts directs engraftment and fate determination of bone marrow-derived cells in rat GFP chimeras. Biomaterials. 2015;64:98–107. doi:10.1016/j.biomaterials.2015.06.019
8. Huang C, Ling R, Li FJ, et al. FTY720 enhances osteogenic differentiation of bone marrow mesenchymal stem cells in ovariectomized rats. Mol Med Rep. 2016;14(1):927–935. doi:10.3892/mmr.2016.5342
9. Koria P. Delivery of growth factors for tissue regeneration and wound healing. BioDrugs. 2012;26(3):163–175. doi:10.2165/11631850-000000000-00000
10. Kulebyakin KY, Nimiritsky PP, Makarevich PI. Growth factors in regeneration and regenerative medicine: “the Cure and the Cause”. Front Endocrinol. 2020;11:384. doi:10.3389/fendo.2020.00384
11. Sharma V, Srinivasan A, Nikolajeff F, Kumar S. Biomineralization process in hard tissues: the interaction complexity within protein and inorganic counterparts. Acta Biomater. 2021;120:20–37. doi:10.1016/j.actbio.2020.04.049
12. Natsaridis E, Mouzoura P, Gkartziou F, Marazioti A, Antimisiaris SG. Development of growth factor-incorporating liposomes for integration into scaffolds as a method to improve tissue regeneration. Int J Dev Biol. 2022;66(1–2–3):137–154. doi:10.1387/ijdb.210108sa
13. Antimisiaris SG, Marazioti A, Kannavou M, et al. Overcoming barriers by local drug delivery with liposomes. Adv Drug Deliv Rev. 2021;174:53–86. doi:10.1016/j.addr.2021.01.019
14. Mao Y, Wang J, Zhao Y, et al. A novel liposomal formulation of FTY720 (fingolimod) for promising enhanced targeted delivery. Nanomedicine. 2014;10(2):393–400. doi:10.1016/j.nano.2013.08.001
15. Yu B, Mao Y, Yuan Y, et al. Targeted drug delivery and cross-linking induced apoptosis with anti-CD37 based dual-ligand immunoliposomes in B chronic lymphocytic leukemia cells. Biomaterials. 2013;34(26):6185–6193. doi:10.1016/j.biomaterials.2013.04.063
16. Guo XM, Chen JL, Zeng BH, Lai JC, Lin CY, Lai MY. Ultrasound-mediated delivery of RGD-conjugated nanobubbles loaded with fingolimod and superparamagnetic iron oxide nanoparticles: targeting hepatocellular carcinoma and enhancing magnetic resonance imaging. RSC Adv. 2020;10(64):39348–39358. doi:10.1039/d0ra06415g
17. Camm J, Hla T, Bakshi R, Brinkmann V. Cardiac and vascular effects of fingolimod: mechanistic basis and clinical implications. Am Heart J. 2014;168(5):632–644. doi:10.1016/j.ahj.2014.06.028
18. Chen T, Tam N, Mao Y, et al. A multi-hit therapeutic nanoplatform for hepatocellular carcinoma: dual stimuli-responsive drug release, dual-modal imaging, and in situ oxygen supply to enhance synergistic therapy. Mater Today Bio. 2022;16:100338. doi:10.1016/j.mtbio.2022.100338
19. Markoutsa E, Papadia K, Giannou AD, et al. Mono and dually decorated nanoliposomes for brain targeting, in vitro and in vivo studies. Pharm Res. 2014;31(5):1275–1289. doi:10.1007/s11095-013-1249-3
20. Stewart JC. Colorimetric determination of phospholipids with ammonium ferrothiocyanate. Anal Biochem. 1980;104(1):10–14. doi:10.1016/0003-2697(80)90269-9
21. Pefani-Antimisiari K, Athanasopoulos DK, Marazioti A, et al. Synergistic effect of cold atmospheric pressure plasma and free or liposomal doxorubicin on melanoma cells. Sci Rep. 2021;11(1):14788. doi:10.1038/s41598-021-94130-7
22. Franken LE, Boekema EJ, Stuart MCA. Transmission electron microscopy as a tool for the characterization of soft materials: application and interpretation. Adv Sci. 2017;4(5):1600476. doi:10.1002/advs.201600476
23. Das A, Barker DA, Wang T, Lau CM, Lin Y, Botchwey EA. Delivery of bioactive lipids from composite microgel-microsphere injectable scaffolds enhances stem cell recruitment and skeletal repair. PLoS One. 2014;9(7):e101276. doi:10.1371/journal.pone.0101276
24. Izumiya M, Haniu M, Ueda K, et al. Evaluation of MC3T3-E1 cell osteogenesis in different cell culture media. Int J Mol Sci. 2021;22(14):7752. doi:10.3390/ijms22147752
25. Gregory CA, Gunn WG, Peister A, Prockop DJ. An Alizarin red-based assay of mineralization by adherent cells in culture: comparison with cetylpyridinium chloride extraction. Anal Biochem. 2004;329(1):77–84. doi:10.1016/j.ab.2004.02.002
26. Bai W, Zhou J, Zhou N, et al. Hypoxia-increased RAGE expression regulates chemotaxis and pro-inflammatory cytokines release through nuclear translocation of NF-κ B and HIF1α in THP-1 cells. Biochem Biophys Res Commun. 2018;495(3):2282–2288. doi:10.1016/j.bbrc.2017.12.084
27. Folch J, Lees M, Sloane stanley GH. A simple method for the isolation and purification of total lipides from animal tissues. J Biol Chem. 1957;226(1):497–509. doi:10.1016/S0021-9258(18)64849-5
28. Piperoudi S, Fatouros D, Ioannou PV, Frederik P, Antimisiaris SG. Incorporation of PEG-lipids in arsonoliposomes results in formation of highly stable arsenic-containing vesicles. Chem Phys Lipids. 2006;139(2):96–106. doi:10.1016/j.chemphyslip.2005.11.003
29. Kogkos G, Gkartziou F, Mourtas S, et al. Liposomal entrapment or chemical modification of Relaxin2 for prolongation of its stability and biological activity. Biomolecules. 2022;12(10):1362. doi:10.3390/biom12101362
30. Khan IU, Serra CA, Anton N, Vandamme TF. Production of nanoparticle drug delivery systems with microfluidics tools. Expert Opin Drug Deliv. 2015;12(4):547–562. doi:10.1517/17425247.2015.974547
31. Antimisiaris SG. Chapter 1. Introduction to liposome assisted drug delivery. In: Antimisiaris SG, editor. Liposomes in Drug Delivery. Academic press; 2024:1–17.
32. Gentine P, Bubel A, Crucifix C, Bourel-Bonnet L, Frisch B. Manufacture of liposomes by isopropanol injection: characterization of the method. J Liposome Res. 2012;22(1):18–30. doi:10.3109/08982104.2011.584318
33. Marazioti A, Papadia K, Giannou A, Stathopoulos GT, Antimisiaris SG. Prolonged retention of liposomes in the pleural cavity of normal mice and high tumor distribution in mice with malignant pleural effusion, after intrapleural injection. Int J Nanomed. 2019;14:3773–3784. doi:10.2147/IJN.S202568
34. Boman NL, Tron VA, Bally MB, Cullis PR. Vincristine-induced dermal toxicity is significantly reduced when the drug is given in liposomes. Cancer Chemother Pharmacol. 1996;37(4):351–355. doi:10.1007/s002800050396
35. Theerakittayakorn K, Bunprasert T. Differentiation capacity of mouse L929 fibroblastic cell line compare with human dermal fibroblast. Int J Med Health Sci. 2011;5(2):51–54.
36. Newton PT, Staines KA, Spevak L, et al. Chondrogenic ATDC5 cells: an optimised model for rapid and physiological matrix mineralisation. Int J Mol Med. 2012;30(5):1187–1193. doi:10.3892/ijmm.2012.1114
37. Yao Y, Wang Y. ATDC5: an excellent in vitro model cell line for skeletal development. J Cell Biochem. 2013;114(6):1223–1229. doi:10.1002/jcb.24467
38. He Y, Yao W, Zhang M, et al. Changes in osteogenic gene expression in hypertrophic chondrocytes induced by SIN-1. Exp Ther Med. 2018;16(2):609–618. doi:10.3892/etm.2018.6261
39. Greenblatt MB, Shim JH, Glimcher LH. Mitogen-activated protein kinase pathways in osteoblasts. Annu Rev Cell Dev Biol. 2013;29:63–79. doi:10.1146/annurev-cellbio-101512-122347
40. Natsaridis E, Gkartziou F, Mourtas S, et al. Moxifloxacin liposomes: effect of liposome preparation method on physicochemical properties and antimicrobial activity against Staphylococcus epidermidis. Pharmaceutics. 2022;14(2):370. doi:10.3390/pharmaceutics14020370
41. Ganguly P, Jones E, Panagiotopoulou V, et al. Electrospun and 3D printed polymeric materials for one-stage critical-size long bone defect regeneration inspired by the Masquelet technique: recent advances. Injury. 2022;53(Suppl 2):S2–S12. doi:10.1016/j.injury.2022.02.036
42. Gong M, Huang C, Huang Y, et al. Core-sheath micro/nano fiber membrane with antibacterial and osteogenic dual functions as biomimetic artificial periosteum for bone regeneration applications. Nanomedicine. 2019;17:124–136. doi:10.1016/j.nano.2019.01.002
43. Xie X, Wang W, Cheng J, et al. Bilayer pifithrin-α loaded extracellular matrix/PLGA scaffolds for enhanced vascularized bone formation. Colloids Surf B Biointerfaces. 2020;190:110903. doi:10.1016/j.colsurfb.2020.110903
44. Chen L, Al-Shawk A, Rea C, et al. Preparation of electrospun nanofibers with desired microstructures using a programmed three-dimensional (3D) nanofiber collector. Mater Sci Eng C Mater Biol Appl. 2020;106:110188. doi:10.1016/j.msec.2019.110188
45. Chen C, Zong S, Wang Z, et al. FTY720 attenuates LPS-induced inflammatory bone loss by inhibiting osteoclastogenesis via the NF-κB and HDAC4/ATF pathways. J Immunol Res. 2023;2023:8571649. doi:10.1155/2023/8571649
46. Tan B, Luo Z, Yue Y, et al. Effects of FTY720 (Fingolimod) on proliferation, differentiation, and migration of brain-derived neural stem cells. Stem Cells Int. 2016;2016:9671732. doi:10.1155/2016/9671732
47. Huang C, Das A, Barker D, et al. Local delivery of FTY720 accelerates cranial allograft incorporation and bone formation. Cell Tissue Res. 2012;347(3):553–566. doi:10.1007/s00441-011-1217-3
48. Yang C, Liu Y, Wang Z, Lin M, Liu C. Controlled mechanical loading improves bone regeneration by regulating type H vessels in a S1Pr1-dependent manner. FASEB J. 2022;36(10):e22530. doi:10.1096/fj.202200339RRR
49. Shang K, He J, Zou J, et al. Fingolimod promotes angiogenesis and attenuates ischemic brain damage via modulating microglial polarization. Brain Res. 2020;1726:146509. doi:10.1016/j.brainres.2019.146509
50. Chang Y, Cho B, Kim S, Kim J. Direct conversion of fibroblasts to osteoblasts as a novel strategy for bone regeneration in elderly individuals. Exp Mol Med. 2019;51(5):1–8. PMID: 31073120; PMCID: PMC6509166. doi:10.1038/s12276-019-0251-1
51. Behara M, Goudy S. FTY720 in immuno-regenerative and wound healing technologies for muscle, epithelial and bone regeneration. Front Physiol. 2023;14:1148932. PMID: 37250137; PMCID: PMC10213316. doi:10.3389/fphys.2023.1148932
52. Hisano Y, Kobayashi N, Kawahara A, Yamaguchi A, Nishi T. The sphingosine 1-phosphate transporter, SPNS2, functions as a transporter of the phosphorylated form of the immunomodulating agent FTY720. J Biol Chem. 2011;286(3):1758–1766. PMID: 21084291; PMCID: PMC3023470. doi:10.1074/jbc.M110.171116
53. Bokui N, Otani T, Igarashi K, et al. Involvement of MAPK signaling molecules and Runx2 in the NELL1-induced osteoblastic differentiation. FEBS Lett. 2008;582(2):365–371. doi:10.1016/j.febslet.2007.12.006
54. Liu H, Liu Y, Viggeswarapu M, Zheng Z, Titus L, Boden SD. Activation of c-Jun NH(2)-terminal kinase 1 increases cellular responsiveness to BMP-2 and decreases binding of inhibitory Smad6 to the type 1 BMP receptor. J Bone Miner Res. 2011;26(5):1122–1132. doi:10.1002/jbmr.296
55. Zhang N, Cui M, Liu X, et al. IL-17F promotes osteoblastic osteogenesis via the MAPK/ERK1/2 signaling pathway. Exp Ther Med. 2021;22(4):1052. doi:10.3892/etm.2021.10486
56. Kim JM, Choi JS, Kim YH, et al. An activator of the cAMP/PKA/CREB pathway promotes osteogenesis from human mesenchymal stem cells. J Cell Physiol. 2013;228(3):617–626. doi:10.1002/jcp.24171
57. Park KH, Choi Y, Yoon DS, Lee KM, Kim D, Lee JW. Zinc promotes osteoblast differentiation in human mesenchymal stem cells via activation of the cAMP-PKA-CREB signaling pathway. Stem Cells Dev. 2018;27(16):1125–1135. doi:10.1089/scd.2018.0023
58. Chen M, Cui Y, Li H, Luan J, Zhou X, Han J. Icariin promotes the osteogenic action of BMP2 by activating the cAMP signaling pathway. Molecules. 2019;24(21):3875. doi:10.3390/molecules24213875
59. Yu W, Chen FC, Xu WN, et al. Inhibition of Y1 receptor promotes osteogenesis in bone marrow stromal cells via cAMP/PKA/CREB pathway. Front Endocrinol. 2020;11:583105. doi:10.3389/fendo.2020.583105
60. Zhang R, Edwards JR, Ko SY, et al. Transcriptional regulation of BMP2 expression by the PTH-CREB signaling pathway in osteoblasts. PLoS One. 2011;6(6):e20780. doi:10.1371/journal.pone.0020780
 © 2025 The Author(s). This work is published and licensed by Dove Medical Press Limited. The
full terms of this license are available at https://www.dovepress.com/terms.php
and incorporate the Creative Commons Attribution
- Non Commercial (unported, 3.0) License.
By accessing the work you hereby accept the Terms. Non-commercial uses of the work are permitted
without any further permission from Dove Medical Press Limited, provided the work is properly
attributed. For permission for commercial use of this work, please see paragraphs 4.2 and 5 of our Terms.
© 2025 The Author(s). This work is published and licensed by Dove Medical Press Limited. The
full terms of this license are available at https://www.dovepress.com/terms.php
and incorporate the Creative Commons Attribution
- Non Commercial (unported, 3.0) License.
By accessing the work you hereby accept the Terms. Non-commercial uses of the work are permitted
without any further permission from Dove Medical Press Limited, provided the work is properly
attributed. For permission for commercial use of this work, please see paragraphs 4.2 and 5 of our Terms.
Recommended articles
bFGF-Loaded Mesoporous Silica Nanoparticles Promote Bone Regeneration Through the Wnt/β-Catenin Signalling Pathway
Shen M, Wang L, Feng L, Gao Y, Li S, Wu Y, Xu C, Pei G
International Journal of Nanomedicine 2022, 17:2593-2608
Published Date: 7 June 2022
The Anti-Psoriatic Efficacy and Safety Profile of Topical and Intralesional Methotrexate: A Literature Review
Chaiyabutr C, Punnakitikashem P, Silpa-archa N, Wongpraprarut C, Chularojanamontri L
Clinical, Cosmetic and Investigational Dermatology 2022, 15:2253-2274
Published Date: 26 October 2022