")
Back to Journals » Neuropsychiatric Disease and Treatment » Volume 20
Predicting Intracerebral Hemorrhage Expansion with Inflammation Indices, Non-Contrast Computed Tomography Signs and Computed Tomography Angiography Spot Sign
Authors Ji Z, Ye W , Wen X, Zhao X , Li N
Received 25 April 2024
Accepted for publication 25 September 2024
Published 3 October 2024 Volume 2024:20 Pages 1879—1887
DOI https://doi.org/10.2147/NDT.S475550
Checked for plagiarism Yes
Review by Single anonymous peer review
Peer reviewer comments 2
Editor who approved publication: Dr Yu-Ping Ning
Zeqiang Ji,1,2 Wanxing Ye,2 Xinyu Wen,1,2 Xingquan Zhao,1– 4,* Na Li1– 3,*
1Department of Neurology, Beijing Tiantan Hospital, Capital Medical University, Beijing, People’s Republic of China; 2China National Clinical Research Center for Neurological Diseases, Beijing Tiantan Hospital, Capital Medical University, Beijing, People’s Republic of China; 3Research Unit of Artificial Intelligence in Cerebrovascular Disease, Chinese Academy of Medical Sciences, Beijing, People’s Republic of China; 4Center of Stroke, Beijing Institute for Brain Disorders, Beijing, People’s Republic of China
*These authors contributed equally to this work
Correspondence: Na Li, Department of Neurology, Beijing Tiantan Hospital, Capital Medical University, No. 119 S Fourth Ring West Road, Fengtai District, Beijing, 100070, People’s Republic of China, Tel +010-59975029, Email [email protected]
Aim: We aimed to investigate whether a combination of inflammatory and radiological biomarkers can improve intracerebral hemorrhage (ICH) hematoma expansion (HE) prediction.
Methods: A retrospective analysis was conducted on patients with primary supratentorial ICH within 6 h of symptom onset between September 2021 and April 2022. Predictors were explored using univariate and logistic regression analysis. We compared the discrimination of inflammatory indice-based model 1 with models 2 and 3, which included image biomarkers, using the receiver operating characteristic curve and De Long test for area under the curve comparison.
Results: A total of 205 eligible participants were included, 56 (27.3%) of whom experienced HE. The neutrophil-to-lymphocyte ratio (NLR), black hole sign, BAT score, and computed tomography angiography (CTA) spot sign were independently associated with HE in the logistic regression (P< 0.05). The addition of non-contrast computed tomography (NCCT) signs did not provide significant discrimination improvement (AUC, Model 2 0.875 [95% CI, 0.822– 0.929] versus Model 1. 0.811 [95% CI, 0.747– 0.875], p=0.089), whereas the added value of the CTA spot sign remained statistically significant (AUC, Model 3 0.922 [95% CI, 0.878– 0.966] versus Model 2; p=0.030; Model 3 versus Model 1, p=0.005).
Conclusion: The combination of inflammatory and radiological biomarkers can predict HE with a satisfactory performance.
Keywords: intracerebral hemorrhage, hematoma expansion, computed tomography angiography, spot sign, BAT score, neutrophil to lymphocyte ratio
A Letter to the Editor has been published for this article.
Introduction
Intracerebral hemorrhage (ICH) accounts for approximately 11%–22% of all strokes worldwide1 with a mortality rate exceeding 40% within one month.2,3 Recognizing and intervening in the risk factors that affect outcomes are crucial. Hematoma expansion (HE) is a major contributing factor to early neurological deterioration and poor functional outcomes in patients with ICH.4 It is important to identify ICH patients at high risk of HE as early as possible for targeted monitoring and treatment. A large meta-analysis showed that hematoma volume, time from onset to baseline imaging, and previous antiplatelet or anticoagulant therapy were highly effective predictors of HE.5 Furthermore, numerous studies have demonstrated the significant role of neuroinflammatory biomarkers in secondary brain injury following ICH event.6 Among the radiological biomarkers of HE, the Computed Tomography Angiography (CTA) spot sign provides values for predicting HE.7 However, owing to limited accessibility to CTA, the Non-Contrast Computed Tomography (NCCT) signs8 and BAT score9 based on NCCT signs have been developed as alternative approaches. The objective of this study was to explore the predictive abilities of combining inflammatory indices, NCCT signs, and BAT score with the CTA spot sign to identify the risk of HE.
Materials and Method
Study Population
The study included patients admitted to Beijing Tiantan Hospital between September 2021 and April 2022 who were diagnosed with primary spontaneous non-traumatic supratentorial ICH. The following inclusion criteria were applied: (1) age ≥18 years; (2) baseline NCCT and CTA were completed within 6 hours of onset;10 (3) follow-up NCCT was completed within 24–48h from symptom onset, and the following exclusion criteria were used: (1) traumatic brain bleeding; (2) ICH related to arteriovenous malformation, neoplastic lesion, or aneurysm-related ICH; (3) hemorrhagic transformation of ischemic stroke; (4) primary interventricular hemorrhage; (5) missing the outcomes and/or follow-up image; (6) previous anticoagulant use. The population selection flowchart is provided in Figure 1. The study was performed in accordance with the guidelines of the Helsinki Declaration and approved by the Research Ethics Committee of Beijing Tiantan Hospital (KY2021-025-01). Written informed consent was obtained from all subjects or their legally authorized representatives.
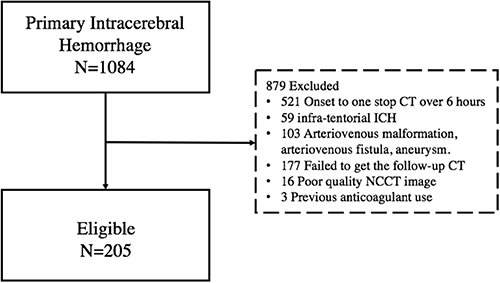 |
Figure 1 Flowchart of participants selection. Abbreviations: ICH, intracerebral hemorrhage; and NCCT, non-contrast computed tomography. |
Clinical Variables
The following clinical variables were collected by researchers who were blinded to the outcome of HE: age, sex, medical history of hypertension, ICH, antihypertensive, antiplatelet therapy before ICH onset, admission systolic blood pressure (SBP), Glasgow Coma Scale (GCS) score, National Institute of Health Stroke Scale (NIHSS) score, time from onset to NCCT, and laboratory variables (red blood cell count, white blood cell count, platelet count, neutrophil count, lymphocyte count, C-reactive protein level, and admission glucose level). The neutrophil-to-lymphocyte ratio (NLR) was defined as the neutrophil count divided by the lymphocyte count.
Image Acquisition and Interpretation
One-stop multimodal CT, including the baseline NCCT (a 16-slice CT scanner (Brilliance iCT; Philips Healthcare, Cleveland, OH, USA), and the helical scan parameters were as follows: 120 kVp, 310 mAs, 5 mm thickness, image size: 512×512) and CTA (CTA was performed immediately after the initial NCCT performance using a bolus-tracking method by injecting 90 mL of nonionic iodinated contrast (IOHEXOL) at 5 mL/s. The protocol for the circle of Willis was 80 kVp, 350 mAs, 0.5 second/rotation, 0.75 mm thick with a pitch of 0.65) were completed in the emergency department of Beijing Tiantan Hospital. The hematoma volumes at baseline and follow-up NCCT were calculated using the ABC/2 formula.11 NCCT images were analyzed to determine the location of ICH, presence of intraventricular hemorrhage, and categorization into lobar (ICH involving the cortex and cortical-subcortical junction) or deep (ICH involving the thalamus, basal ganglia, internal capsule, and deep periventricular white matter). The CTA spot sign,10 various NCCT signs (Hypodensities,12 Blend sign,13 Swirl sign,14 Satellite sign,15 Black hole sign,16 Island sign17), and BAT score9 were interpreted based on their definitions. All imaging characteristics were identified by two trained neurologists who were blinded to the outcomes and were supervised by a veteran radiologist.
Primary Outcome
HE was defined as an increase of >6 mL absolute volume or >33% relative volume of hematoma in the follow-up CT compared to the baseline NCCT.4
Statistical Analysis
Continuous variables were expressed as median (interquartile range) or mean (SD) and examined using the Mann–Whitney U-test or Student’s t-test. Categorical variables are presented as counts (percentages) and were compared using the χ2 test or Fisher’s exact test. Variables with p<0.05, from the comparison of HE and non-HE groups, were included in multivariate binary logistic regression (backward stepwise selection). All analyses were performed with the statistical package SPSS version 26.0 (www.spss.com), and statistical significance was set at p<0.05.
Model Development
Three models were developed based on the different sets of variables. Model 1 included five clinically significant univariate variables (NLR, antihypertensive therapy, admission SBP, C-reactive protein, and time from onset to NCCT) and 3 predictors may associate with HE (age, sex, GCS). Second, Model 2 included four variables in model 1 and 4 significant univariate NCCT metrics (baseline hematoma volume, black hole sign, satellite sign, and BAT score≥3), adjusting with multivariate logistic regression. Since the BAT score contained variables such as onset-to-CT time, hypodensities, and blend sign, these three predictors were excluded from model 2. Finally, Model 3 included all variables in Model 2, along with the CTA spot sign. The discriminative abilities of the three models were evaluated using receiver operating characteristic (ROC) curves with the De Long test to compare areas under the curve (AUCs). We also compared the prediction abilities of Model 1 with those of CTA SS alone and CTA SS combined with BAT score≥3.
Results
Participants
A total of 1084 ICH patients were screened between September 2021 and April 2022. Of these, 205 patients with supratentorial ICH who underwent one-stop multimodal CT (NCCT and CTA) within 6 h of completing the follow-up CT between 24 and 48 h were enrolled, of whom 56 (27.3%) experienced HE. The mean age of this cohort was 55.0 years (45.5–64.5), with a median NCCT hematoma volume of 33.4 mL (11.7–49.0) and a median Glasgow Coma Scale score of 13 (9–15) on admission. Patients with HE had a larger hematoma volume on baseline NCCT (43.8 vs 28.8 mL, p<0.001), a shorter time from onset to NCCT (160 minutes vs 234 minutes, p<0.001), a higher admission SBP (181 vs 170 mmHg, p=0.037), a higher NLR (9.4 versus 5.4, p<0.001), and a lower prevalence of antihypertensive treatments (19.6% versus 39.6%, p=0.007). The HE group had higher rates of hypodensities (67.9% vs 32.9%, p<0.001), blend sign (37.5% vs 11.4%, p<0.001), black hole sign (37.5% vs 11.4%, p<0.001), satellite signs (60.7% vs 35.6%, p=0.001), CTA spot sign (57.1% vs 8.7%, p<0.001), and BAT score≥3 (58.9% vs 10.1%, p<0.001) (Table 1).
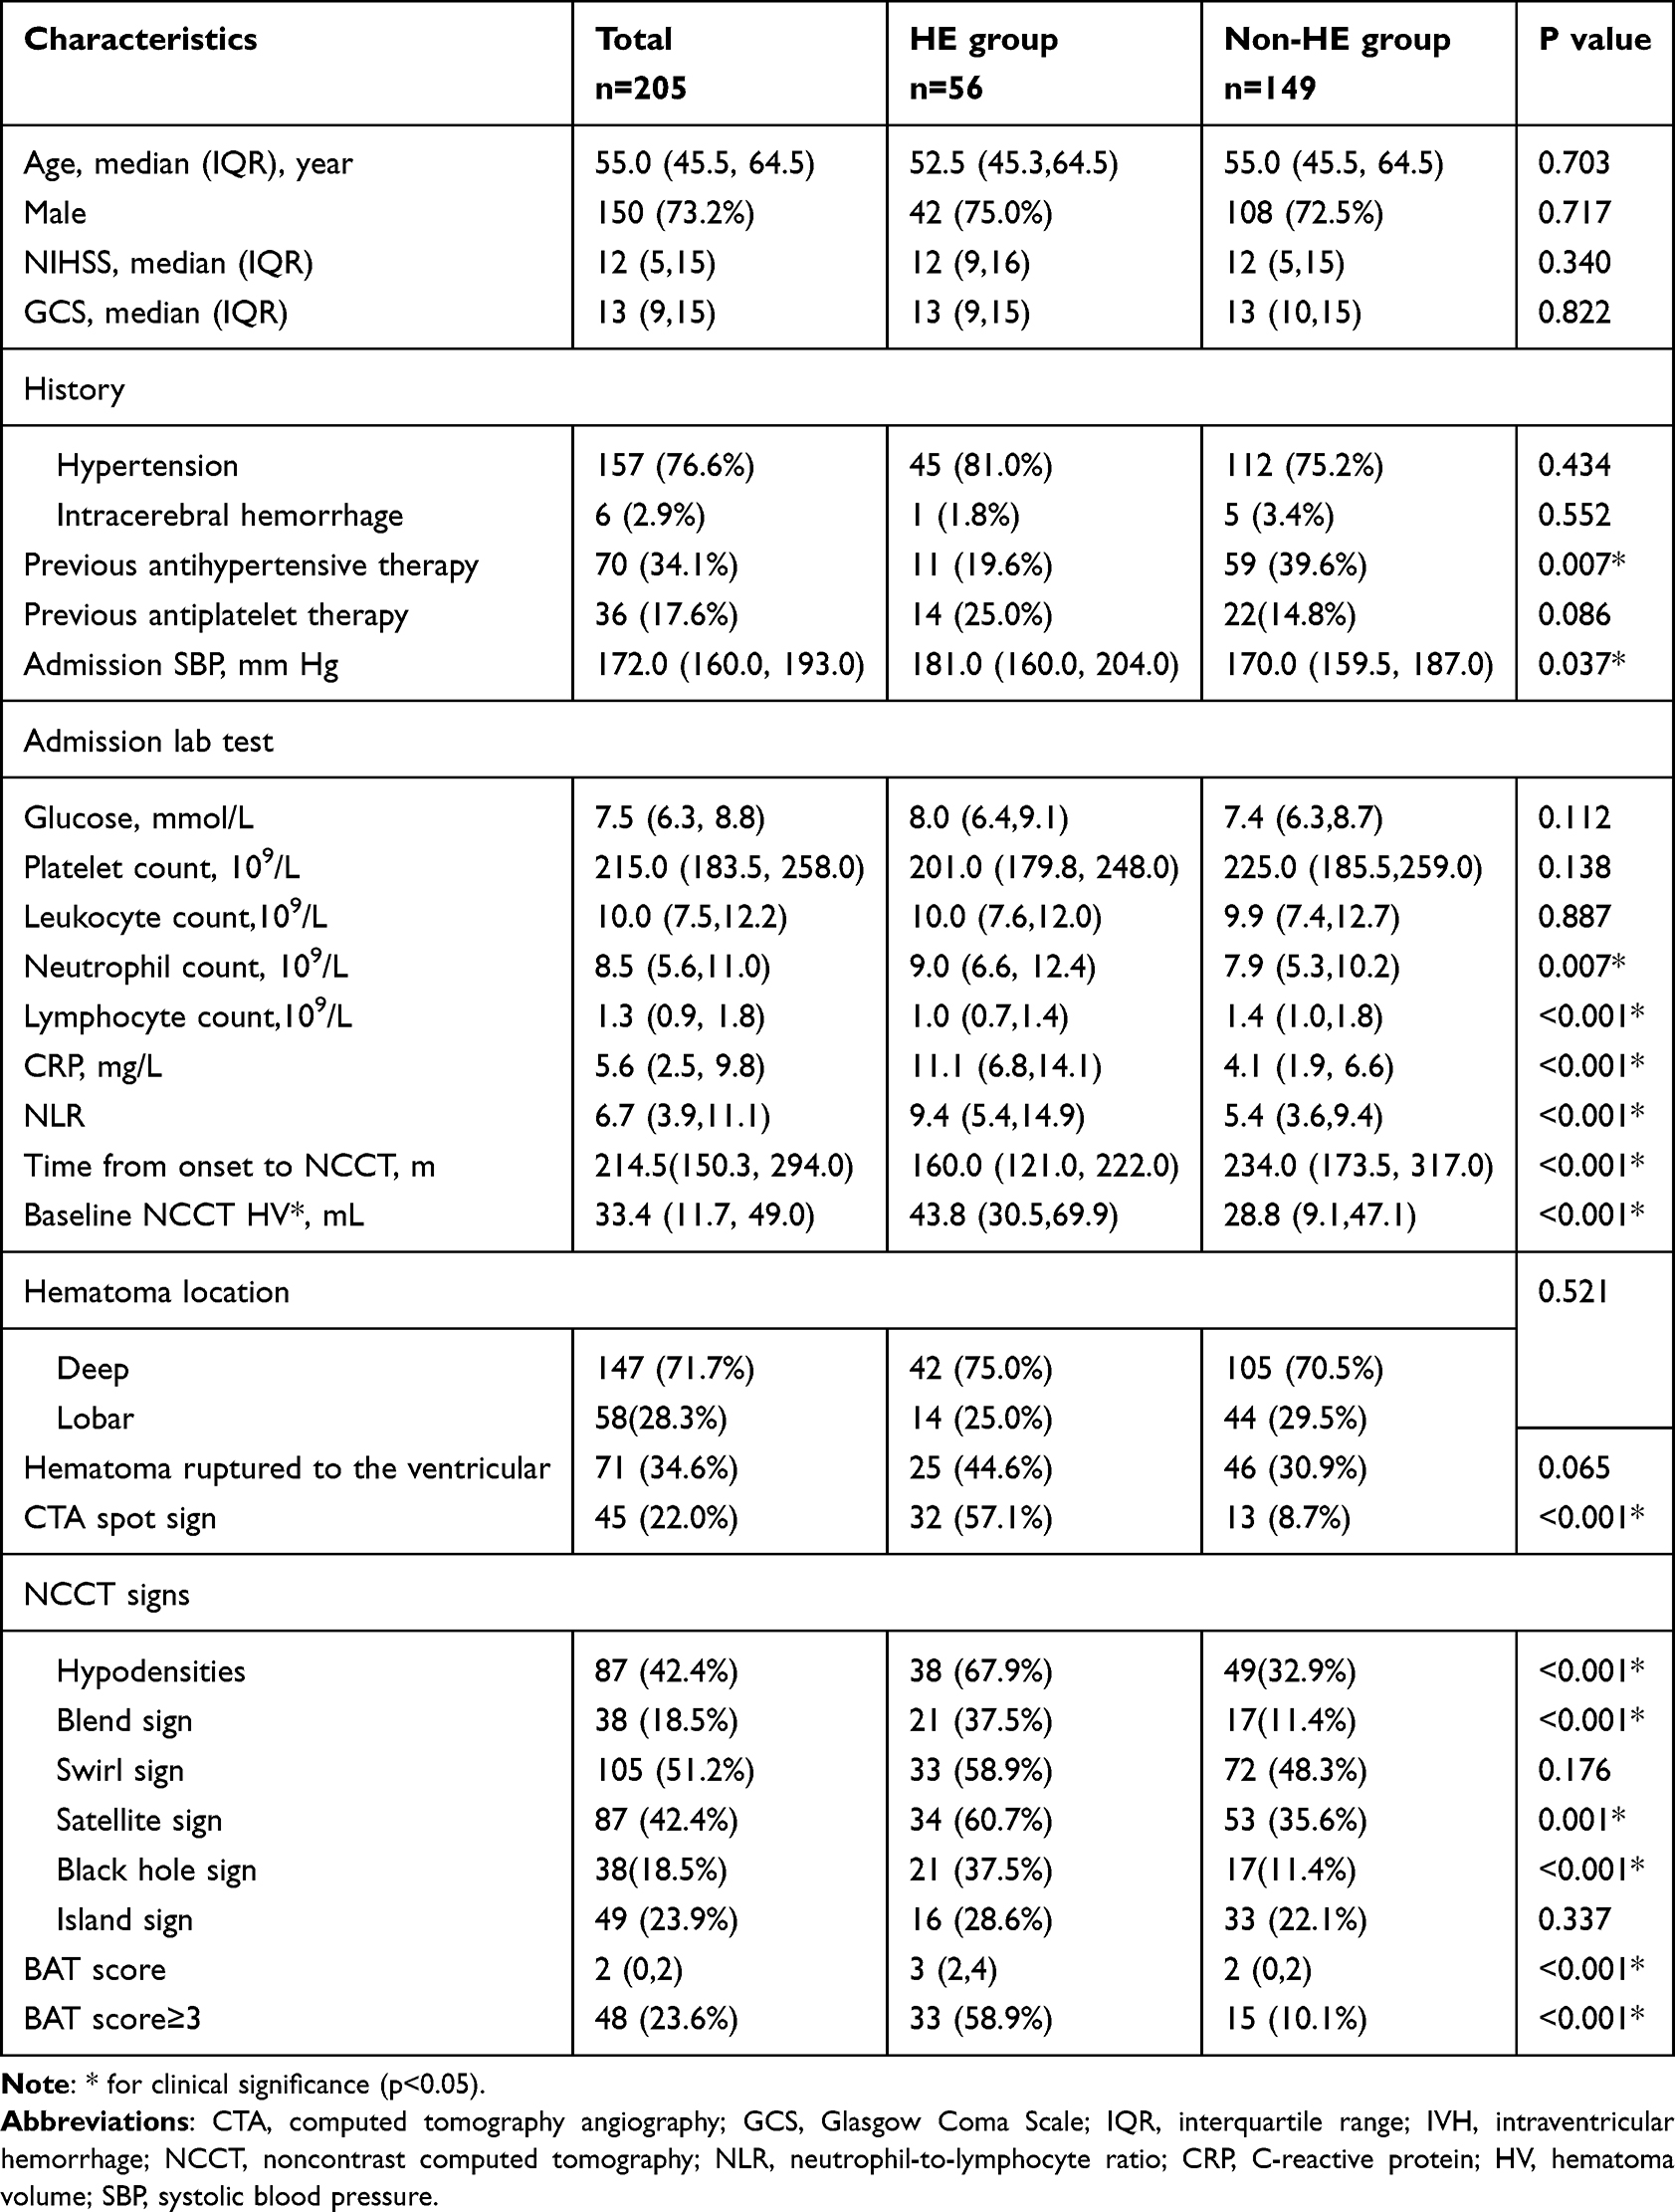 |
Table 1 Baseline Characteristics of the participants |
Model Development
In Model 1, four indicators (NLR, C-reactive protein level, antihypertensive therapy, and time from onset to NCCT) independently predicted HE, with an AUC of 0.811 [95% CI, 0.747–0.875]. In Model 2, four factors (NLR, baseline hematoma volume, BAT score≥3, and black hole sign) showed an increasing trend in prediction (Model 2 AUC, 0.875 [95% CI, 0.822–0.929]), but the improvement compared to Model 1 was not statistically significant (the AUCs of Model 2 vs Model 1, p= 0.089, Delong test). Model 3, which included NLR, BAT score≥3, black hole sign, and CTA spot sign, independently predicted HE, with an AUC of 0.922 [95% CI, 0.878–0.966]. Model 3 demonstrated significantly better discrimination than both Model 1 and Model 2 (p= 0.030 for Model 3 vs Model 2; p= 0.005 for Model 3 vs Model 1, Delong test) (Table 2 and Table 3 and Figure 2A). Additionally, when comparing Model 1 with the CTA spot sign alone (AUC, 0.747 [95% CI, 0.662–0.832]) and the CTA spot sign combined with BAT score ≥3(AUC, 0.864 [95% CI, 0.801–0.926]), the results showed that Model 1 had a similar prediction performance without statistically significant differences when compared to these two predictors (Model 1 vs spot sign, p=0.168; Model 1 vs spot sign combined with BAT score ≥3, p=0.242, Delong test) (Figure 2B).
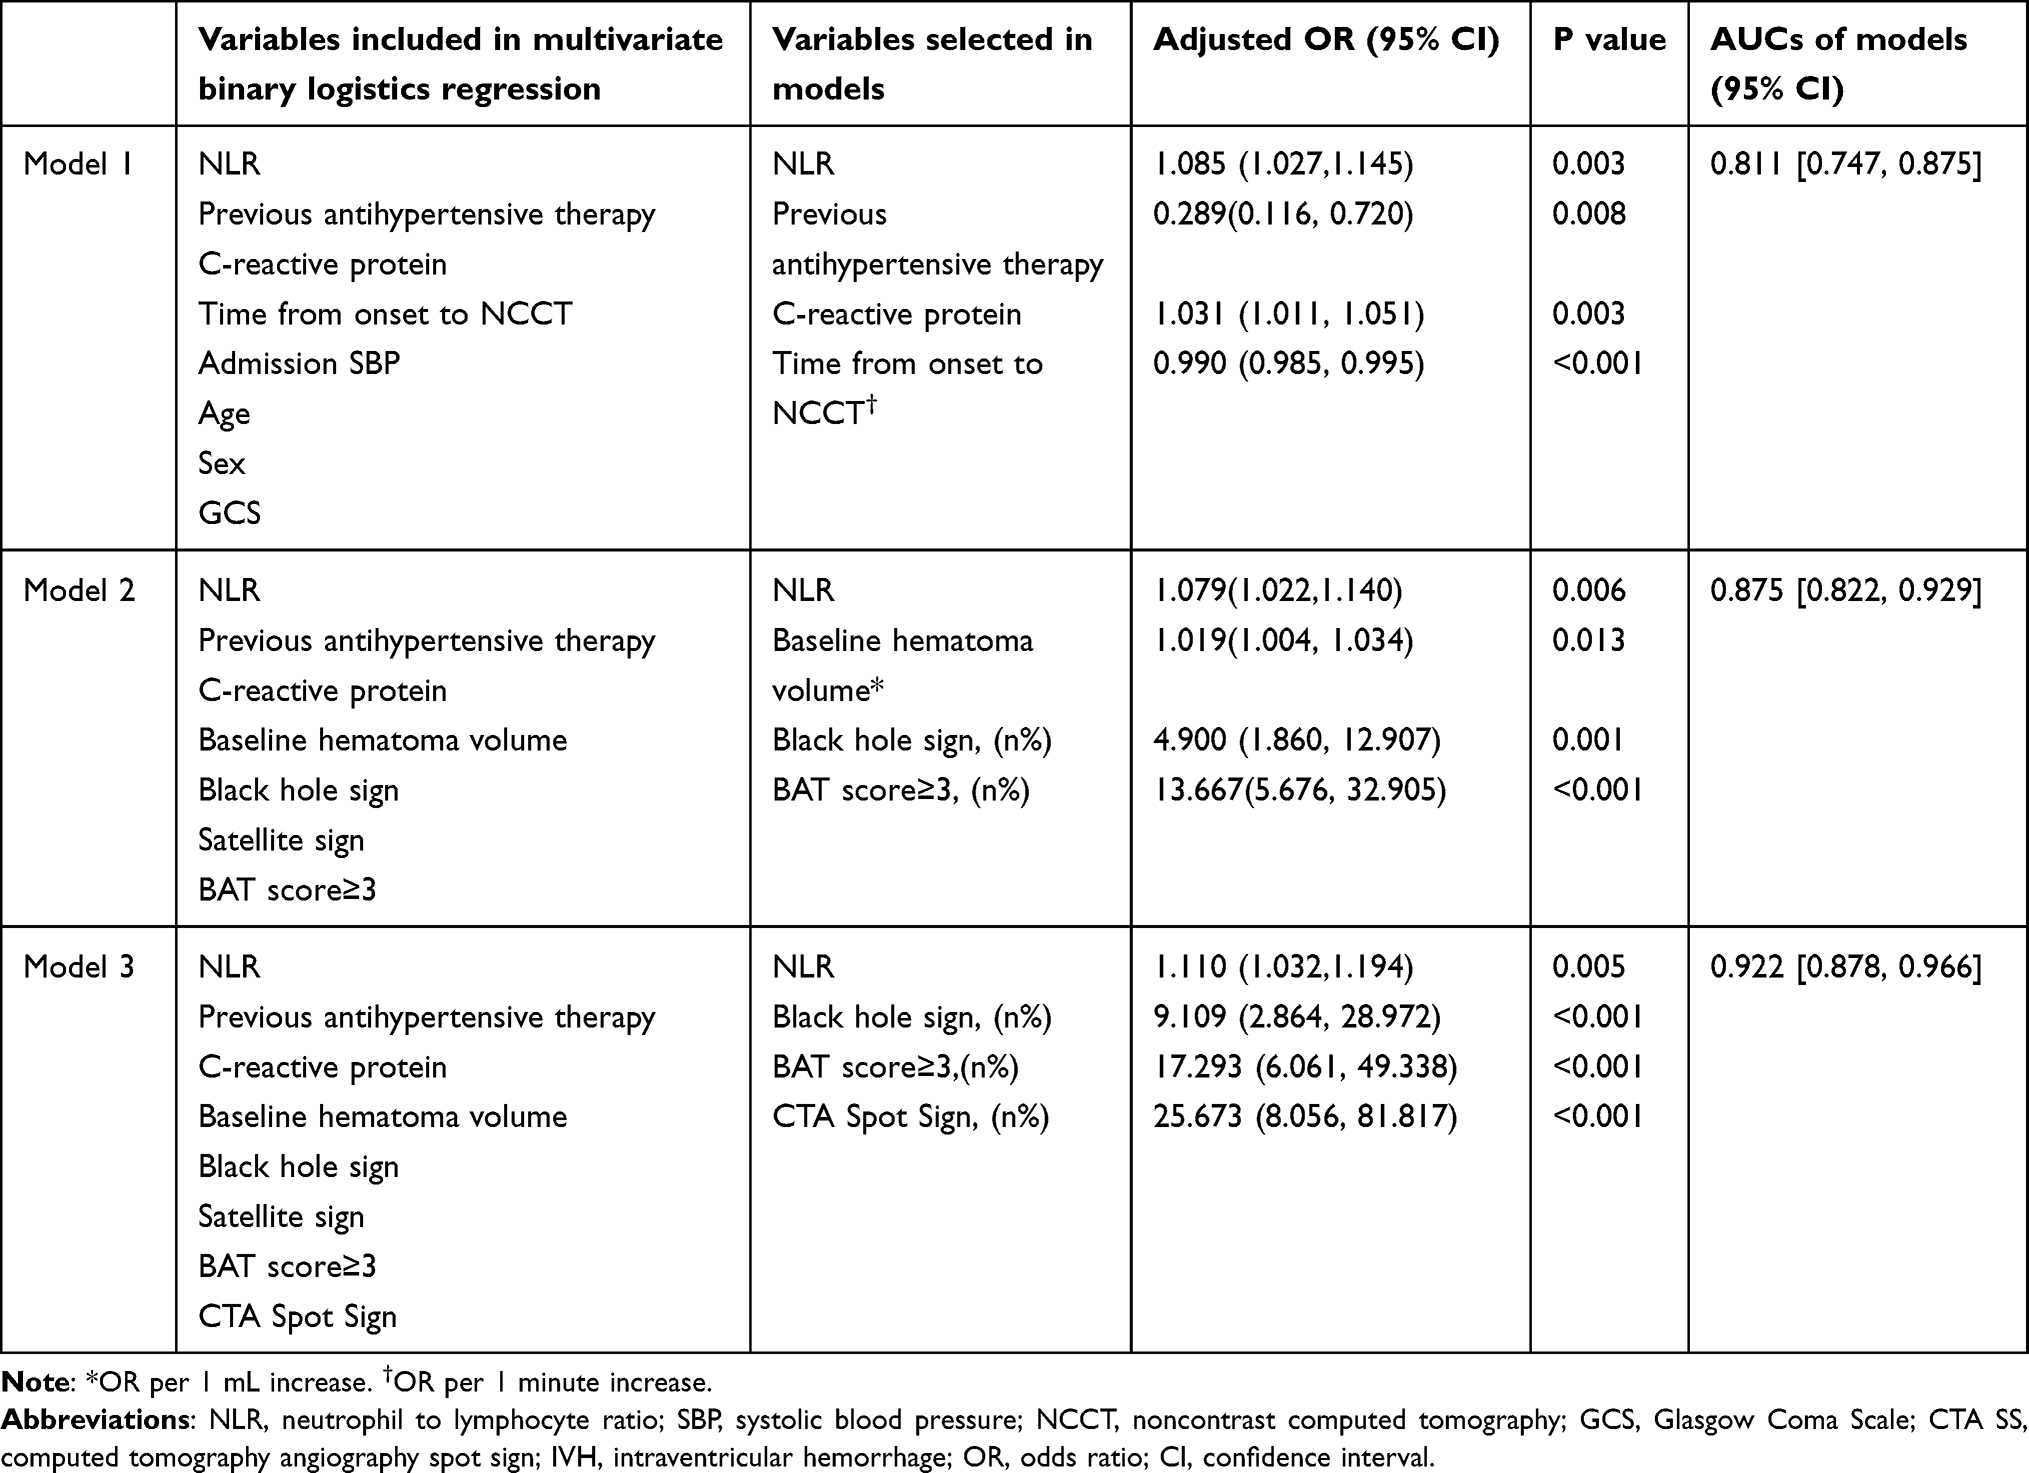 |
Table 2 Models and Predictors of Hematoma Expansion Prediction |
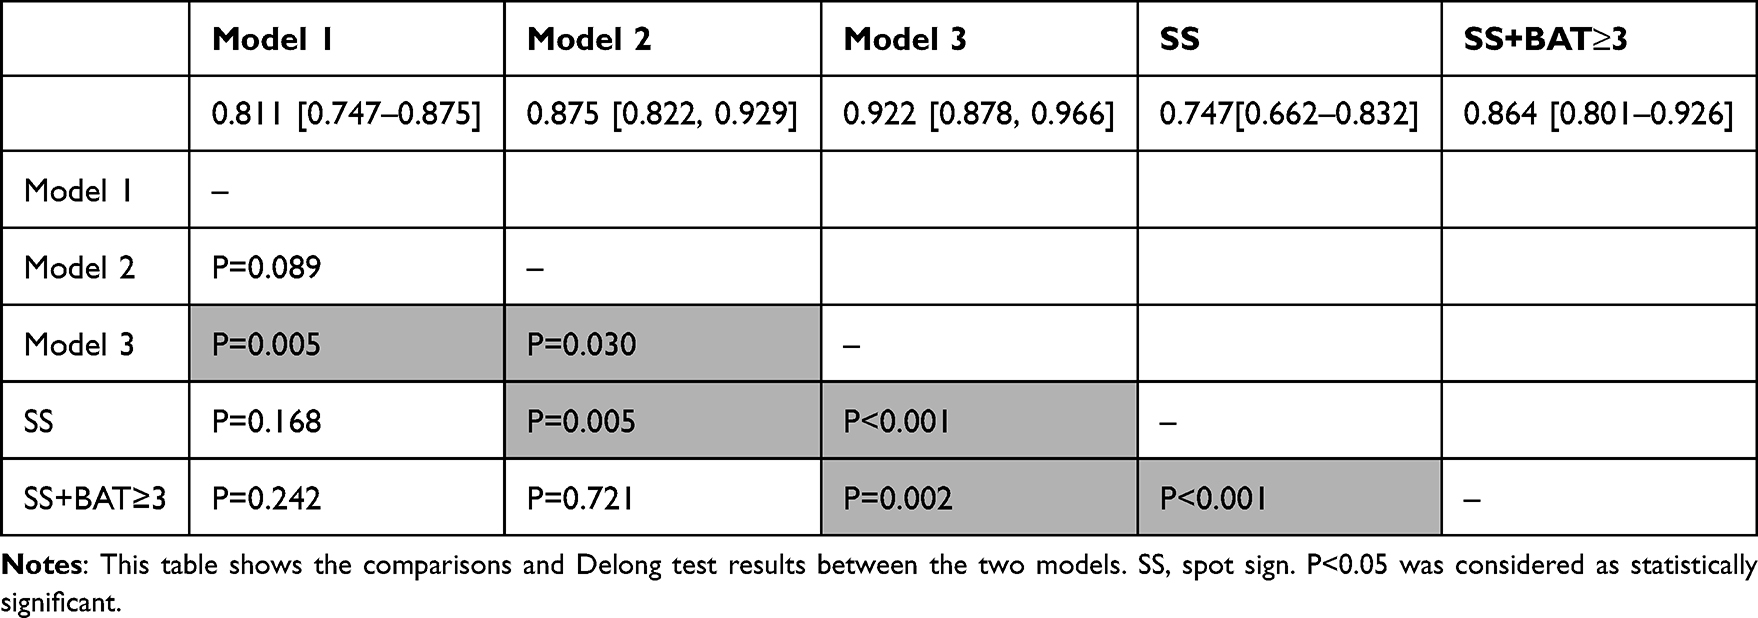 |
Table 3 Cross Table of 3 Models and Others |
 |
Figure 2 ROC curves of 5 nomograms for the predicted probability of hematoma expansion in patients (n=205). A. Model 1: AUC [95% CI]: 0.811 [0.747, 0.875]; Model 2: AUC [95% CI]: 0.875 [0.822, 0.929]; Model 3: AUC [95% CI]: 0.922 [0.878, 0.966]. B. CTA spot sign: AUC [95% CI]: 0.747[0.662–0.832]; CTA spot sign plus BAT score: AUC [95% CI]: 0.864 [0.801–0.926]. Abbreviations: AUC, area under the curve; CTA, computed tomography angiography; and ROC, receiver operating characteristic curves. |
Discussion
In our study, we initially developed an inflammatory indice-based model 1 involving NLR and CRP for predicting HE, which exhibited satisfactory discriminatory ability. Furthermore, with the addition of NCCT signs, including the black hole sign and BAT score≥3 in Model 2, there was a notable trend towards further improvement in predictive capability, although the difference was not statistically significant. Moreover, the integration of spot signs evaluated on CTA in Model 3 significantly enhanced diagnostic accuracy. This suggests that combining inflammatory indices with neuroradiological biomarkers via advanced imaging assessments may be an optimal method for HE prediction.
Our study provides insights into the role of the post-ICH inflammatory response in predicting HE. We developed inflammatory model 1, which incorporated NLR and CRP and effectively predicted HE. In contrast, no significant differences were observed between the CTA spot sign alone and the spot sign combined with BAT≥3 on NCCT images. This shows that the inflammatory model could serve as an alternative to current imaging methods to some extent. It was known that the secondary injury after ICH developed soon and was accelerated with neuro-inflammation occurred in peri-hematoma tissue, involving the activation of microglial and infiltration of neutrophils.18 Animal ICH model studies have demonstrated that neutrophils, the earliest leukocytes, respond to ICH within 4 hours.19 Microglial-induced pro-inflammatory and cytotoxic cytokines, such as tumor necrosis factor-α (TNF-α), interleukin (IL)-1β, matrix metalloproteinase-9 (MMP-9),20 and IL-1521 contribute to neutrophil aggregation, apoptosis of peri-hematoma tissue, blood-brain barrier rupture, and activation of reactive oxidative stress.22 Several clinical studies have also confirmed that the upregulation of MMP-9 correlates with HE and poor outcomes.23,24 Additionally, NLR has been shown to serve as an indicator of secondary injury, which can effectively predict HE25 and peri-hematoma edema after ICH.26 Napoli et al demonstrated that elevated serum CRP levels correlate with a larger hematoma volume and activation of complement 3 and microglia, leading to impaired vascular integrity and the occurrence of HE.27 A high CRP (over 10 mg/L) is an independent predictor of HE.28 Notably, the growing focus on post-stroke neuroinflammation has prompted the development of new anti-inflammatory therapies. The use of fingolimod reduces MMP-9 levels in patients with ICH, which can effectively alleviate peri-hematoma edema.29 Nevertheless, the use of anti-inflammatory therapies targeting HE has not been reported to date, and further research is needed.
In our study, we further developed two models combining inflammatory and radiological biomarkers (black hole sign, BAT score≥3, and spot sign) to enhance the predictive ability of HE with excellent AUCs. The BAT score is an accepted scale for HE prediction, which is simple and easy to use.9 The blend sign and hypodensities in the BAT score, as well as the black hole sign, indicated heterogeneous density within the hematoma, which reflects different stages of coagulation of the bleeding site in the acute phase, and could therefore predict HE. The spot sign on CTA remains an effective predictor of HE and is indicative of an active hemorrhage.30 Most previous studies have shown that the CTA spot sign has a better predictive efficacy than NCCT signs.31,32 However, Sporns et al showed that the black hole sign was an independent predictor, other than the CTA spot sign.33 Therefore, the combination of spot signs and NCCT signs for screening individuals at high risk of HE has become a feasible approach in recent studies.34,35 Morroti et al showed that hypodensities, instead of spot signs, provided a significant added value in the prediction of HE and appeared to be a valuable alternative to the CTA spot sign.34 Conversely, our study demonstrated that the inclusion of the CTA spot sign could significantly enhance the predictive ability of HE based on inflammatory biomarkers and NCCT signs. Our findings suggest that the optimal assessment to stratify the risk of HE with good discrimination should include NLR and CRP, as well as both NCCT and CTA, if possible. This could, to the best extent, increase the predictive performance. Recent studies indicate that during the acute phase of ICH, various interventions have been implemented to enhance prognosis, such as acute blood pressure lowering, strict glucose control, and reversal of anticoagulants.36,37 Consequently, the identification of high-risk HE patients holds significant importance for the precise treatment of this condition and improve the outcomes.
Some limitations of this study should be considered when interpreting the results. First, our findings were derived from a single-center retrospective analysis; therefore, further prospective studies are warranted. Second, the results can be altered because of the different definitions of HE. Additionally, we also noticed that NCCT signs could predict the IVH growth and ultra-early IVH growth predicts poor outcomes,38,39 due to limits of our methods for calculating hematoma volume, we could not validate this in our study, Further efforts are required to enhance the predictive performance of NCCT.
Conclusions
The neutrophil-to-lymphocyte ratio, black-hole sign, BAT score, and CTA spot sign were significant predictors of HE. This combination could further stratify the risk of HE accurately.
Data Sharing Statement
The datasets generated and analyzed in the current study are available from the corresponding author upon reasonable request.
Ethics Approval and Informed Consent
The study was performed in accordance with the guidelines of the Helsinki Declaration and approved by the Research Ethics Committee of Beijing Tiantan Hospital (KY2021-025-01). Written informed consent was obtained from all subjects or their legally authorized representatives.
Acknowledgments
We thank all patients and healthcare providers who participated in this study and Mr. Youxia Ye for polishing the manuscript.
Author Contributions
All authors made a significant contribution to the work reported, whether that is in the conception, study design, execution, acquisition of data, analysis and interpretation, or in all these areas; took part in drafting, revising or critically reviewing the article; gave final approval of the version to be published; have agreed on the journal to which the article has been submitted; and agree to be accountable for all aspects of the work.
Consent for Publications
All authors agreed to publish the details of the details in this manuscript.
Funding
This study was supported by the National Key Research and Development Program of China (2022YFC2504903), the Beijing Municipal Committee of Science and Technology (Z201100005620010), and the National Natural Science Foundation of China (81671172).
Disclosure
All the authors declared no competing interests.
References
1. Tsao CW, Aday AW, Almarzooq ZI, et al. Heart Disease and Stroke Statistics-2022 Update: a Report From the American Heart Association. Circulation. 2022;145(8):e153–e639. doi:10.1161/CIR.0000000000001052
2. van Asch CJ, Luitse MJ, Rinkel GJ, van der Tweel I, Algra A, Klijn CJ. Incidence, case fatality, and functional outcome of intracerebral haemorrhage over time, according to age, sex, and ethnic origin: a systematic review and meta-analysis. Lancet Neurol. 2010;9(2):167–176. doi:10.1016/S1474-4422(09)70340-0
3. Qureshi AI, Mendelow AD, Hanley DF. Intracerebral haemorrhage. Lancet. 2009;373(9675):1632. doi:10.1016/S0140-6736(09)60371-8
4. Dowlatshahi D, Demchuk AM, Flaherty ML, Ali M, Lyden PL, Smith EE. Defining hematoma expansion in intracerebral hemorrhage: relationship with patient outcomes. Neurology. 2011;76(14):1238. doi:10.1212/WNL.0b013e3182143317
5. Salman R A-S, Frantzias J, Lee RJ, et al. Absolute risk and predictors of the growth of acute spontaneous intracerebral haemorrhage: a systematic review and meta-analysis of individual patient data. Lancet Neurol. 2018;17(10):885. doi:10.1016/S1474-4422(18)30253-9
6. Shi K, Wood K, Shi F-D, Wang X, Liu Q. Stroke-induced immunosuppression and poststroke infection. Stroke Vasc Neurol. 2018;3(1):34–41. doi:10.1136/svn-2017-000123
7. Wada R, Aviv RI, Fox AJ, et al. CT angiography ”spot sign” predicts hematoma expansion in acute intracerebral hemorrhage. Stroke. 2007;38(4):1257–1262. doi:10.1161/01.STR.0000259633.59404.f3
8. Morotti A, Boulouis G, Dowlatshahi D, et al. Standards for Detecting, Interpreting, and Reporting Noncontrast Computed Tomographic Markers of Intracerebral Hemorrhage Expansion. Ann Neurol. 2019;86(4):480. doi:10.1002/ana.25563
9. Morotti A, Dowlatshahi D, Boulouis G, et al. Predicting Intracerebral Hemorrhage Expansion With Noncontrast Computed Tomography: the BAT Score. Stroke. 2018;49(5):1163–1169. doi:10.1161/STROKEAHA.117.020138
10. Demchuk AM, Dowlatshahi D, Rodriguez-Luna D, et al. Prediction of haematoma growth and outcome in patients with intracerebral haemorrhage using the CT-angiography spot sign (PREDICT): a prospective observational study. Lancet Neurol. 2012;11(4):307–314. doi:10.1016/s1474-4422(12)70038-8
11. Kothari RU, Brott T, Broderick JP, et al. The ABCs of measuring intracerebral hemorrhage volumes. Stroke. 1996;27(8):1304–1305. doi:10.1161/01.STR.27.8.1304
12. Boulouis G, Morotti A, Brouwers HB, et al. Association between hypodensities detected by computed tomography and hematoma expansion in patients with intracerebral hemorrhage. JAMA neurol. 2016;73(8):961–968. doi:10.1001/jamaneurol.2016.1218
13. Li Q, Zhang G, Huang YJ, et al. Blend Sign on Computed Tomography: novel and Reliable Predictor for Early Hematoma Growth in Patients With Intracerebral Hemorrhage. Stroke. 2015;46(8):2119–2123. doi:10.1161/STROKEAHA.115.009185
14. Selariu E, Zia E, Brizzi M, Abul-Kasim K. Swirl sign in intracerebral haemorrhage: definition, prevalence, reliability and prognostic value. BMC Neurol. 2012;12:109. doi:10.1186/1471-2377-12-109
15. Shimoda Y, Ohtomo S, Arai H, Okada K, Tominaga T. Satellite Sign: a Poor Outcome Predictor in Intracerebral Hemorrhage. Cerebr dise. 2017;44(3–4):105–112. doi:10.1159/000477179
16. Li Q, Zhang G, Xiong X, et al. Black Hole Sign: novel Imaging Marker That Predicts Hematoma Growth in Patients With Intracerebral Hemorrhage. Stroke. 2016;47(7):1777–1781. doi:10.1161/STROKEAHA.116.013186
17. Li Q, Liu QJ, Yang WS, et al. Island Sign: an Imaging Predictor for Early Hematoma Expansion and Poor Outcome in Patients With Intracerebral Hemorrhage. Stroke. 2017;48(11):3019–3025. doi:10.1161/strokeaha.117.017985
18. Wu H, Zhang Z, Hu X, et al. Dynamic changes of inflammatory markers in brain after hemorrhagic stroke in humans: a postmortem study. Brain Res. 2010;1342:111–117. doi:10.1016/j.brainres.2010.04.033
19. Wang J, Dore S. Inflammation after intracerebral hemorrhage. J Cereb Blood Flow Metab. 2007;27(5):894–908. doi:10.1038/sj.jcbfm.9600403
20. Chen S, Yang Q, Chen G, Zhang JH. An update on inflammation in the acute phase of intracerebral hemorrhage. Transl Stroke Res. 2015;6(1):4–8. doi:10.1007/s12975-014-0384-4
21. Shi SX, Li YJ, Shi K, Wood K, Ducruet AF, Liu Q. IL (Interleukin)-15 Bridges Astrocyte-Microglia Crosstalk and Exacerbates Brain Injury Following Intracerebral Hemorrhage. Stroke. 2020;51(3):967–974. doi:10.1161/STROKEAHA.119.028638
22. Xue M, Yong VW. Neuroinflammation in intracerebral haemorrhage: immunotherapies with potential for translation. Lancet Neurol. 2020;19(12):1023–1032. doi:10.1016/S1474-4422(20)30364-1
23. Li N, Liu YF, Ma L, et al. Association of molecular markers with perihematomal edema and clinical outcome in intracerebral hemorrhage. Stroke. 2013;44(3):658–663. doi:10.1161/strokeaha.112.673590
24. Shi Y, Fan X, Li G, Zhong D, Zhang X. Association of Serum Dystroglycan, MMP-2/9 and AQP-4 with Haematoma Expansion in Patients with Intracerebral Haemorrhage. Neuropsychiatr Dis Treat. 2021;17:11–18. doi:10.2147/ndt.S283016
25. Kim Y, Sohn JH, Kim C, Park SY, Lee SH. The Clinical Value of Neutrophil-to-Lymphocyte Ratio and Platelet-to-Lymphocyte Ratio for Predicting Hematoma Expansion and Poor Outcomes in Patients with Acute Intracerebral Hemorrhage. J Clin Med. 2023;12(8). doi:10.3390/jcm12083004[published
26. Giede-Jeppe A, Bobinger T, Gerner ST, et al. Neutrophil-to-Lymphocyte Ratio Is an Independent Predictor for In-Hospital Mortality in Spontaneous Intracerebral Hemorrhage. Cerebr dise. 2017;44(1–2):26–34. doi:10.1159/000468996
27. Di Napoli M, Godoy DA, Campi V, et al. C-reactive protein level measurement improves mortality prediction when added to the spontaneous intracerebral hemorrhage score. Stroke. 2011;42(5):1230–1236. doi:10.1161/strokeaha.110.604983
28. Di Napoli M, Parry-Jones AR, Smith CJ, et al. C-reactive protein predicts hematoma growth in intracerebral hemorrhage. Stroke. 2014;45(1):59–65. doi:10.1161/strokeaha.113.001721
29. Li YJ, Chang GQ, Liu Y, et al. Fingolimod alters inflammatory mediators and vascular permeability in intracerebral hemorrhage. Neurosci Bull. 2015;31(6):755–762. doi:10.1007/s12264-015-1532-2
30. Morotti A, Brouwers HB, Romero JM, et al. Intensive Blood Pressure Reduction and Spot Sign in Intracerebral Hemorrhage: a Secondary Analysis of a Randomized Clinical Trial. JAMA Neurol. 2017;74(8):950–960. doi:10.1001/jamaneurol.2017.1014
31. Sporns PB, Schwake M, Kemmling A, et al. Comparison of Spot Sign, Blend Sign and Black Hole Sign for Outcome Prediction in Patients with Intracerebral Hemorrhage. Journal of Stroke. 2017;19(3):333–339. doi:10.5853/jos.2016.02061
32. Yu Z, Zheng J, Ma L, et al. The predictive accuracy of the black hole sign and the spot sign for hematoma expansion in patients with spontaneous intracerebral hemorrhage. Neurol Sci. 2017;38(9):1591–1597. doi:10.1007/s10072-017-3006-6
33. Sporns PB, Schwake M, Schmidt R, et al. Computed Tomographic Blend Sign Is Associated With Computed Tomographic Angiography Spot Sign and Predicts Secondary Neurological Deterioration After Intracerebral Hemorrhage. Stroke. 2017;48(1):131–135. doi:10.1161/strokeaha.116.014068
34. Morotti A, Boulouis G, Nawabi J, et al. Using Noncontrast Computed Tomography to Improve Prediction of Intracerebral Hemorrhage Expansion. Stroke. 2023;54(2):567–574. doi:10.1161/STROKEAHA.122.041302
35. Sporns PB, Kemmling A, Schwake M, et al. Triage of 5 Noncontrast Computed Tomography Markers and Spot Sign for Outcome Prediction After Intracerebral Hemorrhage. Stroke. 2018;49(10):2317–2322. doi:10.1161/strokeaha.118.021625
36. Ma L, Hu X, Song L, et al. The third Intensive Care Bundle with Blood Pressure Reduction in Acute Cerebral Haemorrhage Trial (INTERACT3): an international, stepped wedge cluster randomised controlled trial. Lancet. 2023;402(10395):27–40. doi:10.1016/s0140-6736(23)00806-1
37. Li Q, Yakhkind A, Alexandrov AW, et al. Code ICH: a Call to Action. Stroke. 2024;55(2):494–505. doi:10.1161/strokeaha.123.043033
38. Lv XN, Cheng J, Liu XY, et al. Ultraearly Intraventricular Hemorrhage Growth Predicts Early Neurologic Deterioration and Poor Functional Outcome After Acute Intracerebral Hemorrhage. J American Heart Associ. 2023;12(21):e031214. doi:10.1161/jaha.123.031214
39. Nawabi J, Schlunk F, Dell’Orco A, et al. Non-contrast computed tomography features predict intraventricular hemorrhage growth. Eur Radiol. 2023;33(11):7807–7817. doi:10.1007/s00330-023-09707-9
 © 2024 The Author(s). This work is published and licensed by Dove Medical Press Limited. The
full terms of this license are available at https://www.dovepress.com/terms.php
and incorporate the Creative Commons Attribution
- Non Commercial (unported, 3.0) License.
By accessing the work you hereby accept the Terms. Non-commercial uses of the work are permitted
without any further permission from Dove Medical Press Limited, provided the work is properly
attributed. For permission for commercial use of this work, please see paragraphs 4.2 and 5 of our Terms.
© 2024 The Author(s). This work is published and licensed by Dove Medical Press Limited. The
full terms of this license are available at https://www.dovepress.com/terms.php
and incorporate the Creative Commons Attribution
- Non Commercial (unported, 3.0) License.
By accessing the work you hereby accept the Terms. Non-commercial uses of the work are permitted
without any further permission from Dove Medical Press Limited, provided the work is properly
attributed. For permission for commercial use of this work, please see paragraphs 4.2 and 5 of our Terms.